


ISSN: 0973-7510
E-ISSN: 2581-690X
Hospitalized patients on mechanical ventilation are at high-risk of developing ventilator-associated pneumonia (VAP), making early and accurate diagnosis essential for the best possible treatment outcomes. This review examined various laboratory techniques, such as aerobic cultures, Gram’s stain, and molecular techniques, to assess how well they diagnose VAP. We have done search strategies using Google Scholar, Medline Complete, and PubMed. Extensive statistical tools were utilized to examine studies and evaluate the diagnostic accuracy of laboratory results. Multiplex PCR was superior to Gram’s stain and culture methods in terms of sensitivity (92%) and specificity (86%). On the other hand, Gram’s stain showed the highest specificity (78.9%) and the lowest sensitivity (74.6%). The results of semi-quantitative, quantitative, enrichment culture showed a lower specificity (75.97%) but a moderate sensitivity (78.5%). The most accurate diagnostic approach for VAP, according to a meta-analysis, was multiplex PCR-based testing, closely followed by culture methods. Beyond separate tests, multiplex PCR, culture, and Gram’s stain combination increased sensitivity. Prompt and precise VAP diagnosis is essential for efficient treatment. With possible improvements through combination diagnostic techniques, multiplex PCR remains the most accurate diagnostic tool. However, more investigation is necessary to improve and certify VAP diagnostic instruments.
Ventilator-associated Pneumonia, Pathogens, Multiplex PCR, Gram’s Stain, Microbiological Culture
Ventilator-associated pneumonia (VAP), a major healthcare-associated infection, is defined as pneumonia where the patient is on mechanical ventilation for more than two consecutive days on the date of the event, with a day of ventilator placement being Day 1 and the ventilator was in place on the date of the event or the day before.1 A ventilator is a machine that breathes for patients and has a tube that passes through the mouth and windpipe of patients. Sometimes the ventilator tube carries microbial pathogens which infects the patient’s lungs, leading to VAP.2 The infection is acquired in Intensive Care Units (ICUs) which remain the principal source of infection impacting roughly 5-40% of patients who undergo invasive mechanical ventilation for longer than 2 days and are identified as having VAP. However, the percentage varies widely based on factors such as the country, type of ICU, and the criteria used to identify VAP. North America reported 1-2.5 cases/1000 ventilator-days, European Union-VAP/Community Acquired Pneumonia study (EU-VAP/CAP) reported 18.3 cases/1000 days of ventilator VAP episodes, whereas lower middle-income countries reported 18.5 cases/1000 ventilator-days.3 One study reported that the incidence rate of ventilator-associated pneumonia (VAP) in India was 12.7 per 1000 ventilator-associated pneumonia days.4 The incidence rate of VAP ranges from 2.13 to 116 per thousand ventilator days, and the prevalence varies between countries and healthcare settings. Remarkably, in a neurosurgical ICU, India had the highest VAP prevalence rate (22.2%), whereas in a Palliative Care ICU, South Korea had the lowest frequency. Variable rates of VAP incidence were also seen in other nations, including Egypt (19.2%), Bangladesh (21.4%), Thailand (18.5% to 20.2%), Nepal (15.6%), Lebanon (16.7%), Qatar (17.6%), and Egypt (19.2%). Elements like the kind of healthcare facility, patient demographics, infection prevention strategies, and trends in resistance to antibiotics contribute to the variability in VAP prevalence across different settings.5
There is a significant correlation between VAP and mortality. Respiratory failure, sepsis, and multiple organ failure are among the consequences that may arise from it. The severity of the infection and the existence of comorbidities are two factors that can affect the mortality rate among patients with VAP, which can range from 13% to 50% and early diagnosis is still a challenge due to the lack of advanced diagnostic methods.3,5,6 VAP results in a considerable financial burden, and a recent cost analysis in the USA calculated that VAP carries an expense of $40,144 per case.3 A VAP infection is predicted to have an attributable cost of USD $5200 in India, with a 95% confidence interval spanning from $3245 to $7152. Age, APACHE II score, length of ICU stays, length of hospital stays, and amount of time spent on mechanical ventilation prior to the commencement of VAP are some of the characteristics that are taken into account in this assessment. The main causes of the expense include noticeably higher overall prescription costs, rising drug prices, and longer ICU stays.7
Long-term ICU stays, hospital stays, and mechanical ventilation are signs of VAP, which carries a significant morbidity and cost burden on healthcare systems. In comparison to patients without VAP, patients with VAP had noticeably longer median ventilation durations (11.99 days vs. 4.92 days), ICU stays (19.35 days vs. 7.35 days), and hospital stays (35.5 days vs. 20 days). These results highlight how VAP affects patient recovery, the use of medical resources, and related expenses.8 The clinical signs of VAP include purulent tracheal discharge, fever, respiratory distress, and the presence of microorganism in lower respiratory tract along with white blood cells in tracheal aspirate as well as radiological findings of pneumonia. The risk factors for VAP include patient characteristics, extended periods of mechanical ventilation and hospitalization, impaired consciousness, burns, pre-existing health conditions, prior use of antibiotics, invasive procedures, and genetic variations.9 VAP can be diagnosed using Clinical Evaluation, i.e. Assessment of clinical symptoms, including increasing oxygenation, purulent respiratory secretions, fever, and leukocytosis. Evaluation of risk factors, including the existence of comorbidities, chronic use of mechanical ventilation, and history of antibiotic usage. Imaging method such as chest X-ray is used to detect lung consolidation or infiltrates. Computed Tomography (CT) scan offers more precise lung pictures and can assist in distinguishing between pneumonia and other lung disorders. Laboratory methodology such as blood culture is utilized to detect the existence of germs in the blood, which indicates a systemic illness. Sputum culture, and gathering and examining respiratory secretions, determine the etiological agent. Bronchoalveolar Lavage (BAL) is a bronchoscopy technique which involves injecting a tiny amount of sterile saline into the lungs, which is subsequently collected for examination. This aids in determining the precise pathogens responsible for the infection. In quantitative culture, the presence of infection is assessed using a threshold of bacterial colony-forming units (CFUs). A greater chance of VAP is indicated by a higher CFU count.7 Prompt and precise diagnostic testing method for VAP is highly essential in monitoring the presence of various microorganisms and comprehending the causative factors. Once the diagnosis is appropriate, treatment regime can be followed based on the type of bacteria, viruses, or fungal infections. In a typical clinical microbiology laboratory, the majority of the specimens are cultured in an aerobic environment. However, routine investigation for various pathogens like fungi, anaerobes, or rickettsial pathogens is not performed unless there is a specific request or a clinical indication. Identification of organisms primarily relies on morphological and biochemical characteristics, which may reduce specificity. Moreover, only a small portion of organisms in a multi-pathogen sample can be cultured successfully due to factors such as fastidious growth requirements, non-viable organisms, or the presence of other microorganisms producing bacteriocin, which may inhibit the growth of pathogenic organisms. These factors pose a challenge to achieve accurate diagnosis and treatment of infections.10 Apart from diagnosis of bacterial and viral infections, fungal diagnosis is challenging due to non-specific clinical features and limited sensitivity of diagnostic methods, such as microscopy, histological examination, and cultures of materials from at-risk patients. Early diagnosis is not achieved, and it contributes significantly to the high mortality associated with invasive fungal infections.11 A microscopic inspection may also reveal whether the smear indicates infection. If a biological sample has over 25 neutrophils and fewer than 10 epithelial cells per 10 low-power fields, it indicates an ongoing infection. However, there is ongoing debate regarding the use of Gram’s staining in diagnosing VAP and its recommendation for empirical antibiotic therapy. This diagnostic method is considered outdated and has a high negative predictive value (NPV), indicating that a negative Gram’s stain result makes VAP unlikely.12 Patients with pneumonia must be identified early to enhance population outcomes. If identification of the organisms along with their drug resistance pattern can be known, the treatment would even be better. We will not end up treating the patient with some pathogens which might become antibiotic resistant. VAP misdiagnosis or delayed diagnosis can have adverse consequences such as ineffective therapy, elevated antibiotic resistance, and extended hospital admissions. Firstly, if the infection is not treated promptly because of a delayed diagnosis, it may worsen the patient’s condition and increase their risk of morbidity and death. Secondly, since various infections require different antibiotics to be effectively treated, a misdiagnosis may lead to the incorrect use of antibiotics. This can make patient care more difficult by increasing the risk of treatment failure and development of antibiotic resistance. In addition to raising healthcare expenses, prolonged hospital stays brought on by delayed diagnosis, expose patients to new hazards such as hospital-acquired infections. In the end, a delayed or inaccurate diagnosis of VAP might exacerbate the condition’s already high morbidity and mortality, which will negatively impact patient outcomes.13
As genetic causes of drug resistance are discovered, nucleic acid-based tests are being developed to overcome these flaws associated with conventional method (microbiological) of diagnosis. Just because a resistance gene is present doesn’t mean it is being expressed and causing resistance. However, if the gene is not present, then resistance through that genetic mechanism is not possible: methicillin resistance, for example, is mediated by the mecA gene. The heterogeneous manifestation of methicillin resistance is a distinguishing trait. As a result, methicillin-resistant bacteria may appear deceptively sensitive to some -lactam antibiotics in vitro when traditional phenotypic susceptibility testing is employed to detect resistance. Hence, direct PCR identification of the mecA gene is preferable. MecA PCR has received widespread support as the most reliable method of diagnosing methicillin-resistant Staphylococcus aureus (MRSA) due to its high detection sensitivity and specificity.14 Sometimes false negative PCR reports can skip the treatment of pneumonia patients, so the correlation with culture needs to be done before the treatment of patients. Identification of drug resistance in microorganisms typically requires additional testing, such as drug susceptibility testing, which involves exposing the microorganisms to different antibiotics and determining which ones are effective in inhibiting their growth.
Multiplex PCR is used to detect and identify multiple microorganisms in a single sample. It has the advantage of being able to identify a long list of organisms simultaneously in a single test, which can save time and resources compared to traditional culture-based methods. In addition, multiplex PCR can also identify multiple drug resistance genes in these organisms simultaneously. This means that the test can detect which antibiotics are ineffective against the microorganisms in the sample, which can help guide treatment decisions and prevent the use of ineffective antibiotics that can contribute to the development of antibiotic resistance. Overall, multiplex PCR is a powerful diagnostic tool that can rapidly and accurately identify multiple microorganisms and drug resistance patterns in a single test, making it a valuable tool for clinicians and researchers. The FilmArray Pneumonia panel (PN panel) by BioFire Diagnostics, LLC is a multiplex PCR-based in vitro diagnostic test that analyzes sputum, endotracheal aspirates, bronchoalveolar lavage (BAL), and mini-BAL samples. It can identify bacteria, viruses, and antimicrobial resistance genetic markers in approximately 75 minutes, with only 5 minutes of hands-on time. In a study, the PN panel has demonstrated qualitative detection of viruses, atypical bacteria, and antibiotic resistance genetic markers. Additionally, it provides a semi-quantitative identification of 15 other bacterial targets associated with respiratory infections, totalling 33 panel targets.15
The study aims to do a systematic review and meta-analysis to assess the diagnostic performance of gram stain, multiplex PCR, and microbiological culture techniques in the diagnosis of ventilator-associated pneumonia (VAP).
Rationale
The current literature highlights the significant variability in diagnostic performance and accuracy across a range of laboratory techniques, including more modern technologies like multiplex PCR testing and more established techniques like Gram’s staining and aerobic culture. These variations point to the necessity for a thorough synthesis of evidence through systematic review and meta-analysis in order to evaluate the overall diagnostic performance of these techniques and determine the factors that influence them.
Review question
The main question addressed in this systematic review is “What is the usefulness of various laboratory techniques in diagnosing the VAP?”
Objective of study
There is lack of studies comparing the laboratory techniques and their utility in diagnosing VAP. Hence, the objective of this review is to assess the effectiveness of Gram’s stain, aerobic culture methods, and molecular techniques for diagnosing VAP.
By following the guidelines of the Preferred Reporting Items for Systematic Reviews and Meta-Analysis of Diagnostic Test Accuracy (PRISMA-DTA), we performed a systematic review and meta-analysis.16 We evaluated the quality of the studies and the likelihood of bias by following the guidelines outlined in The Cochrane Handbook for Systematic Reviews of Interventions.17 We also used Review Manager version 5.4.1 software to design protocols and utilize the tools to create and analyse summary receiving operating curves (SROC) and forest plots for systematic and meta-analysis reviews. I crafted a protocol, and subsequently, the developed systematic review protocol was officially registered with the International Prospective Register of Systematic Reviews, bearing registration number CRD42024516205.
Eligibility criteria
To address our review questions, cross-sectional studies were searched in PubMed and Google Scholar (154 studies). We excluded the common study in the current review article. Studies that satisfied the following requirements were included: Between 30 to 1576 VAP patients were included in the study group, and multiplex PCR testing was used as the reference standard. They also used aerobic culture and Gram’s staining, either one or both of the assays. These tests were used in a lab setting to identify drug resistance or identify infectious agents linked to VAP. The previous studies which did not report on drug resistance were also included in this review. We also incorporated studies that examined the effectiveness of chest CT (computed tomography) images in conjunction with VAP, as well as those that included a clear epidemiological history, well-defined clinical features, and accompanying laboratory techniques. Rapid detection of bacterial pathogens through multiplex PCR and evaluation of the test capacity for rapid diagnosis of VAP, identification of bacteria, fungi as well as resistance marker simultaneously (for the detection of VAP) were performed to minimize the time for treating the patients.18 In patients with pneumonia, multiplex PCR guidance is relevant for empirical antibiotic therapy. Studies have compared the microbiota of control groups with those of pneumonia patients, characterized microbiota from ICU patient’s ETA (Endotracheal aspirate) samples through multiplex PCR and molecular profiling, and compared the sensitivity and specificity of BAL and ETA samples using molecular biology and conventional culture methods.19 We included studies between 2000 to 2022. Animal studies, and in vitro-based studies were excluded.
Inclusion criteria
- Population: Studies with patients diagnosed with VAP were considered in the inclusion criteria. Age, gender, or comorbidities were not grounds for restriction.
- Diagnostic Tests: Research evaluating laboratory methods for the diagnosis of VAP, such as aerobic culture, Gram’s staining, and multiplex PCR testing, among others, were acceptable for inclusion.
- Sample Size: Research involving between 30 to 1576 VAP patients were taken into account.
- Publication Type: Conference proceedings, cross-sectional studies, and peer-reviewed journal papers were all acceptable for inclusion.
- Language: English-language studies
Exclusion criteria
- Animal Studies: Research that only used animal models of VAP was disqualified.
- Publication Date: To guarantee the inclusion of up-to-date data, studies published prior to January 1, 2000, were omitted.
- Inadequate Data: Research lacking essential data for the meta-analysis, such as inadequate laboratory procedure descriptions or missing outcome measures, were excluded.
- Duplicate Publications: To prevent results from being repeated, research that reported the same data twice were removed.
Information sources and search strategies
The following databases were searched for studies: PubMed and Google Scholar. The databases were searched using predefined keywords: PCR, culture, ventilator-associated pneumonia, fungal culture, Gram’s stain, fungal infection, and their synonyms. Finally, out of 154 studies, we included 23 studies for a systematic and meta-analysis review.
Study selection and data extraction
The following data were extracted from selected studies.
- Year of publication & study authors.
Design of study
- Prevalence of VAP
- Sensitivity and specificity of lab techniques
- Age group
- Study population (ICU/WARD/etc.)
- High-risk patients (Immunocompromised patients)
Selection Criteria
- Title and Abstract Review:
- All found citations were first filtered according to their abstracts and titles.
- Every citation was evaluated by two impartial reviewers to ascertain its applicability to the study issue.
At this point, references that were regarded as irrelevant or obviously not satisfying the inclusion requirements were eliminated.
- Full-text publications were acquired in order to assess their suitability for inclusion in the meta-analysis in more detail.
- Data Extraction and Quality Assessment: Using a standardized data extraction form, data was extracted from eligible studies after the full-text assessment.
- Relevant data was extracted, such as study characteristics, diagnostic tests used, outcomes assessed, and important findings.
- Quality assessment was usually carried out using established tools specific to the study designs included in the meta-analysis (e.g., Cochrane risk of bias tool for randomized controlled trials, i.e. QUADAS-2 tool), in order to assess the methodological quality and risk of bias of the included studies.
- Synthesis of Results: Ultimately, relevant statistical techniques, including meta-analysis, were employed to combine data from qualifying research.
- To investigate heterogeneity and evaluate the robustness of the results, subgroup analysis and sensitivity analyses were performed.
- Reporting: In compliance with PRISMA (Preferred Reporting Items for Systematic Reviews and Meta-Analyses) recommendations, a clear report was provided on the screening procedure, including the number of citations screened, evaluated at the full-text level, and included in the meta-analysis.
- Any modifications to the scheduled screening procedure were explained and documented.
Data gathered from every study
- Study Identification: Journal, Year of Publication, country over their study performed, Authors, Title.
- Research Design: Research design (e.g., cross-sectional, case-control, observational, randomized controlled trial, cohort research).
- Population parameters include age and gender, as well as clinical details such comorbidities and sickness severity, as well as inclusion and exclusion criteria.
- Intervention/Exposure: Describes the diagnostic techniques or interventions that were assessed for the study (e.g., culture, Gram’s staining, multiplex PCR testing).
- Comparison Group: Specificity of the control arm, or comparison group (VAP versus Non-VAP cohort).
- Outcome Measures: The study’s primary and secondary outcomes were evaluated (sensitivity, specificity, positive predictive value, negative predictive value, and other diagnostic accuracy metrics).
- Outcomes: Quantitative information about the number of true positives, true negatives, false positives, and false negatives associated with the outcome measures.
- Quality Assessment: Using the QUADAS-2 (The Quality Assessment of Diagnostic Accuracy Studies version 2) tool, and evaluating the study’s quality and bias risk.
Standardization of data extraction and handling discrepancies
Various steps were taken to guarantee uniformity in the data extraction procedure for the VAP meta-analysis study and to resolve any inconsistencies:
- Creation of a Standardized Data Extraction Form: To methodically gather pertinent data from each included study, a standardized form was created. Important elements such as the study design, demographics, diagnostic methods, findings, and standards for evaluating quality were all included in this form.
- Reviewer Training: To ensure that they could use the standardized data extraction form with efficiency, all reviewers who were part of the data extraction process received training. The goal of this training was to guarantee consistency in data extraction techniques and reduce variances amongst reviewers.
- Consensus Meetings: Reviewers had regular consensus meetings to discuss any disagreements that surfaced during the data extraction process. In order to guarantee proper recordkeeping, these meetings comprised a careful review of the extracted data, a discussion of any discrepancies found, and group decision-making.
- Senior Researchers’ Consultation: Senior researchers or the corresponding author were consulted when reviewers were unable to come to a consensus. These eminent academics offered advice to settle disputes and enable well-informed judgments based on the collected data by drawing on their knowledge and experience.
- Documentation of Discrepancies and Their Resolutions: A rigorous documentation approach was put in place to document each and every discrepancy that arose during the data extraction process. The nature of conflicts, the reasons for differing opinions, and the final resolution—whether reached by reviewers’ agreement or by consulting with more seasoned researchers—were all covered in this documentation.
- Quality Assurance Inspections: To guarantee the precision and thoroughness of the collected data, routine quality control inspections were carried out. A sample of the retrieved data was thoroughly examined as part of these tests to ensure accuracy and spot any potential anomalies or errors.
Reviewers involved
- Harendra K. Thakur is the first author who oversaw the whole meta-analysis procedure. Participated in the design of the study, gathering, analyzing, interpreting, and preparing the manuscript.
- Bansidhar Tarai: Co-author and collaborator in charge of helping with data analysis, study design, literature search, and paper preparation.
- Additional co-authors Adahana Bhargava, Sonu K. Agarwal, Pankaj Soni, Sudhakar Kancharla, Prachetha Kolli, and Gowtham Mandadapu have helped with data extraction, quality evaluation, and result interpretation, among other elements of the work.
- Manoj Kumar Jena: Corresponding author in charge of the study management, intellectual contribution, and guaranteeing the study’s integrity and correctness.
Discrepancy Resolution
- Consensus Building: The reviewers held discussions to come to a consensus when differences surfaced throughout the screening process, such as conflicts over study eligibility based on title/abstract or full-text evaluation.
- Third-Party Arbitration: The corresponding author or another senior researcher stepped in to render an unbiased decision when the primary reviewers were unable to come to an agreement. After examining the divergent evaluations and taking into account the justifications offered by each reviewer, the arbitrator reached a definitive determination about whether or not to include the study.
- Discrepancy Documentation: To provide transparency and traceability, any discrepancies found during the review process were methodically documented. The nature of disagreements, the justification for divergent assessments, and the ultimate settlement achieved by consensus or third-party arbitration were all documented.
Assessment of studies methodological quality
The QUADAS-2 (The Quality Assessment of Diagnostic Accuracy Studies version 2) tool, which was cited in Whiting et al.,20 served as a framework for our systematic review, which we used to assess the methodological robustness of the papers we included in our analysis. Patient selection, index test, reference standard, and flow and timing are the four basic domains around which this tool is organized. These categories each reflect important facets of research design and implementation. We carefully examined every domain to find any possible causes of bias, focusing especially on application problems in the first three areas. After putting the level of bias through a thorough evaluation procedure, we classified it as “low,” “high,” or “unclear.” We were able to perform a thorough review of the included studies’ quality by carrying out such an extensive assessment, which strengthened the validity and credibility of systematic reviews.
Statistical analysis and data synthesis
We collected Positive Predictive Value (PPV), Negative Predictive Value (NPV), Sensitivity, and Specificity from each study. We also created forest plots. We generated two-by-two tables for each research studies that recorded the numbers of true positives (TP), true negatives (TN), false positives (FP), and false negatives (FN). Only sensitivity and specificity estimates were supplied in certain instances, therefore we used the published data to determine the values needed for the two-by-two table in such situations. The sensitivity and specificity of the index tests were then shown on forest plots created using these tables. The reference approach was thought to have perfect specificity and sensitivity.
The Review Manager (RevMan) software, version 5.3, created by the Cochrane Collaboration in Copenhagen, Denmark, received all the gathered data. This programme was used to construct forest plots that included a 95% confidence interval (CI) to show the accuracy of the sensitivity and specificity values for each investigation studies. Studies had to meet the following requirements in order to be included in the meta-analysis: a sample size of at least 20, the availability of sensitivity and specificity data for both the index and control groups, and the study of the control group. The bivariate model and the hierarchical approach were the two suggested random-effects hierarchical methods that we employed. Using the summary receiver operating characteristic (HSROC) model, the meta-analysis was conducted. The bivariate model’s main objective is to estimate a summary point’s summary sensitivity and specificity.
Test sensitivity by time since onset of symptoms
To assess test sensitivity by time since onset of symptoms for VAP infection, we stratified data based on the number of days patients spent in the intensive care unit (ICU). This allowed us to analyze the varying sensitivity of the diagnostic test over different durations of ICU stay.
Ethical considerations
We recognize the significance of ethical considerations in research when performing our meta-analysis on the diagnosis of VAP. However, ethical clearance was not sought for this specific study because the main focus of the work was the synthesis and analysis of data from previously published studies; neither primary data collection or direct interaction with human participants was involved.
Study inclusion
The outcomes of the search and selection process are displayed in Figure 1, which depicts the PRISMA flow chart. A total of 154 articles were identified through a PubMed search and other sources, of which 83 articles underwent full-text screening. Subsequently, 52 articles were deemed suitable for systematic review, and 38 studies were included, among these, 30 articles met the inclusion criteria for reporting on the results of Gram’s stain (10 studies), chest X-ray (2 studies), quantitative/semi-quantitative/enrichment culture (6 studies), and multiplex PCR (12 studies). Out of 30 articles, 15 articles that don’t have reference standard was excluded and rest 23 studies were included in the meta-analysis.
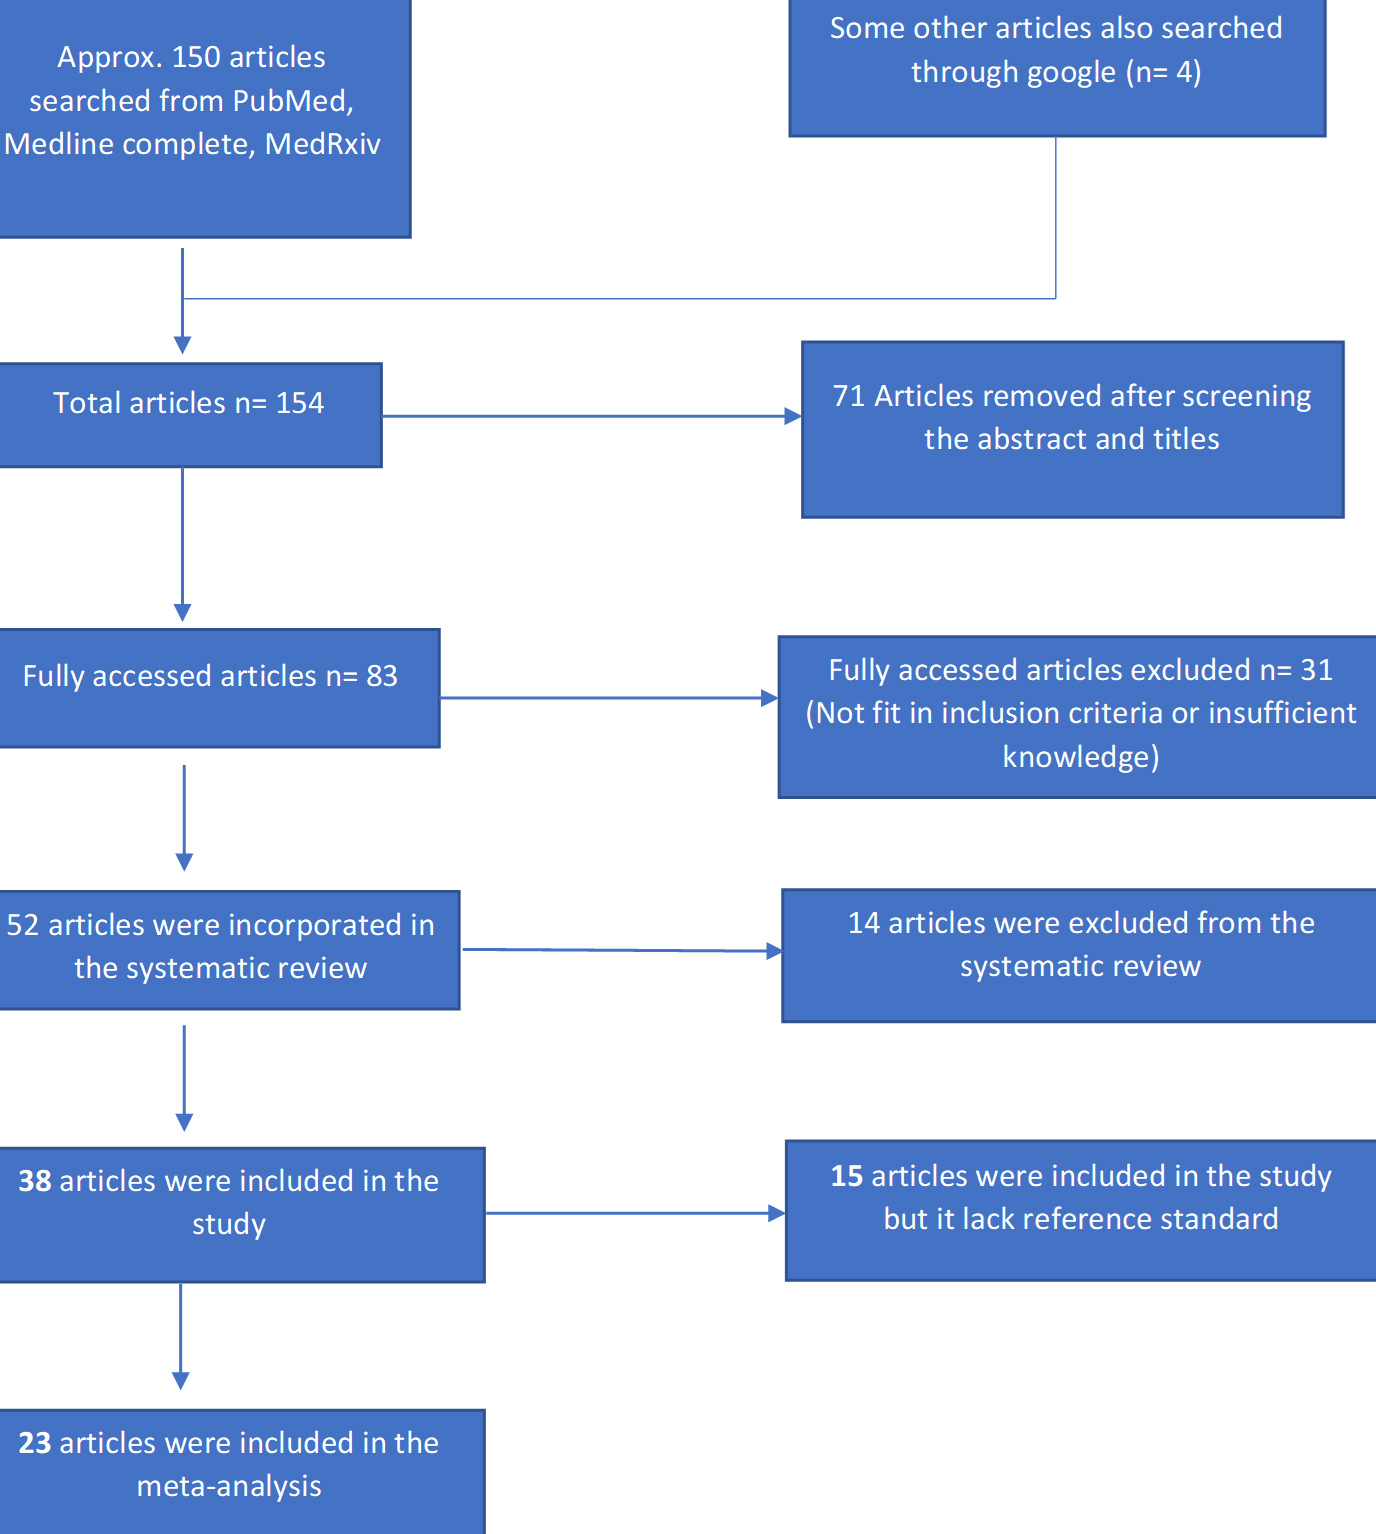
Figure 1. PRISMA flow chart for the search and selection of various research articles
Study characteristics
Table 1 presents the overall features of the articles that were included. The review incorporated all 38 published articles, which were available from 2001 through 2022. Most of the published articles during the last ten years are included in this review. Twelve articles included in the review had a retrospective design, 12 articles had a prospective design, 11 articles had a cross-sectional, and 9 articles had a case-control design. Thirty articles included in this study compared a group of well-defined VAP cases with a group of healthy control or non-VAP patients. Six studies were conducted in France, 5 in the UK, 2 in the US, 1 in India, 1 in Iran, 2 in Greece, 2 in Spain, 2 in Belgium, and 2 in Italy. China, Bangladesh, Austria, Korea, Portugal, and Ireland each conducted 1 study. The majority of articles (23 in total) that were included in the review explicitly stated the use of multiplex PCR tests as the reference standard. Apart from reference standard, test performed through microbiological culture technique was used in 22 articles, 3 articles used Gram’s stain test, 1 article used MALDI-TOF and VITEK for the conformation of pathogens and their resistant pattern. Galactomannan tests were used in 1 article for the identification of fungal infections. The majority of the microbiological or molecular assay test kits used were commercially available, with only 2 being developed in-house. There were 17 studies conducted that described the drug resistance patterns in patients with VAP.
Table (1):
The general characteristics of the studies included in the review
Study |
Country |
Test performed (Index test) |
In-house/Commercial |
Reference standard |
Control group |
|---|---|---|---|---|---|
Pickens & co.21 |
Chicago, US |
Quantitative culture, Gram’s stain |
Commercial |
Multiplex PCR |
Non-VAP group |
HOU & co.22 |
China |
PCR/ESI-MS, quantitative culture |
Commercial |
Multiplex PCR |
No control |
Nusrat & co.23 |
Bangladesh |
CDST for resistant & Qualitative culture for identification |
Commercial |
Multiplex PCR |
No control |
Morris & co.24 |
UK |
Quantitative culture |
Commercial |
Real-time 16S PCR assay 2 (Multiplex PCR) |
Non-VAP group |
Piffer-Smadja & co.25 |
France |
Conventional microbiological methods |
Commercial |
Multiplex PCR |
No control |
van der Schalk & co.26 |
Belgium |
GeneXpert, quantitative culture, enrichment culture, and O-antigen acetylase gene-based quantitative PCR, semi-quantitative culture |
In-house as well as commercial |
Multiplex PCR |
Non-VAP group |
Luyt & co.18 |
France |
conventional cultures |
Commercial |
Multiplex PCR (Unyvero P55 and HPN cartridges (multiplex PCR),) |
No control |
Bianco & co. 27 |
Southern Italy |
Rep-PCR, Gram’s stain, Vitek 2 system (bioMérieux, France) to evaluate antibiotic susceptibility and by MALDI-TOF MS mass spectrometry (bioMèrieux, France), Microbiological culture |
Commercial |
Multiplex PCR |
No control |
Clavel & co.19 |
France |
Conventional Culture |
Commercial |
Multiplex PCR |
No control |
Coppens & co.28 |
Belgium |
qPCR, GeneXpert, Semi-quantitative culture, Quantitative culture, and enrichment culture |
Commercial as well as In House kit used. |
Multiplex PCR |
No control |
Enne & co.29 |
UK |
BioFire FilmArray Pneumonia Panel(bioMérieux) and Unyvero Pneumonia Panel (Curetis) |
No control |
||
Hughes & co.30 |
UK |
qPCR, Genexpert, Microbiological culture, like blood culture, sputum culture and BAL culture, as well as pneumococcal from urine and Legionella antigens and respiratory viral panels |
Commercial |
Multiplex PCR |
A control group of influenza A or B-positive |
Karolyi & co.31 |
Austria |
Microbiological culture |
Commercial |
Multiplex PCR (BioFire® Pneumonia Panel) |
No control |
Divan Khosroshahi & co.32 |
Iran |
Culture method on specific buffered charcoal-yeast extract medium (BCYE) |
Commercial |
Multiplex PCR (real-time PCR analysis of 16s rRNA gene) |
No control |
Krishnamurthy & co.33 |
India |
Quantitative method, standard biochemical tests, Culture methods (disc approximation method and double disc combination method) |
Commercial |
Multiplex PCR (Genotyping by conventional PCR) |
No control |
Loughlin & co. 34 |
UK |
+ve histology or microscopy, +ve BAL fluid culture, galactomannan, (1→3) β-d-glucan (BDG), fungal culture |
Commercial |
Multiplex PCR |
Patients without Aspergillus infection |
Nolan & co.35 |
UK |
conventional culture |
Commercial |
Multiplex PCR and sequencing |
Healthy donors or non-VAP patients |
Monard & co. 36 |
France |
Conventional Culture |
Commercial |
Multiplex PCR (BioFire® FilmArray® Pneumonia Panel) |
Non-VAP group |
Nowak & co.37 |
Greece, Italy, and Spain |
conventional culture |
Multiplex PCR and sequencing |
Without Acinetobacter baumannii recovered from patients |
|
Razazi & co. 38 |
France |
Conventional Culture |
Commercial |
Multiplex PCR (BioFire® FilmArray® Pneumonia Panel) |
Non-VAP group |
Rouze & co.39 |
France, Spain, Greece, Portugal, Ireland |
Microbiological culture |
Commercial |
Multiplex PCR |
Influenza positive group and no viral positive group |
Trevino & co.40 |
USA |
Xpert MRSA/SA (Genexpert), Kirby–Bauer disk diffusion, Culture methods |
Commercial |
Multiplex PCR- Molecular typing through multiplex PCR assay [repetitive sequence-based PCR (rep-PCR)] |
Negative saline control & S. aureus-negative group |
Kwon & co.41 |
Korea |
Quantitative Culture, Antimicrobial susceptibility test, |
Commercial |
Quantitative PCR |
No control |
Detailed findings of QUADAS-2 analysis
Quality of included studies
The studies that were included in the analysis were assessed for their quality. The studies that used classical culture, Gram’s stain, and multiplex PCR were summarized in SI-1 (Supplementary information- 1), SI-2, and SI-3, which showed the risk of bias and applicability concerns. The results for each method were presented separately. Most of the studies were cross-sectional and had a low risk of bias, while only a few were case-control studies and had a high risk of bias.
Patient selection domain
Most of the studies (approximately 70%) had a low risk of bias and low concern regarding applicability (about 45%). On the other hand, 45% of the studies showed a high risk of bias, and 10% had an unclear risk of bias. About 20% of the studies had high concerns regarding applicability, and 10% had unclear applicability concerns. There were only a few studies with unclear risk of bias and applicability concerns. Ten of the studies were case-control studies, which resulted in a high risk of bias (45%).
Index test domain
Almost half of the studies (around 50%) had a low risk of bias, and more than 65% had low concerns regarding applicability. Meanwhile, more than 30% of the studies showed a high risk of bias, and about 20% had high concerns regarding applicability. There were only a few studies with an unclear risk of bias and applicability concerns. Among the studies, 11 had a low risk of bias because they used pre-specified threshold values and likely followed criteria for interpreting test results, while being blind to certain information. However, nine studies had a high risk of bias either because they did not use pre-specified threshold values or because the index tests were interpreted with knowledge of the reference standards.
Reference standard domain
Around 65% and 75% of studies demonstrated a low likelihood of bias and low applicability concerns, respectively. About 10% of studies indicated a high risk of bias, while another 10% showed high concern regarding applicability. Roughly 20% of studies exhibited unclear bias risks, and the same percentage showed unclear applicability concerns.
Flow and timing domain
Approximately 55% of the studies had a low risk of bias, while around 70% of them had low concerns regarding applicability. About 10% of the studies had both high risk of bias and high concerns regarding applicability. Moreover, 10% of the studies had a high risk of bias, while 30% of them had an unclear risk of bias.
Significance of the forest plot
A popular graphical technique in meta-analyses, the forest plot offers a succinct visual overview of research findings, making it easier to compare studies and evaluate treatment effects. It provides important study details and effect measures in six key columns (Included studies, Intervention group, Control group, Weight, Outcome effect measure in numeric format, Outcome effect measure in graphical presentation), which improve interpretation and conclusion drawing in meta-analysis research.42
Meta-analysis and quantification of the test
First, we considered the performance of Gram’s stain compared with the quantitative or semi-quantitative test as well as multiplex PCR taking as a reference standard. The forest plot in SI-4 (Supplementary information-4) shows the sensitivity and specificity of the Gram’s stain test that was performed to detect VAP across the included studies. According to the forest plot sensitivity, and specificity shows some variation across studies. Sensitivity of Gottesman & co. for sterile cultures,43 Hashimoto & co. (Using a log count ≥6 of quantitative culture as a reference standard for the diagnosis of VAP, the sensitivity of Gram’s stain score ≥4+ was),44 Hashimoto & co. (Using a log count ≥6 of quantitative culture as a reference standard for the diagnosis of VAP, the sensitivity of Gram’s stain score ≥3+ was)44 and Tuon & co.45 showed more variation compared to other studies. SI-4a shows the range of sensitivity of the Gram’s stain estimate from 0.244 to 0.952.46 SI-4b shows the range of specificity of the Gram’s stain estimate from 0.4947 to 1.48 According to Figure 2, Iwata & co. showed sensitivity 0.89, Seligman & co. showed sensitivity 0.68, and Yoshimura & co. showed the range from 0.69 to 0.83.49,50,51
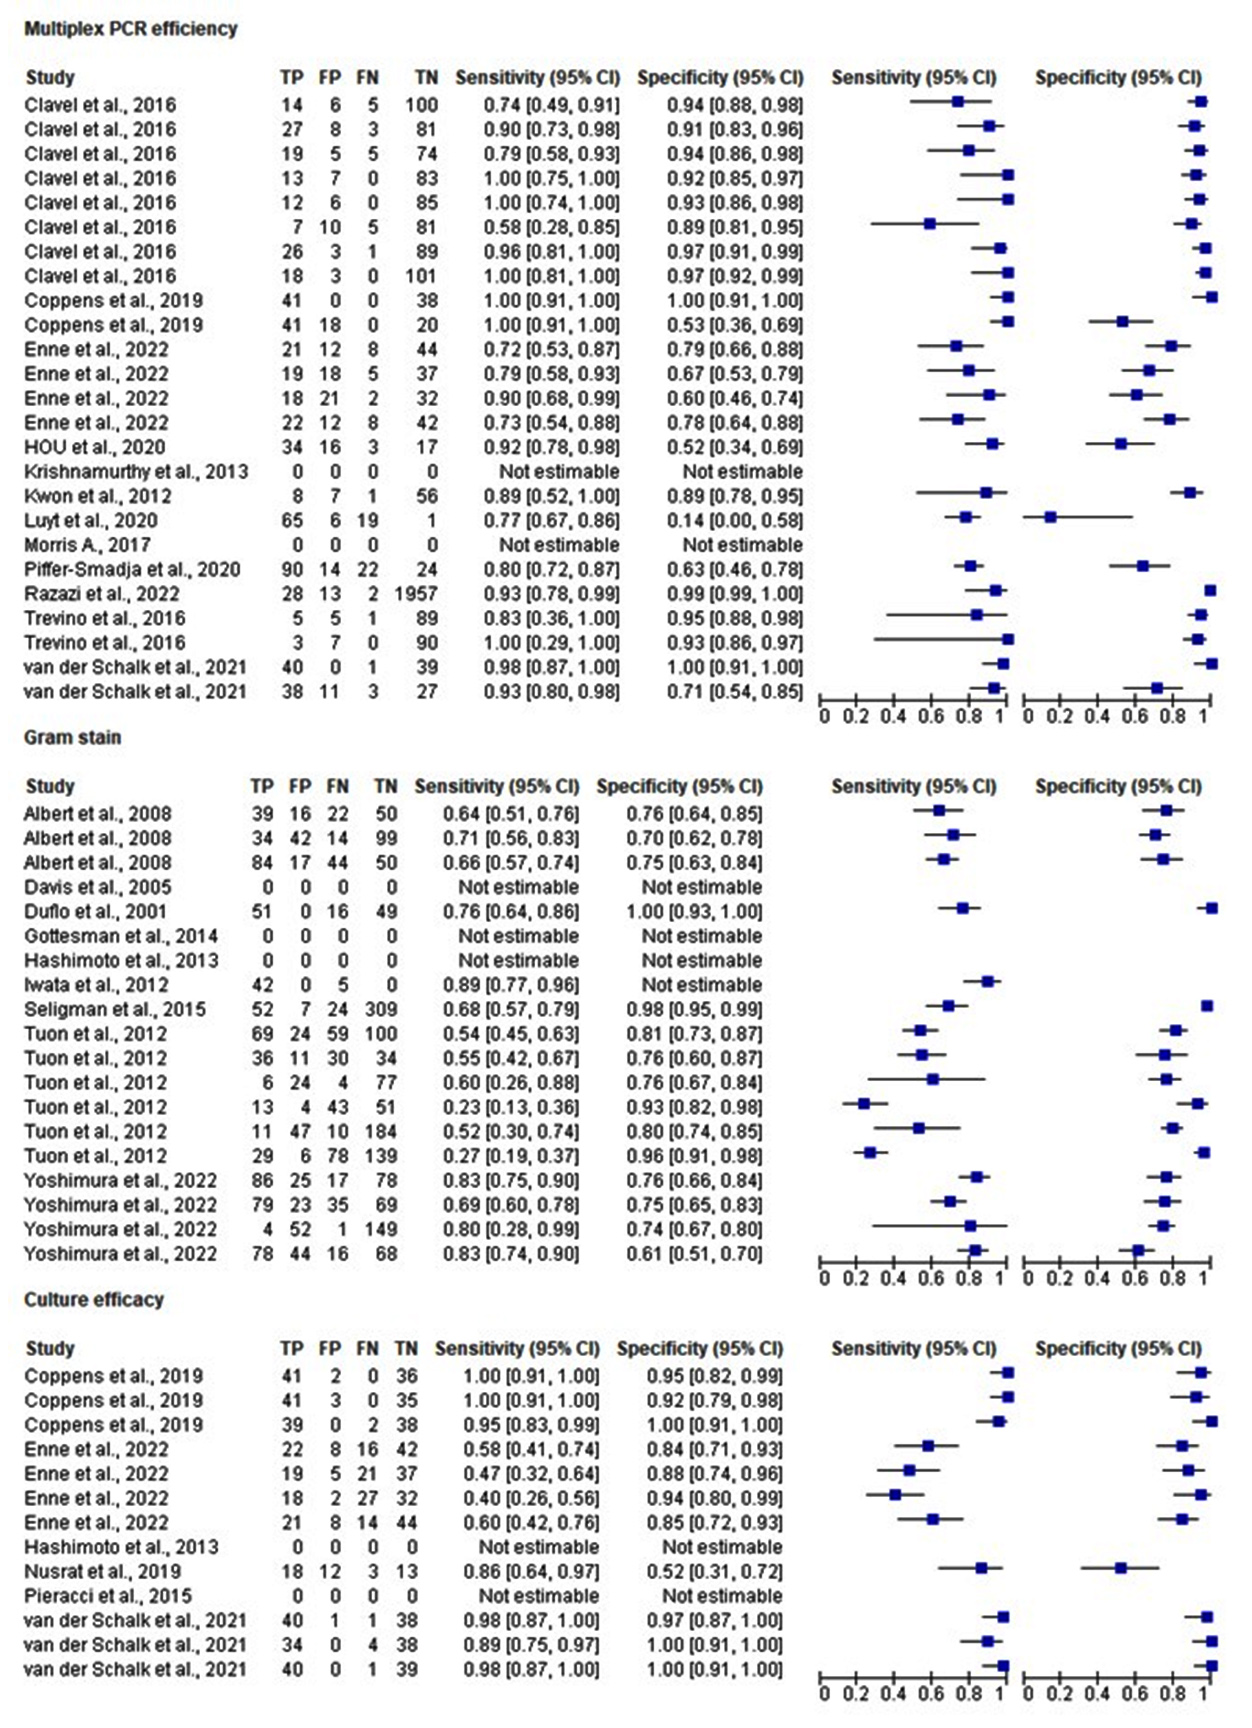
Figure 2. The forest plot showing the efficacy of multiplex PCR, Gram’s stain & culture techniques to diagnose VAP. TP- True Positive, FP- False Positive, FN- False Negative and TN- True Negative
The performance of semi-quantitative/quantitative/enrichment culture compared with Gram’s stain or multiplex PCR taking as a reference standard is shown in the forest plot (SI-5). Three studies44, 29, 52 show the high variation of the sensitivity of semi-quantitative/quantitative/enrichment culture from other studies. The lowest sensitivity is 0.1852 and the highest sensitivity is 1 [28] estimated according to the forest plot SI-5a. More variation of specificity of semi-quantitative/quantitative/enrichment culture showed in 3 studies in SI-5b.44,23,52 The lowest specificity of the semi-quantitative/quantitative/ enrichment culture showed 0.444 and the highest specificity of the semi-quantitative/quantitative/enrichment culture showed 126 in the SI-5b.
For the multiplex PCR tests (n = 12), the sensitivity estimates ranged from 0.5819 to
119, 28, 40 (Figure 2) and specificity ranged from 0.1415 to 1.26, 28 Most of the studies have sensitivities over 0.80 and specificities over 0.88 (Figure 2).
Summary ROC
We conducted an analysis of studies using SROC (summary receiving operating curve) for various tests, including multiplex PCR-based molecular tests, microbiological culture, and Gram’s stain tests. We looked at the results individually in Figures 3a, 3b, and 3c and combined them in Figure 3d. The SROC curve showed the usefulness of the tests, with the best tests appearing in the upper left-hand corner. According to Figure 3d, the multiplex PCR and culture tests had the highest diagnostic accuracy compared to Gram’s stain. The degree of diagnostic precision was assessed based on the proximity of the curve to the upper left corner, which suggests high levels of sensitivity and specificity. As the curve moved closer to the upper left corner, the diagnostic accuracy increased.53
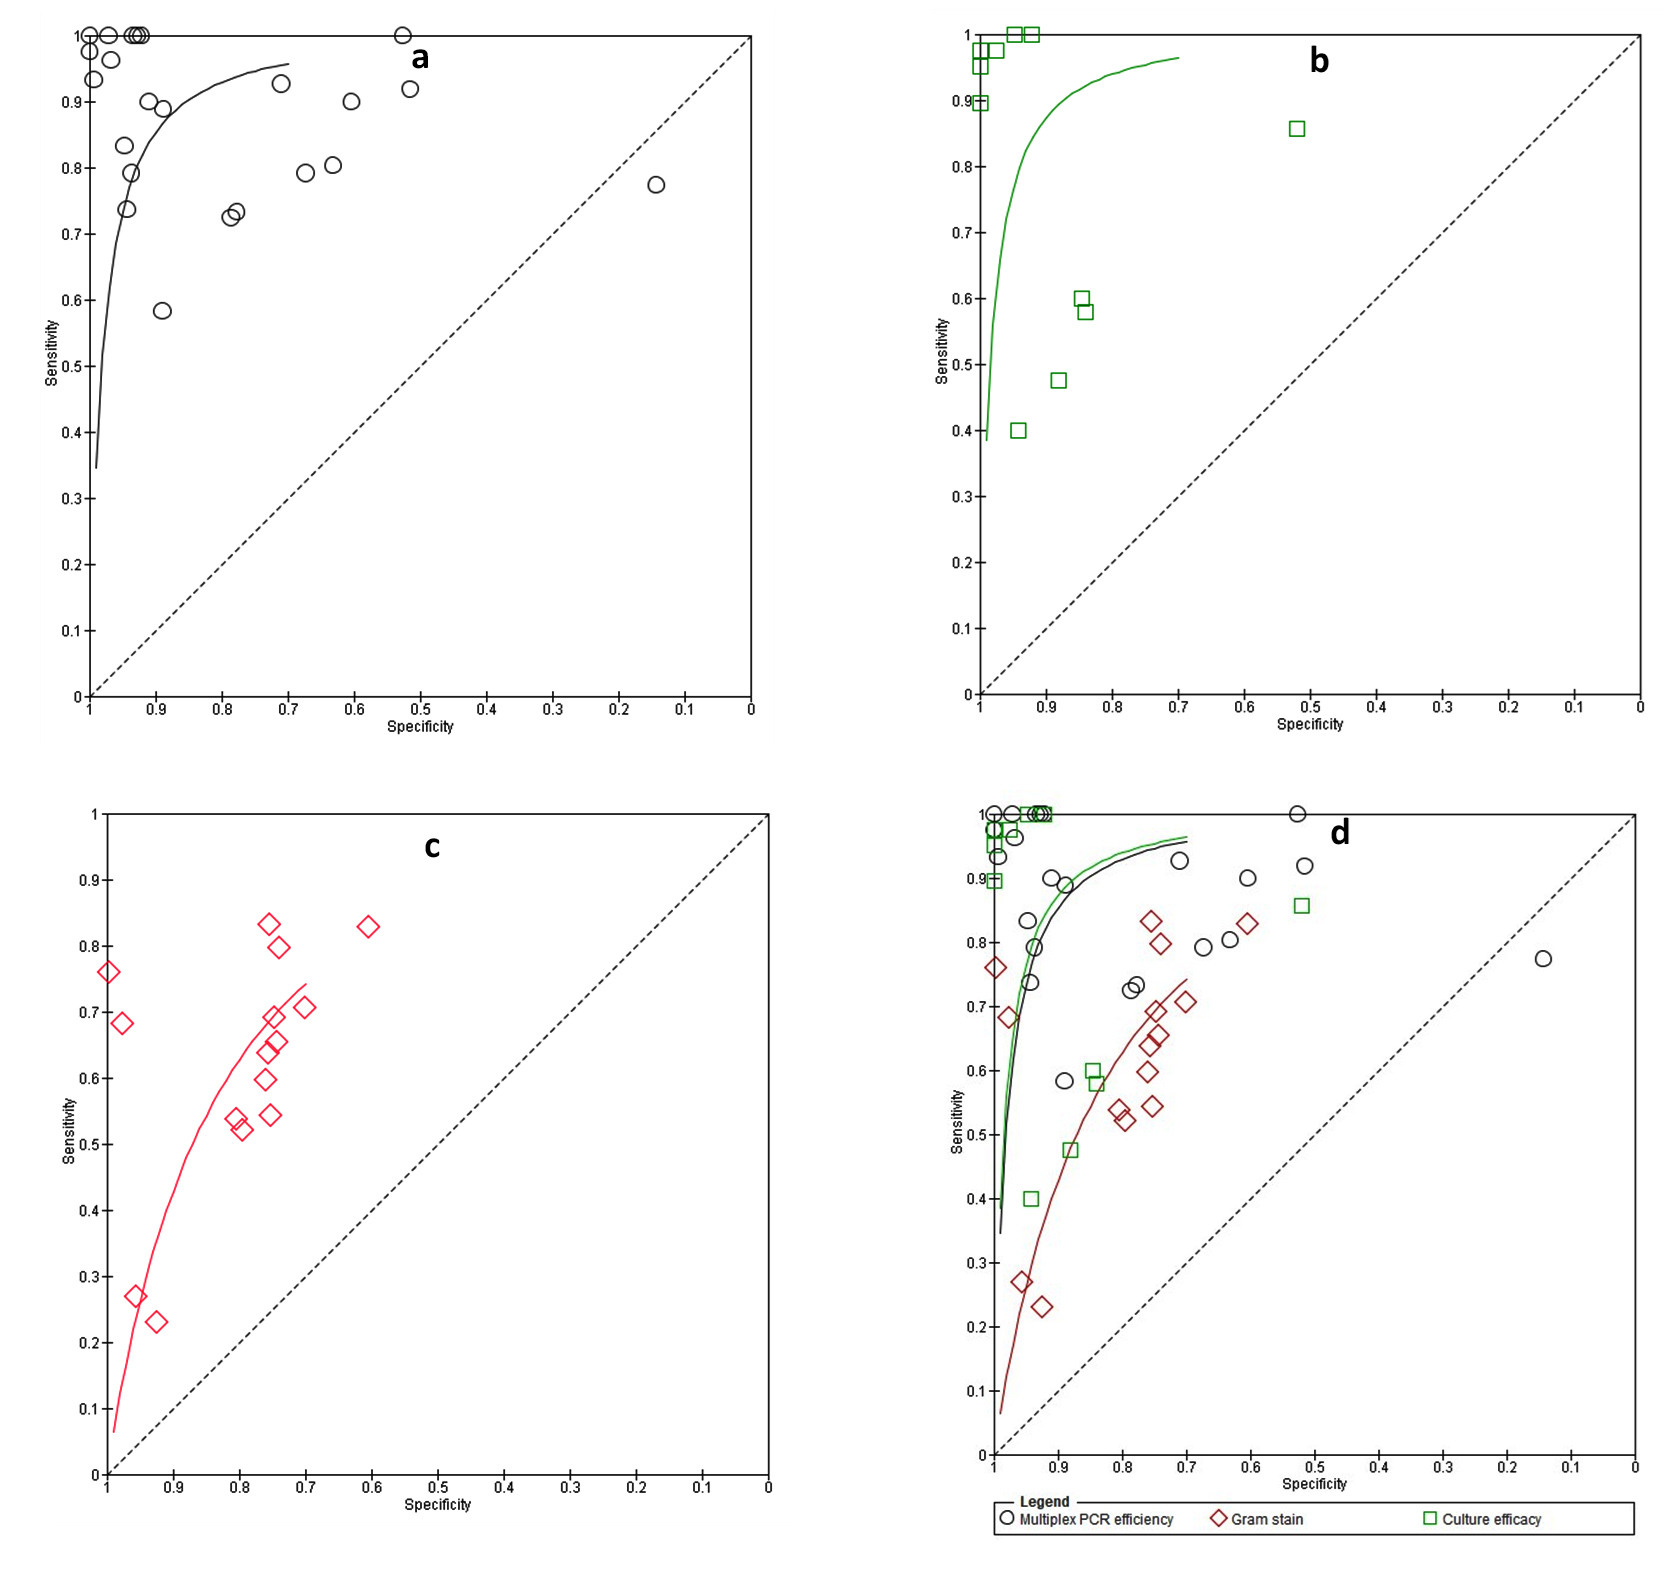
Figure 3. Summary ROC (Receiving operating curve) for a) Multiplex PCR efficiency, b) microbiological culture, c) Gram’s stain, d) Multiple tests analysis (Multiplex PCR, Gram’s stain & culture
The relationship between a diagnostic test’s sensitivity and specificity is displayed by an SROC curve. The likelihood that a test result will indicate a person with a disease is known as sensitivity. The likelihood that a test result will be negative for someone who does not have the illness is known as specificity. The ability of a test to distinguish between individuals who have a disease and those who do not is indicated by the area under the ROC curve (AUC). Stronger discrimination is indicated by a higher AUC. The AUC for multiplex PCR in the Figure 3 is 0.95, greater than the AUC for Gram stain (0.87) and microbiological culture (0.89). This shows that multiplex PCR is a more accurate way to diagnose infection than microbiological culture and Gram stain. Compared to Gram stain and microbiological culture, multiplex PCR has greater sensitivity. This indicates that there is a higher probability of accurately identifying those who are infected. Gram stain is less particular than microbiological culture, while multiplex PCR is more specific than it. This implies that there is a decreased possibility of mistakenly classifying as infected those who are not infected.
Overall finding of sensitivity, specificity, positive predictive value, and negative predictive value of studies
The pooled sensitivity results indicated that the multiplex PCR (n=12 studies) had the highest sensitivity of 92% while Gram’s stain (n=11 studies) had the lowest sensitivity of 74.6%. On the other hand, the pooled specificity results showed that multiplex PCR (n=11 studies) had the highest specificity of 86%, while Gram’s stain (n=9 studies) had the highest specificity of 78.9%. Semi-quantitative/quantitative/enrichment culture had 78.5% (n=6 studies) pooled sensitivity and lowest specificity of 75.97% (n=5 studies). The pooled PPV results showed that Gram’s stain (n=6 studies) had the highest PPV of 76.06% followed by multiplex PCR (n=6 studies) with a PPV of 71%, and semi-quantitative/ quantitative/enrichment culture (n=3 studies) had the lowest PPV of 64.15%. On the other hand, the pooled NPV results indicated that multiplex PCR (n=6 studies) had the highest NPV of 77%, followed by Gram’s stain (n=8 studies) with an NPV of 74.82%, and semi-quantitative/quantitative/enrichment culture (n=3 studies) had the lowest NPV of 70.5%. Moreover, it was stated that out of the tests evaluated, the multiplex PCR-based test showed the highest sensitivity, which means that it was able to detect a greater proportion of infections identified by culture with high accuracy. In addition, it exhibited superior sensitivity compared to Gram’s stain.
It is important to note that the results were based on a pooled analysis of a certain number of studies (n) for each test. Therefore, actual sensitivity specificity, PPV and NPV values may vary depending on the specific test and the condition of the study.
VAP infection is identified in ICU patients based on the number of days they spend in the ICU and the varying sensitivity of the test depending on the duration of their stay. Upon comparing the Table 2 with SI-5, it becomes evident that patients who spend around the first week or 1-10 days in the ICU exhibit greater sensitivity to multiplex PCR. This can be attributed to the usage of antibiotics that decreases the viability of pathogens after the initial week of ICU stay.
Table (2):
Test sensitivity by time since onset of symptoms (Day count with test variation in sensitivity terms), NR-not reported
| Studies | Test sensitivity by time since onset of symptoms (Day count with test variation in sensitivity terms) | |
|---|---|---|
| Pickens & co.21 | 1-10.8 days | NR |
| HOU & co.22 | 1-5 days | 93% (Multiplex PCR) |
| Nusrat & co.23 | 1-6 DAYS | 85.7% (Culture) |
| Morris & co.24 | NR | 100% (Multiplex PCR) |
| Piffer-Smadja & co.25 | NR | 80% (Multiplex PCR) |
| Bianco & co.27 | 0-28 days | NR |
| Clavel & co.19 | 4-10 days | 58%-100% (Multiplex PCR) |
| Coppens & co.28 | 1-2 Day | 100% (Multiplex PCR) |
| Hughes & co.30 | 1-6 Days | NR |
| Karolyi & co.31 | 1-7.5 days | NR |
| Khosroshahi & co.32 | 1-7 days | NR |
| Loughlin & co.34 | 1-25.5 days | NR |
| Luyt & co.18 | 4-20 days | 77% (Multiplex PCR) |
| Monard & co.36 | NR | NR |
| Morris & co.24 | NR | 89%-100% (Multiplex PCR) |
| Nolan & co.35 | NR | NR |
| Nowak & co.37 | 1-8 days | NR |
| Nusrat & co.23 | NR | 85.7% (Culture) |
| Razazi & co.38 | 1-8 DAYS | 93% (Multiplex PCR) |
| Rouze & co.39 | 1-7 days | NR |
| Enne & co.29 | 1-3 days | 50%-100% (Multiplex PCR) |
Our study aimed to examine the efficacy of three diagnostic techniques – multiplex PCR, microbiological culture, and Gram’s stain – in identifying the causative agents responsible for VAP in patients admitted to the ICU. We conducted a systematic review and meta-analysis for this purpose. After evaluating these techniques, we found that the reference standard, multiplex PCR, had the highest sensitivity compared to the other tests we used. The inclusion criteria for the samples were bronchoalveolar lavage (>104 CFU/ml), Endotracheal aspirates (>105 CFU/ml), and PBS (>103 CFU/ml), radiological infiltrate, microbiological culture positive with more than 48 hours of ventilation, positive multiplex PCR, and Gram’s stain. Multiplex PCR showed a sensitivity range of 58% to 100% when we evaluated all the diagnostic techniques. In a previous retrospective multicenter study, the BioFire Filmarray test, a type of rapid multiplex PCR (rm-PCR), increased the appropriateness of empirical therapy to 87% compared to routine care at 77%. More VAP patients received antibiotic modification, possibly because PCR-guided therapy for pneumonia episodes with different numbers of pathogens differed from empirical therapy.36
According to our study, the test sensitivity was high during the first week of ICU stay, which means that all the pathogens that cause VAP were detected within that first week. This finding is important because it allowed the hospital to lower the mortality rate, lower ICU stays, and restrict colonization from becoming pathogenic. In other words, early detection of VAP can help prevent the spread of harmful bacteria, improve patient outcomes, and reduce the length of ICU stays. Additionally, a separate meta-analysis study found that candida spp., which is a type of fungus that can colonize the airways of patients with VAP. According to the meta-analysis, patients with VAP who have candida spp. airway colonization tend to have longer periods of mechanical ventilation, higher rates of 28-day mortality and ICU mortality, and longer ICU stays compared to those without colonization. This indicates that patients with candida spp. colonization are at a greater risk of adverse outcomes and may require more intensive treatment than patients who do not have colonization. Overall, this highlights the importance of early detection and prevention of VAP and the potential risks associated with candida spp. colonization in patients with VAP54.
This meta-analysis study showed that multiples multiplex PCR assay (a type of diagnostic test) was clustered up to the top left-hand corner in the SROC plot, which indicates that this test had the best sensitivity for detecting VAP pathogens and their resistance patterns. This means that the test was able to accurately identify the presence of VAP-causing bacteria and determine their resistance to antibiotics, which can help inform appropriate treatment decisions. other systematic and meta-analysis study highlights the limitations of relying on traditional clinical indicators for the diagnosis of VAP. In particular, the research revealed that relying on various indicators such as fever, purulent secretions, leucocytosis, chest radiography, cultures from three distinct sampling techniques (Endotracheal aspirates, phosphate saline buffer, bronchoalveolar lavage), and CPIS (Clinical Pulmonary Infection Score) exhibited low specificity in diagnosing VAP. This means that these indicators were not always able to accurately identify VAP in patients, which could lead to incorrect diagnoses and inappropriate use of antibiotics. This can be particularly problematic in ICU patients, who may be at higher risk for developing antibiotic-resistant infections. Overall, this emphasizes the importance of using accurate diagnostic tests for the detection of VAP pathogens and their resistance patterns, as well as the limitations of relying solely on clinical indicators for the diagnosis of VAP.55
We have conducted a meta-analysis to assess how effectively multiplex PCR can diagnose the VAP. A study conducted on the diagnostic accuracy of PCR/ESI-MS as compared to that of culture method in mechanically ventilated patients for diagnosing VAP, revealed that PCR/ESI-MS had a sensitivity of 84% and a specificity of 53%. The positive predictive value of PCR/ESI-MS was 58%, while the negative predictive value was 81%. These results indicated that PCR/ESI-MS had higher diagnostic accuracy for the detection of VAP pathogens in mechanically ventilated patients than culture method alone.56
In another cross-sectional study, Nusrat and colleagues found that for detecting MBL resistance patterns, the sensitivity of the culture and drug sensitivity test (CDST) was high (85.7%) compared to PCR, due to a high positive rate. However, the specificity of CDST was low (52.0%) due to a high rate of false positive results. Based on these findings, the study recommended the use of multiplex PCR for the optimal detection of MBL-producing organisms. These findings can help guide clinicians in selecting the appropriate diagnostic test for detecting MBL resistance patterns, which can aid in the appropriate management of infections caused by these organisms.23
In our study regarding sensitivity, the pooled analysis found that multiplex PCR had the highest sensitivity of 92%, meaning it was able to correctly detect the presence of bacteria in 92% of cases. In contrast, Gram’s stain had the lowest sensitivity of 74.6%, indicating that it missed detecting bacteria in more cases. This suggested that multiplex PCR was a more sensitive test for bacterial detection compared to Gram’s stain. In terms of specificity, the pooled analysis found that multiplex PCR had the highest specificity of 86%, meaning it correctly identified samples that did not contain bacteria in 86% of cases. Gram’s stain had the highest specificity of 78.9%, while semi-quantitative/quantitative/enrichment culture had the lowest specificity of 75.97%. This suggested that multiplex PCR was a more specific test for bacterial detection compared to the other two tests. The pooled analysis also found that Gram’s stain had the highest PPV of 76.06%, indicating that when it identified bacteria in a sample, it was correct 76.06% of the time. Multiplex PCR had a lower PPV of 71%, while semi-quantitative/quantitative/enrichment culture had the lowest PPV of 64.15%. In contrast, the pooled NPV analysis found that multiplex PCR had the highest NPV of 77%, meaning that when it identified the absence of bacteria in a sample, it was correct 77% of the time. Gram’s stain had an NPV of 74.82%, while semi-quantitative/quantitative/enrichment culture had the lowest NPV of 70.5%. Overall, these results suggested that multiplex PCR may be the best test for bacterial detection among the three tests evaluated. It had the highest sensitivity and specificity and a high NPV. The results also indicated that Gram’s stain may have advantages in terms of PPV, but it had lower sensitivity and specificity compared to multiplex PCR.
In the current study of meta-analysis, we have included 10 Gram’s stain studies separately. However, this number has not been included in the overall meta-analysis investigation (n= 23). Although we have carried out the analysis of the above Gram’s stain studies by forest plot interpretation and SROC analysis, we have not checked the risk of biases and applicability concerns through QUADAS-2 tools. This is due to a lack of reports about multiplex PCR studies as compared to Gram’s stain and culture studies.
To sum up, numerous studies have indicated that multiplex PCR is a highly precise diagnostic method for detecting VAP, exhibiting superior sensitivity and specificity in comparison to culture and Gram’s stain. Nevertheless, it is crucial to acknowledge that the diagnostic accuracy of multiplex PCR may fluctuate based on the type of assay employed and the population under examination. Additionally, multiplex PCR may not detect all pathogens that can cause VAP, and culture and gram stain may still be necessary to confirm the diagnosis and guide appropriate antibiotic therapy.
For practical consequences the doctors and other healthcare workers involved in the diagnosis and treatment of VAP in intensive care units (ICUs), the results of our systematic review and meta-analysis have tremendous practical consequences. The importance of using molecular techniques for accurate VAP diagnosis is shown by the greater sensitivity and specificity of multiplex PCR over conventional procedures like Gram’s stain and culture. By prioritizing the use of multiplex PCR in their diagnostic algorithms, clinicians can use this information to identify VAP cases more quickly and accurately. Furthermore, the integration of multiplex PCR, culture, and Gram’s stain may improve diagnostic sensitivity, enabling a more thorough method of diagnosing VAP.
Our study impact on Treatment Plans and Diagnostic Guidelines i.e. multiplex PCR is the recommended diagnostic method for VAP, and our results imply that this should be incorporated into both diagnostic recommendations and treatment plans. Healthcare practitioners can optimize VAP management regimens, resulting in better patient outcomes and less antibiotic resistance development, by revising current guidelines to reflect the superiority of molecular approaches. Moreover, the discovery of combination diagnostic strategies may lead to modifications in diagnostic algorithms, enabling more precise and effective VAP detection in clinical settings.
A number of strengths are evident in our systematic review and meta-analysis, including a strong methodology, an extensive search approach, and a strict quality assessment. We made sure that pertinent research was included and that the diagnostic accuracy of laboratory procedures for VAP was thoroughly evaluated by employing a variety of databases and statistical tools. Furthermore, the credibility and reliability of our findings are increased by our adherence to accepted principles for performing systematic reviews.
Diagnostic accuracy of laboratory techniques: By offering information on the diagnostic accuracy of several laboratory tests for VAP, the meta-analysis helps medical practitioners make the right diagnosis choices. Multiplex PCR, culture techniques, and Gram’s stain are examples of combined diagnostic procedures that may improve the sensitivity and specificity of VAP diagnosis. This suggests that these approaches should be included into clinical practice. Performance of various laboratory techniques: Based on patient characteristics and clinical situations, the study emphasizes the necessity of choosing the most accurate and dependable procedures, highlighting variances in the performance of various laboratory techniques. Research is still needed to solve current issues and enhance the precision and dependability of VAP diagnostic tools. To improve the generalizability of findings, future research should concentrate on bigger sample sizes, standardized methodology, and different patient populations. Implications for public health: In order to effectively manage patients and reduce infections in healthcare settings, early and accurate identification of VAP is essential. The present study will help medical practices and regulations to lessen VAP’s burden and enhance patient outcomes through appropriate choice of diagnostic tools.
Limitation
Multiplex PCR-based tests have been shown to have high sensitivity and specificity for the diagnosis of VAP. However, they do have limitations in terms of not being able to differentiate between live and dead pathogens, which can lead to overuse of antibiotics. This is because the test detects the presence of genetic material of the pathogen, which may still be present even after the pathogen has been killed by the immune system or antibiotics. Therefore, it is important to confirm the viability of the detected pathogens through culture. Waiting for culture results can delay treatment and increase the risk of complications for the patient. Gram’s stain is not a reliable diagnostic tool for VAP, and culture takes 48 to 72 hours, which can delay treatment. Furthermore, most studies on this topic have used low sample sizes, which may not accurately reflect real-world scenarios of VAP detection. Therefore, larger sample size studies are needed to obtain a better understanding of VAP diagnosis. The risk of false negatives and false positives also poses a challenge to the test’s specificity and accuracy of the results.
The review’s inclusion criteria encompassed case-control studies with cross-sectional research, which could potentially introduce biases and limitations in the interpretation of the findings. This strategy could result in differences in study designs and methodologies, which would impact the findings’ comparability and consistency. Language and geographic limits: There may have been language and regional biases in the included research as a result of our review’s lack of restrictions based on language or geography. The results of the study may be impacted by regional differences in patient demographics, diagnostic procedures, and healthcare practices. Risk of bias assessment: Despite the fact that the QUADAS-2 method was employed in our review to evaluate the quality of the studies, subjective evaluations might have been made during the process, which could have introduced bias. The dependability may be impacted by the subjective nature of quality evaluation. The validity and reliability of the results may be impacted by the subjective character of the quality assessment. Reporting bias: The completeness and correctness of the results of the included studies may have been impacted by reporting bias, which was not evaluated in this review. The overall picture of diagnostic accuracy may be distorted by publication bias, selective reporting of outcomes, and insufficient reporting of procedures or results. Patient selection may be influenced and generalizability may be restricted by the study design bias, which is primarily cross-sectional with a few case-control studies. Concerns regarding population representativeness are raised by the substantial likelihood of bias in patient selection seen in many case-control studies. Diverse microbiology and molecular biology test performance variations lead to discrepancies in claimed diagnosis accuracy. Valid findings on procedure accuracy are impeded by research that do not have control groups. Geographic diversity—the bulk of studies are conducted in particular regions like the UK, France, and China—combines with a variety of testing techniques and reference standards used across studies to create methodological heterogeneity, which may limit generalizability to other healthcare systems. The generalizability and validity of meta-analytic conclusions for clinical practice are further limited by potential publication bias, geographic bias, and temporal bias.
Our findings show that the multiplex PCR test is the most accurate diagnostic test for VAP, followed by culture techniques. Additionally, combining the Gram’s stain, culture, and multiplex PCR tests seems to provide better sensitivity compared to using any of these tests alone, regardless of the method. Nevertheless, the present Gram’s staining technique has low precision, indicating the necessity for additional investigation to create more rapid and targeted methods that are appropriate for individual patients and can be utilized in large-scale prevalence studies of VAP.
Additional file: Additional Tables and Figures.
ACKNOWLEDGMENTS
The authors are thankful to Mr. Kush Kumar Pandey, Nebraska Center for Virology and School of Veterinary Medicine and Biomedical Sciences, University of Nebraska-Lincoln, Lincoln 68583, NE, USA, for editing the manuscript.
CONFLICT OF INTEREST
The authors declare that there is no conflict of interest.
AUTHORS’ CONTRIBUTION
BT and AB conceptualized the study. HKT wrote the original draft. PS, SKA, MKJ, SKA, PK and GM wrote, reviewed and edited the manuscript. BT and MKJ supervised the study. All authors read and approved the final manuscript for publication.
FUNDING
None.
DATA AVAILABILITY
The datasets generated and/or analysed during the current study are available from the corresponding author on reasonable request.
ETHICS STATEMENT
Not applicable.
- Centers for Disease Control and Prevention. (2021). Pneumonia (Ventilator-associated VAP and non- ventilator-associated Pneumonia PNEU.) Event Table of Contents. 2013:1-19. Https://Www.Cdc.Gov/Nhsn/Pdfs/Pscmanual/4psc_clabscurrent.Pdf (Accessed 27 Jan 2021).
- Arthur LE, Kizor RS, Selim AG, van Driel ML, Seoane L. Antibiotics for ventilator associated pneumonia. Cochrane Database of Syst Rev. 2016(10):CD004267.
Crossref - Papazian L, Klompas M, Luyt CE. Ventilator-associated pneumonia in adults: a narrative review. Intensive care Med. 2020;46(5):888-906.
Crossref - Behera AK, Guruprasad H, Reddy M, et al. Incidence, Risk Factors and Microbiological Profile of Ventilator Associated Pneumonia Patients in ICU in Tertiary Care Hospital. J Adv Med Pharm Sci. 2024;26(3):37-44.
Crossref - Kharel S, Bist A, Mishra SK. Ventilator-associated pneumonia among ICU patients in WHO Southeast Asian region: A systematic review. PloS one. 2021;16(3):e0247832.
Crossref - Ferrer M, Torres A. Epidemiology of ICU-acquired pneumonia. Curr Opin Crit Care. 2018;24(5):325-331.
Crossref - Mathai AS, Phillips A, Kaur P, Isaac R. Incidence and attributable costs of ventilator-associated pneumonia (VAP) in a tertiary-level intensive care unit (ICU) in northern India. J Infect Public Health. 2015;8(2):127-135.
Crossref - Gautam A, Ganu SS, Tegg OJ, Andresen DN, Wilkins BH, Schell DN. Ventilator-associated pneumonia in a tertiary paediatric intensive care unit: a 1-year prospective observational study. Crit Care Resusc. 2012;14(4):283-289.
Crossref - Wu D, Wu C, Zhang S, Zhong Y. Risk factors of ventilator-associated pneumonia in critically III patients. Front pharmacol. 2019;10:482.
Crossref - Abayasekara LM, Perera J, Chandrasekharan V, et al. Detection of bacterial pathogens from clinical specimens using conventional microbial culture and 16S metagenomics: a comparative study. BMC Infec Dis. 2017;17:1-1.
Crossref - Zaragoza R, Peman J, Salavert M, et al. Multidisciplinary approach to the treatment of invasive fungal infections in adult patients. Prophylaxis, empirical, preemptive or targeted therapy, which is the best in the different hosts? Ther Clin Risk Manag. 2008;4(6):1261-1280.
Crossref - Monteiro-Neto V, Lima-Neto LG, Abreu AG, Monteiro CRAV. Microbiology of Ventilator-Associated Pneumonia.
Crossref - Thakur HK, Tarai B, Bhargava A, et al. Pathogenesis, Diagnosis and Therapeutic Strategies for Ventilator-associated Pneumonia. J Pure Appl Microbiol. 2024;18(2):772-796.
Crossref - Yang S, Rothman RE. PCR-based diagnostics for infectious diseases: uses, limitations, and future applications in acute-care settings. Lancet Infect Dis. 2004;4(6):337-348.
Crossref - Buchan BW, Windham S, Balada-Llasat JM, et al. Practical comparison of the BioFire FilmArray pneumonia panel to routine diagnostic methods and potential impact on antimicrobial stewardship in adult hospitalized patients with lower respiratory tract infections. J Clin Microbiol. 2020;58(7):10-128.
Crossref - McInnes MD, Moher D, Thombs BD, et al. Preferred reporting items for a systematic review and meta-analysis of diagnostic test accuracy studies: the PRISMA-DTA statement. JAMA. 2018;319(4):388-396.
Crossref - Cumpston M, Li T, Page MJ, et al. Updated guidance for trusted systematic reviews: a new edition of the Cochrane Handbook for Systematic Reviews of Interventions. Cochrane Database Syst Rev. 2019;10(10):ed000142.
Crossref - Luyt CE, Hekimian G, Bonnet I, et al. Usefulness of point-of-care multiplex PCR to rapidly identify pathogens responsible for ventilator-associated pneumonia and their resistance to antibiotics: an observational study. Crit Care. 2020;24:378.
Crossref - Clavel M, Barraud O, Moucadel V, et al. Molecular quantification of bacteria from respiratory samples in patients with suspected ventilator-associated pneumonia. Clin Microbiol Infect. 2016;22(9):812.e1-812.e7.
Crossref - Whiting PF, Rutjes AWS, Westwood ME, et al. Quadas-2: a revised tool for the quality assessment of diagnostic accuracy studies. Ann Intern Med. 2011;155:529-536.
- Pickens CO, Gao CA, Cuttica MJ, et al. Bacterial superinfection pneumonia in patients mechanically ventilated for COVID-19 pneumonia. Am J Respir Crit Care Med. 2021;204(8):921-932.
Crossref - Hou D, Ju M, Wang Y, et al. PCR coupled to electrospray ionization mass spectrometry for microbiological diagnosis and surveillance of ventilator associated pneumonia. Exp Ther Med. 2020;20(4):3587-3594.
Crossref - Nusrat T, Akter N, Haque M, et al. Comparative study of CDST & multiplex PCR to detect MBL producing gram-negative bacilli among VAP patients admitted in a public medical college hospital of Bangladesh. Pathogens. 2019;8(3):151.
Crossref - Morris AC, Gadsby N, McKenna JP, et al. 16S pan-bacterial PCR can accurately identify patients with ventilator-associated pneumonia. Thorax. 2017;72(11):1046-1048.
Crossref - Peiffer-Smadja N, Bouadma L, Mathy V, et al. Performance and impact of a multiplex PCR in ICU patients with ventilator-associated pneumonia or ventilated hospital-acquired pneumonia. Crit Care. 2020;24(1):366.
Crossref - van der Schalk TE, Coppens J, Timbermont L, et al. Evaluation of GeneXpert PA assay compared to genomic and (semi-) quantitative culture methods for direct detection of Pseudomonas aeruginosa in endotracheal aspirates. Antimicrob Resist Infect Control. 2021;10(1):110.
Crossref - Bianco A, Quirino A, Giordano M, et al. Control of carbapenem-resistant Acinetobacter baumannii outbreak in an intensive care unit of a teaching hospital in Southern Italy. BMC Infect Dis. 2016;16(1):747.
Crossref - Coppens J, Van Heirstraeten L, Ruzin A, et al. Comparison of GeneXpert MRSA/SA ETA assay with semi-quantitative and quantitative cultures and nuc gene-based qPCR for detection of Staphylococcus aureus in endotracheal aspirate samples. Antimicrob Resist Infect Control. 2019;8:4.
Crossref - Enne VI, Aydin A, Baldan R, et al. Multicentre evaluation of two multiplex PCR platforms for the rapid microbiological investigation of nosocomial pneumonia in UK ICUs: the INHALE WP1 study. Thorax. 2022;77(12):1220-1228.
Crossref - Hughes S, Troise O, Donaldson H, Mughal N, Moore LS. Bacterial and fungal coinfection among hospitalized patients with COVID-19: a retrospective cohort study in a UK secondary-care setting. Clin Microbiol Infect. 2020;26(10):1395-1399.
Crossref - Karolyi M, Pawelka E, Hind J, et al. Detection of bacteria via multiplex PCR in respiratory samples of critically ill COVID-19 patients with suspected HAP/VAP in the ICU. Wien Klin Wochenschr. 2022;134(9-10):385-390.
Crossref - Khosroshahi ND, Farivar TN, Johari P. Identification of Legionella pneumophila in intubated patients with TaqMan real time PCR. Jundishapur J Microbiol. 2015;8(3):e15094.
Crossref - Krishnamurthy V, Vijaykumar GS, Kumar S, Prashanth HV, Prakash R, Nagaraj ER. Phenotypic and genotypic methods for detection of extended spectrum
b lactamase producing Escherichia coli and Klebsiella pneumoniae isolated from ventilator associated pneumonia. J Clin Diagn Res. 2013;7(9):1975-1978.
Crossref - Loughlin L, Hellyer TP, White PL, et al. Pulmonary aspergillosis in patients with suspected ventilator-associated pneumonia in UK ICUs. Am J Respir Crit Care Med. 2020;202(8):1125-1132.
Crossref - Nolan TJ, Gadsby NJ, Hellyer TP, et al. Low-pathogenicity Mycoplasma spp. alter human monocyte and macrophage function and are highly prevalent among patients with ventilator-acquired pneumonia. Thorax. 2016;71(7):594-600.
Crossref - Monard C, Pehlivan J, Auger G, et al. Multicenter evaluation of a syndromic rapid multiplex PCR test for early adaptation of antimicrobial therapy in adult patients with pneumonia. Crit Care. 2020;24(1):434.
Crossref - Nowak J, Zander E, Stefanik D, et al. High incidence of pandrug-resistant Acinetobacter baumannii isolates collected from patients with ventilator-associated pneumonia in Greece, Italy and Spain as part of the MagicBullet clinical trial. J Antimicrob Chemother. 2017;72(12):3277-3282.
Crossref - Razazi K, Delamaire F, Fihman V, et al. Potential of multiplex polymerase chain reaction performed on protected telescope catheter samples for early adaptation of antimicrobial therapy in ARDS patients. J Clin Med. 2022;11(15):4366.
Crossref - Rouze A, Martin-Loeches I, Povoa P, et al. Relationship between SARS-CoV-2 infection and the incidence of ventilator-associated lower respiratory tract infections: a European multicenter cohort study. Intensive Care Med. 2021;47(2):188-198.
Crossref - Trevino SE, Pence MA, Marschall J, Kollef MH, Babcock HM, Burnham CA. Rapid MRSA PCR on respiratory specimens from ventilated patients with suspected pneumonia: a tool to facilitate antimicrobial stewardship. Eur J Clin Microbiol Infect Dis. 2017;36(5):879-885.
Crossref - Kwon SJ, Jeon T, Seo D, et al. Quantitative PCR for etiologic diagnosis of methicillin-resistant Staphylococcus aureus pneumonia in intensive care unit. Tuberc Respir Dis (Seoul). 2012;72(3):293-301.
Crossref - Dettori JR, Norvell DC, Chapman JR. Seeing the forest by looking at the trees: how to interpret a meta-analysis forest plot. Global Spine J. 2021;11(4):614-616.
Crossref - Gottesman T, Yossepowitch O, Lerner E, et al. The accuracy of Gram stain of respiratory specimens in excluding Staphylococcus aureus in ventilator-associated pneumonia. J Crit Care. 2014;29(5):739-742.
Crossref - Hashimoto S, Shime N. Evaluation of semi-quantitative scoring of Gram staining or semi-quantitative culture for the diagnosis of ventilator-associated pneumonia: a retrospective comparison with quantitative culture. J Intensive Care. 2013;1(1):9.
Crossref - Tuon FF, Gortz LW, Penteado-Filho SR, Soltoski PR, Hayashi AY, Miguel MT. Bacteriological study of bronchoalveolar lavage in the antibiotic management of suspected ventilator-associated pneumonia of patients in surgical intensive care units. Rev Col Bras Cir. 2012;39(5):353-357.
Crossref - Shokouhi S, Darazam IA, Sadeghi M, Gachkar L, Dolatshahi S. Diagnostic Yield of a Direct Quantitative Smear of Lower Respiratory Tract Secretions in Patients with Suspected Pneumonia Compared to a Semi-quantitative Culture. Tanaffos. 2017;16(1):9-12.
- Davis KA, Eckert MJ, R Reed, et al. Ventilator-associated pneumonia in injured patients: do you trust your Gram’s stain? J Trauma. 2005;58(3):462-467.
Crossref - Duflo F, Allaouchiche B, Debon R, Bordet F, Chassard D. An evaluation of the Gram stain in protected bronchoalveolar lavage fluid for the early diagnosis of ventilator-associated pneumonia. Anesth Analg. 2001;92(2):442-447.
Crossref - Iwata K, Igarashi W, Oba Y, et al. Hospital-acquired pneumonia in Japan may have a better mortality profile than HAP in the United States: a retrospective study. J Infect Chemother. 2012;18(5):734-40.
Crossref - Seligman R, Seligman BG, Konkewicz L, Dos Santos RP. Accuracy of tracheal aspirate gram stain in predicting Staphylococcus aureus infection in ventilator-associated pneumonia. BMC Anesthesiol. 2015; 15:1-5.
Crossref - Yoshimura J, Yamakawa K, Ohta Y, Nakamura K, Hashimoto H, Kawada M, et. al. Effect of Gram Stain–Guided Initial Antibiotic Therapy on Clinical Response in Patients With Ventilator-Associated Pneumonia: The GRACE-VAP Randomized Clinical Trial. JAMA Netw Open. 2022;5(4): e226136.
Crossref - Pieracci FM, Rodil M, Haenel J, Stovall RT, Johnson JL, Burlew CC, et. al. Screening for ventilator-associated pneumonia in the surgical intensive care unit: a single-institution analysis of 1,013 lower respiratory tract cultures. Surg Infect (Larchmt). 2015;16(4):368-74.
Crossref - Jones CM, Athanasiou T. Summary receiver operating characteristic curve analysis techniques in the evaluation of diagnostic tests. Ann Thorac Surg. 2005;79(1):16-20.
Crossref - Huang D, Qi M, Hu Y, Yu M, Liang Z. The impact of Candida spp airway colonization on clinical outcomes in patients with ventilator-associated pneumonia: A systematic review and meta-analysis. Am J Infect control. 2020;48(6):695-701.
Crossref - Fernando SM, Tran A, Cheng W, Klompas M, Kyeremanteng K, Mehta S, et. al. Diagnosis of ventilator-associated pneumonia in critically ill adult patients—a systematic review and meta-analysis. Intensive Care Med. 2020; 46:1170-9.
- Strålin K, Ehn F, Giske CG, et al. The IRIDICA PCR/Electrospray Ionization-Mass Spectrometry Assay on Bronchoalveolar Lavage for Bacterial Etiology in Mechanically Ventilated Patients with Suspected Pneumonia. PloS one. 2016;11(7), e0159694.
Crossref
© The Author(s) 2024. Open Access. This article is distributed under the terms of the Creative Commons Attribution 4.0 International License which permits unrestricted use, sharing, distribution, and reproduction in any medium, provided you give appropriate credit to the original author(s) and the source, provide a link to the Creative Commons license, and indicate if changes were made.