

ISSN: 0973-7510
E-ISSN: 2581-690X
The present experiment was undertaken to study the cultural, morphological and pathological variation in six isolates of Phytophthora cajani. The isolates were collected from pigeonpea growing areas of eastern Uttar Pradesh. Isolates exhibited considerable variations in cultural characters and growth on potato dextrose agar medium. The universal ITS1 and ITS4 primers showed the difference among P. cajani isolates. There was significance influence of temperature on the growth of isolates, however isolates could not be differentiated based on the temperature. The average growth (1.69 cm2) at 30°C temperature was recorded with all the isolates followed by average growth (1.25 cm2) at 35°C temperature. The maximum radial growth (3.6 cm2) was observed at 96 h in isolate PDC015-1. The isolate PDC013-1 and PDC014-3 showed highest 47.0% plant mortality on ICP 7119 genotype. Among the isolates PDC014-3 killed 28.6% plants after 4th day of inoculation.
Cajanus cajan, Phytophthora Blight, Temperature, Variability.
Pigeon pea [Cajanus cajan (L.) Millspaugh] is an important legume crop mostly cultivated in Asia, Africa, Latin America, and the Caribbean region (Saxena 2008). In India, pigeonpea is second important legume and occupy 72.5% of world cultivated area with 62.5% of world production (FAO 2012). In India pigeonpea is cultivated on 5.06 million ha with an annual production of 3.29 million tones with yield 649.9 kg/ha (FAOSTAT 2015).
The Phytophthora blight (PB) of pigeonpea caused by Phytophthora drechsleri Tucker f. sp. cajani (PDC) (Pal et al. 1970; Kannaiyan et al. 1980), was first reported on pigeonpea in 1966 by Williams et al. (1968). Amin et al. (1978) describe it as a new species Phytophthora cajani. The blight is particularly severe during the early crop growth with intermittent rains during June to September (Kannaiyan and Nene, 1984). Recently, PB become endemic and a potential threat to pigeonpea production, especially during excessive rain within a short span of time that create temporary flooding coupled with hot and humid weather (Chauhan and Saha, 1999). Pande et al. (2011) and Sharma et al. (2006) also reported the outbreak of PB due to climate change. Information on economic losses caused by PB is meager, but last few years 100% yield losses under favorable environment is recorded (Sharma et al. 2015).
Variation in disease reaction of pigeonpea lines to PDC isolates in different parts of the country have been reported by Nene et al. (1991). The existences of variability in the pathogen suggest the monitoring of pathogenic variability and disease reaction on different cultivars of pigeonpea. The different stages of life cycle of PDC are influenced differently by environmental factors. Among these temperatures influence the growth, reproduction, and pathogenesis (Sujkowski, 1987; Singh and Chauhan, 1988; Matheron and Matejka, 1992).
Most of the reports related to variation in PDC is one decade old. The recent outbreak of disease raised the question whether it is due to selection of more aggressive isolate selected in past decade under climate change regime.
The present study was conducted to determine the variability existing in the PDC isolates collected from various parts of eastern UP a hot spot of disease.
Survey and Collection of isolates
Survey was conducted from August to September during 2013, 2014 and 2015 at 110 locations of pigeonpea growing areas of eastern Uttar Pradesh for the incidence of PB. The Global Positioning System (GPS) values of each collection site were recorded by the instrument (Garmin Corporation, Taiwan, GPS etrex10). The PB infection was recorded on stem at all the locations following the disease rating scale of Reddy et al. (1989). The 20 infected plants of pigeonpea were collected from each field. Each infected sample was critically examined for presence of typical PB symptoms (Table 1).
Table (1):
Various details of Phytophthora drechsleri f. sp. cajani isolates collected from different districts of eastern Uttar Pradesh
Sl. No. |
Accession (NCBI)* |
Name of isolate |
GPS** value |
|---|---|---|---|
1. |
KJ412453 |
PDC013-1 |
ELEV: 129 Ft N 250 18.507’ E 0830 03.444’ |
2. |
KT207291 |
PDC014-1 |
ELEV: 407 Ft N 250 11.545’ E 0820 50.005’ |
3. |
KT207292 |
PDC014-2 |
ELEV: 220 Ft N 250 11.507’ E 0820 45.444’ |
4. |
KT207293 |
PDC014-3 |
ELEV: 262 Ft N 250 14.121’ E 0820 42.850’ |
5. |
KY400285 |
PDC015-1 |
ELEV: 510 Ft N 250 08.427’ E 0820 52.201’ |
6. |
KY400286 |
PDC015-2 |
ELEV: 205 Ft N 250 07.615’ E 0820 50.985’ |
* National center for biotechnology information
** Sample collection location GPS (Global Positioning System) based
Isolation of Phytophthora
The fresh collected PB samples of pigeonpea were washed in running water to remove the adhering soil particles. The samples were processed for the isolation (Sharma and Ghosh, 2016). The sterilized pieces (4 mm2) were dried in sterile blotter paper and aseptically transferred to Petri dishes containing Potato Dextrose Agar (PDA) medium supplemented with antibiotic streptomycin (30µg/ml). Each infected piece was inoculated in individual plate and incubated for 48 h at 28±2°C in dark condition. The pure culture was established by hyphae tip culture and pathogenicity of each isolate was confirmed.
Molecular identification of Phytophthora isolates
DNA of pure cultures of each isolate was extracted according to Mishra et al. (2008). DNA was amplified using the universal primers ITS6 and ITS4 (White et al., 1990). The ITS primers, ITS 1 and ITS 4 were used for the amplification of ITS region. The phylogenetic tree was constructed based on the ITS sequences and relationship among the PDC isolates were established. The each PCR reactions were performed in 16.2 µl volume. Thermal cycling conditions consisted of an initial de-naturation of 94°C for 03 min 30sec; 35 cycles of 94°C for 50 sec (de-naturation), annealing at 57.5°C for 90 sec, and extension at 72°C for 1 min 30sec; and a final extension step of 72°C for 7 min 30 sec. Amplified products were visualized on 1% agarose gel.
Karyotyping
Karyotyping was done with the DAPI staining to determine number of nuclei in fungal cells. A small portion of the mycelia mat growing on the PDA were fixed in 1 × PBS (Phosphate buffered saline) solution for 3 minutes, after that it was washed in distilled water. Mycelia were stained in 1% DAPI (4′,6-diamidino-2-phenylindole) in dark condition for 5 minutes. Then glycerol (80%) was placed on stained specimen and covered with glass. It was examined under florescent light and nuclei were photographed.
Morphology and growth of Phytophthora
The mycelia structure (Waterhouse 1963; Stamps et al. 1990) and growth of the individual isolate of PDC was examined under microscope. Mycelia discs (5 mm diameter) from 7-day-old culture of six isolates (PDC013-1, PDC014-1, PDC014-2, PDC014-3, PDC015-1, and PDC015-2) were transferred in to the center of each Petri plates containing medium (Fig. 1). Petri plates were incubated at 28±2°C. The growth area (pr2) was calculated for each isolate based on the radius of colony measured at an interval of 24 h till the Petri plates completely covered by mycelia growth.
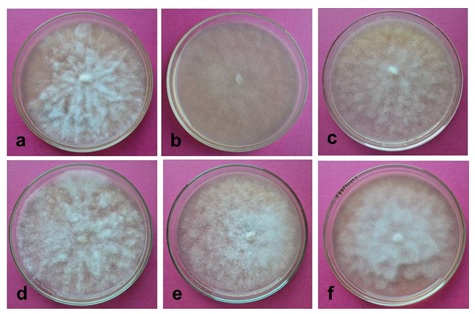
Fig. 1. Morphology of Phytophthora isolates growth on PDA (Potato Dextrose Agar) medium. a= Isolate PDC013-1, b=Isolate PDC014-1, c= Isolate PDC014-2, d= Isolate PDC014-3, e= Isolate PDC015-1, f= Iso-late PDC015-2
Effect of temperature on mycelia mat development
Mycelia disc (5 mm diameter) of each isolates from actively growing colony margin were cut and placed in the center of Petri plates. The plates were incubated at 15, 20, 25, 30 or 35°C and colony diameter measured at 96 h by taking two perpendicular readings of each colony and subtracting the diameter of the inoculated disc. The experiment was conducted in complete randomized block design (CRBD) with three replications.
Percent plant mortality in various genotypes of Pigeonpea
In this experiment, cultivar Bahar and ICP 7119 was used to test the pathogenic variability against six isolates. The experiment was conducted in randomized block design (RBD) and cultivars having spacing of 30 × 15 cm with three replications (10 plant each replication). The node inoculation technique was used for infection (Chand et al. 2015). The plant mortality percent data was recorded after 4th days of inoculation.
Analysis of data
Statistical analysis data were analyzed by SAS using PROC GLM (SAS 2010) to differentiate the isolates.
Growth of isolates
No significant difference in colony growth among the isolates was recorded. The average colony growth ranged between 2.6 to 3.6 cm2 at 96 h of incubation (Table 2).
Table (2):
Morphological characters and colony growth of different isolates of Phytophthora drechsleri f.sp. cajani grown on PDA (Potato Dextrose Agar)
| Name of Isolate | Morphological Character of isolates | Mean colony growth (cm2) | Mean (cm2) | |||
|---|---|---|---|---|---|---|
| 24 h | 48 h | 72 h | 96 h | |||
| PDC013-1 | Fluffy and hyphae regular in width and fast cottony white growth. | 0.8 | 2.3 | 3.1 | 5.5 | 3.1 |
| PDC014-1 | Amorphous, dense, aerial, hyphaeand fast cottony white growth. | 0.8 | 2.3 | 3.5 | 6.4 | 3.5 |
| PDC014-2 | Fluffy and hyphae regular in width and cottony white growth that was comparatively slow. | 0.5 | 1.7 | 2.6 | 5.0 | 2.6 |
| PDC014-3 | Submerged and regular in width and fast cottony white growth. | 0.7 | 2.2 | 3.2 | 5.9 | 3.2 |
| PDC015-1 | Amorphous, dense, aerial, hyphae and fast cottony white growth. | 0.8 | 2.5 | 3.6 | 6.5 | 3.6 |
| PDC015-2 | Submerged and regular in width and fast cottony white growth. | 0.8 | 2.2 | 3.2 | 5.8 | 3.2 |
| LSD (0.05)* | NS# | |||||
* Least Significant Difference
# Non Significant
Effect of temperatures on colony growth
All the isolates reached to its maximum growth after 96 h of the incubation at different temperature under dark condition (Table 3). There was significance influence of temperature on the growth of isolates. However at individual temperature isolates could not differ significantly. The average colony growth (1.69 cm2) at 30°C temperature followed by 35°C temperature average growth mean (1.25 cm2) were recorded for the isolates.
Table (3):
In-vitro effect of temperatures on colony growth (cm) of different isolates of Phytophthora drechsleri f.sp. cajani at 96 h
| Temperature 0C | Mean growth of isolates | Mean (cm2) | |||||
|---|---|---|---|---|---|---|---|
| PDC013-1 | PDC014-1 | PDC014-2 | PDC014-3 | PDC015-1 | PDC015-2 | ||
| 15 | 0.4 | 0.3 | 0.3 | 0.4 | 0.3 | 0.3 | 0.65 |
| 20 | 0.5 | 0.6 | 0.5 | 0.6 | 0.5 | 0.6 | 1.09 |
| 25 | 0.6 | 0.7 | 0.7 | 0.7 | 0.6 | 0.7 | 1.38 |
| 30 | 0.7 | 0.9 | 0.8 | 0.9 | 0.8 | 0.8 | 1.69 |
| 35 | 0.7 | 0.7 | 0.6 | 0.7 | 0.5 | 0.6 | 1.25 |
| LSD(0.05)* | 0.1937 | ||||||
* Least Significant Difference
Nuclear conditions and ITS sequences
DAPI showed the uniform distribution of nucleus at certain distance in the hyphae (Fig. 2). The phylogeny tree based the ITS sequence isolated grouped in two different clades. The phylogenetic tree was showing scale bar represent the genetic distance, proportional to the number of nucleotide differences between branch nodes (Fig. 3). The ITS sequences were deposited to NCBI (National center for biotechnology information) data base accession details are given in table 1.
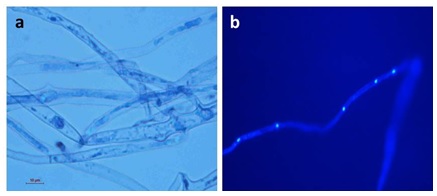
Fig. 2. Microscopic photographs of the Phytophthora. a= Mycelium stain by cotton blue, b= Hyphae stain by DAPI, whereas whitish blue color are nucleus
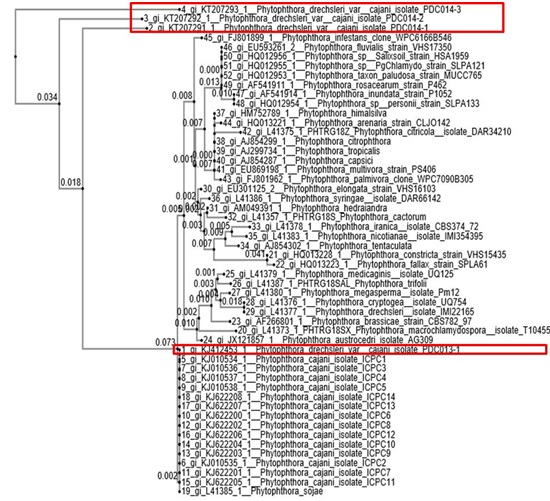
Fig. 3. The phylogenetic tree showing the relationship among the P. drechsleri var. cajani isolates of this study and other Phytophthora spp. based on ITS sequences of 5.8S rDNA. Scale bar represent the genetic distance, proportional to the number of nucleotide differences between branch nodes. The significance of the nodes was estimated with 1000 bootstrap repetitions
Note: The Red box denoted to our isolates in this studies.
Effect of isolates on percent plant mortality in Pigeonpea
There was no significance difference among the isolates for the plant mortality. Among the isolates PDC014-3 killed 28.6% plants followed by PDC014-1 and PDC015-1, 27.6 and 27.0% plants, respectively. The isolate PDC015-2 caused 23.6% plant mortality. There was no significant difference in the isolates for plant mortality (Table 4).
Table (4):
Percent plant mortality of pigeonpea genotypes inoculated with various isolates of Phytophthora drechsleri f.sp. cajani grown on Potato Dextrose Agar
| Isolate | Percent mortality of genotypes | Average mortality (%) | ||||
|---|---|---|---|---|---|---|
| ICP 7119 | Bahar | MAL 3 | MAL 6 | MAL 13 | ||
| PDC013-1 | 47 (0.48)* | 34 (0.34) | 14 (0.14) | 17 (0.17) | 14 (0.14) | 25.2 |
| PDC014-1 | 44 (0.45) | 37 (0.37) | 20 (0.20) | 20 (0.20) | 17 (0.17) | 27.6 |
| PDC014-2 | 40 (0.41) | 30 (0.30) | 20 (0.20) | 20 (0.20) | 20 (0.20) | 26.0 |
| PDC014-3 | 47 (0.48) | 34 (0.34) | 24 (0.24) | 24 (0.24) | 14 (0.14) | 28.6 |
| PDC015-1 | 40 (0.41) | 30 (0.30) | 24 (0.24) | 24 (0.24) | 17 (0.17) | 27.0 |
| PDC015-2 | 37 (0.37) | 30 (0.30) | 14 (0.14) | 17 (0.17) | 20 (0.20) | 23.6 |
| LSD (0.05)** | NS# | |||||
Data in parenthesis were Arcsine transformed
** Least Significant Difference
# Non Significant
Phytophthora blight is a seedling disease and infects plants from germination to 40 days of growth. Information related to the variability in pathogen population is limited. The first indication of pathogenic variability came in to light when several pigeonpea lines resistant to the P2 isolate showed susceptibility in ICRISAT field in the seasons of 1981 to 1982. Isolations from such plants and pathogenicity tests revealed this to be a more aggressive isolate distinct from P2 and it was therefore named P3. In the year 1987-88 season many lines that showed tolerance to the P3 isolate showed high susceptibility to fungus (P4) and isolate from them was more aggressive than the P3 isolate. Multi-location evaluation of pigeonpea lines indicated the possible variation in PDC. The variability in pot culture studies of 13 pigeonpea genotypes to 8 isolates of PDC from different locations in India further confirmed it (Reddy et al., 1990). Present study revealed the variation in the sequence and placed the isolates in two different groups.
Temperature and humidity play important role in the disease build up (Kannaiyan et al. 1980; Sharma et al. 2006). In this study temperature between 30 – 35 0C was optimum and often this temperature range prevailed during the month August and September critical for the outbreak of disease. PDC isolates from eastern Uttar Pradesh could not differentiated at different temperature and indicated that there is not specific adoption in isolates for temperature. Similarly pathogenic variability also could not be identified in the isolates. Oospore production in PDC is reported (Singh and Chauhan, 1988) but it was not further reported from other places. This indicate that population of PDC is asexual and with least variation. Although our sample size was limited and its need further confirmation.
The present research focused results on significance influence of temperature on the growth of isolates. However at individual temperature isolates could not differ significantly. The average colony growths maximum (1.69 cm2) at 30°C temperature were recorded for the isolates.
ACKNOWLEDGMENTS
Authors are thankful to International Crops Research Institute for the Semi-Arid tropics (ICRISAT) for developing project and Ministry of Agriculture, Government of India for financial support.
- Saxena, K.B. Genetic Improvement of Pigeon Pea – A Review. Tropical Plant Biology, 2008; 1: 159-178.
- Food and Agriculture Organization of the United Nations, (FAO Year book), 2012.
- Food and Agriculture Organization of the United Nations Statistics division, (FAOSTAT), 2015. http://faostat3.fao.org/download/Q/QC/E.
- Pal, M., Grewal, J.S., Sarbhoy, A.K. A new stem rot of arhar caused by Phytophthora. Indian Phytopathology, 1970; 23: 583-587.
- Kannaiyan, J., Ribeiro, O.K., Erwin, D.C., Nene, Y.L. Phytophthora blight of pigeonpea in India. Mycologia, 1980;72: 169-181.
- Williams, F.J., Grewal, J.S., Amin, K.S. Serious and new diseases of pulse crops in India in 1966. Plant Disease Reporter, 1968; 52: 300-304.
- Amin, K.S., Baldev, B., Williams, F.J. Phytophthora cajani, a new species causing stem blight on Cajanus cajan. Mycologia, 1978; 70(1): 171-176.
- Kannaiyan, J., Nene, L. Efficacy of metalaxyl for control of Phytophthora blight of pigeonpea. Indian Phytopathology, 1984; 37-3: 506-510.
- Chauhan, V.B., Saha, S. Influence of environmental factors on Phytophthora blight of pigeonpea. Indian Journal of Pulses Research, 1999; 12 (2): 206-210.
- Pande, S., Sharma, M., Mangala, U.N., Ghosh, R., Sundaresan, G. Phytophthora blight of Pigeonpea [Cajanus cajan (L.) Millsp.]: An updating review of biology, pathogencity and disease management. Crop Protection, 2011; 30: 951-957.
- Sharma, M., Pande, S., Pathak, M., Rao, J.N., Kumar, A., Reddy, M., Benagi, V.I., Mahalinga, D.M., Zhote, K.K., Karanjkar, P.N., Eksinghe, B.S. Prevalence of Phytophthora blight of pigeonpea in the Deccan Plateau of India. Plant Pathol. J., 2006; 22(4): 309-313.
- Sharma, M., Ghosh, R., Tarafdar, A., Telangre, R. An efficient method for zoospore production, infection and real-time quantification of Phytophthora cajanicausing Phytophthora blight disease in pigeonpea under elevated atmospheric CO2. BMC Plant Bio., 2015; 15: 90.
- Nene, Y.L., Sheila, V.K., Nandita Sarkar, Reddy, M.V. Pathogenic variability among the isolation of Phytophthora drechsleri f. sp. cajani. International pigeonpea newslatter. 14: pp, 1991; 23-24.
- Sujkowski, L.S. Seasonal variation in sporulation of Phytophthora infestans. J. of Phytopathol., 1987; 117: 357-361.
- Singh, U.P., Chauhan, V.B. Effect of temperature on germination of zoospores of Phytophthora drechsleri f.sp. cajani. Indian Phytopathol., 1988; 41: 80-85.
- Matheron, M.E., Matejka, J.C. Effects of temperature on sporulation and growth of Phytophthora citrophthora and P. parasitica and development of foot and root rot on citrus. Plant Disease, 1992; 76: 1103-1109.
- Reddy, M.V., Jain, K.C. Recent Advances in Breeding for Disease Resistance in Pigeonpea.In New Frontiers in Pulses Research and Development: Proceedings of National Symposium, 10-12 November, 1989, Directorate of Pulses Research, Kanpur India.
- Sharma, M., Ghosh, R. A Reliable Method for Phytophthora cajani Isolation, Sporangia, Zoospore Production and in Planta Infection of Pigeonpea. Bio-protocol, 2016; 6(2).
- Mishra, A.K., Sharma, K., Misra, R.S. Rapid and Efficient Method for the Extraction of Fungal and Oomycetes Genomic DNA. Genes, Genomes and Genomics, 2008; 2: 57-59.
- White, T.J., Bruns, T., Lee, S., Taylor, J. Amplification and direct sequencing of fungal ribosomal RNA genes for phylogenetics. In PCR Protocols: A Guide to Methods and Applications (M. A. Innis, D. H. Gelfand, J. J. Sninsky, and T. J. White, Eds.), pp. 315-322. Academic Press, San Diego, 1990.
- Waterhouse, G.M. Key to the species of Phytophthora de Bary. Mycological Papers 92. Kew, Surrey, England: Commonwealth Mycological Institute, 1963.
- Stamps, D.J., Waterhouse, G.M., Newhook, F., Hall, G.S. Revised Tabular Key to the Species of Phytophthora. Mycol., 1990; Pap. No. 162.
- Chand, R., Singh, V., Singh, C.K., Ghosh, R., Sharma, M. Nodal inoculation – a quick and easy inoculation technique for Phytophthora blight of Pigeonpea. 3rd international symposium on “Phytophthora: taxonomy, genomics, pathogenicity, resistance and disease management” ICAR-IIHR, Bengaluru, 9-12, 2015: 30.
- Statistical Analysis System (SAS), Institute Inc., Cary, USA, 2010.
- Reddy, M.V., Sharma, S.B., Nene, Y.L. Disease management. The Pigeonpea (Nene, Y.L., Hall, S.D. and Sheita, U.K. eds.) CAB. International, Wallinglord, Oxon, Ox 10 8 DE, UK, 1990.
- Sharma, M., Pande, S., Pathak, M., Rao, J.N., Kumar, A., Reddy, M., Benagi, V.I., Mahalinga, D.M., Zhote, K.K., Karanjkar, P.N., Eksinghe, B.S. Prevalence of Phytophthora blight of pigeonpea in the Deccan Plateau of India. Plant Pathol. J., 2006; 22(4): 309-313.
- Singh, U.P., Chauhan, V.B. Oospore formation in Phytophthora drechsleri f. sp. cajani. J. Phytopath., 1988, 123: 89-91.
© The Author(s) 2017. Open Access. This article is distributed under the terms of the Creative Commons Attribution 4.0 International License which permits unrestricted use, sharing, distribution, and reproduction in any medium, provided you give appropriate credit to the original author(s) and the source, provide a link to the Creative Commons license, and indicate if changes were made.