

ISSN: 0973-7510
E-ISSN: 2581-690X
The Polyhydroxybutyrate (PHB) polymer is a biodegradable microbial polyester that is intracellularly accruing due to the depletion of nitrogen and phosphorous resources and an increase in carbon supply. As part of this research investigation, Sudan Black B staining, fermentation, chloroform-sodium hypochlorite solvent-based extraction, and characterization of extracted PHB were used to isolate and identify organisms capable of producing PHB. Brevibacterium casei (OQ519751) was used to synthesize PHB biopolymer from agro-residues (orange peel, mangosteen peel, sugarcane bagasse, water hyacinth, and jackfruit peel). Using the Response Surface Methodology (RSM) and the Central Composite Design (CCD) has proven to be highly effective for optimizing PHB synthesis. The optimal conditions determined through RSM allowed Brevibacterium casei to produce significant amounts of PHB when compared to an unoptimized medium. The model demonstrated statistical significance, as indicated by the F-value of 19.96 with an associated p-value of <0.0001. Furthermore, with an optimized pH level of 7, temperature of 37°C, and yeast extract as the nitrogen source, the carbon source water hyacinth was found to synthesize an enhanced quantity of a PHB yield of 1.29 g/L from 2.2 g/L of dry biomass (58.63%). PHB characterization was done with the aid of FTIR (Fourier-transform infrared spectroscopy), XRD (X-ray diffraction), and TGA (Thermogravimetric analysis) analysis. The degradation study of PHB films was performed by soil burial method and morphological changes were scrutinized by SEM analysis. The results reveal that utilizing water hyacinth as a feedstock employs an enhanced production of PHB. This is the first report to synthesize maximum yield of PHB from Brevibacterium casei using water hyacinth as a substrate for production.
Polyhydroxybutyrate (PHB), FTIR, XRD, TGA, SEM-analysis, Brevibacterium casei
PHA (Polyhydroxyalkanoate) is produced by over 300 bacterial species, which have demonstrated the capability to produce PHA under a broad range of conditions, including both aerobic and anaerobic environments. Furthermore, extremophiles, like halophiles, have a pivotal role in diversifying genetic resources and offering versatile production conditions for PHA.1 Currently, biodegradable plastics, which include materials like PLA, PHA, starch blends, and others, make up more than 51 percent of the global bioplastics production capacities, totaling over 1.1 million tonnes. It is projected that the production of biodegradable plastics will see a substantial increase, reaching over 3.5 million tonnes by 2027. This growth can be attributed to substantial progress made in the field of polymers, particularly in materials such as polylactic acids (PLAs) and polyhydroxyalkanoates (PHAs). With a specific focus on the PHA market, there are strong anticipations of substantial growth between the years 2022 and 2029. According to the analysis conducted by Data Bridge Market Research, the PHA market is projected to achieve a value of USD 144,530.99 million by 2029, with an expected compound annual growth rate (CAGR) of 5.4% from 2022 to 2029.2
Polyhydroxybutyrate (PHB), a homopolymer of PHA is widely popular due to its biocompatibility, biodegradability, and environmentally friendly nature. PHBs, or Polyhydroxybutyrates, are macromolecules that serve as inclusion bodies that accumulate as reserve materials when the microorganisms are exposed to various stress conditions.3 PHB has been associated with nitrogen fixation, and its biodegradability makes it a versatile choice for the production of environmentally friendly plastic films. Furthermore, due to its broad biocompatibility, PHB has found applications in the manufacture of medical devices. The use of PHBs is currently hindered by the significant expenses tied to their production, encompassing fermentation, substrates, and recovery processes. Therefore, employing waste materials has the potential to considerably decrease substrate expenses and downsize overall production costs.4 PHB’s similarity in properties to various synthetic thermoplastics like polyethylene (PE) and polypropylene (PP) suggests its potential as a viable alternative for non-biodegradable polymers.5
The Production cost of PHB is now significantly more expensive than conventional plastic, which is the main obstacle to the industrialization of biopolymers, which makes them less commonly used. The main reasons for this are the elevated substrate costs, the low PHB concentration within the growing cells, the reduced rate of PHB accumulation, and the expensive procedures involved in PHB recovery. To reduce the general PHB production expenses, one approach is to utilize more economical substrates, such as agro-residues, in conjunction with highly efficient isolation and purification procedures, thus achieving economical PHB production.6 Using oligomer hydrolase and PHB depolymerase, it’s possible to break down polyhydroxy butyrate (PHB) into 3-hydroxybutyric acid. Subsequently, the dehydrogenase enzyme can catalyze the oxidation of the produced 3-hydroxybutyric acid into acetyl acetate. When acetyl acetate reacts with β-keto thiolase, it results in the production of acetyl coenzyme A, which can be utilized for cell regeneration.7 The microbial genus including Pseudomonas, Bacillus, Microbispora, Penicillium, Aspergillus, Saccharomonospora, Actinomadura, Streptomyces, and Thermoactinomyces, have the capability to degrade PHB in an aerobic environment leading to the formation of carbon dioxide (CO2) and water (H2O). In contrast, in an anaerobic environment, PHB degradation results in the formation of carbon dioxide, hydrogen peroxide (H2O2), and methane (CH4).8 PHB can be broken down by anaerobic sludge in a variety of settings, including freshwater, saltwater, and soil. The most natural habitat for the breakdown of PHB, however, has been found to be soil.9 This section of research emphasizes a novel approach for PHB production utilizing agro-residue with the assistance of Brevibacterium casei, aiming to lower production expenses. Furthermore, the degradation of the synthesized PHB was investigated.
Procuring samples and isolation of pure cultures
Soil samples were procured from three distinct regions in the western part of Tamilnadu: Masinagudi-Niligiri, Kodaikanal-Dindigul, and Pollachi-Coimbatore. These samples were carefully transported to the laboratory under aseptic conditions. Subsequently, the soil samples underwent a series of dilutions, with 100ml from each dilution (ranging from 10-3 to 10-5) plated onto sterile minimal Davis agar plates. The incubation period for these plates ranges between 24-72 hours at 30°C. Following incubation, the morphologically distinct colonies were isolated, purified and preserved in slants at 4°C.10
Identification of PHB-producing microbe
The identification of PHB-producing isolates was carried out by examining the lipophilic inclusions found within these isolates. This screening process adhered to the protocol outlined by Getachew et al.11 The isolate was selected based on the quantification of PHB. The process of identifying the PHB-producing isolate was multifaceted in nature, encompassing microscopic examination, morphological analysis, biochemical characterization, and sequencing of partial 16S rRNA sequences. Subsequently, the obtained sequences were aligned with known 16S rRNA gene sequences from the GenBank database using the Basic Local Alignment Search Tool (BLAST) provided by the National Center for Biotechnology Information (NCBI). To establish the taxonomic classification of the isolates, a phylogenetic tree was constructed using sequences that exhibited a similarity range between 96% and 99%.12
Quantitation of proteins and carbohydrates in the agro-residues
Agro-residue was collected and subjected to a drying process at 100°C in a hot air oven for a duration of 5 to 6 hours. Further, the dried samples were pulverized into fine powder.13 The Pulverized samples were hydrolyzed by the zinc chloride method as determined in the patent.14 For protein determination, the Folin phenol reagent method was performed. The standard curve was determined using 2mg/ml bovine serum albumin solution. In each 10ml of the sample, 5ml of Folin phenol reagent was introduced and allowed to incubate at room temperature for around 10 minutes. Afterward, the Folin-Ciocalteau reagent of 0.5 ml was introduced into the mixture, and the combination was allowed to incubate for an additional 30 minutes. Following this incubation period, the absorbance was measured at 750nm.15 The determination of carbohydrate content present in the sample was carried out using the dinitrosalicylic acid (DNSA) method, with a 0.1% v/v glucose solution serving as the standard. 1.5mL of DNSA reagent was introduced to the sample, and the mixture then was incubated using a water bath for 15 minutes at a temperature of 90°C until a noticeable red-brown color change took place. Additionally, 10mL of distilled water was incorporated to evaluate the stability of the resulting color. After the samples had cooled, their absorbance was measured at 540nm to determine the concentration in µg/ml.16
Optimization studies of PHB production
The PHB-producing isolate was undergone optimization for increasing the yield of PHB which was carried out by shake flask culture method. The media used is same as mentioned earlier but for comparison different substrates were utilized such as carbon sources (sucrose, glucose, fructose, lactose, starch); agro waste (orange peel, mangosteen peel, sugarcane bagasse, water hyacinth, and jackfruit peel); nitrogen sources (ammonium chloride, ammonium sulphate, tryptone, yeast extract, peptone); NaCl concentration (0.1%, 0.2%, 0.3%, 0.4%, 0.5%); pH (5,6,7,8,9) and temperature (28°C, 33°C, 35°C, 37°C, 40°C) was taken. Inoculum was prepared and 10ml of 24hr culture was used for 100ml production media. Fermentation was carried out for 24-72 hr during the process PHB production was analyzed by staining method.17
Optimization studies for scaling-up of PHB production by response surface methodology
To optimize PHB production, the Response Surface Methodology (RSM) was employed, contrasting with the classical one-factor-at-a-time (OFAT) approach. In this study, key independent variables (rice bran, peptone, and temperature) were optimized through the application of the Central Composite Design (CCD) statistical technique. The goal was to enhance PHB production while maintaining other variables at constant levels. The design matrix included five levels for each independent variable (-a, -1, 0, +1, +a), where a was set at ±1.6817. A total of 20 experiments were conducted, with six replicates of the central points, using Design Expert® software version 12.0 (Stat-Ease, Minneapolis, MN, USA) (Table 1). The goodness of fit for the quadratic equation was assessed using the coefficient R2, and the statistical significance was determined via the F-test. Additionally, the t-test was employed to ascertain the significance of each variable’s impact on PHB production. The results obtained from the CCD were subjected to analysis of variance (ANOVA) (Table 2). The data were then interpreted to generate a response surface in the form of contours and 3D plots, which effectively illustrated the interactions among the factors involved.18
Table (1):
Variables optimized by CCD for PHB production
| Name of Variable with Code | Unit | Range and Levels | ||
|---|---|---|---|---|
| −1 | 0 | +1 | ||
| Water hyacinth (A) | g/L | 5 | 12 | 20 |
| Peptone (B) | g/L | 2 | 5 | 8 |
| pH (C) | – | 5 | 7 | 9 |
| Temperature (D) | °C | 28 | 34 | 40 |
Table (2):
Central composite design along with experimental and predicted values of dependent variable for PHB production
Run |
Blk |
A |
B |
C |
D |
|---|---|---|---|---|---|
1 |
1 |
2 |
0 |
0 |
0 |
2 |
1 |
1 |
-1 |
1 |
1 |
3 |
1 |
1 |
1 |
1 |
-1 |
4 |
1 |
0 |
0 |
0 |
0 |
5 |
1 |
-1 |
-1 |
1 |
-1 |
6 |
1 |
0 |
2 |
0 |
0 |
7 |
1 |
-2 |
0 |
0 |
0 |
8 |
1 |
0 |
0 |
0 |
0 |
9 |
1 |
1 |
1 |
-1 |
-1 |
10 |
1 |
-1 |
-1 |
-1 |
-1 |
11 |
1 |
1 |
-1 |
1 |
-1 |
12 |
1 |
0 |
-2 |
0 |
0 |
13 |
1 |
0 |
0 |
0 |
0 |
14 |
1 |
-1 |
-1 |
1 |
1 |
15 |
1 |
0 |
0 |
2 |
0 |
16 |
1 |
0 |
0 |
0 |
0 |
17 |
1 |
-1 |
1 |
1 |
1 |
18 |
1 |
0 |
0 |
0 |
0 |
19 |
1 |
0 |
0 |
-2 |
0 |
20 |
1 |
1 |
-1 |
-1 |
-1 |
21 |
1 |
0 |
0 |
0 |
0 |
22 |
1 |
-1 |
-1 |
-1 |
1 |
23 |
1 |
1 |
-1 |
-1 |
1 |
24 |
1 |
0 |
0 |
0 |
-2 |
25 |
1 |
1 |
1 |
1 |
1 |
26 |
1 |
-1 |
1 |
-1 |
-1 |
27 |
1 |
1 |
1 |
-1 |
1 |
28 |
1 |
0 |
0 |
0 |
0 |
29 |
1 |
-1 |
1 |
1 |
-1 |
30 |
1 |
-1 |
1 |
-1 |
1 |
31 |
1 |
0 |
0 |
0 |
2 |
Extraction, purification, and determination of PHB
The screened isolate was cultivated, and 10ml of freshly prepared inoculum was introduced into every 1L of production media. Following cultivation, The cell pellets were harvested and subjected to drying at a temperature of 105°C for a duration of 24 hours. PHB was extracted from the dried pellet using a solvent extraction method that involved the use of Chloroform and Sodium hypochlorite. The quantity of PHB in the sample was assessed using the standard crotonic acid assay. In this assay, when subjected to heating with concentrated H2SO4 (sulfuric acid), PHB underwent a transformation, resulting in the production of crotonic acid. The quantification of PHB was achieved by determining the amount of crotonic acid generated; the amount of crotonic acid was quantified in terms of PHB per gram of cells, utilizing a standard curve. After fermentation, the biomass was collected by subjecting it to centrifugation at 10,000 (rpm) for a duration of 15 minutes.19 The dry mass of the extracted PHB was quantified in grams per liter (g/L). The residual biomass was determined by calculating the difference between the dry cell weight and the dry weight of PHB. The percentage of total accumulated PHB was then assessed as the proportion of PHB within the dry cell weight, expressed in terms of percentage.20
Residual biomass (g/ml) = DCW (g/ml) – Dry mass of obtained PHB (g/ml)
PHB accumulation (%) = Dry mass of obtained PHB (g/ml) x 100 / DCW (g/ml)
Characterization of PHB by FTIR analysis
The extracted polymer was subjected to qualitative analysis using Fourier-transform infrared spectroscopy (FTIR) to detect and identify the presence of different functional groups. An ATR-IR technique with a focal plane array (FPA) detector was employed for measuring the IR spectra. The spectral data were recorded with a spectral resolution of 4 cm-1 and 64 scans, spanning the range of about 4000 cm-1 to 400 cm-1.21
Characterization of PHB by XRD analysis
The aim was to investigate the crystalline properties of the PHB samples, where XRD (X-ray diffraction) spectroscopy was conducted with the aid of Bruker D8-Advance diffractometer. Cu-Ka radiation (l = 1.54 ֵ) was employed within a range of 2θ = 1–50° at room temperature, and the scan rate was set at 3° per minute.22
Characterization of PHB by TGA analysis
The thermal stability of both the standard and extracted PHB samples was assessed through thermogravimetric analysis (TGA). This analysis was conducted across a temperature range from 30°C to 600°C, employing a heating rate of 10°C per minute, all under a controlled nitrogen atmosphere (N2 flow rate = 40 mL/min). To determine the rate of degradation of the obtained PHB samples, temperature data corresponding to T5%, T10%, and T50% were observed and extracted from the results of the TGA analysis.23
Biodegradation of PHB
A soil burial test provides insight into the biodegradability and durability of polymer samples in a particular soil under natural environmental circumstances. PHB films weighing 0.5 gm each were placed beneath the surface at a depth of 3 cm in soil-filled pots at an ambient temperature ranging between 35°C and 37°C. The films were initially segmented into 1 x 1 cm pieces and then enclosed within non-degradable mesh bags measuring 8 x 4 cm. Every film sample was meticulously prepared in triplicate, involving precise weighing, and subsequently sealed with non-degradable thread.24 The PHB films degraded by the soil burial method were subjected to assessment of weight loss percentage employing the following formula:
Degradation % = [(W1 – W2)/W1] *100
Quantitative microbial counting
Microbial growth in the soil, where the PHB films were buried, was systematically monitored on a weekly basis employing the standard spread plate technique. This process involved the collection of a 1-gram soil sample from the designated sites. The soil was then carefully washed with a sterile saline solution (99 ml, 0.95%); the mixture was gently agitated using a vortex machine. Consequently, a series of steps, including serial dilution and decantation, were performed as part of the procedure. In this procedure, each dilution of 100 µl was evenly spread onto sterile tryptic soy agar plates, and this process was repeated three times for each dilution. The plates were then placed in an incubator at 30°C for approximately 48 hours. After incubation, the colonies, ranging from 30 to 300 in number, were carefully observed and counted. This count was used to determine the colony-forming units (CFU) for each sample, usually expressed in logarithmic form as log10 CFU/ml.25
SEM analysis
PHB films subjected to degradation by soil burial method were analyzed using a scanning electron microscope (SEM) for detailed morphological determination. Before subjecting the PHB films to SEM (Scanning Electron Microscopy) analysis, they were first treated with a solution of 4% (v/v) glutaraldehyde in a buffer with a pH of 7.2. After the glutaraldehyde fixation, the PHB films underwent an additional treatment involving a 20% aqueous osmium tetroxide solution. Subsequently, they were dried to the critical point and then scrutinized under the SEM for observing any morphological differences occurred during the degradation process.26
Statistical analysis
Each experiment was performed in triplicate, and the results were expressed as means ± SDs. Minitab Statistical Software Version 21.1.0 was used for the analyses.
Characterization of PHB-producing isolate
Within the pool of 53 distinct isolates, it was found that 18 of them (Table 3) exhibited the ability to produce PHB. To identify lipophilic inclusion, these strains underwent an initial screening process using the Sudan black staining method, which serves as a preliminary assessment. By the microscopic observation (Figure 1) and quantification studies among 7 isolates (Table 4), one isolate P12 was observed to be a potent PHB producer which was then cultured and maintained for further studies.
Table (3):
Analysis of soil samples collected from various parts of Tamilnadu, India
Location |
Geographical coordinates |
Complete count of Isolates |
Positive count of Isolates |
Negative count of Isolates |
|---|---|---|---|---|
Masinagudi |
11o34′.0896”N/ 76°38′.829 ” E |
16 (M1-M16) |
6 (M4,M5,M7,M9,M11,M12) |
10 |
Kodaikanal |
10°13’48.00″N/ 77°28’12.00″ E |
25 (K1-K25) |
8 (K3,K4,K5,K7,K17,K20,K23,K25) |
17 |
Pollachi |
10° 39′ 36.7452” N / 76° 59′ 48.2172” E |
12 (P1-P12) |
4 (P4,P9,P10,P12) |
8 |
Table (4):
PHB quantification studies of screened 7 isolates performed using Minimal Davis media at pH 7, 37°C, 150 rpm after 48hrs of incubation
Isolates |
Dry Biomass |
PHB |
Residual Biomass |
PHB % |
|---|---|---|---|---|
P9 |
1.9 ± 0.03 |
0.24 ± 0.01 |
1.65 ±0.03 |
12.8 |
M15 |
1.66 ± 0.02 |
0.37 ± 0.02 |
1.29 ± 0.01 |
22.28 |
M10 |
1.06 ± 0.05 |
0.14 ± 0.02 |
0.92 ± 0.05 |
13.73 |
K5 |
1.43 ± 0.05 |
0.14 ± 0.01 |
1.28 ± 0.04 |
10.01 |
P12 |
1.92 ± 0.06 |
0.71 ± 0.02 |
1.21 ± 0.1 |
37.09 |
K23 |
1.25 ± 0.05 |
0.21 ± 0.02 |
1.04 ± 0.01 |
17.15 |
P10 |
1.13 ± 0.05 |
0.26 ± 0.02 |
0.87 ± 0.06 |
22.94 |
* Data represented in the table as Mean ± SD (n=3)
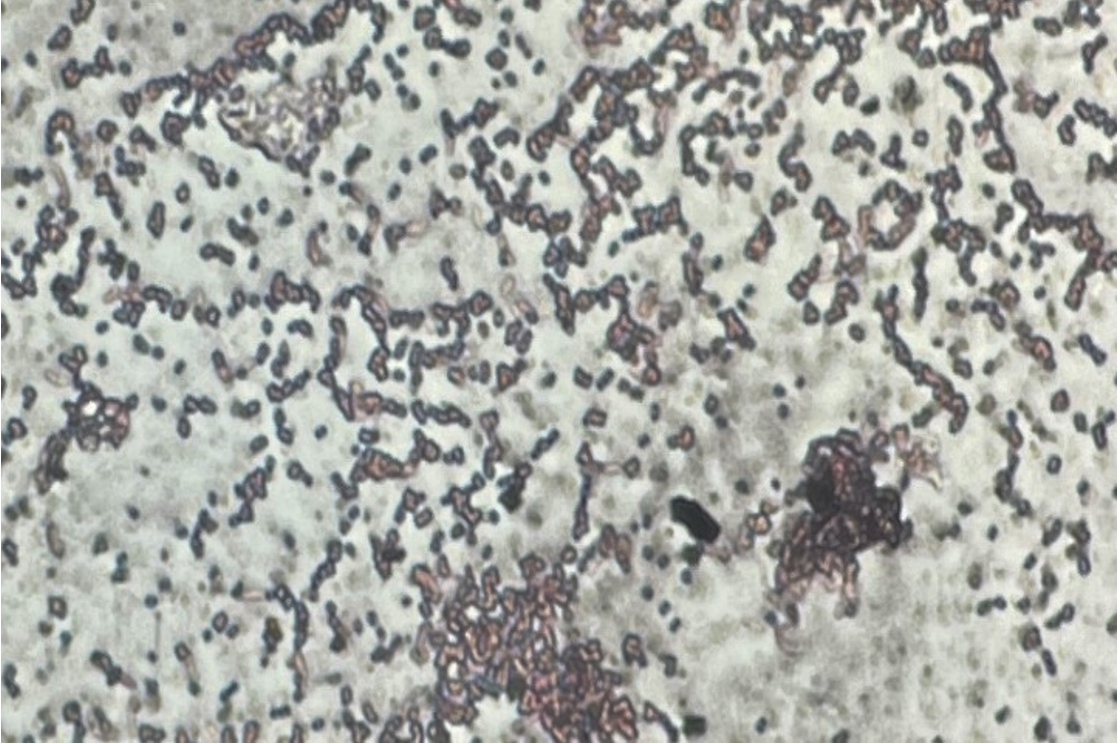
Figure 1. Phase contrast microscopic observation of potent PHB producer
Identification of potent PHB producer
The morphological characteristics as shown in Table 5 and biochemical properties as indicated in Table 6, the characteristics of the exceptionally productive PHB isolate closely matched for the genus Brevibacterium as per the descriptions outlined in Bergey’s Manual Systematic Bacteriology. Examination of the sequence data in Genbank revealed that the query sequence exhibited the highest homology with Brevibacterium casei, demonstrating a similarity rate of 93% (accession number OQ519751). As a result, the identification of the selected and most potent isolate was confirmed to be Brevibacterium casei and The construction of the phylogenetic tree was achieved using MEGA11 software (Figure 2).
Table (5):
Morphological characteristics of P12
Morphological characterization |
P12 |
|---|---|
Cell Shape |
Rod |
Colony texture |
Rough |
Opacity |
Translucent |
Margin |
Irregular |
Pigmentation |
White – gray |
Motility |
– |
Gram staining |
+ |
Endospore staining |
– |
O2 tolerance |
Obligate aerobe |
Table (6):
Biochemical characteristics of P12
Biochemical characterization |
P12 |
|---|---|
Indole |
+ |
Methyl red (MR) |
+ |
Voges proskauer (VP) |
+ |
Citrate |
+ |
Catalase |
+ |
Oxidase |
– |
Probable genus |
Breviacterium |
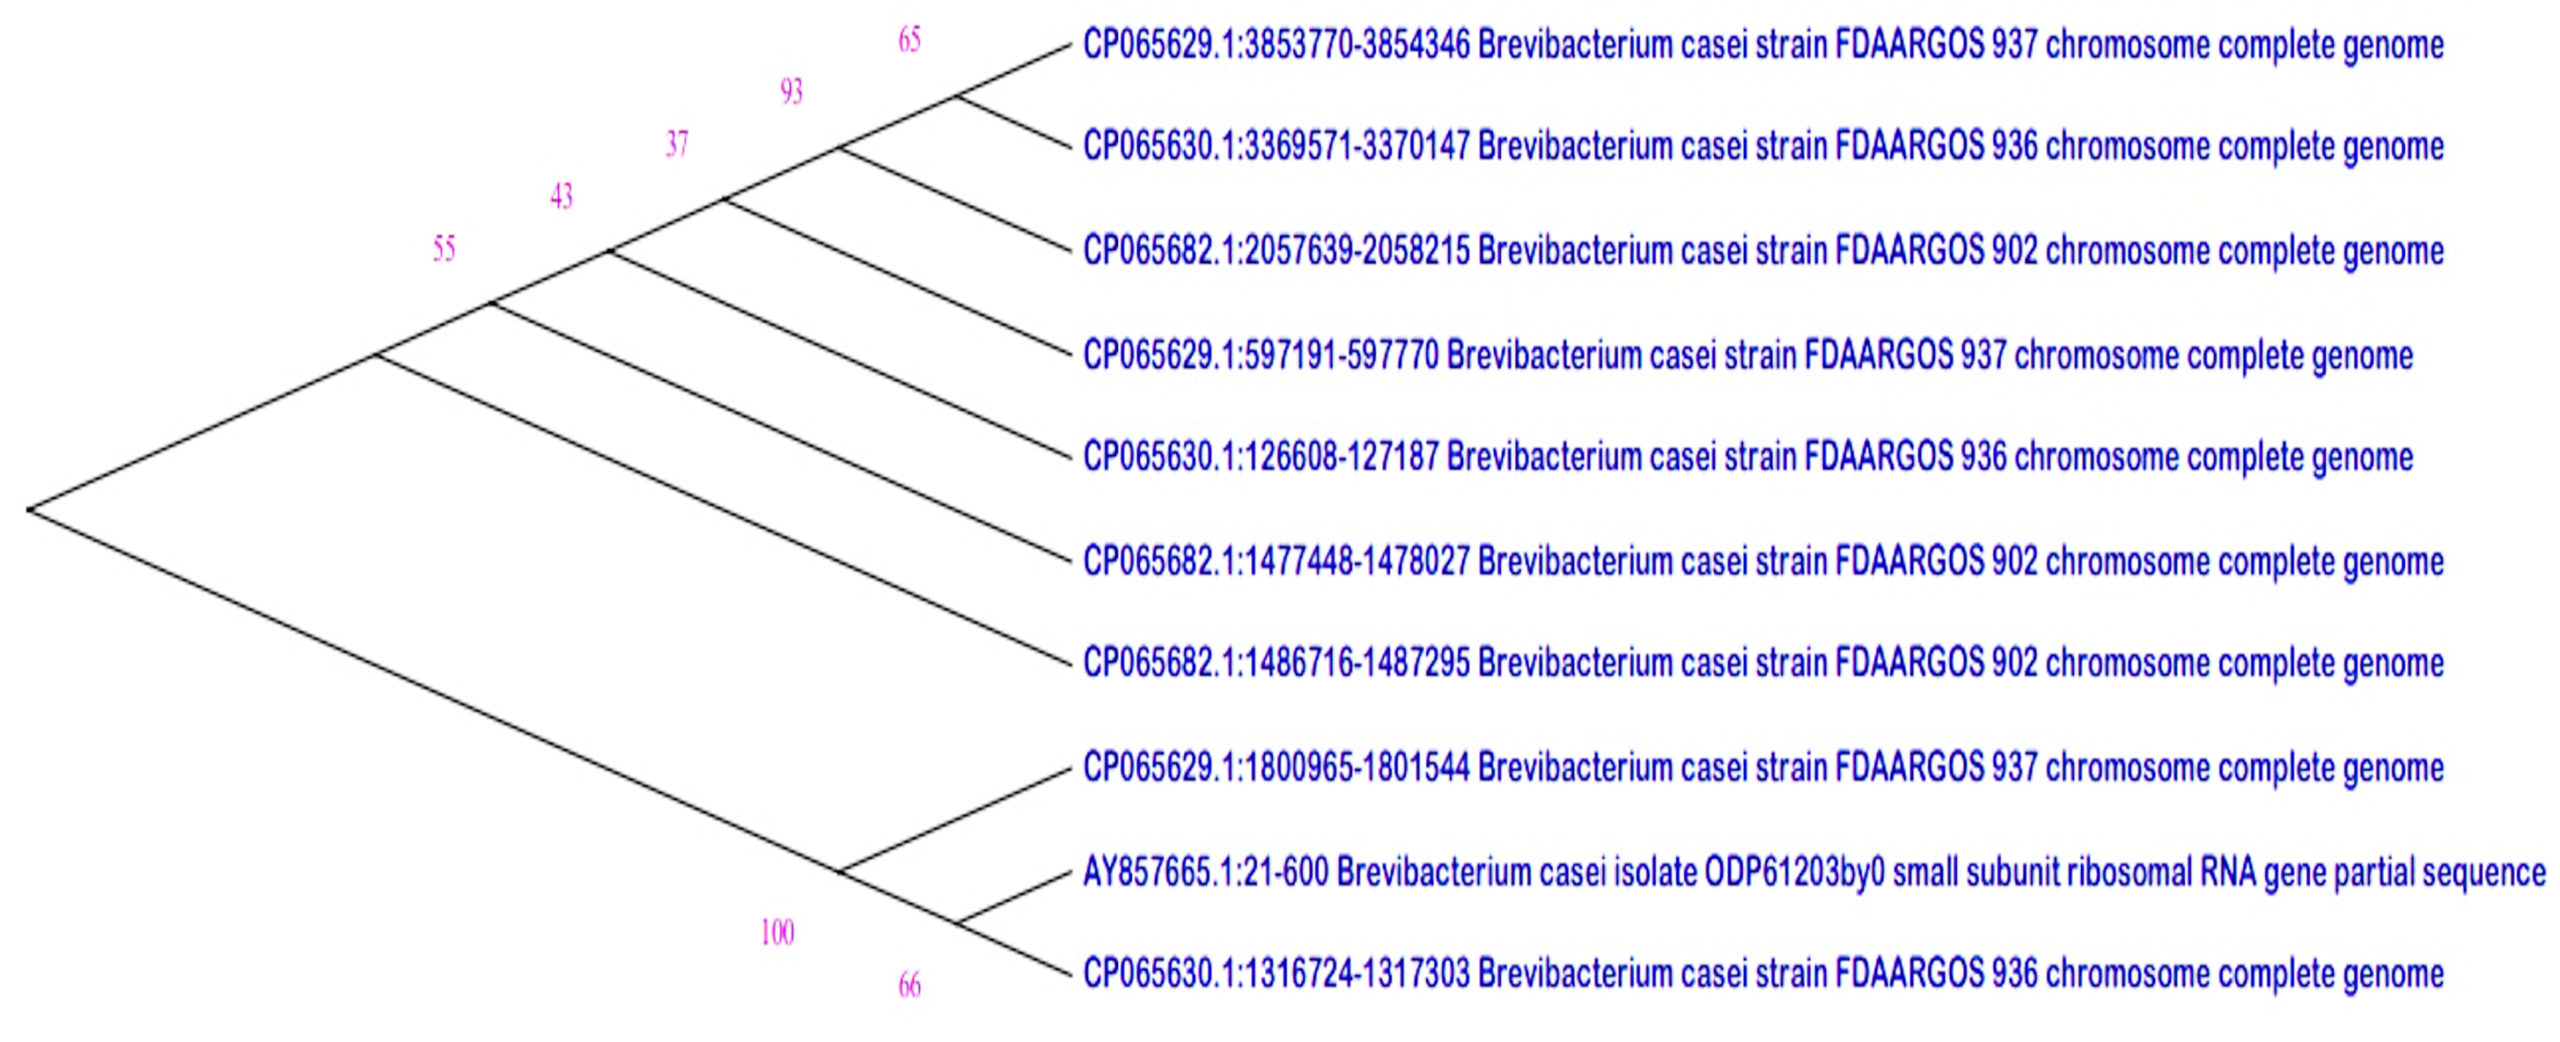
Figure 2. Phylogenetic tree of PHB potent strain P12
Quantitation of proteins and carbohydrates in the agro-residues
A study focused on agro-residues explored their protein content, revealing that water hyacinth exhibited the highest protein levels among the substrates studied. Moreover, by employing the DNSA method to gauge carbohydrate content, it was determined that water hyacinth contained the most significant amount of carbohydrates when compared to the other substrates analyzed (Table 7).
Table (7):
Content of carbohydrate and protein of the agro residue (µg/ml)
Agro residue |
Carbohydrate content |
Protein content |
|---|---|---|
Orange peel |
6.60 ± 0.095 |
8.18 ± 0.91 |
Water hyacinth |
7.96 ± 0.062 |
15.11 ± 0.72 |
Sugarcane bagasse |
6.04 ± 0.034 |
10.06 ± 0.70 |
Mangosteen peel |
5.51 ± 0.045 |
13.5 ± 0.81 |
Jackfruit peel |
7.83 ± 0.09 |
14.2 ± 0.37 |
*Data represented in the table as Mean ± SD (n=3)
Optimization studies
The optimum temperature for PHB production by Brevibacterium casei OQ519751 was observed to be 35°C with PHB accumulation of about 58.07% and finest pH was observed to be pH 7 with PHB accumulation of about 56.71% of the total dry biomass. Glucose was observed to be a fine carbon source for PHB production by Brevibacterium casei with 57.35% of PHB. Among the agro waste water hyacinth was observed to be best for PHB production with PHB production 58.63% of the total dry biomass which is equivalent to the PHB production carried out using orange peel with production rate of 40.83%. Peptone led to 55.93% of PHB production, which was equivalent to Ammonium chloride with PHB production of 33.93%. PHB production was least using Starch as carbon source with production rate of 35.81% and among the agro residue jackfruit peel was observed to have least PHB production rate of about 23.1%. (Table 8).
Table (8):
Optimisation studies for PHB production
| Parameter/nutrient | Dry biomass (g/l) | PHB (g/l) | PHB Accumulation (%) |
|---|---|---|---|
| CARBON SOURCE | |||
| Sucrose | 2.56 ± 0.23 | 1.17 ± 0.03 | 46.19 |
| Glucose | 2.22 ± 0.3 | 1.26 ± 0.02 | 57.35 |
| Fructose | 2.85 ± 0.05 | 0.93 ± 0.01 | 32.75 |
| Lactose | 2.9 ± 0.07 | 0.85 ± 0.02 | 29.52 |
| Starch | 2.13 ± 0.09 | 0.76 ± 0.02 | 35.81 |
| AGRO WASTE | |||
| Orange peel | 2.5 ± 0.3 | 1.03 ± 0.02 | 40.83 |
| Water hyacinth | 2.2 ± 0.06 | 1.29 ± 0.06 | 58.63 |
| Sugarcane bagasse | 2.58 ± 0.21 | 0.72 ± 0.05 | 27.97 |
| Mangosteen peel | 2.84 ± 0.05 | 0.66 ± 0.02 | 23.22 |
| Jackfruit peel | 2.72 ± 0.16 | 0.62 ± 0.02 | 23.1 |
| NITROGEN SOURCE | |||
| Ammonium chloride | 2.25 ± 0.2 | 0.76 ± 0.02 | 33.93 |
| Ammonium sulphate | 2.25 ± 0.17 | 0.65 ± 0.02 | 28.98 |
| Peptone | 2.27 ± 0.08 | 1.27 ± 0.04 | 55.93 |
| Tryptone | 2.23 ± 0.13 | 0.92 ± 0.03 | 41.57 |
| Yeast extract | 2.27 ± 0.23 | 0.75 ± 0.02 | 33.48 |
| pH | |||
| 5 | 3.52 ± 0.21 | 0.96 ± 0.03 | 27.34 |
| 6 | 2.49 ± 0.26 | 1.11 ± 0.05 | 45.14 |
| 7 | 1.91 ± 0.02 | 1.08 ± 0.05 | 56.71 |
| 8 | 1.86 ± 0.03 | 0.68 ± 0.01 | 36.98 |
| 9 | 1.92 ± 0.05 | 0.77 ± 0.01 | 40.33 |
| TEMPERATURE | |||
| 28°C | 2.86 ± 0.1 | 0.72 ± 0.03 | 25.44 |
| 33°C | 2.14 ± 0.1 | 0.82 ± 0.02 | 38.60 |
| 35°C | 1.8 ± 0.01 | 1.04 ± 0.1 | 58.07 |
| 37°C | 2.26 ± 0.14 | 0.84 ± 0.03 | 37.36 |
| 40°C | 2.41 ± 0.1 | 0.85 ± 0.04 | 35.22 |
*Data represented in the table as Mean ± SD (n=3)
Optimization studies of Brevibacterium casei OQ519751 under various nutritional and environmental parameters.
Optimization studies for PHB production by response surface methodology
In this study, a Central Composite Design (CCD) was utilized to investigate the interactions among three independent variables: Water hyacinth concentration, peptone concentration, pH level, and temperature, with the aim of determining their optimal levels for PHB (Polyhydroxybutyrate) accumulation. The comprehensive experimental matrix, comprising both actual and predicted responses, is presented in Table 2. In each experimental run, the response values (Y = PHB production) were obtained as the average of triplicate measurements.
The results revealed significant variations in PHB production by the Brevibacterium casei strain P12, indicating the clear influence of the manipulated process variables within their specified ranges (as detailed in Table 2). Specifically, the medium containing 12 g/L of Water hyacinth, 3 g/L of peptone, and a temperature of 34°C yielded the highest PHB production, with a value of 1.39 g/L. Conversely, the medium comprising 20 g/L of Water hyacinth, 7 g/L of peptone, and a temperature of 38°C resulted in the lowest PHB production, measuring just 0.01 g/L.
A quadratic equation was employed to model and assess the impact of each independent variable on the response variable:
Y = -9.77 + 0.1209 A + 0.2982 B + 0.733 C + 0.4026 D – 0.002592 A2 – 0.02251 B2 – 0.04478 C2 – 0.005232 D2- 0.00007 A*B – 0.00100 A*C – 0.000642 A*D + 0.00437 B*C – 0.00258 B*D – 0.00432 C*D
The quadratic equation used for modeling the relationship between the predicted response (Y) and the independent variables is represented as follows, where A, B, C, and D are the coded values of the respective test variables: Water hyacinth (g/L), peptone (g/L), pH, and
temperature (°C).
An analysis of variance (ANOVA) was employed to examine the regression coefficient, prediction equations, and case statistics. To evaluate the model’s adequacy, an ANOVA was conducted and subsequently validated using Fisher’s statistical analysis, with the outcomes summarized in Table 9. The model exhibited significance, with an F-value of 19.96 and a p-value of <0.0001. Furthermore, the F-value for “Lack of Fit” was 16.84, suggesting that it was not significantly different from pure error. Notably, the “Pred R-Squared” of 68.89% aligns with the “Adj R-Squared” of 89.84%.
Table (9):
Analysis of Variance (ANOVA) for the Production of Polyhydroxybutyrate (PHB) as a Function of Independent Variables
Source |
df |
Adj SS |
Adj MS |
F-Value |
P-Value Probe >F |
|---|---|---|---|---|---|
Model |
14 |
4.07295 |
0.29093 |
19.96 |
|
Linear |
4 |
1.13446 |
0.28361 |
19.46 |
|
A: Water hyacinth |
1 |
0.97480 |
0.97480 |
66.87 |
|
B: Peptone |
1 |
0.05028 |
0.05028 |
3.45 |
0.082 |
C: pH |
1 |
0.09331 |
0.09331 |
6.40 |
0.022* |
D: Temperature |
1 |
0.01606 |
0.01606 |
1.10 |
0.309 |
Square |
4 |
2.83310 |
0.70827 |
48.59 |
|
A2 |
1 |
0.60803 |
0.60803 |
41.71 |
|
B2 |
1 |
1.17319 |
1.17319 |
80.48 |
|
C2 |
1 |
0.91765 |
0.91765 |
62.95 |
|
D2 |
1 |
1.01466 |
1.01466 |
69.61 |
|
2-Way Interaction |
6 |
0.10540 |
0.01757 |
1.21 |
0.353 |
A*B |
1 |
0.00004 |
0.00004 |
0.00 |
0.956 |
A*C |
1 |
0.00360 |
0.00360 |
0.25 |
0.626 |
A*D |
1 |
0.01336 |
0.01336 |
0.92 |
0.353 |
B*C |
1 |
0.01102 |
0.01102 |
0.76 |
0.397 |
B*D |
1 |
0.03439 |
0.03439 |
2.36 |
0.144 |
C*D |
1 |
0.04299 |
0.04299 |
2.95 |
0.105 |
Error |
16 |
0.23324 |
0.01458 |
||
Lack-of-Fit |
10 |
0.23241 |
0.02324 |
16.84 |
|
Pure Error |
6 |
0.00083 |
0.00014 |
||
Total |
30 |
4.30619 |
df: degree of freedom; * significant.
Based on the statistical analysis, it was observed that PHB production initially increased significantly up to a certain point and then began to gradually decrease as it reached higher levels. This trend suggests that there may be an optimal set of conditions for maximizing PHB production. Furthermore, the diagnostic plots indicated that the model met the assumptions of analysis-of-variance and demonstrated the accuracy and suitability of Response Surface Methodology (RSM) for optimizing the PHB production process (Figure 3-8).
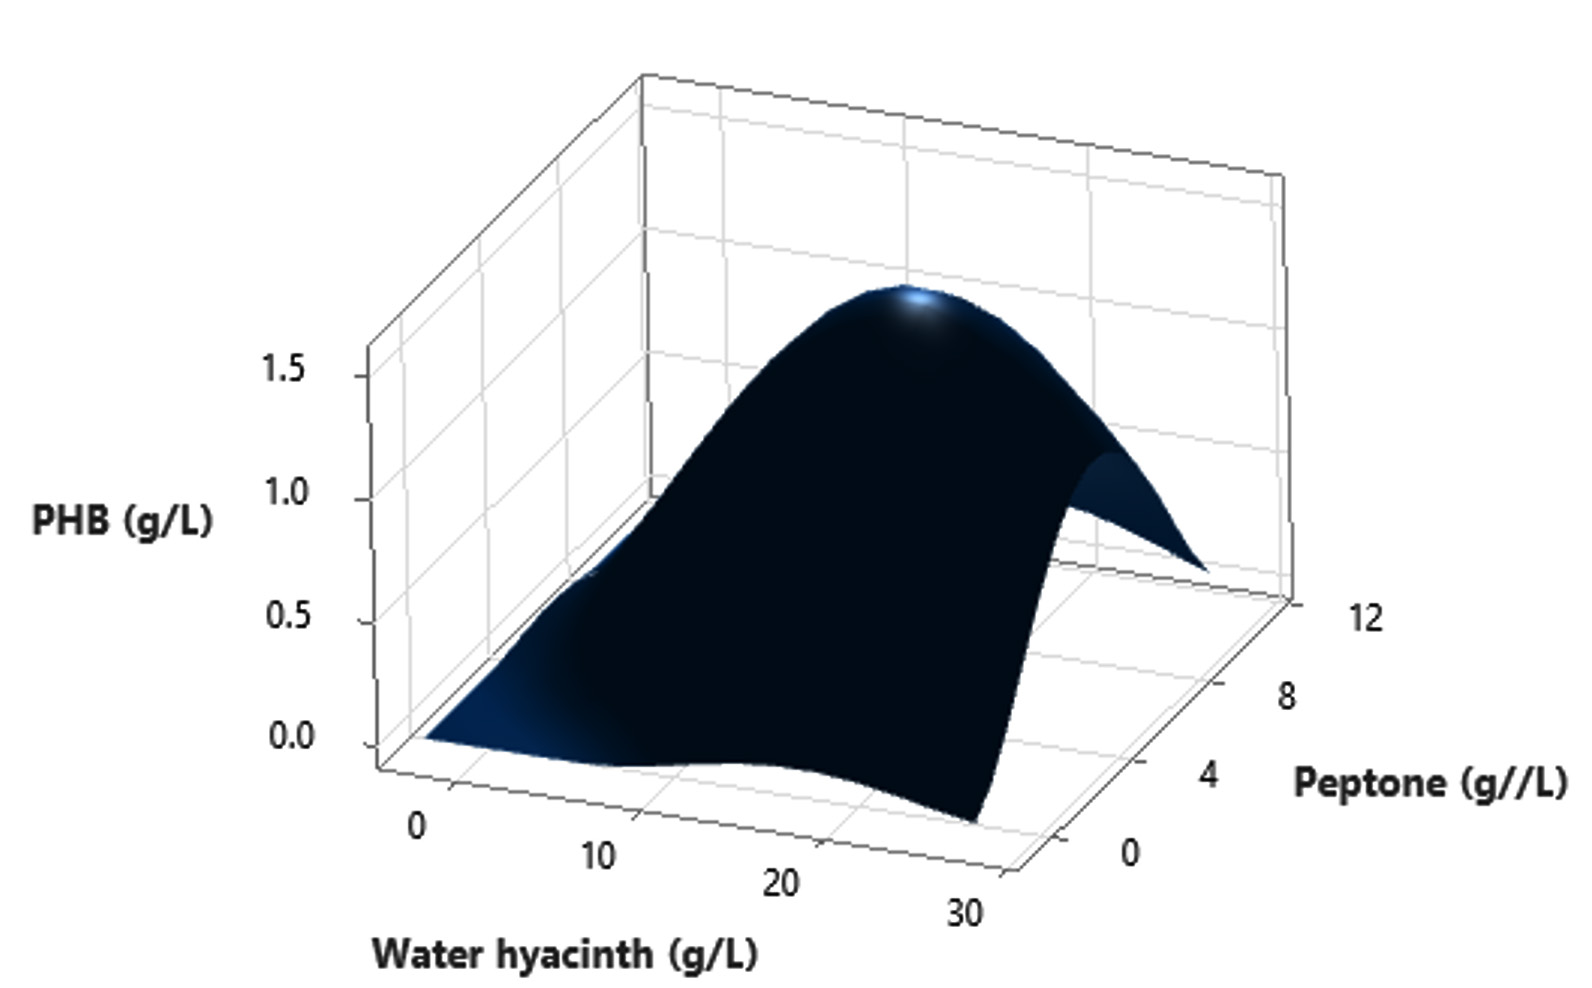
Figure 3. Peptone interaction with water hyacinth for PHB yield
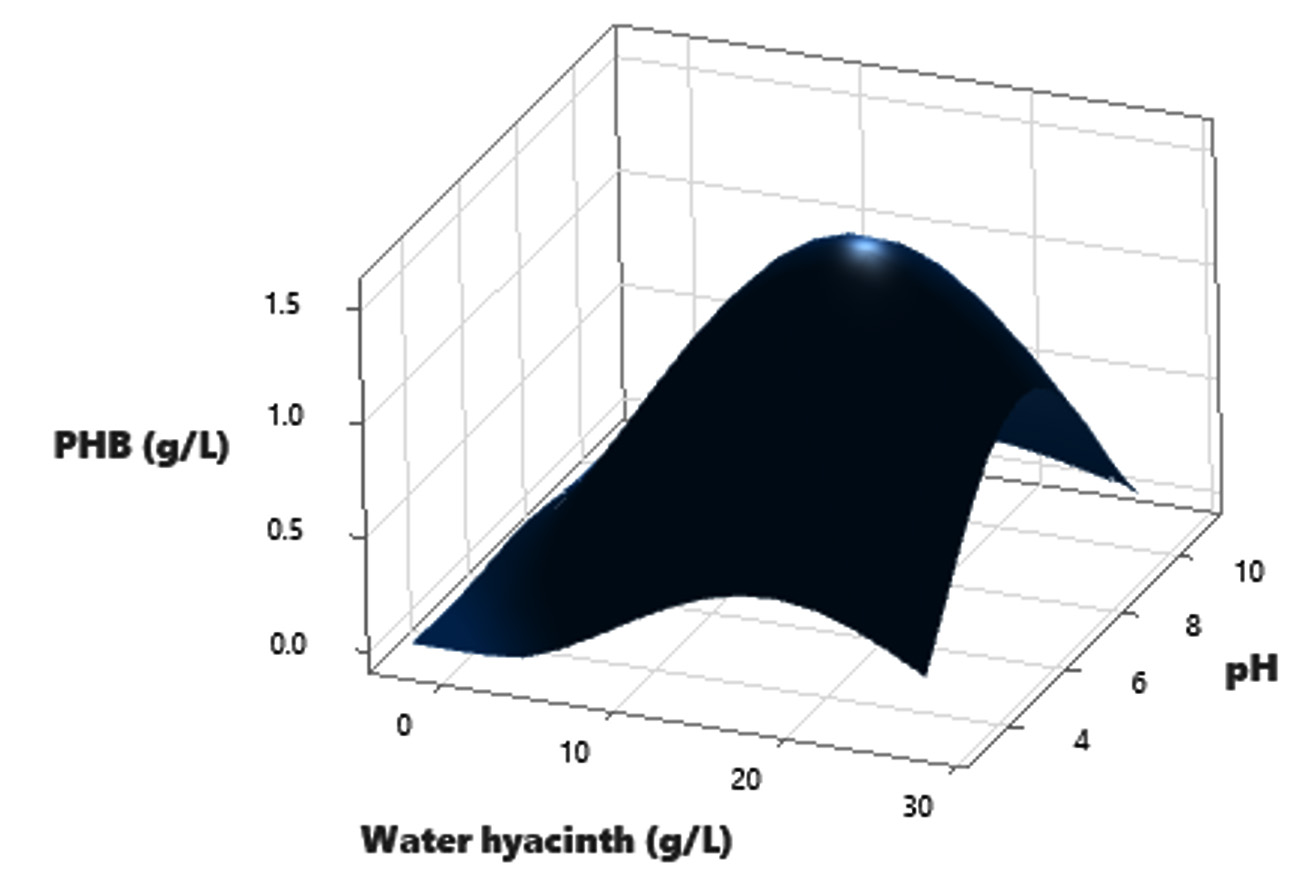
Figure 4. pH interaction with waterhyacinth for PHB yield
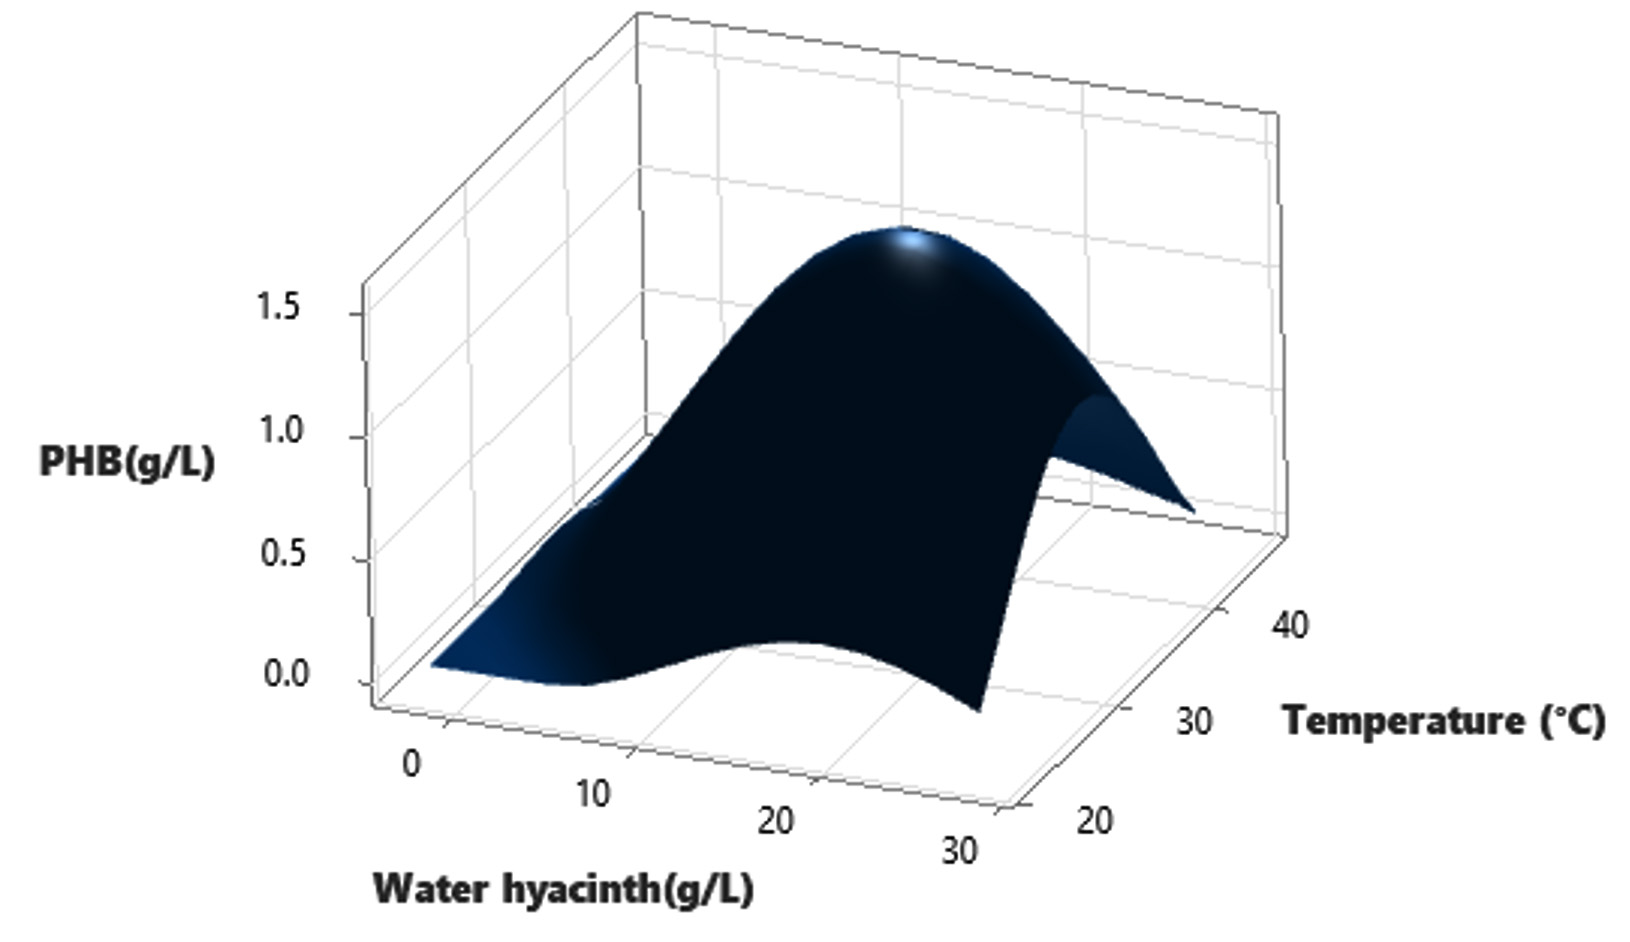
Figure 5. Temperature interaction with Water hyacinth for PHB yield
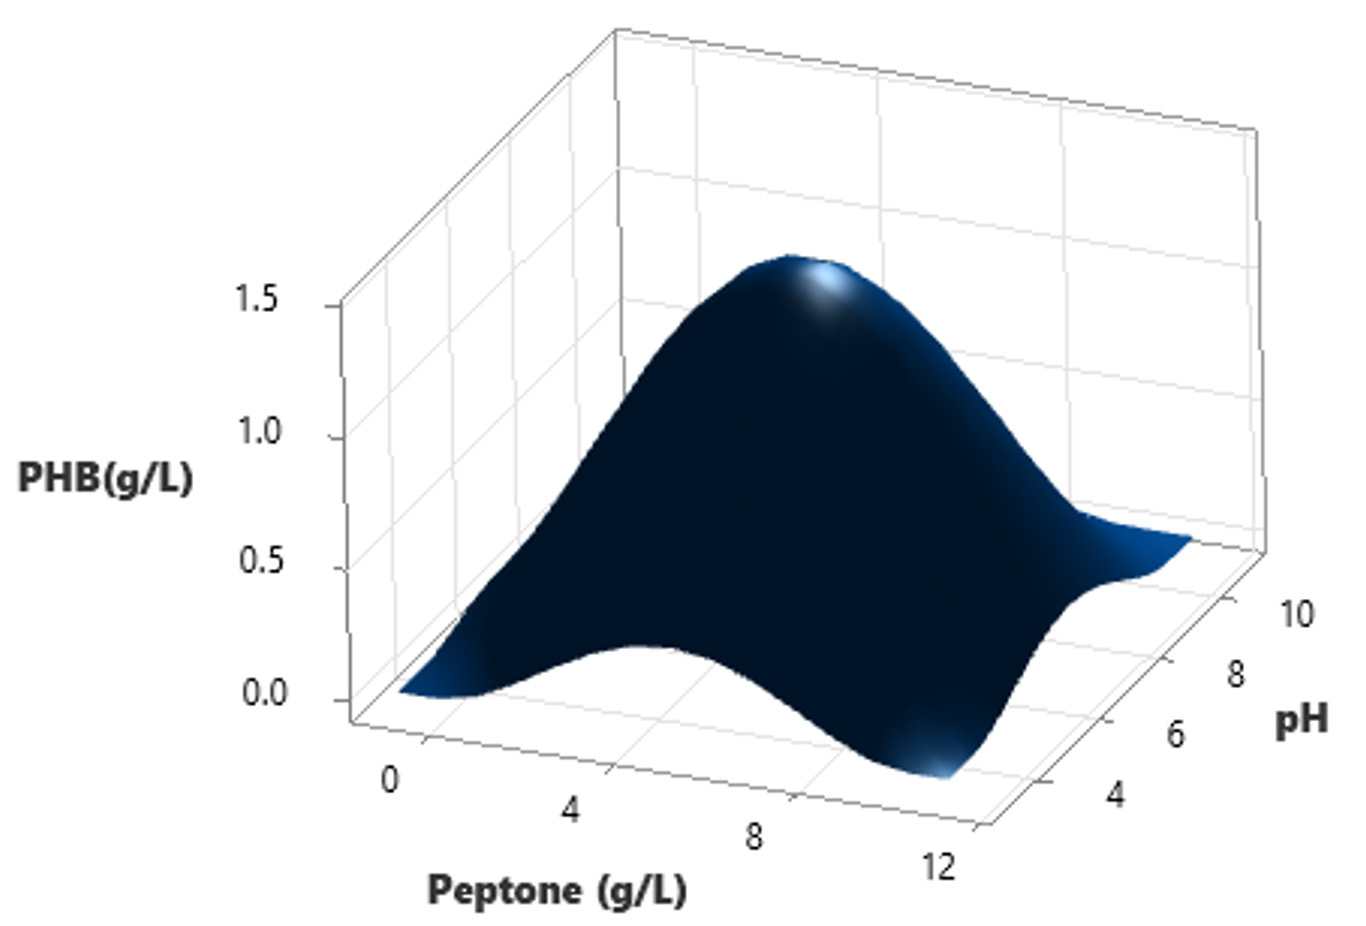
Figure 6. Peptone interaction with pH for PHB yield
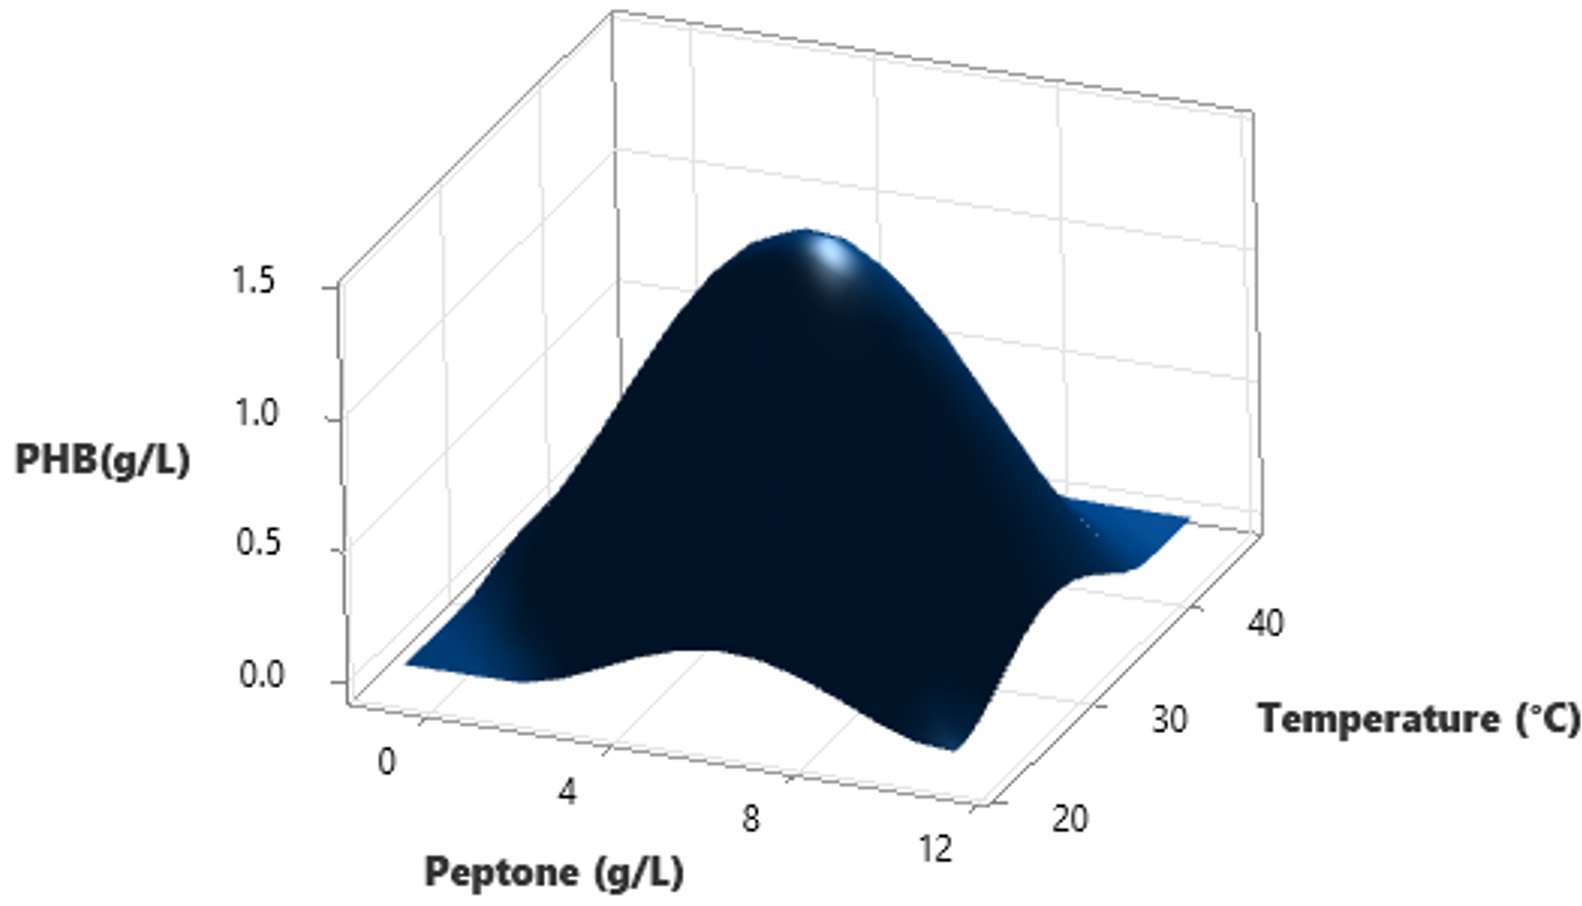
Figure 7. Peptone interaction with Temperature for PHB yield
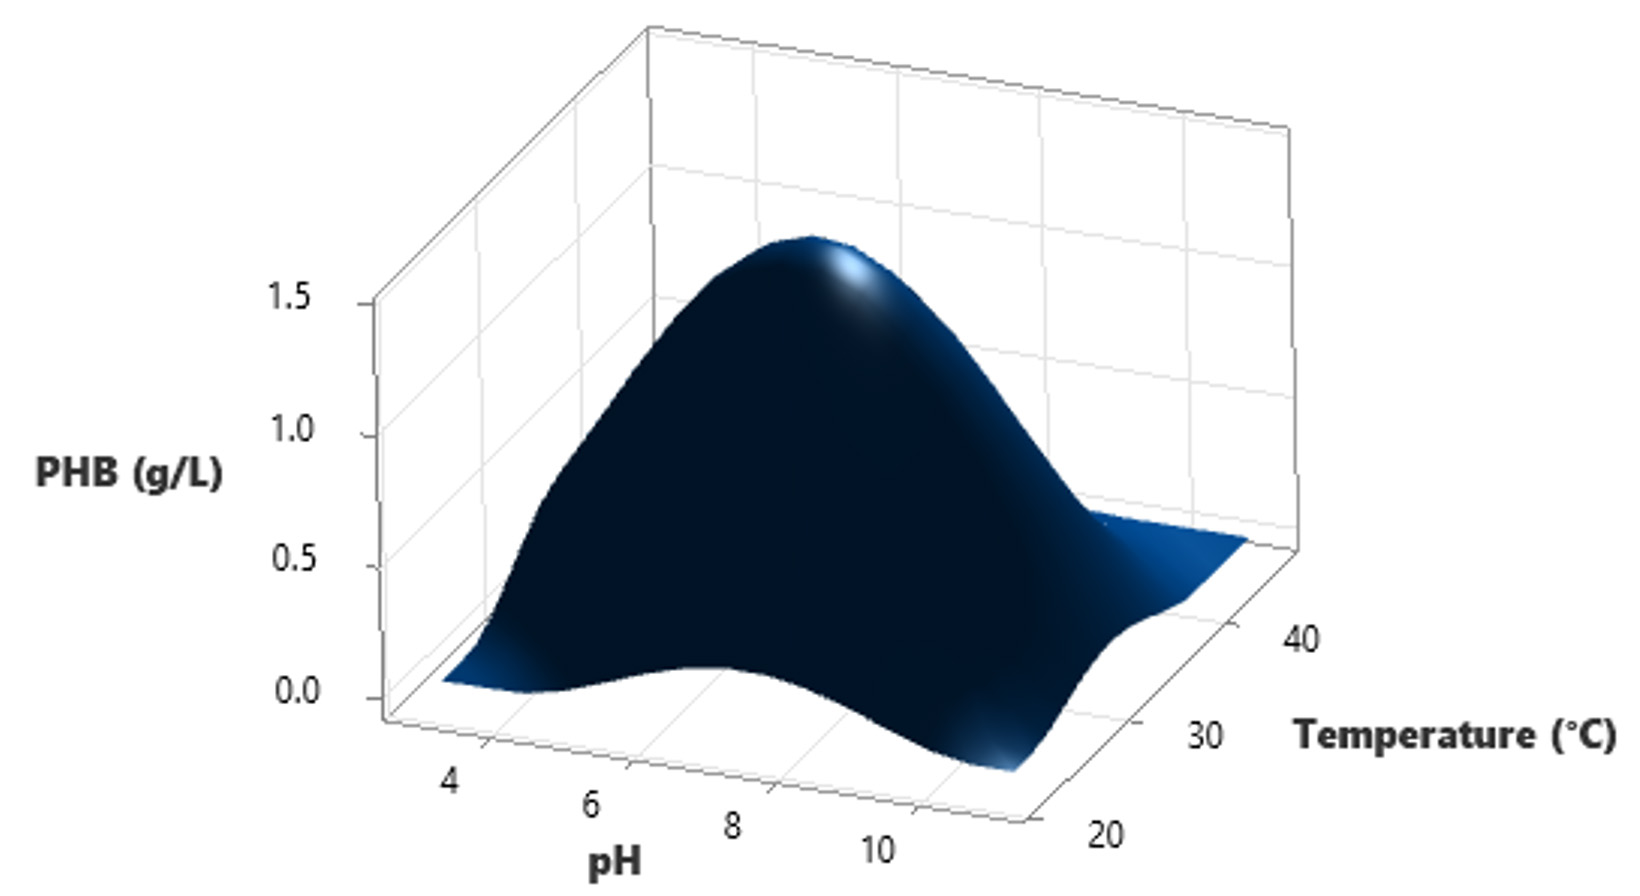
Figure 8. pH interaction with Temperature for PHB yield
Synthesis and quantification of PHB
After optimization, Water hyacinth was found to be a preferable Carbon source with nitrogen source as yeast extract at an optimum temperature 37°C and pH 7 for scaling up of PHB production. The results of the qualitative screening following fermentation are depicted, and the quantitative analysis using crotonic acid reveals a PHB concentration of 77.9µg/ml (Figure 9 and Table 10). Remarkably, a total PHB yield of 7.7 g/L was achieved utilizing 12.3g of total dry biomass.
Table (10):
Quantification of PHB
Concen. (mg/ml) |
PHB (mg/ml) |
|---|---|
20 |
1.78 ± 0.15 |
40 |
13.20 ± 0.54 |
60 |
18.63 ± 0.41 |
80 |
51.33 ± 0.51 |
100 |
77.90 ± 0.57 |
*Data represented in the table as Mean ± SD (n=3)
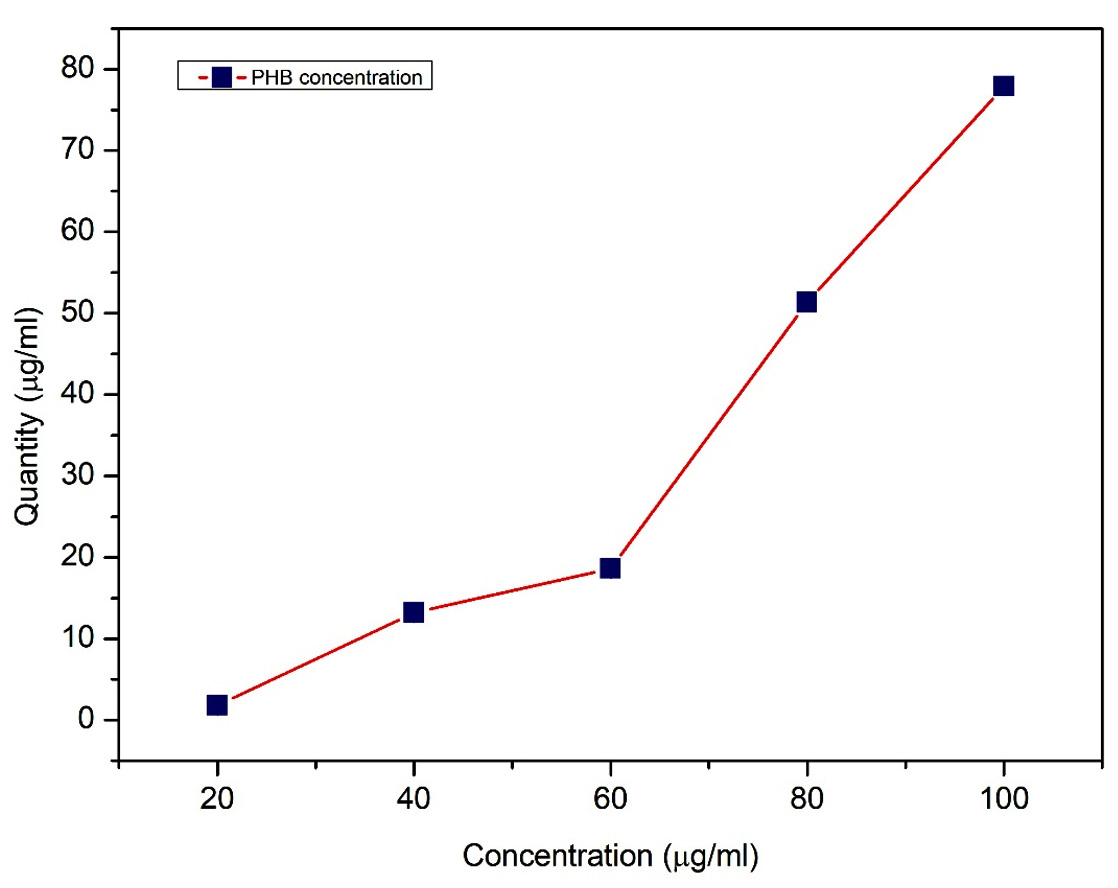
Figure 9. Quantitative screening of PHB after 48 hrs of fermentation by crotonic acid assay
Characterization of PHB by FTIR analysis
The crude PHB extracted from Bevibacterium casei OQ519751 and standard PHB (Sigma-Aldrich) was undergone characterization by FTIR analysis within the spectral range of 4000 cm-1 to 400 cm-1. The high intense absorption bands at 1718.98 cm-1 correlate with the ester carbonyl functional group (C=O) of PHB, having similarities with the standard PHB (1718.63 cm-1). The IR spectra of extracted PHB exhibit a distinct absorption band at 1378.62 cm-1 corresponds to the Phenol or tertiary O-H group, resembling the standard PHB (1378.63 cm-1). The spectra exhibited a distinct band at approximately 1042.95 cm-1, corresponding to Cyclohexane ring vibrations. This is consistent with the bands observed in standard PHB. Furthermore, the signal at 894.94 cm-1 is attributed to C-H 1,3-Disubstitution (meta) groups, while the band at 623.26 cm-1 corresponds to the Alkyne C-H bend, aligning closely with the standard PHB values of 895.14 cm-1 and 623.20 cm-1, respectively. (Figure 10 and Figure 11).
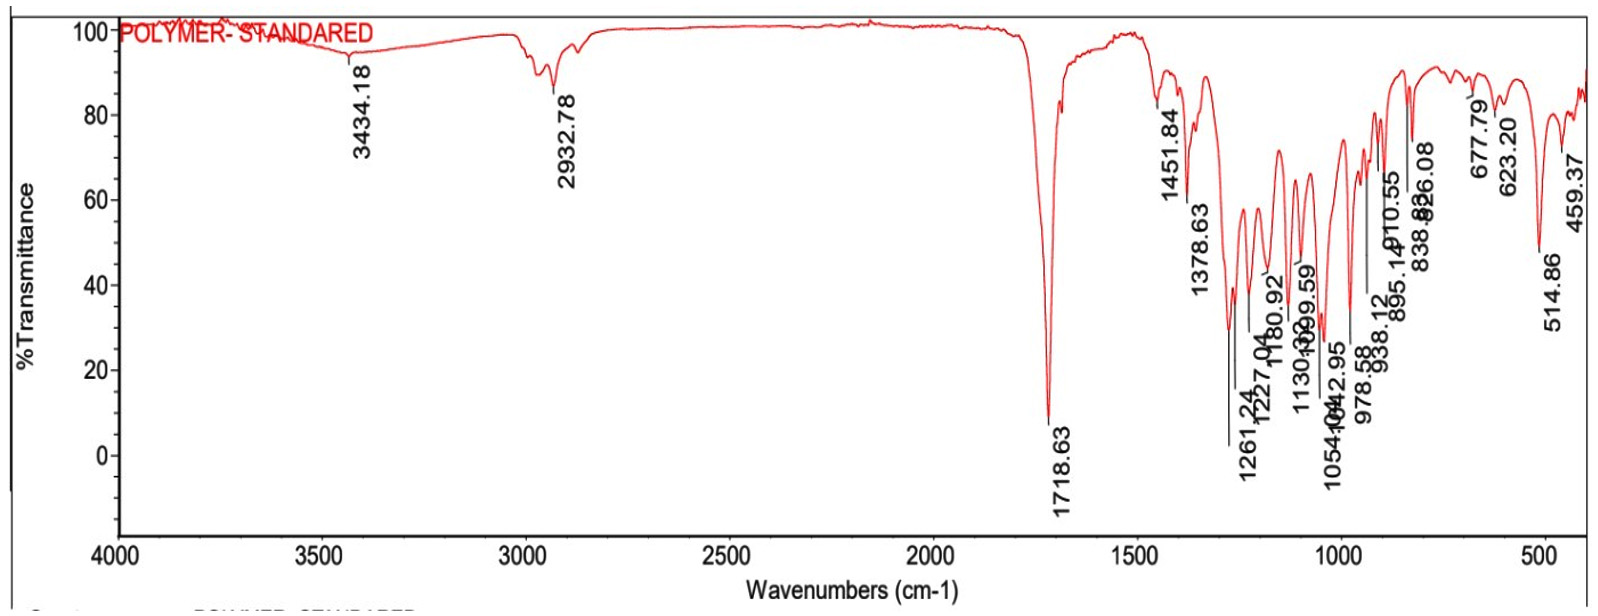
Figure 10. FT-IR analysis of Standard PHB
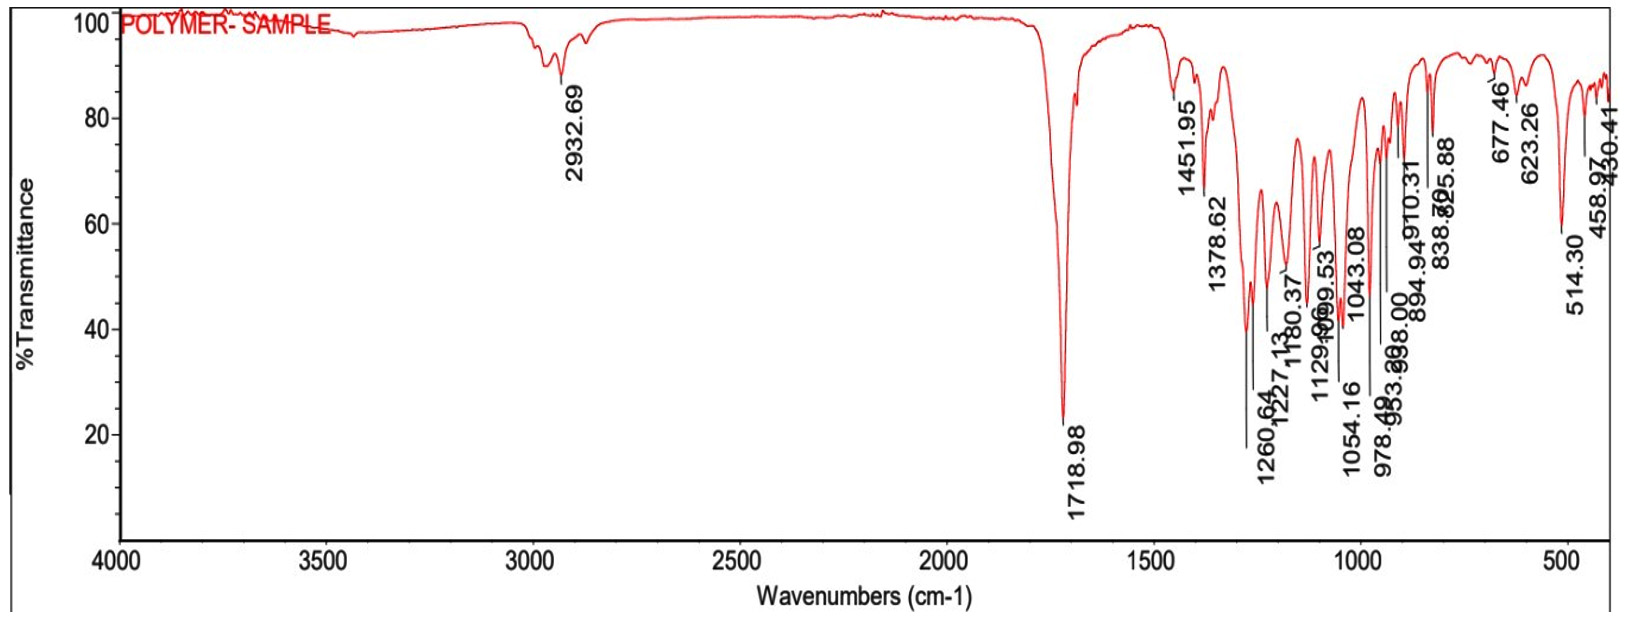
Figure 11. FT-IR analysis of synthesized PHB from Brevibacterium casei OQ519751
Characterization of PHB by XRD analysis
The X-ray diffraction (XRD) analysis of synthesized PHB by Brevibacterium casei OQ519751 (Figure 12) compared alongside with standard PHB from Sigma-Aldrich. The XRD pattern reveals distinct peaks at specific angles: (020) at 2θ = 13°, (110) at 2θ = 16°, (101) at 2θ = 21°, (111) at 2θ = 22°, (121) at 2θ = 25°, and (040) at 2θ = 27°. These peaks denote the characteristic diffraction angles at which the crystalline structure of PHB exhibits its reflections, providing insights into its crystalline properties. From Figure 12, it can be discerned that the peaks at (020) with 2θ = 13° and (110) at 2θ = 16° signify the presence of individual orthorhombic unit cells. These two peaks are notably the most intense and prominent scattering peaks. Additionally, two relatively weaker peaks are identifiable at (101) with 2θ = 21° and (111) at 2θ = 22°, which are indicative of ב PHB crystals. Furthermore, two minor spectra are evident at (121) with 2θ = 25° and (040) at 2θ = 27°, suggesting the partial crystalline nature of the PHB sample. These observations provide valuable insights into the crystalline structure and characteristics of PHB. The XRD pattern closely matches that of PHB extracted from Brevibacterium casei OQ519751 and the standard PHB.
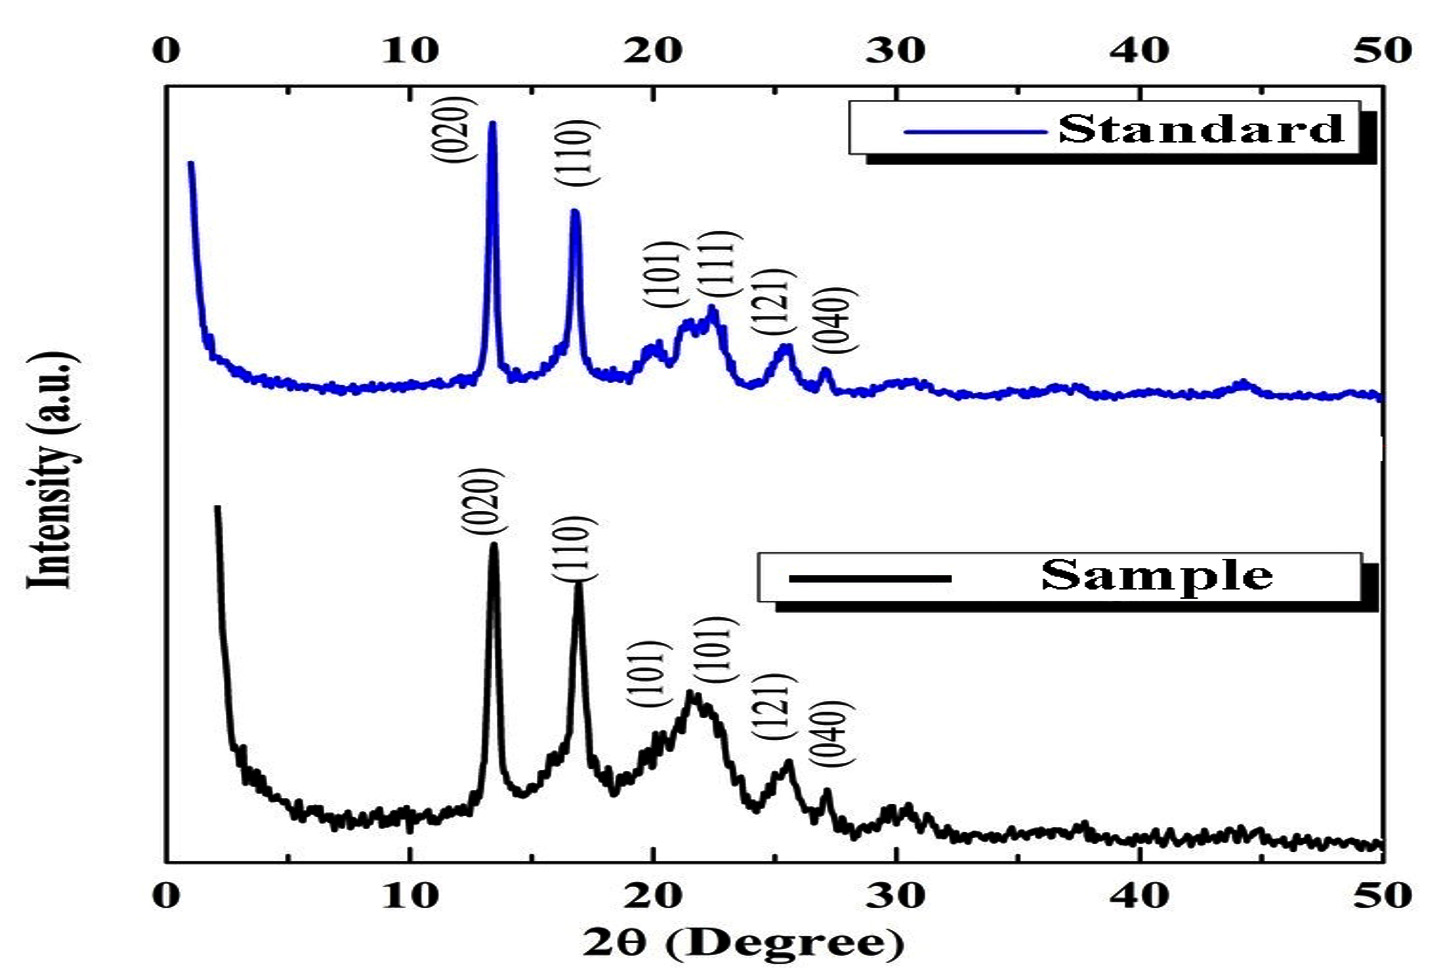
Figure 12. X-ray diffraction (XRD) analysis of PHB synthesized by Brevibacterium casei OQ519751 in comparison to standard PHB
Analysis of thermal properties of PHB
Thermogravimetric analysis (TGA) of PHB produced by Brevibacterium casei OQ519751 was evaluated with standard PHB (Sigma-Aldrich) (Figure 13). The temperature range during the early stage of mass loss was 180.7°C for standard and 173.2°C for extracted PHB. This mass loss, which was approximately 4.44% of the total mass, resulted from the evaporation of solvents that are physically adsorbed, such as chloroform. Additionally, following the melting point of PHB, at 283.7°C, the second or primary stage of the polymer’s breakdown begins. Hydrolysis and chain scission are two steps in the degradation process that result in a drop in molecular weight. At this stage the random chain scission mechanism, which includes the cleavage of C=O and C-O bonds in ester moieties, is what causes the quicker thermal degradation of PHB.
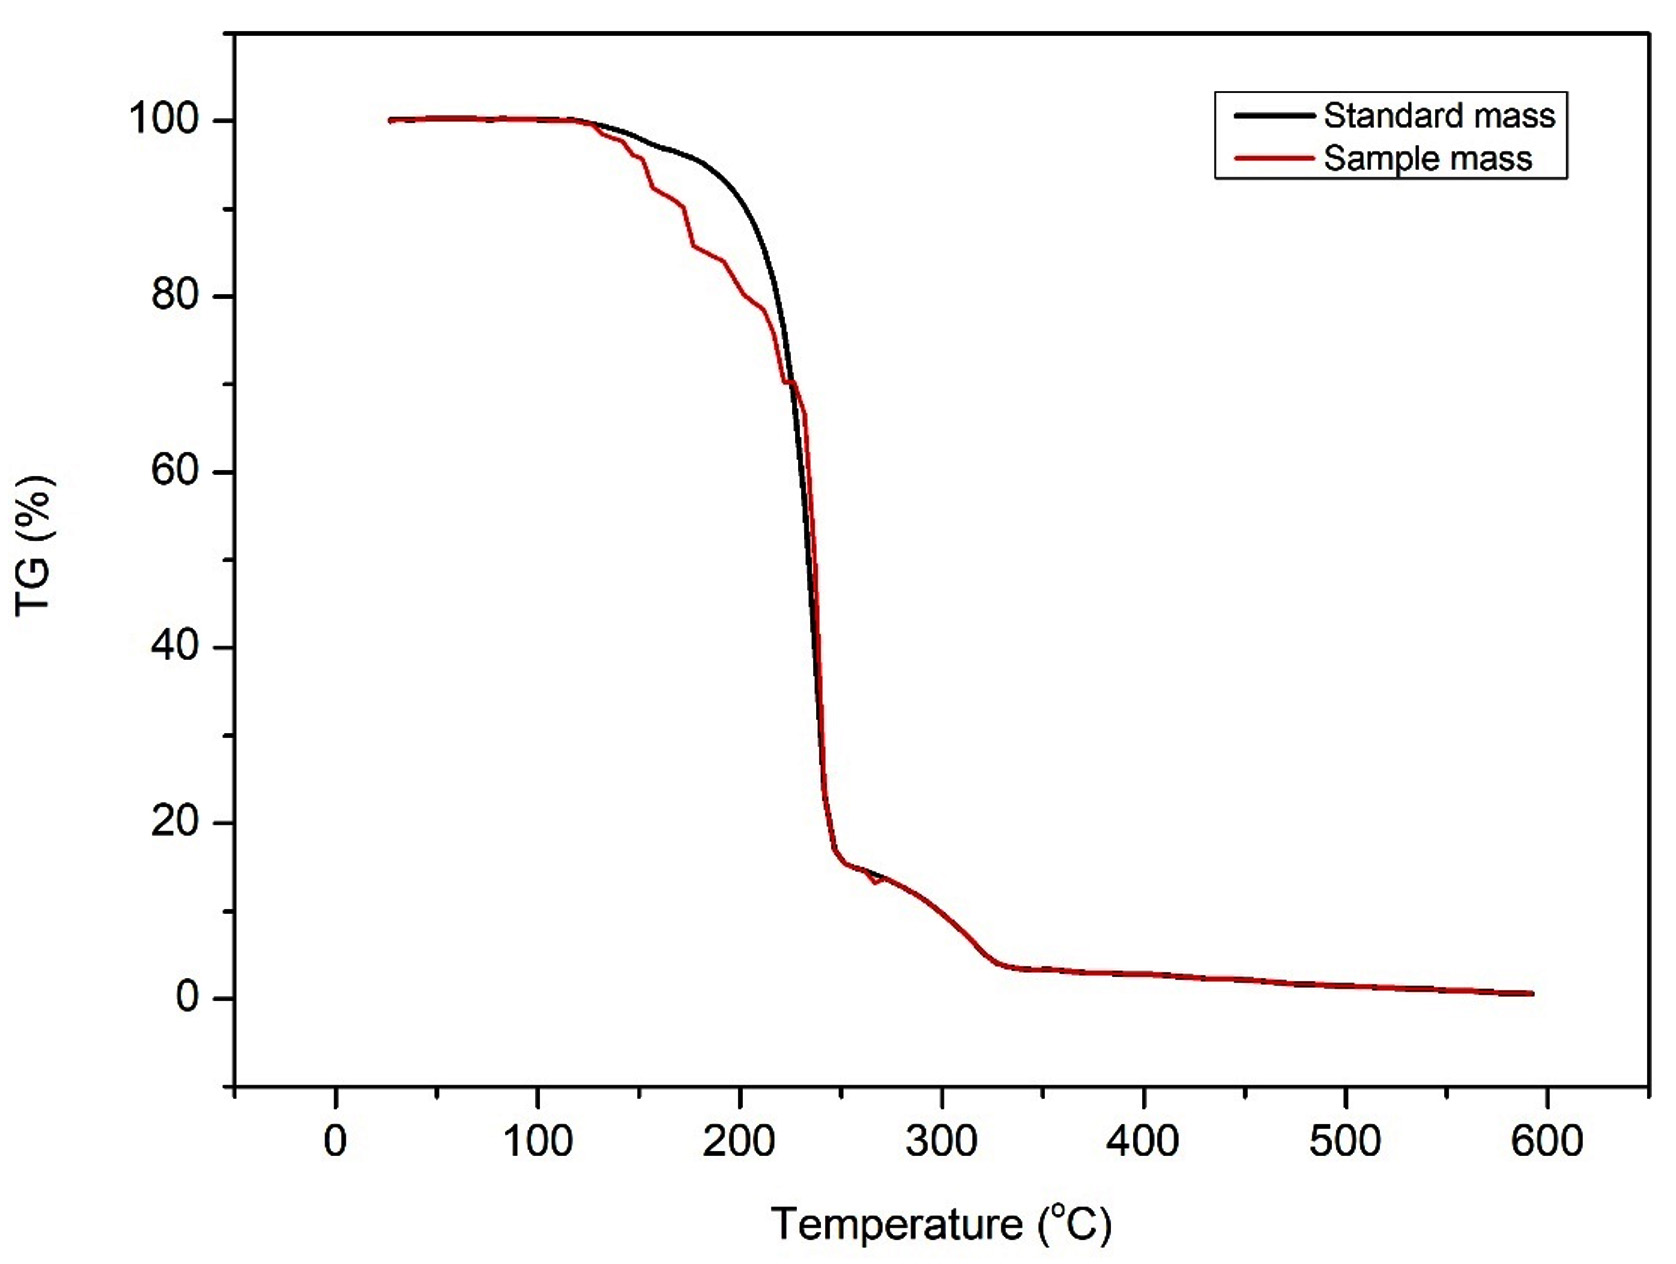
Figure 13. TGA curve of the synthesized PHB in comparison with Standard
Biodegradation of PHB
Initial degradation was recorded after 10 days was found to be 0.83 gm with weight loss percentage of 16.8% whereas the final degradation was recorded after 40 days found to be 0.105 gm with a weight loss percent of 89.4% (Table 11).
Table (11):
Weight loss percentage of PHB film during Biodegradation
Incubation (Days) |
Weight (gm) |
Weight loss % |
|---|---|---|
0 (control) |
1 |
0 |
10 |
0.832 ± 0.02 |
16.8 |
20 |
0.699 ± 0.02 |
30.1 |
30 |
0.495 ± 0.06 |
50.4 |
40 |
0.105 ± 0.004 |
89.4 |
*Data represented in the table as Mean ± SD (n=3)
Quantitative microbial counting
As incubation time went on, the microbial population grew, increasing the rate of biopolymer breakdown. The outcome of quantitative microbial counting was denoted. After 10 days, approximately 54 microbial colonies were observed, and this number increased to around 128 after 40 days of degradation
SEM analysis
SEM observations of the PHB film indicate the morphological differences that appeared on the surface during the degradation process. Consistently smooth and intact surface of the PHB film was noted, with no visible signs of surface erosion. (Figure 14-18).
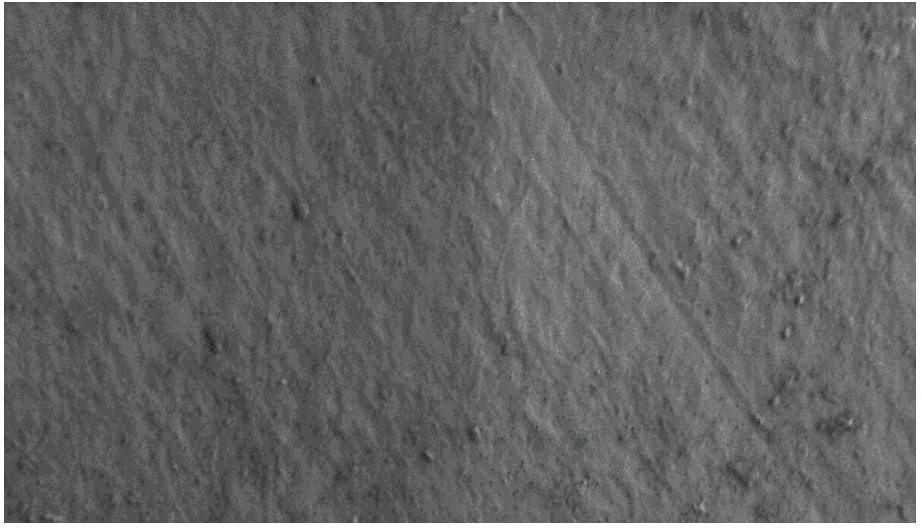
Figure 14. Control – Day 0: Without treatment
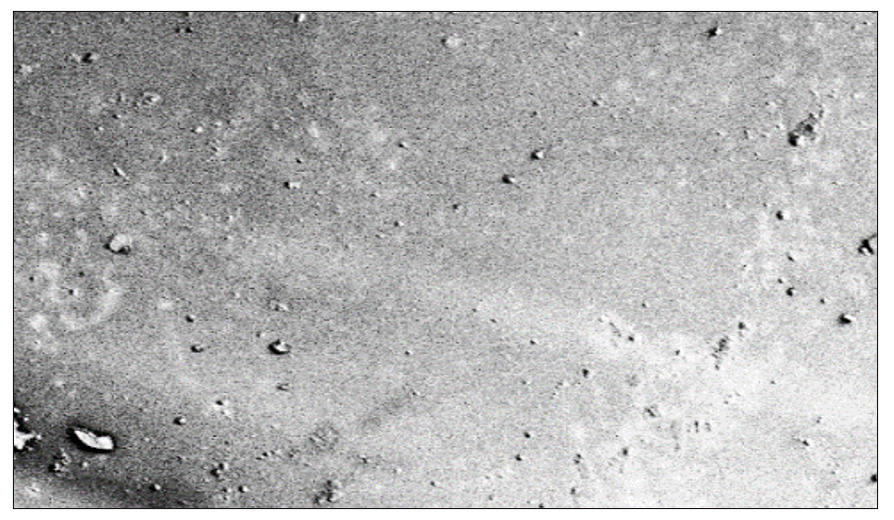
Figure 15. Day 10: During degradation, initial signs of degradation are observed
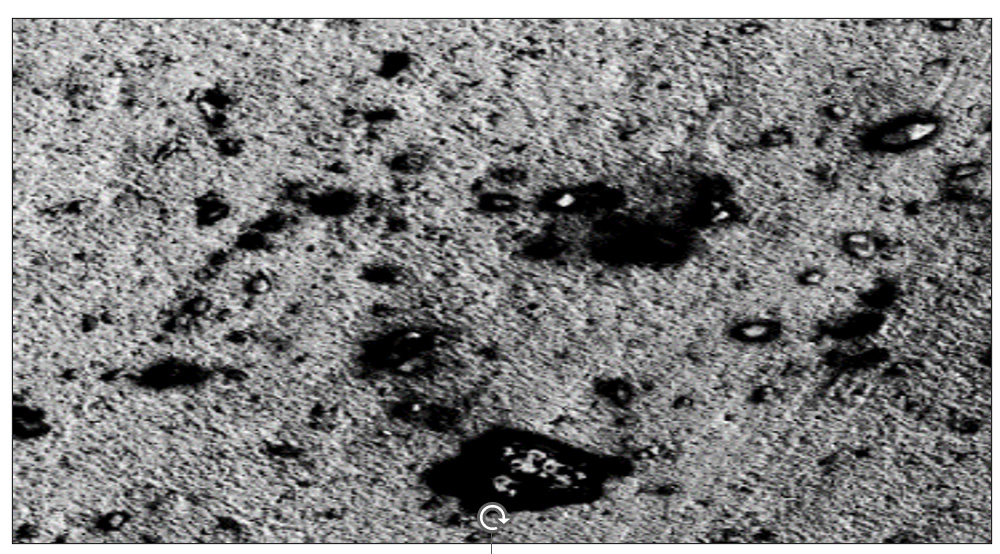
Figure 16. Day 20: Minute pits are observed on the surface
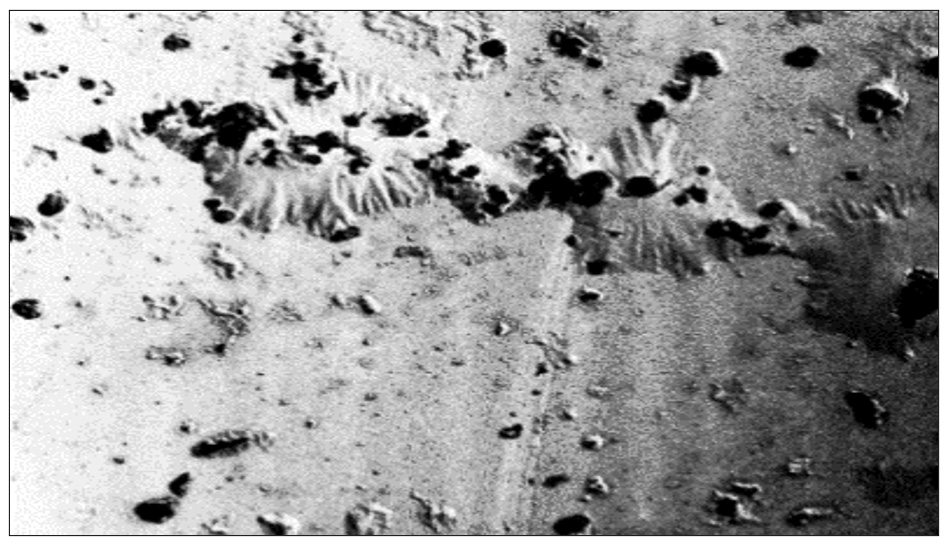
Figure 17. Day 30: Larger pits become noticeable, indicating progressing degradation
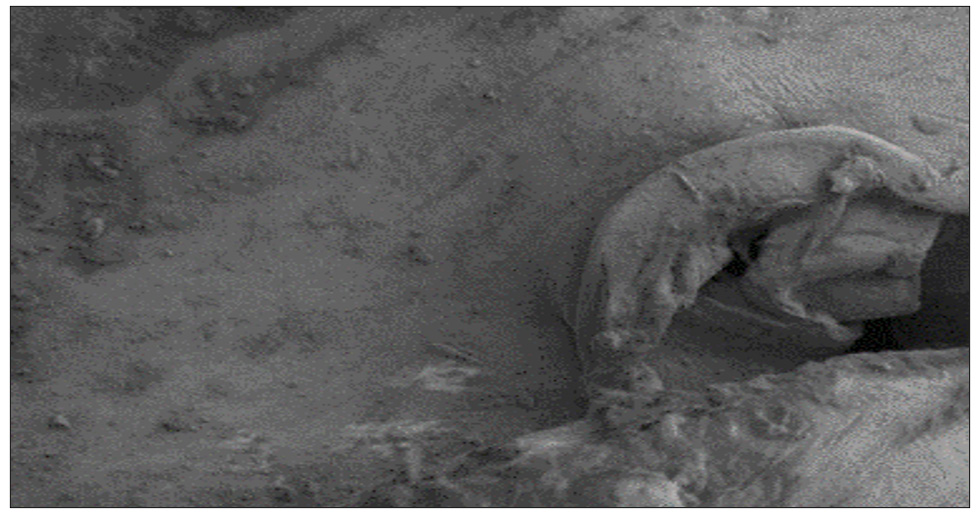
Figure 18. Day 40: A significant portion of the sheet is degraded, illustrating the culmination of the degradation process
In the study by Aragosa et al.,27 they employed the Sudan black B staining method and identified two isolates, namely 1B and 2D1, which exhibited the accumulation of PHB in the form of lipidic granules. Similarly, in the research conducted by Krishnan et al.,19 out of the 33 bacterial isolates they examined, four of them were identified as PHB positive. These positive isolates were characterized by their dark bluish-black appearance when subjected to the Sudan black B staining technique. The study conducted by Shokr et al.,28 states that, among a total of 58 fungal isolates, five isolates (specifically, B1, B11, E1, D6, and N8) demonstrated the capability to accumulate PHB when observed through the application of Sudan Black B staining technique. Additionally, among 50 bacterial isolates examined in the same study, seven isolates (namely C1, D2, E1, E3, E5, I3, and M2) exhibited the ability to produce PHB. Out of the 86 isolates obtained from soil samples, 32 of them were identified as PHB producers when subjected to Sudan Black B staining, these isolates displayed dark bluish-black colonies.29 The preceding discoveries corroborate and assist the outcomes of the current study, affirming that among the 7 isolates being examined isolate P12 does indeed possess the capacity to produce PHB. Based on the phylogenetic analysis, the genetic lineage of the test isolate was confirmed as Brevibacterium casei. The Present result was in accordance with the study by Amiri et al.,30 where they identified that Bacillus cereus saba. zh, with PHB production potential through 16S rRNA sequencing. According to,10 The PHB-producing isolate B2 underwent 16S rRNA gene sequencing, revealing a 99.71% similarity with Agromyces indicus strain. In studies conducted by El-Kadi et al.,31 isolates A6, P3, and W8 were subjected to 16S ribosomal RNA gene sequencing, and they were identified as Bacillus paramycoides, Azotobacter salinestris, and Brevundimonas naejangsanensis, respectively. The estimation of protein and carbohydrate content revealed that water hyacinth exhibited the highest concentrations, with protein at 15.11 µg/ml and carbohydrates at 7.96 µg/ml. This finding is relevant as per the results which was reported by Rufchaei et al.,32 estimated that the crude protein content of water hyacinth to be 24%. Also, our study, which is pertinent to the work of Tadesse et al.,33 conducted a detailed analysis, focusing on water hyacinth leaf protein concentrate (WHLPC) with protein content of 56% and also significant levels of carbohydrates (33%), fat (4.1%), and ash (4.8%). To support our result the research conducted by Nandiyanto et al.,34 which also reported a high protein content in dried water hyacinth, further affirming the reliability of our findings. According to Saratale et al.,35 the production process involved the use of Ralstonia eutropha, and water hyacinth was employed as the substrate for production which resulted in a yield of approximately 7.3 grams per liter (g/L). Under optimal conditions as determined by Trakunjae et al.,36 performed RSM (Response Surface Methodology) which enhanced the capability of Cupriavidus necator to yield P(3HB-co-3HHx) with a composition of 3.6±0.4, consisting of 4 mol% 3HHx. As per the research work of Bose et al.,37 to enhance the influence of operational factors, a combination of response surface modeling (RSM) was utilized. Under the optimal conditions of 13.83 g/L of carbon (C), 0.57 g/L of nitrogen (N), and 0.59 g/L of phosphorus (P), Pseudomonas putida SS9 achieved a maximum PHB productivity of 12.89 g/L during an incubation period of around 84 hours. The research conducted by Kiran et al.,38 revealed that the utilization of Brevibacterium casei for production resulted in a Polyhydroxybutyrate (PHB) yield of 6.74 grams per liter (g/L) when starch was utilized as a carbon source. We adopted comparable techniques for quantifying PHB during the fermentation process, in line with the methodology employed by Mourto et al.,39 and the outcomes yielded affirmative results. The observed results obtained are interconnected to the following reports for the characterization of PHB,40 demonstrated FT-IR analysis for PHBs from glucose and rice bran fermentation by Bacillus subtilis strain which had a comparable structure The spectra showed the presence of a band at 1724 cm-1 and 1726 cm-1 (C=O) observed in glucose and the rice bran. Reports by Hamdy et al.,17 state that PHB Polymer extracted from Bacillus cereus SH-02 undergone characterization by FT-IR analysis exhibited a specific peak at a range of 1724 cm-1 (C=O) exhibiting the major functional group of PHB. According to the findings of Pati et al.,22 notably the strong absorption peak observed between 1719 cm-1 and 1721 cm-1 corresponds to the ester carbonyl group (C=O) of PHB, analogous to the standard PHB peak at 1722 cm-1. In reports by Abu Bakar et al.,41 it was observed that PHB exhibited an orthorhombic system crystalline structure. The XRD patterns revealed peaks at 2ט angles of 13.5°, 16.9°, and 25.5°. These peaks corresponded to (020), (110), and (130). According to Penkhrue et al.,42 the X-ray diffraction (XRD) pattern of PHB obtained from EPPJ and glucose exhibited characteristic peaks at 2ט values of 13, 17, 20, 21, 22, and 25. These peaks were found to be in good correlation with the standard PHB, which had 2ט values of 13.55, 17.05, 20.04, 21.61, 22.55, and 25.59. This similarity in peak positions suggests a high degree of crystallinity in the structure of the produced PHB. In the comparison of X-ray diffraction (XRD) spectra between non-plasticized PHB film and PHB film plasticized with tributyl citrate, similarities were observed. Both exhibited two strong peaks at 2θ = 13.5 and 2θ = 16.9. These peaks were attributed to the (020) and (110) diffraction planes, indicating the presence of orthorhombic a-form crystals of PHB.43 The thermal analysis of PHB was in accordance with the following report which was efficacious with the results observed. According to the thermal analysis studies performed by Silva et al.44 The thermal degradation of PHB films was characterized by the random cleavage of the ester bond (C=O) at temperatures exceeding 200°C. This thermal behavior closely resembled the thermal stability observed in PHB films that incorporated PEG and ALG-e polymers. The melting temperature (Tm) observed in the study performed by Tripathi et al.,45 exhibited that PHB obtained from chloroform-hypochlorite extraction was found to be 179°C. According to reports by Abdelmalek et al.,46 the TGA profiles indicate that the maximum degradation temperature for PHB is 290°C. This process involves the cleavage of C–O and CP%O bonds, along with the breakdown of crystalline regions. These results establish a similar pattern obtained during the soil degradation study by Babaniyi et al.,47 it was noted that weight loss escalated as the duration extended from 30 to 90 days. In contrast, in the slurry-based degradation study, both the sizes and weights of the composite experienced reductions by the conclusion of the 21-day investigation. Also, the study done by Gasparyan et al.,48 revealed consistent patterns of alterations in the supramolecular structure of PHB, changes in the chemical composition of the surface, and shifts in the mechanical and physical characteristics of the material as it underwent biodegradation in the soil,49 stated that The depolymerase enzymes that the soil bacteria can produce can hydrolyze PHB polymers, and they use the metabolic breakdown products as a source of nutrients and energy,24 observed the Morphological changes in PHB film that got degraded by soil burial method using SEM micrographs after being incubated with a PHB film used as control and Aeromonas caviae during a degradation study with time intervals of 15 days, 30 days & 45 days which confirmed structural and morphological variations brought on by biodegradation of PHB biopolymer film. Degradation studies carried out by Sayyed et al.,50 confirmed the capability of Stenotrophomonas sp. RZS7 to break down PHB under natural soil conditions by changes in the surface shape of the PHB film buried in the soil as seen in FE-SEM analysis. In a recent study,51 Ralstonia eutropha NCIMB 11599 was employed to produce PHB using water hyacinth as the substrate, resulting in a PHB production concentration of 1.22 g/L.
The core focus of the study is to synthesize the biopolymer called Polyhydroxybutyrate (PHB) through the fermentation of agro-residue using Brevibacterium casei. It is noteworthy that the performance of Brevibacterium casei in the fermentation process, particularly when utilizing water hyacinth as the substrate, has shown significant improvement under optimal temperature and pH conditions for PHB production. The PHB produced by Brevibacterium casei using the agro residue water hyacinth demonstrates a crystalline nature and superior biodegradability compared to other polymers. The bio-polymer gained from the fermentation medium then was qualitatively analyzed using FTIR, and when compared with standard PHB (Sigma Aldrich), The integrity and purity of the obtained PHB sample were validated by the existence of a C=O stretch. Additionally, SEM imaging, TGA and XRD analysis demonstrated that the degradation, thermal capacity, and crystallinity of the PHB extracted were better than the PHB standard. This study recommends the utilization of agro-residue as a substrate for fermentation holds the potential to enhance the economic viability of PHB production, facilitating its scalability and contributing to the advancement of PHB technology for commercial applications. This novel approach involving Brevibacterium casei on the agro residue water hyacinth towards the production of PHB with an eco-friendly approach, in turn, has a versatile role in various sectors. In the realm of pharmacology, it facilitates drug and vaccine delivery, tissue engineering, wound dressings, medical implants, and sutures. In the industrial field, it is utilized in the production of biodegradable plastics, acts as a stabilizer and encapsulation material in cosmetics, serves as an emulsifier, and supports the production of eco-friendly bottles and cutlery. Additionally, in the agricultural sector, it finds use in encapsulating fertilizers, developing biodegradable erosion control films, coating seeds, crafting plant containers, and creating stakes for plant maintenance, as well as producing mulching films.
ACKNOWLEDGMENTS
The authors are grateful to the Karpagam Academy of Higher Education for providing the Laboratory facilities and constant support.
CONFLICT OF INTEREST
The authors declare that there is no conflict of interest.
AUTHORS’ CONTRIBUTION
Both authors listed have made a substantial, direct and intellectual contribution to the work, and approved it for publication.
FUNDING
None.
DATA AVAILABILITY
All datasets generated or analyzed during this study are included in the manuscript.
ETHICS STATEMENT
Not applicable.
- Bedade DK, Edson CB, Gross RA. Emergent approaches to efficient and sustainable polyhydroxyalkanoate production. Molecules. 2021;26(11):3463.
Crossref - Data bridge market research. 2022. https://www.databridgemarketresearch.com/reports/global polyhydroxyalkanoate-pha-market
- Kourilova X, Pernicova I, Vidlakova M, et al. Biotechnological conversion of grape pomace to poly (3-hydroxybutyrate) by moderately thermophilic bacterium Tepidimonas taiwanensis. Bioengineering. 2021;8(10):141.
Crossref - Ravuri JM, Galla M. Assessment of marine microbial polyhydroxybutyrate by employing high-performance liquid chromatography and nuclear magnetic resonance techniques. Int J Env Sci Tech. 2022:1-10
Crossref - Zoghbi L, Argeiti C, Skliros D, et al. Circular PHB production via Paraburkholderia sacchari cultures using degradation monomers from PHB-based post-consumer bioplastics as carbon sources. Biochem Eng J. 2023:108808.
Crossref - Sharma K, Srivastava AK, Sreekrishnan TR. Model-based optimization of biopolymer production from glycerol. Chem Biochem Eng Quarterly. 2021;35(1):65-80.
Crossref - Dey S, Tribedi P. Microbial functional diversity plays an important role in the degradation of polyhydroxybutyrate (PHB) in soil. 3 Biotech. 2018;8(3):171
Crossref - Al-Khattaf FS, Al-Ansari MM, Maruthamuthu MK, Dyona L, Agastian P. Polyhydroxybutyrate degradation by biocatalyst of municipal sludge water and degradation efficacy in sequencing batch biofilm reactor. Environ Res. 2022;204(Pt C):112336.
Crossref - Martinez Tobon DI, Waters B, Elias AL, Sauvageau D. Streamlined production, purification, and characterization of recombinant extracellular polyhydroxybutyrate depolymerases. Microb Open. 2020;9(4):e1001
Crossref - Adnan M, Siddiqui AJ, Ashraf SA, et al. Polyhydroxybutyrate (PHB)-Based Biodegradable Polymer from Agromyces indicus: Enhanced Production, Characterization, and Optimization. Polymers. 2022;14(19):3982.
Crossref - Getachew A, Woldesenbet F. Production of biodegradable plastic by polyhydroxybutyrate (PHB) accumulating bacteria using low-cost agricultural waste material. BMC Res Notes. 2016;9(1):1-9.
Crossref - Valdez-Calderon A, Barraza-Salas M, Quezada-Cruz M, et al. Production of polyhydroxybutyrate (PHB) by a novel Klebsiella pneumoniae strain using low-cost media from fruit peel residues. Biomass Conversion and Biorefinery. 2022;12(11):4925-4938.
Crossref - Thuoc DV, Chung NT, Hatti-Kaul R. Polyhydroxyalkanoate production from rice straw hydrolysate obtained by alkaline pretreatment and enzymatic hydrolysis using Bacillus strains isolated from decomposing straw. Bioresour Bioprocess. 2021;8(1):1-11.
Crossref - Chen LF, Yang CM; 1984. US Patent No. 4 452 640. US Patent and Trademark Office.
Crossref - Shen CH. Quantification and analysis of proteins. Diagn Mol Bio. 2019:187-214.
Crossref - Amutha R, Kavusik T, Sudha A. Analysis of bioactive compounds in citrus fruit peels. Int J Sci Res Rev. 2017;6:19-27.
- Hamdy SM, Danial AW, Gad El-Rab SM, Shoreit AA, Hesham AEL. Production and optimization of bioplastic (Polyhydroxybutyrate) from Bacillus cereus strain SH-02 using response surface methodology. BMC Microbio. 2022;22(1):183.
Crossref - Tripathi AD, Joshi TR, Srivastava SK, Darani KK, Khade S, Srivastava J. Effect of nutritional supplements on bio plastics (PHB) production utilizing sugar refinery waste with potential application in food packaging, Prep Biochem Biotech. 2019;49(6):567-577.
Crossref - Krishnan S, Chinnadurai GS, Ravishankar K, Raghavachari D, Perumal P. Statistical augmentation of polyhydroxybutyrate production by Isoptericola variabilis: Characterization, moulding, in vitro cytocompatibility and biodegradability evaluation. Int J Biol Macromol. 2021;166:80-97.
Crossref - Murugan S, Duraisamy S, Balakrishnan S, Kumarasamy A, Subramani P, Raju A. Production of eco-friendly PHB-based bioplastics by Pseudomonas aeruginosa CWS2020 isolate using poultry (chicken feather) waste. Biol Futur. 2021;72(4):497-508.
Crossref - Lu H, Sato H, Kazarian SG. Visualization of Inter-and Intramolecular Interactions in Poly (3-hydroxybutyrate)/Poly (L-lactic acid)(PHB/PLLA) Blends During Isothermal Melt Crystallization Using Attenuated Total Reflection Fourier Transform infrared (ATR FT-IR) Spectroscopic Imaging. Appl Spectrosc. 2021;75(8):980-987.
Crossref - Pati S, Maity S, Dash A, et al. Biocompatible PHB production from Bacillus species under submerged and solid-state fermentation and extraction through different downstream processing. Curr Microbiol. 2020;77(7):1203-1209.
Crossref - Trakunjae C, Boondaeng A, Apiwatanapiwat W, et al. Enhanced polyhydroxybutyrate (PHB) production by newly isolated rare actinomycetes Rhodococcus sp. strain BSRT1-1 using response surface methodology. Sci Rep. 2021;11(1):1896.
Crossref - Amir M, Bano N, Baker A, et al. Isolation and optimization of extracellular PHB depolymerase producer Aeromonas caviae Kuk1-(34) for sustainable solid waste management of biodegradable polymers. Plos One. 2022;17(4):e0264207.
Crossref - Omoregie GO, Ogofure AG, Ikhajiagbe B, Anoliefo GO. Quantitative and qualitative basement of microbial presence during phytoremediation of heavy metal polluted soil using Chromolaena odorata. Ovidius University Annals of Chem. 2020;31(2):145-151.
Crossref - Altaee N, El-Hiti GA, Fahdil A, Sudesh K, Yousif E. Biodegradation of different formulations of polyhydroxybutyrate films in soil. Springer Plus. 2016;5(1):1-12.
Crossref - Aragosa A, Specchia V, Frigione M. Isolation of two bacterial species from argan soil in morocco associated with polyhydroxybutyrate (PHB) accumulation: Current potential and future prospects for the bio-based polymer production. Polymers. 2021;13(11):1870.
Crossref - Shokr A, Abd-Elsalam O, Hamedo H, Elshafey N. Isolation and identification of Polyhydroxybutyrate (PHB)-producing microorganisms from various sources in North Sinai. Catrina: Intern J Environ Sci. 2023;27(1):23-31.
Crossref - Bektas K, Can K, Belduz AO. Isolation and Screening of Polyhydroxybutyrate (PHB) Producing Bacteria from Soils. Biol Bull. 2023:50(3):319-328.
Crossref - Amiri S, Zeydi MM, Amiri N. Bacillus cereus saba. zh, a novel bacterial strain for the production of bioplastic (polyhydroxybutyrate). Braz J Microb. 2021;52(4):2117-2128
Crossref - El-Kadi SM, Elbagory M, El-Zawawy HA, et al. Biosynthesis of Poly-b-Hydroxybutyrate (PHB) from different bacterial strains grown on alternative cheap carbon sources. Polymers. 2021;13(21):3801.
Crossref - Rufchaei R, Abbas-Mohammadi M, Mirzajani A, Nedaei S. Evaluation of the chemical compounds and antioxidant and antimicrobial activities of the leaves of Eichhornia crassipes (water hyacinth). Jundishapur Journal of Natural Pharmaceutical Product. 2022;17(1):e101436.
Crossref - Tadesse S, Tesfaye G, Kifle B, Berhe H. Production and Characterization of Bio-Diesel from Water Hyacinth (Eichhorniacrassipes). Livestock Res. Results. 2022;10(3):62-66.
Crossref - Nandiyanto ABD, Ragadhita R, Hofifah SN, et al. Progress in the utilization of water hyacinth as effective biomass material. Envir Develop Sustain. 2023:1-48.
Crossref - Saratale RG, Cho SK, Ghodake GS, et al. Utilization of noxious weed water hyacinth biomass as a potential feedstock for biopolymers production: A novel approach. Polymers. 2020;12(8):1704.
Crossref - Trakunjae C, Boondaeng A, Apiwatanapiwat W, et al. Statistical optimization of P (3HB-co-3HHx) copolymers production by Cupriavidus necator PHB– 4/pBBR_CnPro-phaC Rp and its properties characterization. Sci Rep. 2023;13(1):9005.
Crossref - Bose SA, Rajulapati SB, Velmurugan S, et al. Process intensification of biopolymer polyhydroxybutyrate production by Pseudomonas putida SS9: A statistical approach. Chemosphere. 2023;313:137350.
Crossref - Kiran GS, Lipton AN, Priyadharshini S, et al. Antiadhesive activity of poly-hydroxy butyrate biopolymer from a marine Brevibacterium casei MSI04 against shrimp pathogenic vibrios. Microb Cell Fact. 2014;13(1):1-12.
Crossref - Mourדo MM, Gradםssimo DG, Santos AV, et al. Optimization of polyhydroxybutyrate production by amazonian microalga Stigeoclonium sp. B23. Biomolecules. 2020;10(12):1628.
Crossref - Hassan MA, Bakhiet EK, Hussein HR, Ali SG. Statistical optimization studies for polyhydroxybutyrate (PHB) production by novel Bacillus subtilis using agricultural and industrial wastes. Int J Environ Sci Tech. 2019;16(7):3497-3512.
Crossref - Abu Bakar AA, Zainuddin MZ, Abdullah SM, et al. The 3D Printability and Mechanical Properties of Polyhydroxybutyrate (PHB) as Additives in Urethane Dimethacrylate (UDMA) Blends Polymer for Medical Application. Polymers. 2022;14(21):4518.
Crossref - Penkhrue W, Jendrossek D, Khanongnuch C, et al. Response surface method for polyhydroxybutyrate (PHB) bioplastic accumulation in Bacillus drentensis BP17 using pineapple peel. PloS One. 2020;15(3):e0230443
Crossref - Cho JY, Kim SH, Jung HJ, et al. Finding a Benign Plasticizer to Enhance the Microbial Degradation of Polyhydroxybutyrate (PHB) Evaluated by PHB Degrader Microbulbifer sp. SOL66. Polymers. 2022;14(17):3625.
Crossref - Silva MRD, Matos RS, Monteiro MD, et al. Exploiting the Physicochemical and Antimicrobial Properties of PHB/PEG and PHB/PEG/ALG-e Blends Loaded with Ag Nanoparticles. Materials. 2022;15(21):7544.
Crossref - Tripathi AD, Joshi TR, Srivastava SK, Darani KK, Khade S, Srivastava J. Effect of nutritional supplements on bio-plastics (PHB) production utilizing sugar refinery waste with potential application in food packaging. Prep Biochem Biotech. 2019;49(6):567-577
Crossref - Abdelmalek F, Rofeal M, Pietrasik J, Steinbuchel A. Novel Biodegradable Nanoparticulate Chain-End Functionalized Polyhydroxybutyrate-Caffeic Acid with Multifunctionalities for Active Food Coatings. ACS Sustainable Chem Engin. 2023;11(18):7123-7135
Crossref - Babaniyi RB, Afolabi FJ, Obagunwa MP. Recycling of used polyethylene through solvent blending of plasticized polyhydroxybutyrate and its degradation potential. Composites Part C: Open Access. 2020;2:100021.
Crossref - Gasparyan KG, Tyubaeva PM, Varyan IA, Vetcher AA, Popov AA. Assessing the Biodegradability of PHB-Based Materials with Different Surface Areas: A Comparative Study on Soil Exposure of Films and Electrospun Materials. Polymers. 2023;15(9):2042.
Crossref - Kumaravel S, Hema R, Lakshmi R. Production of polyhydroxybutyrate (bioplastic) and its biodegradation by Pseudomonas lemoignei and Aspergillus niger. J Chem. 2010;7:S536-S542.
Crossref - Sayyed RZ, Wani SJ, Alarfaj AA, Syed A, El-Enshasy HA. Production, purification and evaluation of biodegradation potential of PHB depolymerase of Stenotrophomonas sp. RZS7. PloS One. 2020;15(1):e0220095.
Crossref - Wititsawankul N, Jaturapiree P. Production of an eco-friendly polyhydrxybutyrate (PHB) using water hyacinth hydrolysate as carbon source. AIP Conference Proceedings. 2023;2669(1).
Crossref
© The Author(s) 2024. Open Access. This article is distributed under the terms of the Creative Commons Attribution 4.0 International License which permits unrestricted use, sharing, distribution, and reproduction in any medium, provided you give appropriate credit to the original author(s) and the source, provide a link to the Creative Commons license, and indicate if changes were made.