

ISSN: 0973-7510
E-ISSN: 2581-690X
The present study was carried out to investigate the mass transfer kinetics of Aloe Vera gel cubes during osmo-convective and convective drying and its quality evaluation. Aloe Vera leaves were washed and cut into 25 x 25 x 25 mm cubes and were osmotically dehydrated in different concentration (43.2, 50, 60, 70, 76.8° Brix) and process temperature (43.2, 50, 60, 70, 76.8°C) with syrup to gel ratio (4.3:1, 5:1, 6:1, 7:1, 7.7:1) for 4 hr duration of osmosis. Central Composite Rotatable Design was used to analyse osmotic dehydration process. The osmosed and untreated Aloe Vera gel cubes were dried in tray dryer at 50°C, 60°C and 70°C and hot air dryer at 60°C, 70°C and 80°C. The effect of osmosis, sugar concentration and process temperature of syrup on mass reduction, water loss and sugar gain were studied during osmotic dehydration. It was found that mass reduction, water loss increased with increase of sugar concentration and process temperature while solid gain decreased with increase in sugar concentration and process temperature.
Aloe vera, Osmosis, CCRD, Water loss, Solid gain, Mass reduction.
India which is the biggest repository of medicinal and aromatic plants in the world has to maintain an important position in the production and trade of raw materials either directly for crude drugs or as the bioactive compound in the formulation of pharmaceuticals and cosmetics. The name Aloe is derived from the Arabic word “alloeh” meaning bitter shiny substance. In India Aloe Vera has been referred to as “Ghrit kumari’ in Ayurvedic treatments. Aloe Vera (Aloe barbadensis Miller) is a specific species of Aloe. There are over 400 species of Aloe Vera plants in the Lily Family. New plants mature in 4-6 years and can survive for nearly 50 years in favorable conditions. Aloe Vera (Aloe barbadensis Miller), a traditional medicinal plant, is used in food, pharmaceutical and cosmetic industries (Grindlay and Reynolds, 1986). Gel contains 97– 98% of water and more than 60% of dry matter is made up of polysaccharides (McAnalley 1993; Femenia et al., 1999). The gel is a colorless, odorless, hydrocolloid with several natural beneficial substances. It can relieve gastrointestinal problems associated with peptic or duodenal ulcers improve regularity and enhance energy levels. The major ingredient in the internal gel of Aloe is water, making up 99+ percent of its content. The remaining 1 percent or so of solid is divided amongst 200 different constituents, constituting a marvelously diverse mixture of antibiotics, pain inhibitors, cell growth stimulators, inflammation fighters, burns healers, capillary dilators, vasoconstrictor inhibitors and moisturizers all having a remarkable degree of penetration. Aloe Vera is cultivated under approximately 23,600 hectares worldwide accordingly to a report on Aloe Vera cultivation, published by international Aloe science council (www.iasc.org) USA supplies the major bulk of Aloe Vera in world market having a share of 60-65 %, whereas Latin American countries supply 20-25%. Australia, china and India combinedly have a market share of only 10% (Rath, 2003). The major areas under Aloe Vera cultivation in India are Alwar in Rajasthan, Satnapalli in Andhra Pradesh and Rajpipla in Gujarat. International markets for medicinal plants are increasing at the rate of 7% annually of which India share is only about 3-5% while China is one of the leading countries in the world in export of medicinal drugs besides meeting its large domestic demands (Rao and Rajput, 2005).
The osmotic process has received considerable attention as a pre-treatment so as to reduce energy consumption and improve food quality (Jayaraman and Das Gupta 1992; Karthanos et al., 1995). Osmotic process is affected by the physicochemical properties of the isolates employed, because differences in efficiency of dehydration arise mainly from differences in molecular weight, ionic state, and solubility of solute in water. For instance, high molecular weight sugars, it was possible to zero net solid gain (Lazarides and Mavroudis, 1995) and allows migration of moisture. Besides reducing the drying time, the osmotic dehydration as a pretreatment also inhibits enzymatic growing, retains natural color and retains volatile aroma during the subsequent drying (Pokharkar et al., 1997). Mass transfer rates during osmotic dehydration are influenced by several factors including the concentration of the osmotic medium, the immersion time and the temperature. Sucrose is considered one of the best osmotic substances, especially when the osmotic dehydration is employed before drying. The presence of this sugar on the surface of the dehydrated sample is an obstacle for the contact with oxygen thus reducing the oxidative reactions (Fernandes et al., 2009). It also increases the sugar to acid ratio and improves the texture and stability of pigments during dehydration and storage. The final reduction of moisture is achieved through drying. This process of drying is an economical drying of fruit or vegetable material containing higher moisture content, greater than 70%. At the end of drying final stable product having longer shelf life can be obtained. And its effect is also more acceptable than any another type of drying methods.
Fresh whole Aloe Vera leaves, of 32 cm to 52 cm of length, were collected from Herbal Garden, Department of Horticulture of Sardar Vallabhbhai Patel University of Agriculture and Technology, Meerut. The refined sugar was selected as the osmotic agent. The Aloe Vera leaves were thoroughly washed under tap water to remove adhering materials, and then the spikes, placed along their margins, were removed before slicing the leaf. The thick epidermis is carefully separated from the parenchyma using a stainless steel cutter. The fillets were cut into 2.5×2.5×2.5 cm cubes with the help of sharp stainless steel cutter. The cubes were extensively washed with distilled water to remove the exudates from their surfaces. Sugar syrup of desired concentration is prepared by dissolving required amount of sugar in distilled water.
Osmotic dehydration
The prepared samples (Aloe Vera cubes) were weighed for every experiment and immersed in the sugar syrup (43.2, 50, 60, 70, 76.8ºBrix) contained in glass beaker. The beaker were placed inside the constant temperature water bath. The syrup in the beaker was manually stirred at regular intervals to maintain uniform temperature. One beaker was removed from the water bath at designated time and the samples were immediately rinsed in flowing water and placed on tissue paper to remove the surface moisture. The samples were weighed and their moisture contents were determined. Number of experimental runs was decided on the basis of RSM.
Experimental Design
For the optimization of osmotic dehydration by response surface methodology, the experiments were conducted according to Central Composite Rotatable Design (CCRD) with three variables at five levels. The independent variables were osmotic solution temperature, solute concentration, and duration of osmotic dehydration process. The low and high levels of the variables were 50 and 70ºC for osmotic solution temperature, 50 and 70ºBrix for sucrose solution concentration as shown in Table 1. The experiments plan in coded and uncoded form of process variables is given in Table 2.
Table (1):
Independent Process Variable and their Variables.
| Independent variables | symbols | Levels | ||||
|---|---|---|---|---|---|---|
| -α | -1 | 0 | +1 | +α | ||
| sugar concentration (ºBrix) | X• | 43.2 | 50 | 60 | 70 | 76.8 |
| process temperature (ºC) | X‚ | 43.2 | 50 | 60 | 70 | 76.8 |
| syrup to gel ratio (STGR) | Xƒ | 4.3 | 5 | 6 | 7 | 7.7 |
Table (2):
Experimental Plan for Study of Osmotic Dehydration.
| Run | Uncoded process variable | Uncoded process variable | ||||
|---|---|---|---|---|---|---|
| X• | X‚ | Xƒ | Sugar concentration Brix | temperature °C | STGR | |
| 1 | 0 | 0 | 0 | 60 | 60 | 6 |
| 2 | 1 | -1 | 1 | 70 | 50 | 7 |
| 3 | -1 | 1 | 1 | 50 | 70 | 7 |
| 4 | -1 | 1 | -1 | 50 | 70 | 5 |
| 5 | -1.682 | 0 | 0 | 43.2 | 60 | 6 |
| 6 | 0 | 0 | 0 | 60 | 60 | 6 |
| 7 | 0 | -1.682 | 0 | 60 | 43.2 | 6 |
| 8 | 0 | 0 | 0 | 60 | 60 | 6 |
| 9 | 1 | 1 | 1 | 70 | 70 | 7 |
| 10 | 0 | 1.682 | 0 | 60 | 76.8 | 6 |
| 11 | 0 | 0 | -1.682 | 60 | 60 | 4.3 |
| 12 | 0 | 0 | 1.682 | 60 | 60 | 7.7 |
| 13 | 1 | -1 | -1 | 70 | 50 | 5 |
| 14 | 1 | 0 | 0 | 76.8 | 60 | 6 |
| 15 | -1 | -1 | -1 | 50 | 50 | 5 |
| 16 | 1 | 1 | -1 | 70 | 70 | 5 |
| 17 | 0 | 0 | 0 | 60 | 60 | 6 |
| 18 | -1 | -1 | 1 | 50 | 50 | 7 |
| 19 | 0 | 0 | 0 | 60 | 60 | 6 |
| 20 | 0 | 0 | 0 | 60 | 60 | 6 |
Mass Transfer Kinetics
Water Loss (WL)
Water loss and solid gain will be determined by gravimetric measurement, by assuming that, under the conditions to be use, the solutes initially present in the slices do not diffuse against the solids concentration gradient into the concentrated osmotic solution.
WL %=(initial moisture,g-final moisture,g)/(initial weight of the sample,g) ×100
…(1)
Solid Gain (SG)
The solid gain (SG) will be measured by the following equation as suggested by Lenart & Flink 1984. It is determined by gravimetric measurement.
SG %=(final solids,g-initial solid,g )/(initial weight of the sample,g) ×100
…(2)
Mass Reduction (MR)
The overall exchange in the solid and liquid of the sample do affect the final weight of the sample. The mass reduction can be defined as the net weight loss of the fruit on initial weight basis.
WR=(Wi-W₀)/Wi
…(3)
From equations the solid gain (SG) can be correlated with mass reduction (WR) and water loss (WL) as
SG = WL – WR
Where, WL = water loss (g per 100g mass of sample); SG = solid gain (g per 100g mass of sample); WR = mass reduction; Wè = mass of samples after time è, g; Wi =initial mass of samples, g ; X è =water content as fraction of mass of samples at time è; X I = water content as a fraction of initial mass of samples.
Convective Drying
The osmosed and untreated Aloe Vera cubes were dried in conventional dryer. This experiment was carried out in two convective dryers i.e, tray dryer at 50ºC, 60ºC and 70ºC and in hot air dryer at 60ºC, 70ºC and 80ºC.
Mass transport in osmosis
The mass reduction, water loss and solid gain were observed in the range of 57.7026 to 77.5184, 81.9235 to 94.2818, 16.7634 to 24.2209 percent, respectively for 4 hour duration of osmosis at various sugar concentrations, temperature range of osmotic solution and various sugar to gel ratio. The effect of process variables on product responses are shown in Table 3.
Table (3):
Effect of Process Variables on Product Responses.
Sugar Conc. °Brix |
Process Temp. °C |
STGR |
Mass Reduction % |
Water Loss % |
Solid Gain % |
|---|---|---|---|---|---|
50 |
50 |
5 |
60.0018 |
83.7601 |
23.7583 |
70 |
50 |
5 |
68.7478 |
89.7807 |
21.0329 |
50 |
70 |
5 |
62.1598 |
85.3878 |
23.228 |
70 |
70 |
5 |
73.7424 |
92.5325 |
18.7901 |
50.00 |
50.00 |
7 |
61.281 |
84.7362 |
23.4552 |
70 |
50 |
7 |
70 |
90.5174 |
20.5174 |
50 |
70 |
7 |
61.3062 |
85.3878 |
24.0816 |
70 |
70 |
7 |
75.0066 |
93.1499 |
18.1433 |
43.2 |
60 |
6 |
57.7026 |
81.9235 |
24.2209 |
76.8 |
60 |
6 |
77.5184 |
94.2818 |
16.7654 |
60 |
43.2 |
6 |
62.184 |
85.4055 |
23.2215 |
60 |
76.8 |
6 |
72.5056 |
91.8976 |
19.392 |
60 |
60 |
4.3 |
65.1108 |
87.4628 |
22.352 |
60 |
60 |
7.7 |
63.7784 |
86.5475 |
22.7691 |
60 |
60 |
6 |
66.2792 |
88.2363 |
21.9571 |
60 |
60 |
6 |
63.7386 |
86.5196 |
22.781 |
60 |
60 |
6 |
62.3598 |
85.5339 |
23.1741 |
60 |
60 |
6 |
66.7986 |
88.5714 |
21.7728 |
60 |
60 |
6 |
65.0176 |
87.400 |
22.3824 |
60 |
60 |
6 |
67.5108 |
89.0922 |
21.5112 |
Mass reduction in osmosis
The mass reduction was different for different condition of syrup temperature and concentration. The mass reduction after osmotic dehydration was found to be in the range of 57.7026 to 77.5184 percent, corresponding to experiments at low level (43.2°Brix, 60°C, 6:1 STGR after 4 hr) and high level (76.8°Brix, 60°C, 6:1 STGR after 4 hr). Mass reduction in osmosis increased with increase in syrup temperature and concentration of solution. While STFR had the negligible effect on mass reduction. At initial stage increasing temperature and sugar concentration of solution raises water loss more than solid gain which causes an increase in mass reduction. Similar results have been reported by Sagar (2001), Eren et al., (2006) and Gracia-Segovia et al., (2010).
Water Loss in Osmosis
The water loss after osmotic dehydration was found to be in the range of 81.9235 to 94.2818 percent, corresponding to studies at low level (43.2°Brix, 60°C, 6:1 STGR after 4 hr) and high level (76.8° Brix, 60°C, 6:1 STGR after 4 hr). The water loss increased with increase in sugar concentration from 43.2 °Brix to 76.8 °Brix. It can be observed that for 60°Brix and 6:1 STGR when syrup temperature increased from 43.2 to 76.8°C, water loss increased from 85.4055 to 91.8976 percent after four hours of osmotic dehydration causing approximately 6.49 percent point increment. Similar results were obtained for 43.2°Brix, 50°Brix, 70°Brix. Water loss in osmosis increased with increase in sugar concentration, this was because an increase in the concentration of sugar solution resulted in osmotic gradient, which increased the driving force for water removal between solution and fruit, and thereby giving higher mass transfer rates. Similar results have been reported by Sagar (2001), Kaleemullah et al., (2002) and Singh et al., (2007).
Solid Gain in Osmosis
The values of solute gain were much lower than the water loss for all the process parameters during osmotic dehydration, because sucrose having larger ionic radius could not diffuse easily through the cell membrane and thus the approach to osmotic equilibrium was achieved primarily by flow of water from cell. It was observed that solid gain goes on decreasing as sugar concentration goes on increasing. The solid gain was 16.7634 % at high level 76.8°Brix, 60 °C and 6:1 STGR after 4 hrs to 24.2209 % at low level 43.2°Brix, 60°C, 6:1 STGR after 4 hrs. The values of solute gain were much lower than the water loss for all the process parameters during osmotic dehydration, because sucrose having larger ionic radius could not diffuse easily through the cell membrane and thus the approach to osmotic equilibrium was achieved primarily by flow of water from cell.
Checking of fitting mode for various responses
The optimization of the osmotic dehydration process was aimed at finding the levels of independent variables, which would give maximum mass reduction, water loss and minimum solid gain. The statistical analysis of the experimental data was performed to observe the effect of various process parameters on measured responses. The results indicate the adequacy of quadratic model for all responses because of high R2. The relative effect of each process parameter on individual response was compared from the p-value less than 0.05 indicate model terms are significant. Analysis of variance of fitted model showed that p-value less than 0.05 of sugar concentration and process temperature having the definite effect on mass reduction and water loss while STGR had negligible effect on mass reduction and water loss. In case of solid gain process variables like sugar concentration and process temperature having the definite effect. Interaction of process variables viz. sugar concentration and process temperature and also the quadratic term of sugar concentration having the definite effect on solid gain, whereas STGR had the negligible effect. Similar reports were reported by Singh et al., (2007) for osmotic dehydration of carrot cubes, Eren et al., (2006) for osmotic dehydration of potato.
Mass Reduction
The coefficient of significant of fitted quadratic model was evaluated by using F-test and P-value. The analysis of variance (ANOVA) for mass reduction given in Table 4. Regression model fitted to experiment result of mass reduction showed the P-value for lack of fit as 0.7083 implies the lack of fit was non-significant. The value of R2 was found to be 0.9437. Regression analysis showed that mass reduction was significantly (P<0.05) affected by the linear effect of sugar concentration (A) and process temperature (B) whereas it was not significantly (P>0.05) affected by STGR. It implies that increased mass reduction with increase of sugar concentration and process temperature. Fig. 1 indicates an increase in mass reduction with increase in sugar concentration and process temperature.
Table (4):
ANOVA for mass reduction.
Source |
sum of squares |
df |
mean square |
F-value |
P-value |
|---|---|---|---|---|---|
Model |
515.00 |
9 |
57.22 |
18.63 |
|
A-sugar concentration |
423.74 |
1 |
423.74 |
137.93 |
0.0001 |
B-process temperature |
63.89 |
1 |
63.89 |
20.80 |
0.0010 |
C-syrup to gel ratio |
0.033 |
1 |
0.03 |
30.01 |
10.9192 |
AB |
7.64 |
1 |
7.64 |
2.49 |
0.1459 |
AC |
0.55 |
1 |
0.55 |
0.18 |
0.6821 |
BC |
0.56 |
1 |
0.56 |
0.18 |
0.6779 |
A^2 |
9.66 |
1 |
9.66 |
3.15 |
0.1065 |
B^2 |
7.57 |
1 |
7.57 |
2.47 |
0.1475 |
C^2 |
1.29 |
1 |
1.29 |
0.42 |
0.5317 |
Residual |
30.72 |
10 |
3.07 |
||
Lack of Fit |
11.47 |
5 |
2.29 |
0.560 |
0.7083 |
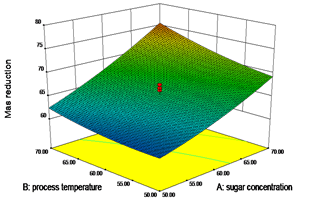
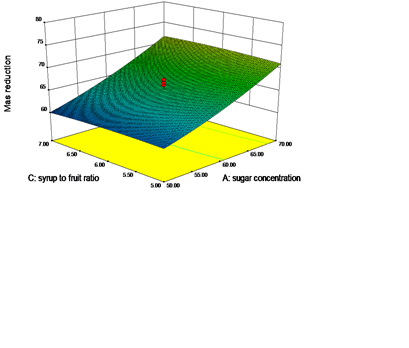
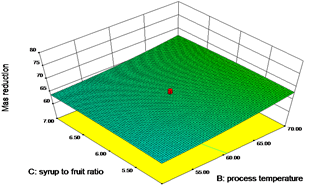 Fig. 1: Effect of Process Variables on Mass Reduction
Water loss
The significant of coefficient of fitted quadratic model was evaluated by using F-test and P-value. The analysis of variance (ANOVA) for water loss of quadratic is given in Table 5. Regression model fitted to experimental result of water loss showed the P-value for lack of fit as 0.7474 implies the lack of fit ws non-significant. The value of R2 was found to be 0.9428. regression analysis showed that water loss was significantly (P< 0.05) affected by the linear effect of sugar concentration (A) and process temperature (B) whereas it was not significantly (P> 0.05) affected by STGR. Fig. 2 indicates an increase in water loss with increase in sugar concentration and process temperature.
Table (5):
ANOVA for Water Loss.
Source |
sum of squares |
df |
mean square |
F-value |
P-value |
|---|---|---|---|---|---|
Model |
195.74 |
9 |
21.75 |
15.70 |
|
A-sugar concentration |
165.15 |
1 |
165.15 |
119.24 |
|
B-process temperature |
25.27 |
1 |
25.27 |
18.25 |
0.0016 |
C-syrup to fruit ratio |
0.043 |
1 |
0.043 |
0.031 |
0.8629 |
AB |
1.21 |
1 |
1.21 |
0.87 |
0.3729 |
AC |
0.018 |
1 |
0.018 |
0.013 |
0.9118 |
BC |
0.15 |
1 |
0.15 |
0.11 |
0.7489 |
A^2 |
0.81 |
1 |
0.81 |
0.58 |
0.4629 |
B^2 |
2.67 |
1 |
2.67 |
1.93 |
0.1949 |
C^2 |
0.33 |
1 |
0.33 |
0.24 |
0.6351 |
Residual |
13.85 |
10 |
1.39 |
||
Lack of Fit |
4.81 |
5 |
0.96 |
0.53 |
0.7474 |
not significant
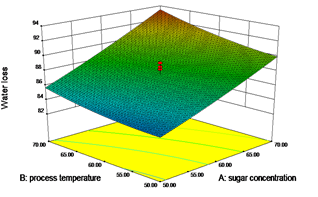
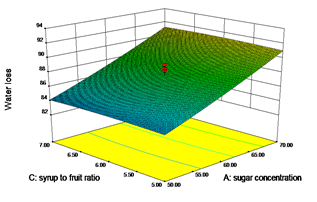
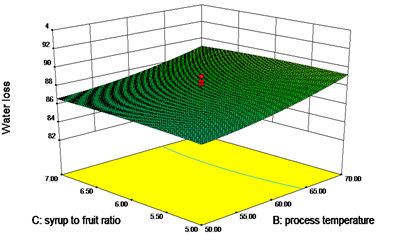 Fig. 2: Effect of Process Variables on Water Loss
Solid gain
The significant of coefficient of fitted quadratic model was evaluated by using F-test and P-value. The analysis of variance (ANOVA) for solid gain of quadratic is given in Table 6. Regression model fitted to experimental result of solid gain showed the P-value for lack of fit as 0.5592 implies the lack of fit was non-significant. The value of R2 was found to be 0.9542. regression analysis showed that water loss was significantly (P< 0.05) affected by the linear effect of sugar concentration (A) and process temperature (B) and also it was affected by interaction of process variables viz. sugar concentration, process temperature (AB), quadratic term of sugar concentration (A2) and process temperature (B2) whereas it was not significantly (P> 0.05) affected by STGR.
Table (6):
ANOVA for Solid Gain.
Source |
sum of squares |
df |
mean square |
F-value |
P-value |
|---|---|---|---|---|---|
Model |
78.27 |
9 |
8.70 |
23.13 |
|
A-sugar concentration |
59.80 |
1 |
59.80 |
159.02 |
|
B-process temperature |
8.79 |
1 |
8.79 |
23.39 |
0.0007 |
C-syrup to gel ratio |
6.866E-004 |
1 |
6.866E-004 |
1.826E-003 |
0.9668 |
AB |
2.78 |
1 |
2.78 |
7.38 |
0.0217 |
AC |
0.37 |
1 |
0.37 |
0.98 |
0.3467 |
BC |
0.13 |
1 |
0.13 |
0.35 |
0.5675 |
A^2 |
4.81 |
1 |
4.81 |
12.80 |
0.0050 |
B^2 |
1.21 |
1 |
1.21 |
3.23 |
0.0251 |
C^2 |
0.33 |
1 |
0.33 |
0.88 |
0.3711 |
Residual |
3.76 |
10 |
0.38 |
||
Lack of Fit |
1.75 |
5 |
0.35 |
0.87 |
0.5592 |
not significant
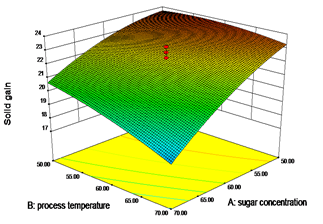
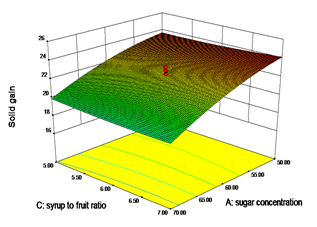
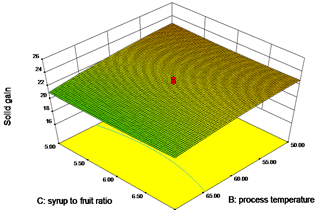 Fig. 3: Effect of Process Variables on Solid Gain
Optimization of osmotic dehydration process for Aloe Vera
Multi response optimization technique was adopted to determine the workable optimum conditions for the osmotic dehydration of Aloe Vera. The main criterion for constraints optimization was maximum possible mass reduction, maximum possible water loss and solid gain as minimum as possible (Singh et al., 2007). The optimum condition for each process variable along with the predicted values of responses and oVerall desirability are given in table below.
Selected optimization condition
The highest desirability value obtain was 0.903 (Fig. 4). The sugar concentration 70°Brix, process temperature 70°C and STGR 6.07 were predicted as the best condition by RSM design, for osmotic dehydration of Aloe Vera.
Table (7):
Optimum Solutions for Various Process Parameters.
No. |
Sugar conc. °Brix |
Process temp. °C |
STGR |
Mass Reduction % |
Water Loss % |
Solid Gain % |
Desirability |
|---|---|---|---|---|---|---|---|
1 |
70 |
70 |
6.07 |
75.5471 |
93.4468 |
17.8965 |
0.903 |
2 |
70 |
70 |
6.00 |
75.5452 |
93.4497 |
17.9013 |
0.902 |
3 |
70 |
70 |
6.15 |
75.5457 |
93.4414 |
17.8926 |
0.902 |
4 |
70 |
70 |
6.17 |
75.5444 |
93.4393 |
17.8918 |
0.902 |
5 |
70 |
70 |
5.96 |
75.5434 |
93.4506 |
17.904 |
0.902 |
6 |
70 |
69.99 |
6.04 |
75.5424 |
93.4454 |
17.8997 |
0.902 |
7 |
70 |
70 |
6.20 |
75.5427 |
93.437 |
17.8912 |
0.902 |
8 |
70 |
70 |
6.22 |
75.5411 |
93.4349 |
17.8908 |
0.902 |
9 |
70 |
69.96 |
6.01 |
75.5284 |
93.4395 |
17.9078 |
0.902 |
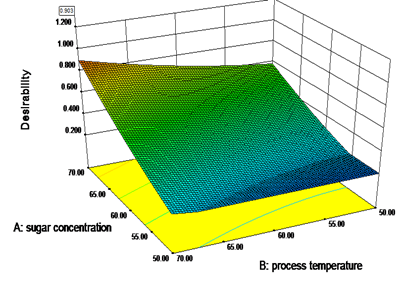 Fig. 4: Effect of Process Variables on Overall Desirability
Sugar concentration and process temperature of solution had definite effect on the kinetics of osmotic dehydration of Aloe Vera samples; whereas syrup to gel ratio had negligible effect. In osmotic dehydration, an increase of sugar concentration and process temperature increased water loss and mass reduction, whereas increase in sugar concentration and process temperature decreased solid gain. Water loss from the Aloe Vera samples was very rapid for the first two hours of osmosis and reduced subsequently with duration of osmosis. In all experiments, approximately 80 to 90% water loss took place in first 2 hr and remaining 5 to 7 percent water loss in next 2 hour. Solid gain from the Aloe Vera samples was very rapid for the first 2 hr of osmosis and reduced subsequently with duration of osmosis. The sugar concentration 70oBrix, process temperature 70°C and STGR 6.07 were predicted as the best condition by RSM design, for osmotic dehydration of Aloe Vera for maximum mass reduction and water loss and minimum solid gain. Osmosis as a pre treatment prior to convective air drying was able to decrease drying time.
- Eren, I. and Kaymak-Ertekin, F. Optimization of osmotic dehydration of potato using response surface methodology. Journal of Food Engineering, 2006; 79: 344-352.
- Femenia A., Sanchez, E., Simal, S. and Rosello, C. Compositional feature of polysaccharides from Aloe Vera (Aloe barbadensis Miller), plant tissues, Carbohydrate Polymer, 1999; 39: 109-117.
- Fernandes F.A.N, Gallao MI, Rodrigues S. Effect of osmosis and ultrasound on pineapple cell tissue structure during dehydration. Journal of Food Engineering, 2009; 90(2):186-190.
- Garcia- Segovia, P., Mognetti C., Andres- Bello A. and Martinez- Monzo, J. Osmotic dehydration of Aloe Vera (Aloe barbadensis Miller). Journal of Food engineering, 2010; 97: 154-160.
- Grindlay D, Reynolds T. The Aloe Vera phenomenon: A review of the properties and modern uses of the leaf parenchyma gel. J Ethnopharmacol, 1986; 16:117–151.
- Jayaraman, K.S, Das Gupta, D.K and Babu Rao, N. Effects of pre-treatment with salt and sucrose on the quality and stability of dehydrated cauliflower. International Journal of Food Science and Technology, 1990; 25: 47–51.
- Jayaraman KS, Das Gupta DK. Osmotic dehydration of fruits and vegetables: recent development in principles and techniques. Drying Technology, 1992; 10:1–50.
- Kaleemullah, S., Kallippan, R. and varadhraju, N., 2002. Studies an osmotic air drying
- Karathanos, V. T., Kostrapoulos, A. E., and Saravacos, G. D. Air drying kinetics of osmotically dehydrated fruits. Drying Technology, 1995; 13(5–7), 1503–1521.
- Lazarides, H. and Mavroudis, N. Freeze/ thaw effect on mass transfer rates during osmotic dehydration. Journal of Food Science, 1995; 60: 826-29.
- McAnalley BH. Process for preparation of Aloe products, 1993; European Patent WO 89/06539
- Pokharkar, S.M. Studies on osmotic concentration and air drying of pineapple slices. Unpublished Ph.D. thesis, 1997; Indian Institute of Technology, Kharagpur.
- Ranganna, S. Handbook of analysis and quality control of fruits and vegetable products, 2000; Tata McGraw Hill Publishing Co. Ltd., New Delhi.
- Rao, R. and Rajput. Organic farming of medicinal and aromatic plants extended summaries national seminar on organic farming current scenario and future trust organized by MOA, ICAR and ANGRAU, 2005; Hyderabad, 41-51.
- Rath, S. Aloe Vera-a versatile cash crop., 2003; www.Aloeindia.com.
- Sagar, R. Preparation of onion powder by means of osmotic dehydration and its packaging and storage. Journal of Food Science and Technology, 2001; 38(5): 525-28.
- Singh, B., Kumar, A. and Gupta, A. Study of mas transfer kinetics and effective diffusivity during osmotic dehydration of carrot cubes. Journal of Food Engineering, 2007; 79: 471-80.
© The Author(s) 2017. Open Access. This article is distributed under the terms of the Creative Commons Attribution 4.0 International License which permits unrestricted use, sharing, distribution, and reproduction in any medium, provided you give appropriate credit to the original author(s) and the source, provide a link to the Creative Commons license, and indicate if changes were made.