

ISSN: 0973-7510
E-ISSN: 2581-690X
Throat swabs were collected to isolate S. aureus by using blood agar media. Biochemical tests were performed. Genomic DNA was isolated and PCR was done for erm A, ermB and erm C genes followed by bioinformatics analysis. Isolates were screened on erythromycin disc (erythromycin range 1- 125mg/l). All 47 S. aureus isolates found to be resistance to erythromycin by phenotypic methods contained at least 1 were erythromycin resistance gene. That’s mean all S. aureus isolates which were resistance to erythromycin by disc diffusion method were found as positive by PCR for erm A, B, and C genes.
Throat swabs, bacteria, erm A, erm B, erm C.
Staphylococci are Gram-positive bacteria, with diameters of 0.5 – 1.5 ìm and characterized by single cocci, which divide in more than one level to form grape-like clusters. To date, there are 45 species and eight sub-species in the genus Staphylococcus, many of which preferentially found the human body (Kloos and Bannerman, 1994), however Staphylococcus aureus and Staphylococcus epidermidis are the two most characterized and studied strains.
The staphylococci are non-motile, non-spore form facultative anaerobes that grow by aerobic respiration or by fermentation. They grow easily on many types of media and are active metabolically, fermenting carbohydrates and producing pigments that differ from white to deep yellow. Most species have a relative complex nutritional requirement, However, in general they require an organic source of nitrogen, supplied by 5 to 12 essential amino acids, e.g. arginine, valine, and B vitamins, including thiamine and nicotinamide (Kloos and Schleifer, 1986; Wilkinson, 1997).
Members of this genusare catalase-positive and oxidase-negative, differentiates them from the genus Streptococci, which are catalase-negative, and have a different cell wall composition to Staphylococci (Wilkinson, 1997).
S. aureus is both a commensal organism and a pathogen. The anterior nares are the main ecological niche for S. aureus. Approximately 20% of individuals are persistently nasally colonized with S. aureus, and 30% are intermittently colonized. However, numerous other sites may be colonized, including the axillae, groin, and gastrointestinal tract. Colonization provides a reservoir from which bacteria can be introduced when host defenses are breached, whether by shaving, aspiration, insertion of an indwelling catheter, or surgery. Colonization clearly increases the risk for subsequent infection (Wertheim et al., 2005; Kluytmans et al., 1997).
Erythromycin is a metabolic product of Streptomyces erythreus and consists of a 14-member lactone ring to which are attached two deoxy-sugars, desosamine and cladinose. The macrocyclic lactone ring is the source of the class name, macrolide. Erythromycin, like most macrolides, appears to act by binding in the ribosomal tunnel through which the nascent peptide moves and thus can be considered apeptidyltransferase inhibitor (Schmidt, 1999).
Sample collection
185 samples were collected from healthy students, aged between 17-28 years, present at Cyto Gene Research and development laboratory from January 2016 to May 2016. All specimens collected constitute of both male and female.
Isolation and Identification Bacteria
The throat swab samples were immediately cultured on 5% sheep blood agar media plates. The culture obtained from primary culture on 5% sheep blood agar plates. It was sub-cultured on brain heart infusion to obtain a pure growth. The isolates were identified based upon their culture characteristic, morphology and by using Biochemical methods (Bergey’s Manual of Systemic Bacteriology) (Holt et al., 1984).
Antibiotic Sensitivity Test
Antibiotic sensitivity test was done by Disc diffusion (Kirby bauer) method using erythromycin, penicillin, Amoxicillin, clindamycin, tetracycline, ciprofloxacin and trimethoprime against all the isolates
DNA Isolation from bacterium
Isolation of genomic DNA was performed using the Phenol chloroform method. Extraction of bacterial DNA was done through broth bacterial culture. Taken 2ml culture broth in an Eppendorf tube and centrifuged at 10000 rpm for 10 mins only. There after supernatant was discarded and the pellet was dissolved in T.E. buffer. 10% SDS was added and tubes were kept in water-bath for cell lysis. After 1-2 hours tubes were again centrifuged and the supernatant was collected. Phenol: Chloroform: Isoamyl ratio was added and the samples were again centrifuged. An upper transparent layer containing DNA was collected and 3 M sodium acetate was added for precipitation of DNA and kept in ice cold conditions. Again double volume of ethanol added in eppendorf tubes and centrifuged. Discard the supernatant and air dry the tubes and add T.E. buffer to the tubes for loading in Agarose gel electrophoresis.
PCR amplification
Template DNA was used in each primer (forward and reverse primer) by adding dNTP and four deoxyriboneucliotide tri phosphate. Taq polymerase was used in each sample. Amplification was carried out in a thermal cycler. Temperature for Initial denaturation at 96p C for 3 minutes followed by 30 cycle, each cycle consisted of denaturation of DNA for 1 second at 95p C, annealing of the primers for 30 seconds at 35p C and elongation 72p C for7 minutes.
Table (1):
primers of erm A, B, C and 16SrRNA.
Primers |
Sequences (5’ – 3’) |
Conc (Unit/µl) |
Tm Value |
Length (bp) |
|---|---|---|---|---|
erm A-F |
TATCTTATCGTTGAGAAGGGATT |
3 |
57oC |
24 |
erm A-R |
CTACACTTGGCTTAGGATGAAA |
3 |
53oC |
22 |
erm B-F |
TATCTGATTGTTGAAGAAGGATT |
3 |
57oC |
24 |
erm B-R |
GTTTACTCTTGGTTTAGGATGAAA |
3 |
57oC |
24 |
erm C-F |
CTTGTTGATCACGATAATTTCC |
3 |
53oC |
22 |
erm C-R |
ATCTTTTAGCAAACCCGTATTC |
3 |
53oC |
22 |
16S-F |
GGAGGAAGGTGGGGATGACG |
3 |
57Co |
20 |
61S –R |
ATGGTGTGACGGGCGGTGTG |
3 |
57Co |
20 |
Primer sequences
Analysis by bioinformatics
The comparison of the nucleotide sequences of the unique fragment with the sequences available in the Gen bank database was carried out by using the NCBI BLAST program (http//www.ncbi.nlm.nih.gov/blast). Phylogenetic tree were generated on the basis of sequences of Myelo peroxidase gene sequences using Clustal W 1.8 (Thompson et al., 1994). A method poly genetic tree was constructed using the sequences obtained from the samples.
Isolation and Identification of S. aureus: Current study was performed in 5 months period from January to May in the year 2016. The study was conducted among 185 healthy students of Cyto Gene Research and Development Laboratory in Lucknow. Spreading of the swab samples were done on blood agar media followed by streaking on Brain heart Infusion agar media. Out of 185 throat swabs samples 87 (47%) of samples were positive i.e., β hemolytic colonies and 98 (52.9%) were non- hemolytic (no zone around the colonies). In this study, from total throat swab samples 47% of sample showed positive for β hemolysis like Devapiry et al. (2012)work where a similar percentage of β-hemolytic population was obtained on blood agar media. The differences in presence of S. aureus (F. Cal=17.552) in relation to different age group was statistically significant.
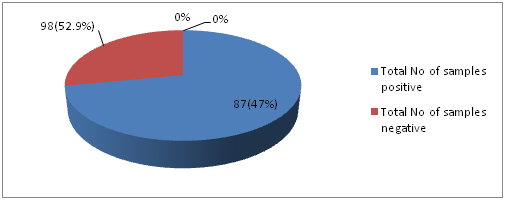
Fig. 1: Distribution of samples showing positive and negative for β-hemolysis on blood agar media
The isolates were identified based on their morphological and biochemical characteristics. The biochemical tests for identification of isolates and their results are shown in the table (table 2) given below. The characteristic properties of the isolates determined the species as Staphylococcus aureus.
Table (2):
Biochemical test results for the isolates from throat swab.
Bacteria |
Catalase Test |
Coagulase Test |
Gelatine hydrolysis |
Mannitol fermentation Test |
MR |
Vp |
Indole Test |
Citate utilization Test |
|---|---|---|---|---|---|---|---|---|
S. aureus |
+ |
+ |
+ |
+ |
+ |
+ |
– |
+ |
* “+” = Positive; “-” = Negative
All the identified S .aureus populations were tested for their antimicrobial susceptibility patterns. The isolates showed high resistance to erythromycin, penicillin, Amoxicillin and clindamycin (100%, 100%, 97.87%, 91, 48%) respectively. Antibiotic resistance rates for gentamicin, vancomycins were moderate (53.19%, 78.72%) respectively, while S. aureus isolates showed low resistance against tetracycline, ciprofloxacin and tri methoprime (19.14%, 6.38% and 44.68%) respectively. These results were found similar to earlier studies of Agne et al. (2010), Nizami et al. (2012) and Kaur and Chate (2015). However this study showed dissimilarity with previous studies including Ahmad and Srikanth (2013) and Adebayo et al. (2011).
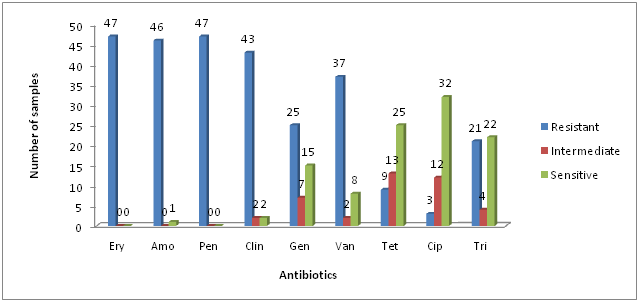
*Ery = Erythromycin; Amo = Amoxicillin; Pen = Penicillin; Clin = Clindamycin; Gen = Gentamicin; Van = Vancomycins; Tet = Tetracycline; Cip = Ciprofloxacin and tri = Trimethoprime
Fig. 2: Antibiotic resistance profile of Staphylococcus aureus
Primers for internal regions of erm(A), erm(B), erm(C) have been described previously in table (Table 1). Genomic DNA from the resistant isolates which possessed either erm(A), erm(B) or erm(C) were isolated and subjected to PCR analysis with primers specific for erythromycin resistant genes i.e., erm(A), erm(B) and erm(C). The results of isolation of DNA from the bacterial samples are shown below:
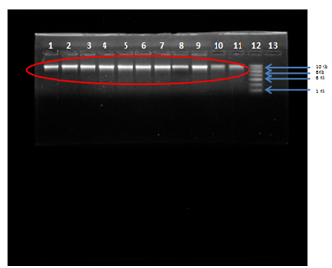
Fig. 3: Agarose Gel Electrophoresis (a) 0.8% Agarose gel (b) Buffer used- 1X TAE (c) Visualization dye- EtBr, Lane 1,2,3,4,5,6,7,8,9,10,11 Genomic DNA of S. aureus isolates compared with Lane 12-1kb DNA Ladder.
Genomic DNA was isolated from the five isolates of S. aureus and 16S rRNA region of DNA was amplified using universal 16S rRNA primers in thermal cycler. All the five isolates of S. aureus obtained as genomic DNA were amplified by PCR and characterized by sequencing. The BLAST (https://blast.ncbi.nlm.nih.gov/Blast.cgi) analysis of the sequences was done followed by CLUSTAL OMEGA (http://www.ebi.ac.uk/Tools/msa/clustalo/). Thus the isolate were confirmed as S. aureus as its maximum identity to staphylococcus species was obtained. In this study 16SrRNA detected in 45 (95.74%/) out of 47 S. aureus samples.
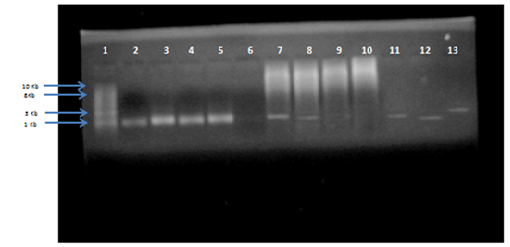
Fig. 4: Agarose gel electrophoresis of PCR product for 16S rRNA amplified gene (size more than 1.4 Kb) compared with (1Kb) DNA ladder
The result obtained showed the aligned sequences with my query sequence. The sequences with maximum identity were selected to construct the phylogenetic tree. The resistance patterns of S. aureus results determined by conventional methods were compared with the results of the (erm) genes which observed by PCR technique. The isolates which showed positive result with conventional methods were subjected to PCR-based detection of erythromycin resistance genes i.e., erm(A), erm(B) and erm(C).
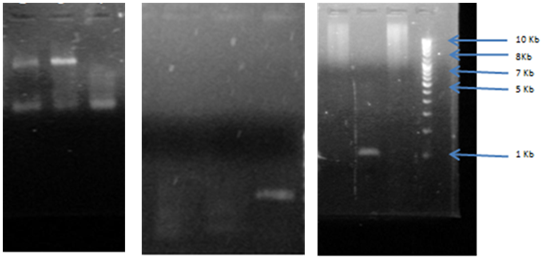
Fig. 5: Agarose gel electrophoresis of PCR amplification for erm A gene, erm, B gene erm C gene (amplified size 737bp) compared with (1Kb) DNA ladder lane 1, 2, 3 shows sample 4, 5, 6 for erm A gene which shows positive results of band. DNA ladder lane 4, 5, 6 shows sample 8,9,10 for erm B in which only lane 10 showed positive results of band. DNA ladder lane 7, 8,9,10 shows sample 1,2,3,4 for erm C in which 7,9,10 only showed positive result of band.
Table (3):
Distribution of erm genes among S. aureus resistance to erythromycin.
| Total No of S. aureus isolates | NO (%) of S. aureus | |||||
|---|---|---|---|---|---|---|
| ermA | % | ermB | % | ermC | % | |
| 47 | 29 | 61.7 | 7 | 14.89 | 11 | 23.40 |
| P value=7.815 | ||||||
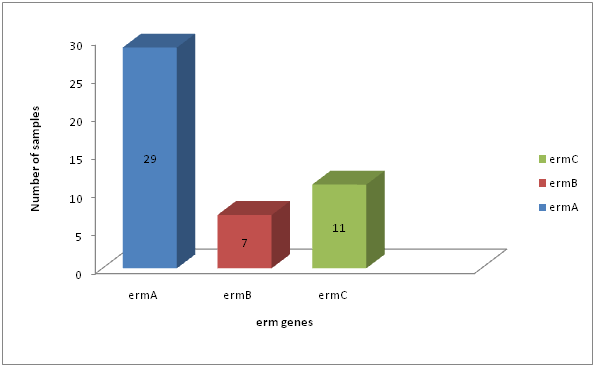
Fig. 6: Distribution of erm genes among S. aureus resistance to erythromycin
Erythromycin resistance in Staphylococci was predominantly mediated by erythromycin resistant methylase encoded by erm genes (Zamantar et al., 2011). Fourty seven (47) of S. aureus were resistance to erythromycin; these isolates contain any of erythromycin resistance genes tested (erm A, B, C).In our study, the most prevalent resistance gene in S. aureus was erm A (29/47; 61.7%), followed by erm C (11/47; 23.40%). Less common were erm B which occurring in (7/47; 14.89%) of the erythromycin resistant S. aureus isolates tested. The differences in prevalence of erm A, B and C (p=7.815) in S. aureus was statistically significant (Table 4.10, Figure 4.10).In general our observations are in line with the findings of (Lina et al., 1999; Franz et al., 2000). They found that the erm A gene was more common in S. aureus, similar findings to our results were responsible for erythromycin resistance in 60% among erythromycin resistance S. aureus isolated (Saderi et al., 2011). The erm A gene was solely responsible for erythromycin resistance until 1971, while erm C became dominant between 1984 and 1988 (Westh et al., 1995). Although erm B was present in only a minority of strains, it was formerly found only in animal strains (Eady et al., 1993). In contrast to (Lina et al; 1999; Nicola et al; 1998) we found an association between different erm genes, namely erm A in combination with erm C, in S. aureus isolates.
All 47 S. aureus isolates found to be resistance to erythromycin by phenotypic methods contained at least 1 were erythromycin resistance gene. That’s mean all S. aureus isolates which were resistance to erythromycin by disc diffusion method were found as positive by PCR for erm A, B, and C genes. From the above study it is concluded that the throat has to be considered as an important carriage site for S. aureus and should be included when screening for S. aureus. The antibiotic resistance grow day by day it is important to use suitable antibiotic after proper laboratory diagnosis such as culture and antibiotic susceptibility tests and treatment should depend on it. The resistance mainly to erythromycin in S. aureus was due to the presence of erm A, erm B and erm C.
- Adebayo O Shittu, Kenneth Okon, Solayide Adesida, Omotayo Oyedara, Wolfgang Witte, Birgit Strommenger, Franziska Layer and Ulrich Nübel ). Antibiotic resistance and molecular epidemiology of Staphylococcus aureus in Nigeria.BMC Microbiology, 2011; 11-92.
- Agnë Kirkliauskienë1, Arvydas Ambrozaitis1, Robert L. Skov2, Niels Frimodt-Moller2. OR IGIN A LÛS S T R A IP S N AI journal, 2010; 2(49), 124-131.
- Devapriya, F., Sajith, P., Ranganathan, R., Shanmugam. Prevalence of biofilm and betalactamase producing Staphylococcus in nasal and throat isolates from healthy volunteers: A medical alert.Gulf Medical Journal, 2012; 1(151),56-511.
- Eady, E.A., Ross, J.I., Tipper, J.L., Walters, C.E., Cove J. H. and Nobel. W.C. Distribution of genes encoding erythromycin ribosomal methylases and an erythromycin efflux pump in epidemiologically distinct groups of staphylococci. Antimicrobial Agents and Chemotherapy., 1993; 31: 211-17.
- Gradelsk E, Valera L, Aleksunes L, Bonner D, Tomc J. Correlation between genotype and phenotyping categorization of staphylococci based on methicillin susceptibility and resistance. J Clin. Microbiol., 2001; 30: 2961-3.
- Halt, J.G., Bergey, D.H and Krieg, N.R. Bergeys’ Manual of systematic Bacteriology, Williams and Wilkims, Baltimore, USA, 1984; 2.
- Kloos WE, Bannerman TL. Update on clinical significance of coagulase-negative staphylococci. Clin Microbiol Rev, 1994; 7: 117-140.
- Kloos WE, Schleifer KH. Genus IV – StaphylococcusRosenbach 1884. In: Sneath PHA, Mair NS, Sharpe ME, eds. Bergey’s Manual of Systemic Bacteriology, Williams and Wilkins, Baltimore, 1986; 2.
- Lina, G., Quaglia, A., Reverdy, M.E., Leclercq, R., Vandenesch, F and Etienne, J. Distribution of genes encoding resistance to macrolides, lincosamides, and streptogramins among staphylococci. Antimicrobial Agents and Chemotherapy. 1999; 43: 1062-2.
- Nizami Duran, Burcin Ozer, Gulay Gulbol Duran, Yusuf Onlen, and Cemil Demir. Antibiotic resistance genes & susceptibility patterns in staphylococci. Indian Journal Of Medical Research, 2012; 135(3): 389–396.
- Pavilonyte, Z., Kacerauskiene, J., Budryte, B., Keizeris, T., Junevicius, J., Pavilonis, A. Staphylococcus aureus prevalence among preschool and school aged pupils. Medicina, 2007; 43(11): 887-94.
- Saderi, H., Emadi, B., Owlia, P. Phenotypic and genotypic study of macrolide, Lincosamide and Streptogramin B (MLSB) resistance in clinical isolates of Staphylococcus aureus in Tehran, Iran. Med Sci Monit, 2011; 17: 48-53.
- Schmitz FJ1, Sadurski R, Kray A, Boos M, Geisel R, Köhrer K, Verhoef J, Fluit AC . Prevalence of macrolide-resistance genes in Staphylococcus aureus and Enterococcus faecium isolates from 24 European university hospitals.J AntimicrobChemother, 2000; 45(6), 891-4.
- Wertheim, H.F., Vos, M.C., Ott, A., van Belkum, A., Voss, A., Kluytmans, J.A., van Keulen, P.H., V and enbroucke-Grauls, C.M., Meester, M.H., Verbrugh, H.A., Risk and outcome of nosocomial Staphylococcus aureus bacteraemia in nasal carriers versus non-carriers. Lancet, 2004; 364: 703-705.
- Wertheim HF, Melles DC, Vos M.C., The role of nasal carriage in Staphylococcus aureus infections. Lancet Infect Dis; 2005; 5: 751–62. [PubMed: 16310147].
- Westh, H., Hougaard, D. M., Vuust, J.& Rosdahl, V.T. Prevalence of erm gene classes in erythromycin resistant Staphylococcs aureus strains isolated between 1959 and 1988. Antimicrobial Agents and Chemotherapy, 1995; 39: 369-37.
- Wilkinson BJ. Biology. In: Crossley KB, Archer GL, eds. The Staphylococci in Human Diseases. Churchill Livingston, 1997; London. pp 1-38.
© The Author(s) 2017. Open Access. This article is distributed under the terms of the Creative Commons Attribution 4.0 International License which permits unrestricted use, sharing, distribution, and reproduction in any medium, provided you give appropriate credit to the original author(s) and the source, provide a link to the Creative Commons license, and indicate if changes were made.