

ISSN: 0973-7510
E-ISSN: 2581-690X
This investigation intended to optimize the culture medium for Priestia paraflexa ONG1, a fish probiotic, by combining conventional methods with factorial experimental designs. One-variable-at-a-time (OVAT) experiments demonstrated that lactose and tryptone were the preferred carbon and nitrogen sources, respectively, whereas optimal growth occurred at pH 7.6. Plackett-Burman design (PBD) was employed to screen seven variables (lactose, tryptone, yeast extract, NaCl, KH2PO4, MgSO4, and MnSO4) for their influence on probiotic cell density. Statistical analysis revealed yeast extract, MgSO4, and MnSO4 as significant factors (p < 0.05), which were subsequently optimized using response surface methodology (RSM). Optimal concentrations for the three factors were identified using a Box-Behnken design (BBD). A predictive model for cell density was then generated using a quadratic equation. The model exhibited a strong fit (R² = 98.73%, adjusted R² = 96.45%) and identified yeast extract, MnSO4, and their quadratic and interaction terms as the most influential factors (p < 0.05). The optimized medium, containing lactose (20 g/L), tryptone (2 g/L), yeast extract (8.82 g/L), NaCl (2.5 g/L), KH2PO4 (1.25 g/L), MgSO4 (0.15 g/L), and MnSO4 (0.5 g/L), resulted in a maximum cell density of 6.5 × 10⁹ CFU/ml, representing a 28.3-fold increase compared to the control nutrient broth medium. This study demonstrated the successful optimization of growth conditions for P. paraflexa ONG1, providing valuable insights for the development of this promising aquaculture probiotic.
Probiotic, Priestia paraflexa ONG1, Plackett-Burman Design, Box-Behnken Design, Medium Optimization, Response Surface Methodology
Probiotics are beneficial microorganisms that play a crucial role in aquaculture, offering numerous advantages for aquatic animal health and sustainable production.1 They are widely used as an eco-friendly alternative to antibiotics for controlling fish diseases and improving overall aquaculture performance.2,3 Aquaculture commonly employs probiotics from the genera Bacillus, Lactobacillus, Lactococcus, Enterococcus, and Saccharomyces.4 Among these, Bacillus species are considered distinctive probiotics in aquaculture due to their ability to form spores, which allows them to survive harsh environmental conditions.5 These probiotics possess several advantageous characteristics, including their non-pathogenic nature, lack of toxicity to fish, and the ability to synthesize antimicrobial compounds, which contribute to their superior suitability as compared to other probiotic options in aquaculture.6 Environmental conditions, including temperature, pH and stirring intensity, have a substantial impact on the development of probiotic.7 Moreover, the composition of the substrate and the availability of nutrients are essential factors in the production of probiotic biomass.8 By optimizing probiotic growth, we can produce more viable probiotic cells, which is essential for developing high-quality probiotic products.9
Optimal microbial biomass production depends on the appropriate design of the growth medium.10 To maximize the production of our target products, we experimented with different medium formulations. A traditional one-variable-at-a-time (OVAT) method requires altering a single variable while keeping the others constant. Though simple, it is inefficient due to its high experimental demand and neglect of factor interactions.11 In recent times, different statistical approaches allow researchers to efficiently screen and optimize multiple medium components simultaneously.12 Accordingly, Plackett-Burman design (PBD) is a statistical tool that employs a fractional factorial design to systematically identify key factors influencing probiotic growth in fermentation media, significantly reducing experimental effort and cost.13 This design minimizes bias in linear effect estimation, simplified medium composition, and facilitates subsequent optimization procedures.14 While the PBD effectively screened the initial variables, it also set the stage for more detailed optimization techniques, potentially including response surface methodology (RSM) for fine-tuning the identified significant factors.15 RSM is a well-established modeling technique that is frequently employed to enhance the production of a diverse array of biotechnological products, including biopesticides,16 exopolysaccharides,17 antibiotics,18 enzymes,19 and biofuels.20
Priestia paraflexa ONG1, a spore-forming probiotic bacterium obtained from the digestive tract of wild Nile tilapia (Oreochromis niloticus) exhibits potential probiotic benefits. Importantly, tolerance to acid and bile salt, extracellular enzyme production, adhesion ability, and biofilm formation are essential traits for its potential application as a feed additive in aquaculture. Cultivating this strain at high cell densities is helpful in improving the health and disease resistance of aquatic animals. This study sought to identify the optimal culture conditions that would maximize the cell density of the probiotic P. paraflexa ONG1 strain. OVAT was initially employed to identify the optimal pH, carbon, and nitrogen sources as the most influential medium components. Subsequently, a key component within the medium was further investigated using PBD. Lastly, a Box-Behnken design (BBD) was employed to meticulously investigate and fine-tune the medium composition for maximal growth of P. paraflexa ONG1.
Bacterium and seed culture preparation
This study used a gut-associated probiotic strain, Priestia paraflexa ONG1 (PQ057050.1), sourced from the intestines of wild Nile Tilapia. The strain was activated twice in nutrient broth at 30 °C before each experiment. The seed medium, consisting of peptone (1%), NaCl (0.5%), and yeast extract (0.2%) was prepared and adjusted pH to 7.0 ± 0.2. The seed culture was cultivated in 20 ml of sterile seed medium within an orbital flask shaker operating at 150 rpm for an incubation period of 16-18 hour at a temperature of 30 °C. A 1% (v/v) inoculum of the seed culture was used to initiate growth in the experimental media for all experiments. Concurrently, the serial dilution and spread plate method were employed to determine the colony-forming units (CFU) of P. paraflexa ONG1 strain in unoptimized media.21
OVAT-based media optimization
The impact of individual factors, namely carbon sources, nitrogen sources, and pH, on bacterial cell mass was investigated using the OVAT approach. A preliminary assessment of the carbohydrate utilization capacity of the culture was conducted before implementing the OVAT design. Glucose, sucrose, lactose, cellulose, and starch were chosen as the carbon sources. The basal medium, prepared in 10 ml aliquots, is composed of 0.5% yeast extract, 1% carbon source, and bromocresol purple as a pH indicator.11 A modified cultivation medium, based on the protocol of Vlajkov et al.,16 was employed to determine the most suitable carbon source. The following components were included in the medium at the indicated concentrations: carbon source (1%), yeast extract (0.5%), NaCl (0.5%), KH2PO4 (0.25%), MgSO4 (0.03%), and MnSO4 (0.027%). Glucose, sucrose, lactose, and starch were chosen as carbon sources according to metabolic profile of the culture. A control medium formulated without an added carbon source, while incorporating 0.5% yeast extract, may nonetheless support the proliferation of certain bacterial species due to the presence of residual carbohydrate content in the yeast extract. Medium pH was fixed to 7.0 ± 0.2 before autoclaving the medium. In the subsequent phase of the experiment, lactose was used as carbon source. This study investigated a range of nitrogen sources, including peptone, tryptone, urea, and ammonium sulfate. The remaining medium components and pH were kept constant. Culture cultivation was carried out using an orbital shaker (150 rpm) at 30 °C for 24 h incubation period. To optimize the pH for cell growth, the media pH was systematically adjusted within the range of 6.0 to 8.0, in increments of 0.4 (6.0, 6.4, 6.8, 7.2, 7.6, and 8.0), using 1 M NaOH and 1 M HCl. Cell density for each experimental condition was determined spectrophotometrically at 600 nm after 24 hour of cultivation.
Plackett-Burman Design (PBD)
The growth of P. paraflexa ONG1 was investigated using PBD to determine the significant influencing factors. These factors included: lactose (A), tryptone (B), yeast extract (C), NaCl (D), KH2PO4 (E), MgSO4 (F), and MnSO4 (G). Two levels were assigned to each variable: a low (-1) and a high (+1) level (Table 1). To evaluate the impact of these factors on the cell density, 12 experimental runs were conducted. Each run the components were formulated using the specific concentrations (Table 2), and the fixed optimum pH was 7.6. A 1% inoculum of P. paraflexa ONG1 was added to each sterile media flask, incubated at 30 °C for 24 hour on an orbital shaker, and cell density was determined spectrophotometrically at 600 nm. Statistical analysis was performed to identify significant factors influencing cell growth (Table 3). Factors were considered statistically significant at p < 0.05. Based on the significance of each factor, high or low levels were selected for subsequent optimization studies. Non-significant factors were excluded from further optimization.14
Table (1):
High and Low level of factors (in g/L) used in PBD
Factor |
Coded factor |
Low level (-1) |
High level (+1) |
|---|---|---|---|
Lactose |
A |
2 |
20 |
Tryptone |
B |
2 |
20 |
Yeast extract |
C |
1 |
10 |
NaCl |
D |
2.5 |
25 |
KH2PO4 |
E |
1.25 |
5 |
MgSO4 |
F |
0.15 |
0.6 |
MnSO4 |
G |
0.13 |
0.5 |
Table (2):
PBD: Experimental matrix and response values
| Run | Factors | Cell density (A600) | ||||||
|---|---|---|---|---|---|---|---|---|
| A | B | C | D | E | F | G | ||
| 1 | 1 | 1 | -1 | 1 | -1 | -1 | 1 | 0.52 ± 0.07 |
| 2 | 1 | 1 | 1 | -1 | 1 | -1 | -1 | 0.53 ± 0.03 |
| 3 | -1 | 1 | 1 | 1 | -1 | 1 | -1 | 0.53 ± 0.01 |
| 4 | -1 | -1 | 1 | 1 | 1 | -1 | 1 | 0.57 ± 0.00 |
| 5 | 1 | -1 | -1 | 1 | 1 | 1 | -1 | 0.52 ± 0.03 |
| 6 | -1 | 1 | -1 | -1 | 1 | 1 | 1 | 0.57 ± 0.02 |
| 7 | 1 | -1 | 1 | -1 | -1 | 1 | 1 | 0.63 ± 0.01 |
| 8 | -1 | 1 | 1 | -1 | 1 | -1 | -1 | 0.54 ± 0.02 |
| 9 | -1 | 1 | -1 | 1 | -1 | 1 | 1 | 0.56 ± 0.04 |
| 10 | 1 | -1 | 1 | -1 | -1 | -1 | 1 | 0.59 ± 0.02 |
| 11 | 1 | -1 | -1 | 1 | 1 | 1 | -1 | 0.50 ± 0.05 |
| 12 | -1 | -1 | -1 | -1 | -1 | -1 | -1 | 0.42 ± 0.04 |
A: Lactose; B: Tryptone; C: Yeast extract; D: NaCl; E: KH2PO4; F: MgSO4; G: MnSO4
Table (3):
Statistical analysis of factors influencing high cell density production of P. paraflexa ONG1 using PBD data
Variables |
Effect |
Coefficient |
t-value |
p-value |
Significance |
|---|---|---|---|---|---|
Model |
0.54000 |
112.67 |
0.000 |
** |
|
A |
0.02000 |
0.01000 |
1.97 |
0.121 |
|
B |
0.01000 |
0.00500 |
0.98 |
0.381 |
|
C |
0.06300 |
0.03150 |
6.00 |
0.004 |
** |
D |
-0.00800 |
-0.00400 |
-0.76 |
0.489 |
|
E |
0.02125 |
0.01062 |
2.09 |
0.105 |
|
F |
0.04700 |
0.02350 |
4.48 |
0.011 |
* |
G |
0.07375 |
0.03687 |
7.25 |
0.002 |
** |
R2 |
0.9630 |
||||
Adj-R2 |
0.8983 |
A: Lactose; B: Tryptone; C: Yeast extract; D: NaCl; E: KH2PO4; F: MgSO4; G: MnSO4
* represents p < 0.05; ** represents p < 0.01
RSM: Box-Behnken design (BBD)
A BBD within the RSM framework was employed to optimize the growth of P. paraflexa ONG1 by systematically investigating the combined effects of selected variables and determining the optimal conditions.22 The investigation of the three most critical variables involved a design matrix encompassing 15 trials. Each variable under scrutiny was assessed at three distinct levels: low (-1), medium (0), and high (+1) values (Table 4). Cell density after a 24-hour incubation period served as the response variable. A quadratic polynomial regression model was applied to predict the response based on the relationships with the correlated independent variables.23 This model was subsequently used to determine the optimal conditions. The accuracy of the predicted model was assessed through independent triplicate experiments conducted under optimized cultivation conditions. Cultures were grown in optimized medium, and cell viability was validated using the viable count method.
Table (4):
Experimental design parameters for RSM experiments
| Variables | Units | Symbol code | Level | ||
|---|---|---|---|---|---|
| +1 | 0 | -1 | |||
| Yeast extract | g/L | X1 | 10 | 5.5 | 1 |
| MgSO4 | g/L | X2 | 0.6 | 0.375 | 0.15 |
| MnSO4 | g/L | X3 | 0.5 | 0.315 | 0.13 |
Statistical analysis
Statistical analyses were performed using SPSS software (IBM, USA). All experiments were conducted in triplicate, and data are presented as mean ± standard deviation. One-way ANOVA followed by Duncan’s Multiple Range Test (DMRT) was used to determine statistically significant differences. PBD and RSM designs were generated and analyzed using Minitab 22 (Minitab Inc., USA).
Optimizing Carbon, Nitrogen sources, and pH for P. paraflexa ONG1 cell density production
Bacterial growth is intricately linked to the availability and utilization of both carbon and nitrogen sources. Diverse carbon and nitrogen substrates exhibit varying degrees of suitability for biomass production.24,25 Various carbon and nitrogen sources were evaluated to determine the most significant factors for maximizing high cell density production in P. paraflexa ONG1. Carbohydrate utilization tests indicated that probiotic bacteria could ferment glucose, sucrose, lactose, and starch. As a result, the selected carbon sources were the sole focus of the subsequent optimization. Lactose yielded the highest cell density (OD600 = 0.40 ± 0.005) among the four carbon sources tested. Starch, sucrose, and glucose resulted in lower densities of 0.35 ± 0.028, 0.32 ± 0.003, and 0.25 ± 0.011, respectively. Statistical analysis confirmed that lactose was the preferred carbon source for P. paraflexa ONG1 (p < 0.05). The observed preference for lactose aligns with the findings of Niekerk and Pott,26 who demonstrated the superior biomass production of Bacillus circulans DSM-11 on lactose compared with glucose, achieving a 1.7-fold increase in biomass yield. Interestingly, lactose supplementation in a growth medium for Priestia flexa N7 significantly enhanced hyaluronic acid (HA) production, with concentrations reaching 601.6 mg/L in a recent study.27 Figure 1A and 1B illustrate how various carbon and nitrogen sources influence cell density.
Tryptone was the most effective nitrogen source, leading to the highest growth (0.58 ± 0.017) at 600 nm, followed by ammonium sulfate (0.54 ± 0.023), peptone (0.53 ± 0.011), and urea (0.52 ± 0.040). Peptone and yeast extract are the favored nitrogen sources for Priestia species. Remarkably, P. filamentosa and P. aryabhattai demonstrated superior growth capabilities when provided with organic nitrogen sources compared to inorganic nitrogen sources.28 Our findings concur with this study, likely due to the use of tryptone as an organic nitrogen source. Supplementation of growth medium with urea led to a slight reduction in biomass production by P. paraflexa ONG1. Conversely, 0.1% urea emerged as the optimal nitrogen source for maximizing curdlan production by Priestia megaterium, whereas the strain demonstrated a limited preference for peptone.29 Probiotic strain P. paraflexa ONG1 exhibits the metabolic versatility to utilize a variety of nitrogen sources, including both organic and inorganic compounds. This adaptability enables them to successfully colonize and persist in environments with limited nutrient availability.
Optimizing probiotic growth requires careful consideration of not only the specific media composition but also physicochemical properties, such as pH. The optimal cell growth (0.59 ± 0.00) occurred at pH 7.6, with decreasing values observed on either side of this point (Figure 1C). Minimal growth (0.48 ± 0.02) was recorded at pH 6.0. Notably, the organism exhibited minimal variation in cell density between pH 6.4 and 8.0 suggesting that the probiotic can thrive across a broad pH range. Our results align with a previous study on P. megaterium gasm, an elastase-producing bacterium from processed meat, which found that pH 8 is optimal for elastase production by this strain.30 Concurrently, prior research corroborates the observation that Priestia species exhibit a remarkable capacity to thrive within a diverse pH range, encompassing slightly acidic to alkaline environments.31-33
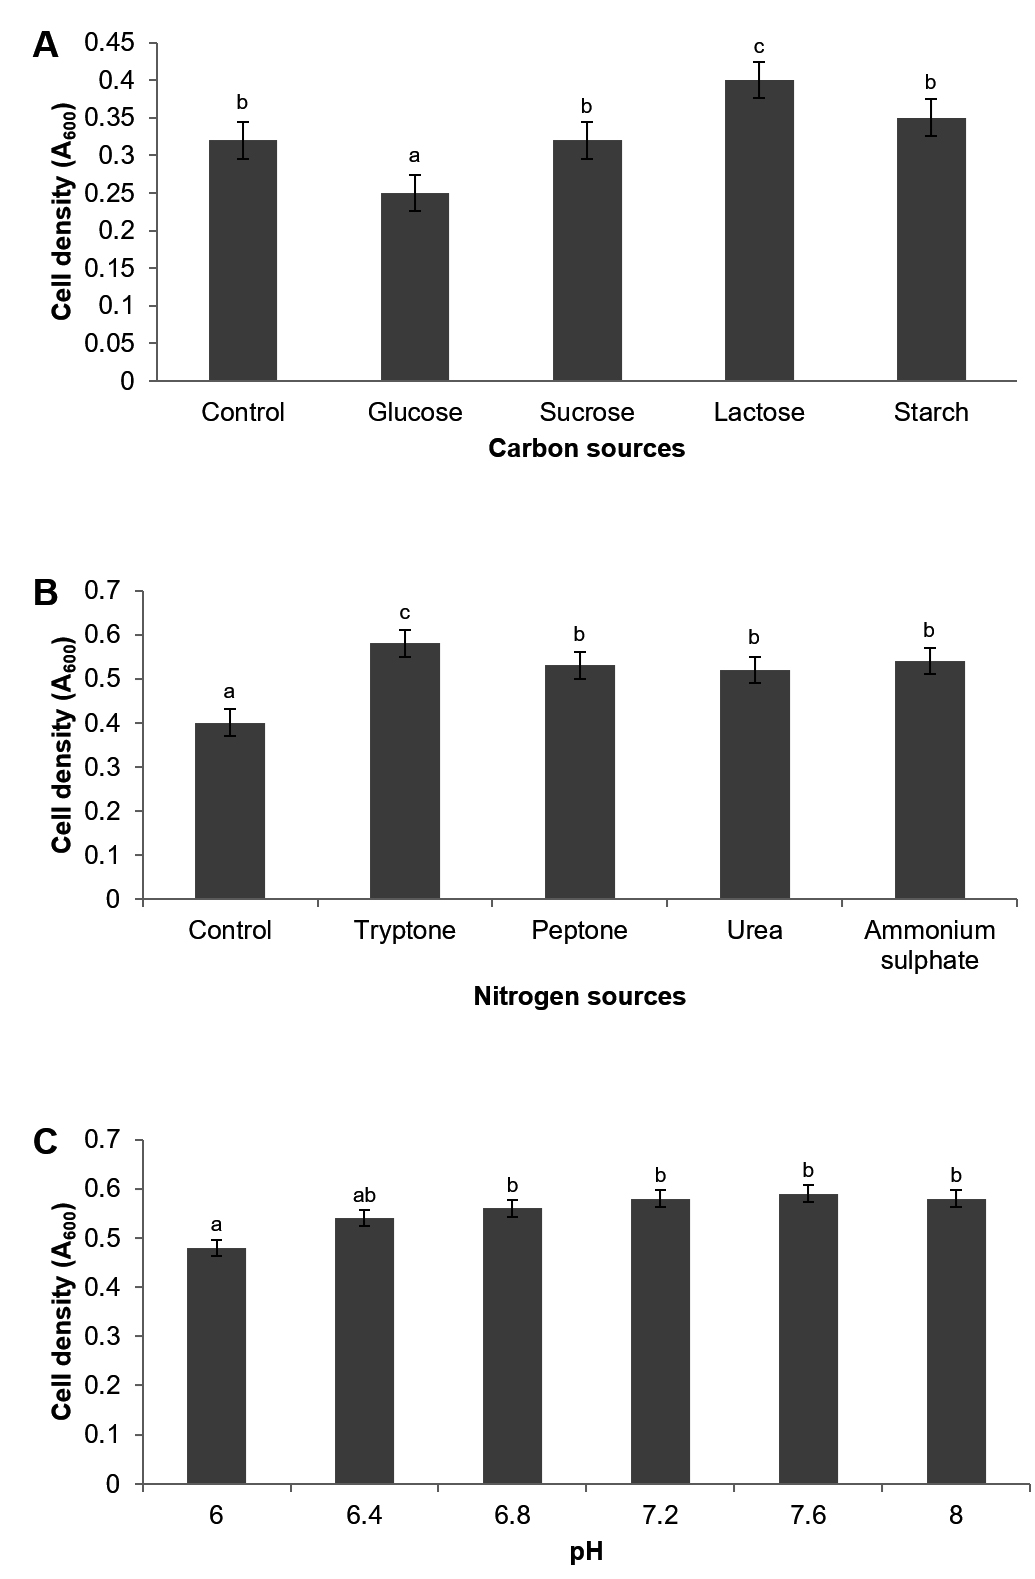
Figure 1. Impact of Carbon (A) Nitrogen (B) and pH (C) on high cell density cultivation of P. paraflexa ONG1. Data are reported as mean ± SE based on three independent experiments. Significant differences (p < 0.05) are indicated by different letters (a, b, and c)
Plackett-Burman design for identifying key factors
PBD was implemented to determine the influence of each individual medium component on achieving high cell densities of P. paraflexa ONG1. Seven variables (lactose, tryptone, yeast extract, NaCl, KH2PO4, MgSO4, and MnSO4) were examined at two levels (-1, 1) (Table 1), leading to 12 experimental runs. Three replicates were conducted for each experimental condition to improve the reliability of the data. The resulting growth yields, measured as optical density at 600 nm, varied from 0.42 to 0.63 (Table 2). Table 3 presents the effects of the seven variables. The data revealed the following effects for each component: Lactose 0.020, tryptone 0.010, yeast extract 0.063, NaCl -0.008, KH2PO4 0.021, MgSO4 0.047, and MnSO4 0.073. Among the seven variables examined, NaCl exhibited a negative correlation with probiotic growth (Figure 2). Elevating the NaCl concentrations within the tested range of 2.5 to 25 g/L resulted in a decline in cell density production. The standardized impact of each variable is visually represented in the Pareto chart (Figure 3). The vertical line on the chart indicates the statistical significance. Variables with columns extending to the right of this line have a substantial influence on bacterial growth. Statistical analysis revealed that yeast extract, MgSO4, and MnSO4 significantly influenced high cell density production (p < 0.05). Additionally, as indicated by the R² value of 0.963, the model effectively accounts for 96.3% of the response variability. The high adjusted R² value of 0.898 (indicating model significance) supports the suitability of the PBD. Thus yeast extract, MgSO4, and MnSO4 were chosen for subsequent RSM analysis. Shi et al.34 highlighted the significant impact of magnesium sulfate on the colony formation of Bacillus velezensis BHZ-29, alongside other contributing factors. Another investigation, employing the Plackett-Burman experimental design, demonstrated that yeast extract was a significant factor in promoting spore production of B. coagulans X26.35 Manganese, supplied as MnSO4, is an essential micronutrient for Bacillus growth and serves as a key inducer of sporulation. Prior investigations have indicated the potential for manganese supplementation to augment spore formation efficiency,36 enzyme production37 and bacterial biomass production.38
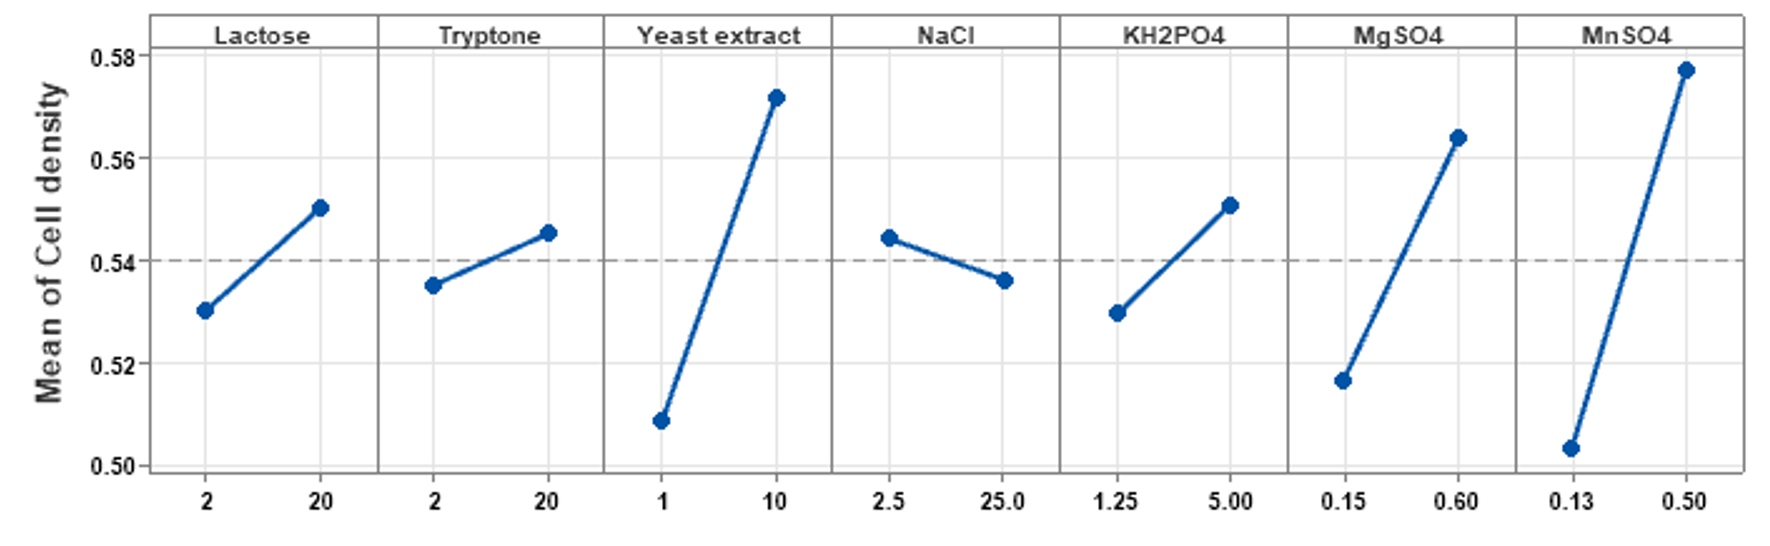
Figure 2. Visualizing the main effects of each variable on P. paraflexa ONG1 cell density
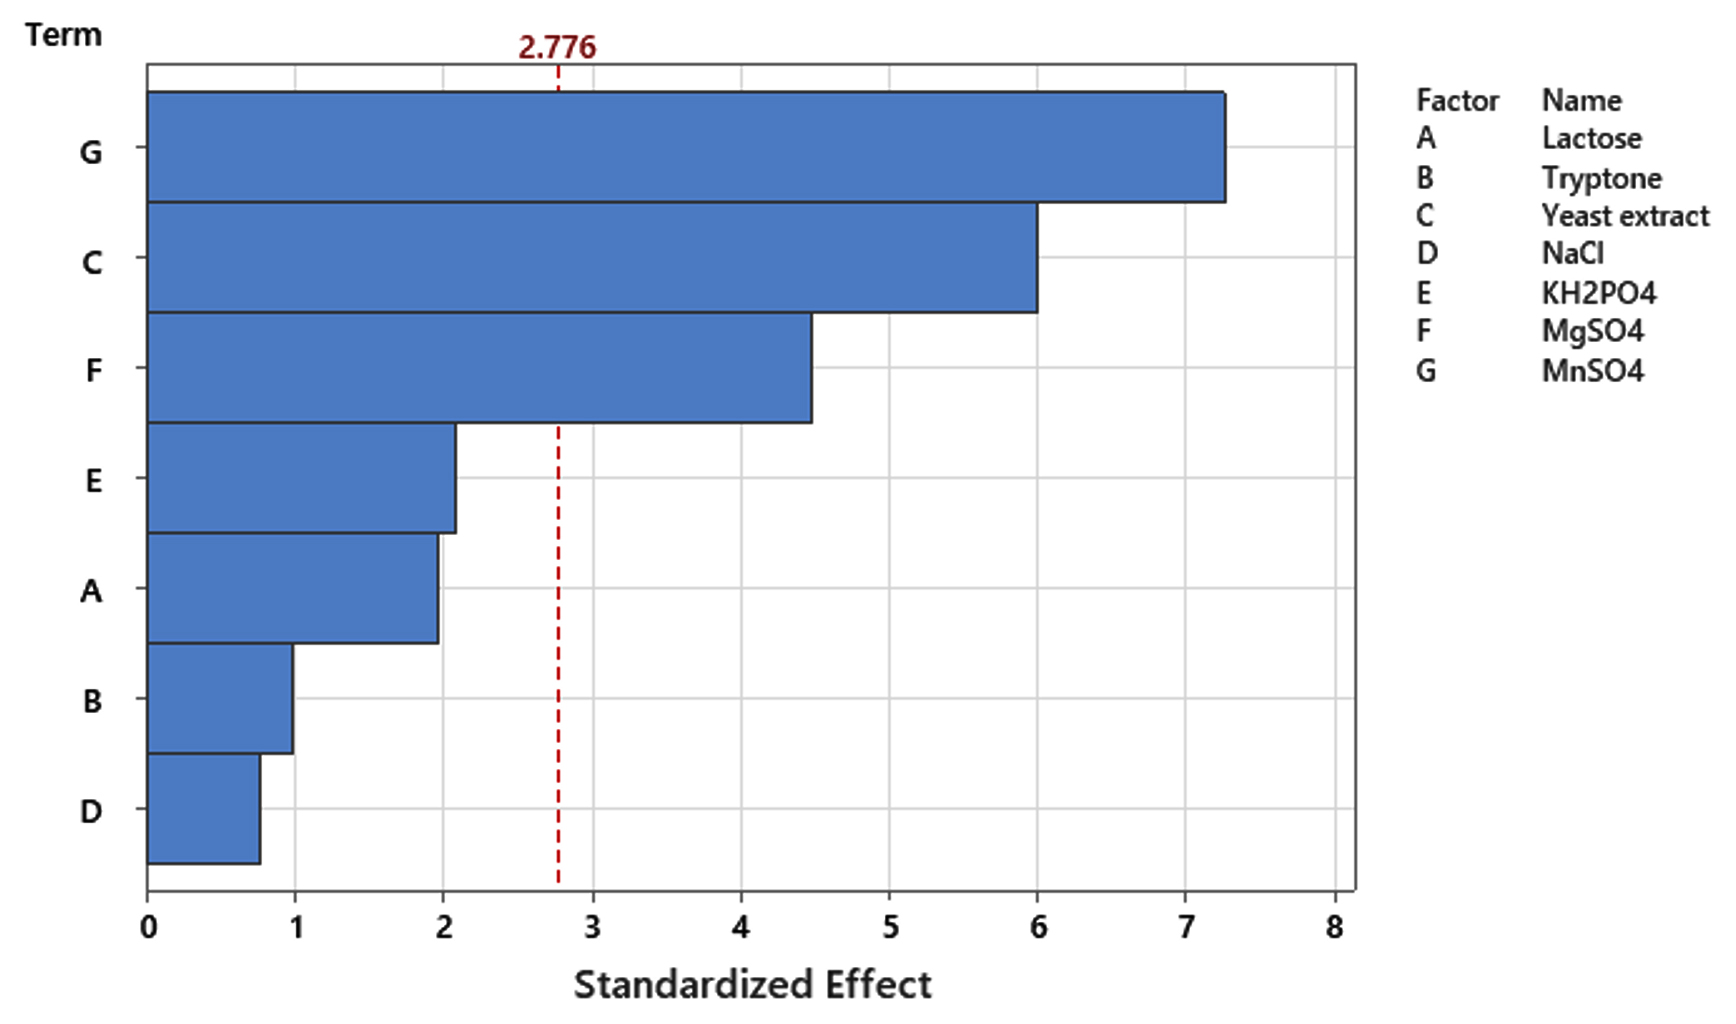
Figure 3. Visualization of standardized effects on P. paraflexa ONG1 cell density production using a Pareto chart
Response surface analysis
The approximate optimal region was identified using a response surface design. BBD was specifically utilized to discover the optimal concentrations of yeast extract (1-10 g/L), MgSO4 (0.15-0.6 g/L), and MnSO4 (0.13-0.5 g/L). The coded levels and their corresponding concentrations for the three variables used in the experimental investigation are summarized in Table 4. Table 5 presents the experimental design matrix, comprising 15 runs, including three center point replicates, and their corresponding responses. A maximum cell density 1.19 OD600 was observed in run 15, corresponding to a combination of 10 g/L yeast extract, 0.375 g/L MgSO4, and 0.5 g/L MnSO4. Multiple regression analysis was used to fit a quadratic polynomial model to the experimental data for predicting P. paraflexa ONG1 cell density. The fitted equation is:
Y = 0.7764 + 0.05577 X1 + 0.079 X2 + 0.419 X3 – 0.003807 X12 + 0.156 X22 – 0.207 X32 – 0.01235 X1 X2 + 0.02703 X1 X3 – 0.300 X2 X3
In the equation, Y denotes the cell density (OD600), while X1, X2, and X3 correspond to yeast extract, MgSO4, and MnSO4, respectively.
Table (5):
Experimental design matrix for BBD
| Run | Factors | Cell density (A600) | ||
|---|---|---|---|---|
| X1 | X2 | X3 | ||
| 1 | 0 | -1 | -1 | 1.02 ± 0.02 |
| 2 | -1 | -1 | 0 | 0.96 ± 0.01 |
| 3 | 0 | 0 | 0 | 1.12 ± 0.04 |
| 4 | 1 | -1 | 0 | 1.14 ± 0.04 |
| 5 | 0 | 1 | -1 | 1.08 ± 0.02 |
| 6 | 1 | 0 | -1 | 1.04 ± 0.07 |
| 7 | -1 | 1 | 0 | 0.98 ± 0.04 |
| 8 | 0 | 0 | 0 | 1.12 ± 0.02 |
| 9 | -1 | 0 | -1 | 0.92 ± 0.05 |
| 10 | 0 | -1 | 1 | 1.18 ± 0.02 |
| 11 | -1 | 0 | 1 | 0.98 ± 0.01 |
| 12 | 0 | 1 | 1 | 1.19 ± 0.05 |
| 13 | 0 | 0 | 0 | 1.11 ± 0.03 |
| 14 | 1 | 1 | 0 | 1.11 ± 0.04 |
| 15 | 1 | 0 | 1 | 1.19 ± 0.01 |
X1: Yeast extract; X2: MgSO4; X3: MnSO4
Table (6):
Analysis of variance for Box-Behnken design (BBD) experiments in the optimization of P. paraflexa ONG1 cell density
Sources |
DF |
Adj SS |
Adj MS |
F-value |
p-value |
Significance |
|---|---|---|---|---|---|---|
Model |
9 |
0.10639 |
0.01182 |
43.25 |
0.000 |
** |
Linear |
3 |
0.08045 |
0.02682 |
98.11 |
0.000 |
** |
X1 |
1 |
0.05120 |
0.05120 |
187.32 |
0.000 |
** |
X2 |
1 |
0.00045 |
0.00045 |
1.65 |
0.256 |
|
X3 |
1 |
0.02880 |
0.02880 |
105.37 |
0.000 |
** |
Square |
3 |
0.02267 |
0.00756 |
27.64 |
0.002 |
** |
X1*X1 |
1 |
0.02194 |
0.02194 |
80.27 |
0.000 |
** |
X2*X2 |
1 |
0.00023 |
0.00023 |
0.85 |
0.400 |
|
X3*X3 |
1 |
0.00019 |
0.00019 |
0.68 |
0.448 |
|
2-Way interaction |
3 |
0.00328 |
0.00109 |
3.99 |
0.085 |
|
X1*X2 |
1 |
0.00063 |
0.00063 |
2.29 |
0.191 |
|
X1*X3 |
1 |
0.00203 |
0.00203 |
7.41 |
0.042 |
* |
X2*X3 |
1 |
0.00063 |
0.00063 |
2.29 |
0.191 |
|
Error |
5 |
0.00137 |
0.00027 |
|||
Lack-of-Fit |
3 |
0.00130 |
0.00043 |
13.00 |
0.072 |
|
Pure error |
2 |
0.00007 |
0.00003 |
|||
Total |
14 |
0.10776 |
||||
R2 |
0.9873 |
|||||
Adj-R2 |
0.9645 |
X1: Yeast extract; X2: MgSO4; X3: MnSO4; DF: Degree of freedom; SS: Sum of squares; MS: Mean square; *represents p < 0.05; **represents p < 0.01
Statistical significance was examined through the application of Analysis of variance (ANOVA), with subsequent utilization of an F-test. The calculated F-value of 43.25, as presented in Table 6, indicates a highly significant model (p-value 0.000). The developed regression model, exhibiting an R² of 98.73% and an adjusted R² of 96.45%, effectively predicted the cell density of P. paraflexa ONG1, accounting for over 95% of the variability in the data. Furthermore, a statistically non-significant lack-of-fit (p-value 0.072) indicated that the model provided a good fit to the experimental data. The magnitude of the p-value is inversely related to the term’s significance, with lower values indicating stronger evidence against the null hypothesis and potentially elucidating variable interactions.14 Analysis of Table 6 revealed that X1, X3, and X12 were the most influential factors in this model, each demonstrating a statistically significant association (p < 0.01). The insignificance of the interaction terms is further supported by the elevated p-value
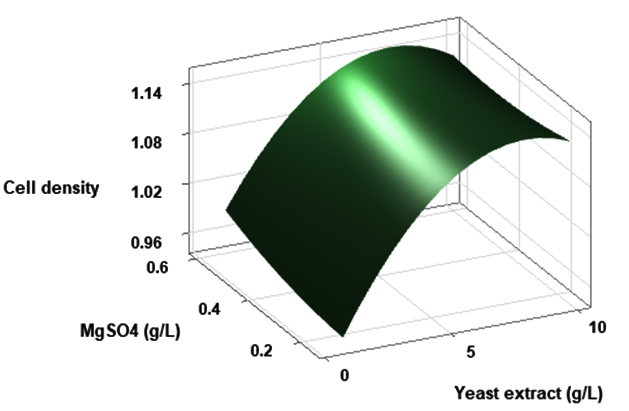
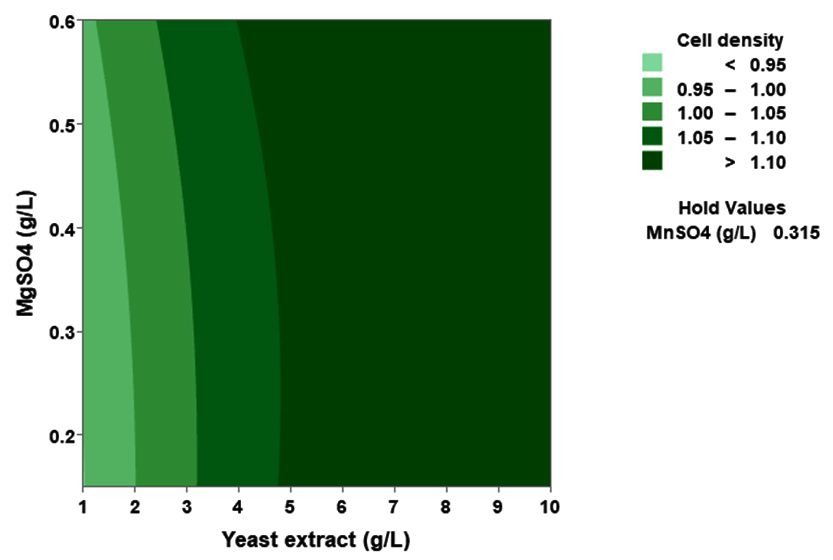
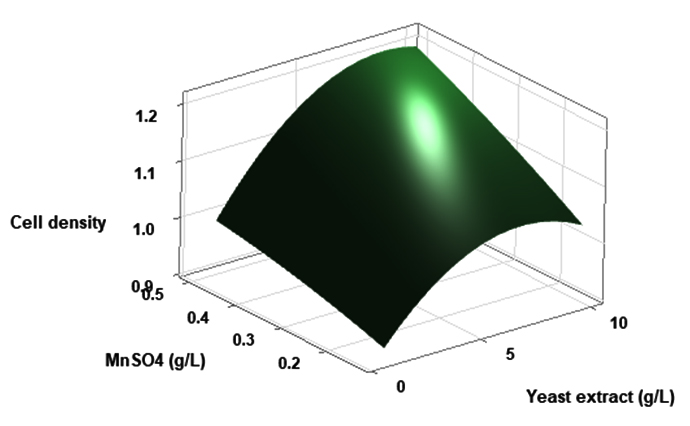
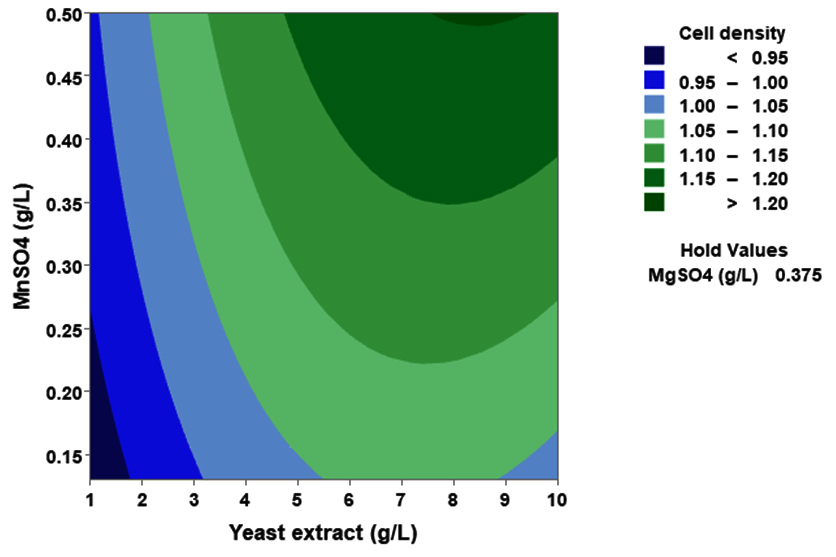
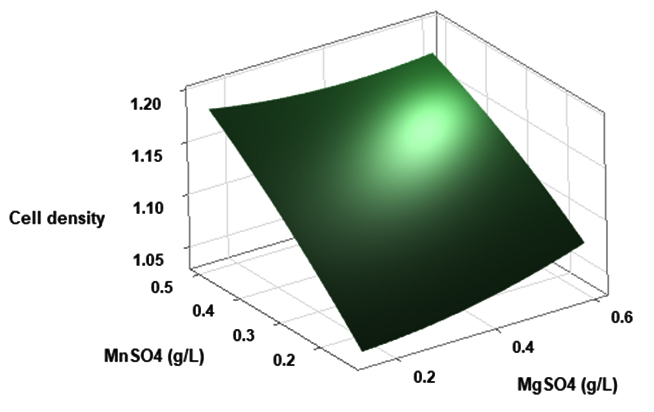
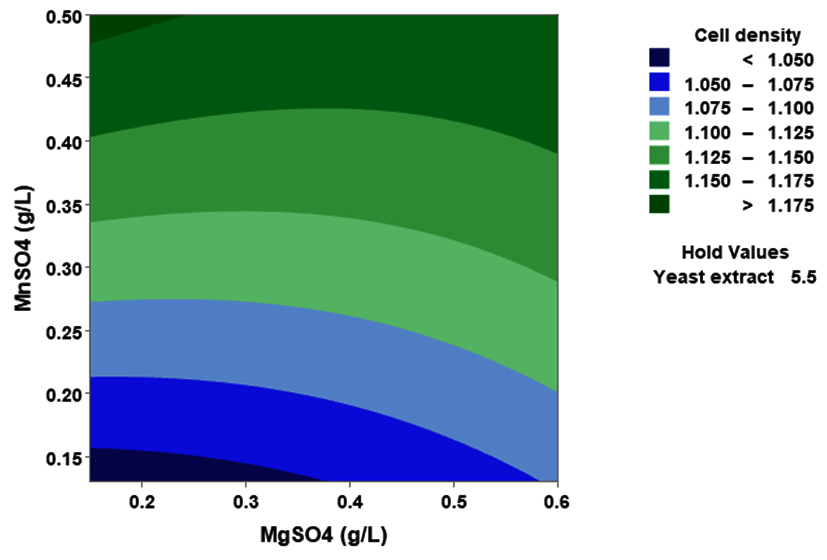
(p > 0.05), with the exception of the interaction between X1 and X3 (p-value 0.042). To gain a visual understanding of the interactive effects between the two variables and to identify the optimal concentration combinations for maximizing cell density, 3D response surface and contour plots were constructed using Minitab statistical software (Figure 4). Graphical representations based on the model equation were generated, which displayed convex response surfaces. Each graph illustrates the interactive effects of the two independent variables, whereas the remaining variable is fixed at a specific level. Cell density exhibited a positive correlation with yeast extract concentration within the intervals of 4.8 g/L to 10 g/L and 7.5 g/L to 8.82 g/L, as shown in Figures 4A, 4B, 4C and 4D. However, a further increase in yeast extract concentration beyond this point resulted in a decrease in cell density. The concentration-dependent response was investigated for MgSO4 and MnSO4, while maintaining the yeast extract concentration at the central level. Likewise, MgSO4 demonstrated a similar pattern, with maximum cell density production at 0.20 g/L, followed by a reduction. Concurrently, varying concentrations of MgSO₄, as shown in Figure 4A and 4B, did not yield a statistically significant enhancement in cell density. The data indicates that elevated levels of the independent variables (yeast extract and MgSO4) negatively impacted cell density. In contrast, for MnSO4, maximum growth was observed at a higher concentration (0.5 g/L) (Figure 4E and 4F). The model predicted that a combination of yeast extract ( 8.82 g/L), MgSO4 (0.15 g/L), and MnSO4 (0.5 g/L) would maximize probiotic growth, resulting in a predicted cell density of 1.22 Optical Density at 600 nm.
(A)
 (B)
(B)
 (C)
(C)
 (D)
(D)
 (E)
(E)
 (F)
(F)
Figure 4. Three-dimensional response surface and two-dimensional contour plots depicting the interactive effects of yeast extract (X1), MgSO4 (X2), and MnSO4 (X3) on the cell density of P. paraflexa ONG1. (A, B) Interaction between X1 and X2 with X3 held constant at its central value. (C, D) Interaction between X1 and X3 with X2 maintained at its central value. (E, F) Interaction between X2 and X3 with X1 fixed at its central value
Following cultivation in the optimized medium and under the optimized conditions, P. paraflexa ONG1 exhibited a maximum cell density of 6.5 × 10⁹ CFU/ml. This represents a 28.3-fold enhancement compared to the cell density obtained in nutrient broth medium, which was 2.3 × 10⁸ CFU/ml. The significant increase in cell density observed in the optimized medium strongly suggests that it provides an environment conducive to the growth and metabolism of P. paraflexa ONG1. This indicates that the optimized medium likely contained a well-balanced combination of nutrients that effectively meet the specific requirements of this organism. Using the Box-Behnken experimental approach, Eyahmalay et al.39 investigated a simple growth medium formulated with lactose (76 g/L), soybean meal (72 g/L), yeast extract (2 g/L), and MgSO4 (0.7 g/L). This optimization process resulted in a significant increase in Lactobacillus casei cell biomass, reaching a 164.6% increase. Shi et al.34 utilized PBD and BBD to optimize the growth medium for Bacillus velezensis BHZ-29, resulting in an increased viable cell count from 7.83 × 10⁹ to 3.39 × 10¹⁰ CFU/ml. Information on the optimal growth conditions for Priestia species is scarce. To the extent of our current understanding, this investigation signifies the first attempt to optimize the growth of P. paraflexa, a promising aquaculture probiotic, utilizing Response Surface Methodology (RSM).
This research effectively employed statistical techniques, particularly RSM, to enhance P. paraflexa biomass production by optimizing growth conditions and nutrient composition. PBD identified yeast extract, MgSO4, and MnSO4 as significant factors that influence cell density. The subsequent BBD and fitted quadratic polynomial models further refined the optimum levels of these variables. Based on the BBD experimental matrix analysis, the model demonstrated significant effects for the linear terms X1 and X3, the quadratic term X1², and the interaction term X1X3. Other interaction terms and quadratic terms were not statistically significant. According to the model predictions, the ideal concentrations were determined to be 8.82 g/L for yeast extract, 0.15 g/L for MgSO4, and 0.5 g/L for MnSO4. These optimal levels were projected to yield a maximal cell density of 1.22 optical density units. Validation experiments conducted in triplicate confirmed this prediction, yielding an average cell density of 1.19 optical density units and a viable count of 6.5 × 10⁹ CFU/ml, demonstrating the precision and dependability of the model. This research provides crucial findings on the ideal cultivation conditions for P. paraflexa ONG1, significantly enhancing our limited understanding of Priestia species. The significant enhancement in cell density achieved through this optimization process demonstrates the potential for improved production of this promising aquaculture probiotic. These findings could contribute to the development of more efficient and cost-effective probiotic production methods, benefiting the aquaculture industry.
ACKNOWLEDGMENTS
The authors would like to thank Dr. T. Charles John Bhaskar (Geomarine Biotechnologies, Chennai) for supporting this research. The authors are also grateful to Dr. N. Yogananth (Assistant Professor in Biotechnology, Mohamed Sathak College of Arts & Science, Chennai, Tamil Nadu, India) for his significant contributions to the statistical analysis.
CONFLICT OF INTEREST
The authors declare that there is no conflict of interest.
AUTHORS’ CONTRIBUTION
Both authors listed have made substantial, direct, and intellectual contributions to the work and approved it for publication.
FUNDING
None.
DATA AVAILABILITY
All datasets generated or analyzed during this study are included in the manuscript.
ETHICS STATEMENT
Not applicable.
- Dawood MA, Koshio S, Abdel-Daim MM, Van Doan H. Probiotic application for sustainable aquaculture. Rev Aquac. 2019;11(3):907-924.
Crossref - Yao YY, Yang YL, Gao CC, et al. Surface display system for probiotics and its application in aquaculture. Rev Aquac. 2020;12(4):2333-2350.
Crossref - Leong SS, Korel F, Lingoh AD, et al. Current probiotics application for aquaculture feed: a review. Borneo J Resour Sci Technol. 2023;44(2): bsj.v44i2.4703.
Crossref - Cruz PM, Ibanez AL, Hermosillo OAM, Saad HCR. Use of probiotics in aquaculture. ISRN Microbiol. 2012;2012(1):916845.
Crossref - Todorov SD, Ivanova IV, Popov I, Weeks R, Chikindas ML. Bacillus spore-forming probiotics: benefits with concerns? Crit Rev Microbiol. 2022;48(4):513-530.
Crossref - Kuebutornye FKA, Abarike ED, Lu Y. A review on the application of Bacillus as probiotics in aquaculture. Fish Shellfish Immunol. 2019;87:820-828.
Crossref - Cano-Lozano JA, Diaz LMV, Bolivar JFM, Hume ME, Pardo RYR. Probiotics in tilapia (Oreochromis niloticus) culture: Potential probiotic Lactococcus lactis culture conditions. J Biosci Bioeng. 2022;133(3):187-194.
Crossref - Ghosh V, Lonhare A. Response Surface Methodology: A Statistical Tool to Optimize Process Parameters (Quantitative Data) to Maximize the Microbial Biomass and Their Bioactive Metabolites. In Sahu AT, Raut RD, Raja R, Sahu AK, Sahu NK (eds.), Industrial and Manufacturing Designs: Quantitative and Qualitative Analysis. 2024:139-171.
Crossref - Kumar V, Naik B, Kumar A, Khanduri N, Rustagi S, Kumar S. Probiotics media: Significance, challenges, and future perspective-a mini review. Food Prod Process Nutr. 2022;4(1):17.
Crossref - Breig SJM, Luti KJK. Response surface methodology: A review on its applications and challenges in microbial cultures. Mater Today Proc. 2021;42(part 5):2277-2284.
Crossref - Choi GH, Lee NK, Paik HD. Optimization of Medium Composition for Biomass Production of Lactobacillus plantarum 200655 Using Response Surface Methodology. J Microbiol Biotechnol. 2021;31(5):717-725.
Crossref - Singh V, Haque S, Niwas R, Srivastava A, Pasupuleti M, Tripathi CKM. Strategies for fermentation medium optimization: an in-depth review. Front Microbiol. 2017;7:2087.
Crossref - Bhat B, Vaid S, Habib B, Bajaj BK. Design of experiments for enhanced production of bioactive exopolysaccharides from indigenous probiotic lactic acid bacteria. Indian J Biochem Biophys. 2020;57(5):539-551.
Crossref - Wang T, Lu Y, Yan H, et al. Fermentation optimization and kinetic model for high cell density culture of a probiotic microorganism: Lactobacillus rhamnosus LS-8. Bioprocess Biosyst Eng. 2020;43(3):515-528.
Crossref - Parekh S, Vinci VA, Strobel RJ. Improvement of microbial strains and fermentation processes. Appl Microbiol Biotechnol. 2000;54(3):287-301.
Crossref - Vlajkov V, Andelic S, Pajein I, et al. Medium for the production of Bacillus-based biocontrol agent effective against aflatoxigenic Aspergillus flavus: Dual approach for modelling and optimization. Microorganisms. 2022;10(6):1165.
Crossref - Ermis E, Poyraz E, Dertli E, Yilmaz MT. Optimization of exopolysaccharide production of Lactobacillus brevis E25 using RSM and characterization. SAUJS. 2020;24(1):151-160.
Crossref - El-Housseiny GS, Ibrahim AA, Yassien MA, Aboshanab KM. Production and statistical optimization of Paromomycin by Streptomyces rimosus NRRL 2455 in solid state fermentation. BMC Microbiol. 2021;21(1):1-13.
Crossref - Saad WF, Othman AM, Abdel-Fattah M, Ahmad MS. Response surface methodology as an approach for optimization of a-amylase production by the new isolated thermotolerant Bacillus licheniformis WF67 strain in submerged fermentation. Biocatal Agric Biotechnol. 2021;32:101944.
Crossref - Bajwa K, Bishnoi NR, Gupta S, Selvan ST. Optimization of environmental growth parameters for biodiesel producing bacteria Rhodococcus opacus using response surface methodology. J Microbiol Biotechnol Food Sci. 2020;9(5):927-931.
Crossref - Sreekumar G, Krishnan S. Enhanced biomass production study on probiotic Bacillus subtilis SK09 by medium optimization using response surface methodology. Afr J Biotechnol. 2010;9(47):8078-8084.
Crossref - Ferreira SLC, Bruns RE, Ferreira HS, et al. Box-Behnken design: an alternative for the optimization of analytical methods. Anal Chim Acta. 2007;597(2):179-86.
Crossref - El-Bendary MA, Afifi SS, Moharam ME, Elsoud MMA, Gawdat NA. Optimization of Bacillus subtilis NRC1 growth conditions using response surface methodology for sustainable biosynthesis of gold nanoparticles. Sci Rep. 2022;12(1):20882.
Crossref - Mataragas M, Drosinos EH, Tsakalidou E, Metaxopoulos J. Influence of nutrients on growth and bacteriocin production by Leuconostoc mesenteroides L124 and Lactobacillus curvatus L442. Antonie Van Leeuwenhoek. 2004;85(3):191-198.
Crossref - Arumugam M, Agarwal A, Arya MC, Ahmed Z. Influence of nitrogen sources on biomass productivity of microalgae Scenedesmus bijugatus. Bioresour Technol. 2013;131:246-249.
Crossref - van Niekerk K, Pott RWM. The effect of carbon source on the growth and lipopeptide production of Bacillus circulans. Biocatal Agric Biotechnol. 2023;53:102841.
Crossref - Vu DG, Nguyen QT, Do TCV, Vu TC, Nguyen NPD. Purification and Characterization of Hyaluronic Acid Produced by Priestia flexa N7. Biomed Biotechnol Res J. 2024;8(4):440-446.
Crossref - Abiala M, Sadhukhan A, Sahoo L. Isolation and Characterization of Stress-Tolerant Priestia Species from Cowpea Rhizosphere Under Drought and Nutrient Deficit Conditions. Curr Microbiol. 2023;80(5):140.
Crossref - Aquinas N, Bhat RM, Selvaraj S. Submerged Fermentation and Kinetics of Newly Isolated Priestia megaterium for the Production of Biopolymer Curdlan. J Polym Environ. 2024;32(9):1-16.
Crossref - AlShaikh-Mubarak GA, Kotb E, Alabdalall AH, Aldayel MF. A survey of elastase-producing bacteria and characteristics of the most potent producer, Priestia megaterium gasm32. PLoS One. 2023;18(3):e0282963.
Crossref - Vinayak A, Singh GB. Synthetic azo dye bio-decolorization by Priestia sp. RA1: process optimization and phytotoxicity assessment. Arch Microbiol. 2022;204(6):318.
Crossref - Sundaramahalingam MA, Vijayachandran P, Rajeshbanu J, Sivashanmugam P. Production of lipase from Priestia endophytica SSP strain and its potential application in deinking of printed paper. Biomass Conv Bioref. 2024;14(13):13861-13875.
Crossref - Aquinas N, Ramananda BM, Selvaraj S. Optimization of curdlan production and ultrasound assisted extraction processes from Priestia megaterium. Sci Rep. 2024;14(1):26709.
Crossref - Shi Y, Niu X, Yang H, et al. Optimization of the fermentation media and growth conditions of Bacillus velezensis BHZ-29 using a Plackett-Burman design experiment combined with response surface methodology. Front Microbiol. 2024;22;15.
Crossref - Xu L, Zhan ZC, Du S, et al. Isolation, functional evaluation, and fermentation process optimization of probiotic Bacillus coagulans. PLoS One. 2023;18(11):e0286944.
Crossref - Sinnela MT, Park YK, Lee JH, et al. Effects of calcium and manganese on sporulation of Bacillus species involved in food poisoning and spoilage. Foods. 2019;8(4):119.
Crossref - Ahmad T, Sharma A, Gupta G, et al. Response surface optimization of cellulase production from Aneurinibacillus aneurinilyticus BKT-9: an isolate of urban Himalayan freshwater. Saudi J Biol Sci. 2020;27(9):2333-2343.
Crossref - Berisvil AP, Astesana DM, Zimmermann JA, et al. Low-cost culture medium for biomass production of lactic acid bacteria with probiotic potential destined to broilers. FAVE Secc Cienc Vet. 2021;20(1):1-9.
Crossref - Eyahmalay J, Elsayed EA, Dailin DJ, Ramli S, Sayyed RJ, El-Enshasy HA. Statistical optimization approaches for high cell biomass production of Lactobacillus casei. J Sci Ind Res. 2020;79:216-221.
Crossref
© The Author(s) 2025. Open Access. This article is distributed under the terms of the Creative Commons Attribution 4.0 International License which permits unrestricted use, sharing, distribution, and reproduction in any medium, provided you give appropriate credit to the original author(s) and the source, provide a link to the Creative Commons license, and indicate if changes were made.