


ISSN: 0973-7510
E-ISSN: 2581-690X
Purpose of the study: To estimate the prevalence of HIV 1 and HIV 2 infection in patients attending the tertiary care setup. Routine screening for HIV infection of 10000 samples were carried out between July 2017-June 2018. All patients were given a pre-test counselling and filled up the Consent form provided by NACO. The samples were subjected to the NACO provided Comb Aids RS Advantage kit and all positives were tested using 2 other kits Meriscreen HIV 1-2 and Tridot Test for differentiation. The data thus obtained were charted in Excel and the prevalence were determined. A Post-test counselling was given for all patients and the results were disclosed following the protocol provided by NACO. Of the 10000 samples, 82 (0.82%) samples were reactive for HIV. In the 82 reactive samples, 78 (95.12%) samples were reactive for HIV- 1 antibodies and 4 (4.8%) samples were reactive for HIV-2 antibodies. Among the 82 reactive clients, 53 clients were male and 29 clients were female.
HIV-2, HIV-1, ICTC
In 2015, the HIV disease burden in India was estimated by UNAIDS as 15.8 million.1 The principal instance of HIV disease was identified among sex laborers in Chennai, India in 1982.2 Later in 1991, HIV-2 was reported in India.3 Since then, it is being reported sporadically in various states of the country. The mode of infection of HIV-1 & HIV-2 appears to be similar. But transmission of HIV-2 is mainly by sexual contact followed by transfusion of infected blood. Though HIV-2 was limited to parts of West Africa, it’s currently seen in different continents, due to the history of frequent sexual contact of the foreigners with commercial sex workers (CSW).4 They act as a means for transmitting HIV-2 from higher prevalent areas, such as parts of West Africa, to lower prevalent countries, like India.
The global spread of HIV-1 infection has been known since ages. But the spread of HIV-2 infection is claimed to be mostly limited to Western parts of Africa. Currently, In India both HIV 1 & 2 is occurring. It was in Mumbai in the year 1992, the first episode of HIV 2 in India was contracted. After that, the HIV-2 is being reported in different states but practically there is a void in the data regarding the same in India. The occurrence of HIV generally varies in different parts of India and reports also claim a higher evidence of the infection in the southern and western parts.
The promotion of awareness in behaviour and client-oriented counselling and testing in India is carried out by the Integrated Counselling and Testing Centres (ICTC) established countrywide. These services are provided with an ease of accessibility and in a non-discriminating manner. These services are provided with privacy and respect. The study was taken up to assess the occurrence of HIV cases and estimate the seroprevalence of HIV-1 & HIV-2 in patients attending the tertiary care hospital.
The study was conducted at the ICTC facility at the Central Laboratory Microbiology of Mahatma Gandhi Medical College & Research Institute, Pondicherry. A total of 10000 samples which were sent to the laboratory for routine screening for HIV infection were included in the study. The study was carried out between July 2017-June 2018. All patients were given a pre-test counselling and filled up the Consent form provided by NACO. The blood was allowed to clot and the serum thus separated was subjected to the NACO provided Comb Aids RS Advantage kit and all positives were tested using 2 other kits Meriscreen HIV 1-2 and Tridot Test for differentiation. The tests were carried out following the manufacturer’s instructions. Internal and External quality assurance programs were done following the state reference laboratory procedures. HIV reactive patients were vested to the stand-alone ICTC centres for further management with antiretroviral therapy (ART). A Post-test counselling was given for all patients and the results were disclosed following the protocol provided by NACO. The data thus obtained were charted in Excel and the prevalence were determined.
Out of 10000 samples which were screened for HIV antibodies, 82 (0.82%) samples were reactive for HIV, described in Fig 1. In the 82 reactive samples, 78 (95.12%) samples were reactive for HIV- 1 antibodies and 4 (4.8%) samples were reactive for HIV-2 antibodies, described in Fig 2. Among the 82 reactive clients, 53 clients were male and 29 clients were female, described in Fig 3. The 78 clients with HIV1 infection reported history of unprotected sex with many of the opposite gender, IV drug abuse etc., but the clients with HIV 2 infection gave history of unprotected sex extramaritally only. HIV-1 infections were seen to be more in the age group of 30-40yrs and HIV-2 infection between 40-45yrs of age.
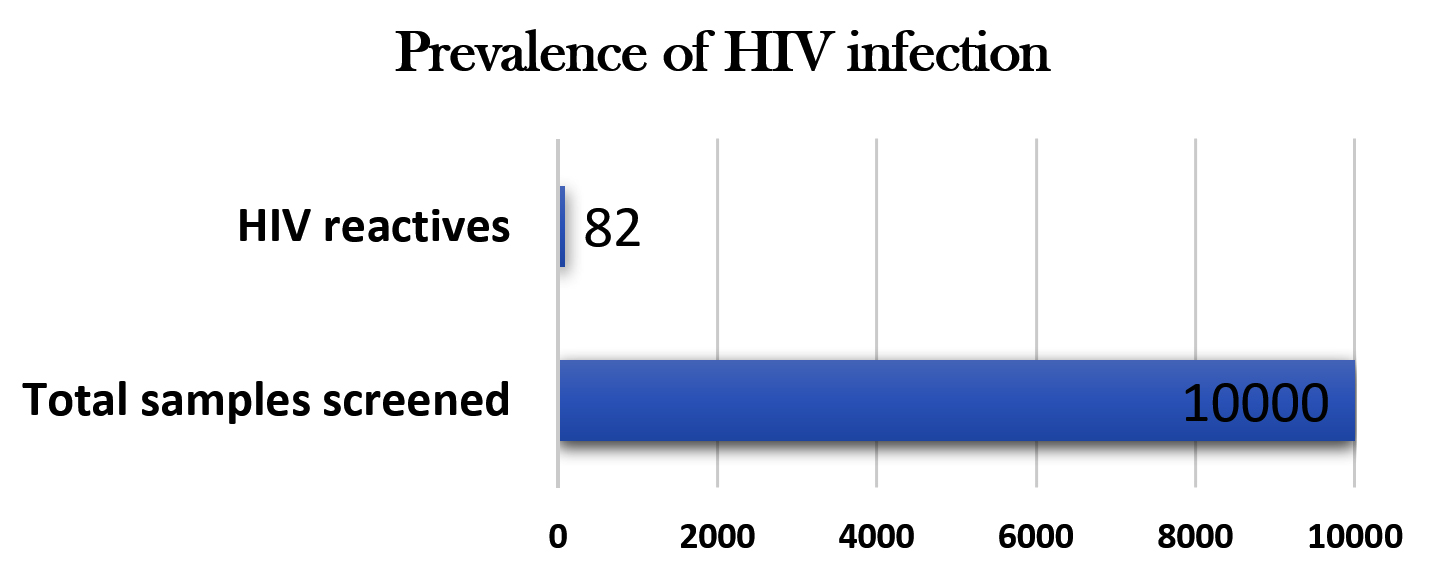
Fig. 1. Prevalence of HIV infection
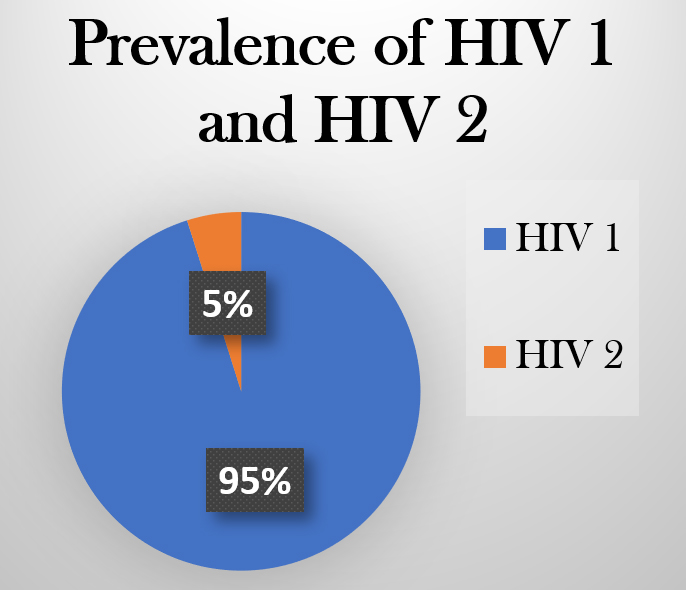
Fig. 2. Prevalence of HIV1 & HIV2

Fig. 3. Gender distribution
In a study done by VS Tadokar et al, in 2013, of the total 21720 serum specimens tested, 242 (1.11%) were reactive for HIV antibodies.5 In 2015, the prevalence of HIV infection was estimated as 6.3%, in a study by Malhotra S et al.6 The seroprevalence of HIV in north India was estimated by Goel V et al, in 2016 as 0.83% . 7 In 2010, Kannangai R et al, in their survey concluded that the incidence of HIV-2 was 2.47% in Southern India.8 The seroprevalence of HIV in this study is 0.82% reflecting the seroprevalence of HIV in Pondicherry and its surrounding areas. The differences are tabulated in Table 1.
Table (1):
Differences & Similarities between HIV 1& HIV 2.
| Entity | HIV 1 | HIV 2 |
|---|---|---|
| Prevalence and distribution | Most common, around the globe | Commonly Seen in West Africa |
| Mode of transmission | Sexual contact, sharing needles, Blood transfusion, Vertical transmission, | Heterosexual sex. |
| Mother to foetus transmission | Common | 20-30 times lower |
| Responsiveness to drugs | More | Less |
| Viral load | High – millions of copies/mL | Low- 10,000 copies/mL |
| Transmissibility | Higher transmissibility and Progress faster and contract AIDS | Lower transmissibility and non-progressors for a long period of time |
| Sub-Types | M group, O group and non-M / O or N group | A and B |
| Immune response | Reduces as disease progresses | More protective against disease progression |
| Pathogenesis | Intracellular replication pathways, transmission modes and clinical effects leading to acquired immune deficiency syndrome (AIDS) | |
| Genetic Identity | 55% Similar | |
VS Tadokar et al estimated that seroprevalence of HIV-1 & HIV-2 as 1.08 % and 0.03 % respectively 5. As per Goel.V et al, the incidence of HIV-1 & HIV -2 were 99.3% & 0.7 % respectively.7 Kannangai R et al also concluded that the prevalence of HIV-1 & HIV-2 was found to be 2.8% and 1.3% respectively in blood donors9. In this study, the occurrence of HIV-1 & HIV-2 was found to be 0.7% and 0.04% respectively.
A maximum sero-positivity was seen in the age groups 35–49 years (39.1%) and then in 25-34 years age (34.3%). The ratio between male & female incidence of infection was 2.12:1. 6 In this study, the most vulnerable age group was found to be 30-40 years and the male: female positivity ratio was found to be 53:29.
ACKNOWLEDGMENTS
The authors would like to thank Pondicherry Aids Control Society for providing the kits in a timely manner and also for giving the consent to carry out this study. Thanks to the management of Sri Balaji Vidyapeeth, Deemed-to-be university, Pondicherry, India for their immense support and motivation.
CONFLICT OF INTEREST
The authors declare that there is no conflict of interest.
AUTHORS’ CONTRIBUTION
All authors listed have made a substantial, direct and intellectual contribution to the work, and approved it for publication
FUNDING
None.
ETHICS STATEMENT
This research was approved by the Institutional Research Committee and Institutional Human Ethics Committee at Mahatma Gandhi Medical College & Research Institute, Sri Balaji Vidyapeeth, Deemed-to-be university, Pondicherry, India.
AVAILABILITY OF DATA
All datasets generated or analyzed during this study are included in the manuscript.
- AIDS by the numbers-Factsheet. 2015. UNAIDS. USA.
- Simoes EA, Babu PG, John TJ, et al. Evidence for HTLV-III infection in prostitutes in Tamil Nadu (India). Indian J Med Res. 1987;85:335-338.
- Rubsamen-Waigmann H, Briesen HV, Maniar JK, Rao PK, Scholz C, Pfutzner A. Spread of HIV-2 in India. Lancet 1991;337(8740): 550-551.
Crossref - Leano PS, Kageyama S, Espantaleon A, et al. Introduction of human immunodeficiency virus type 2 infection in the Philippines. J Clin Microbiol. 2003;41(1):516-518
Crossref - Tadokar VS, Kavathekar MS. Seroprevalence of human immunodefciency virus type 2 infection from a tertiary care hospital in Pune, Maharashtra: A 2 year study. Indian J Med Microbiol. 2013;31(3):314-315.
Crossref - Malhotra S, Sharma S, Hans C. Recent trend of HIV infection at ICTC in a tertiary care hospital in North India. MedPub. 2015;7(3:3):1-4.
- Goel V, Kumar D, Patwardhan V, Balooni V, Singhal S, Singh S. Trends of Seroprevalence, Epidemiology and Clinical Presentation of HIV in North India: A Tertiary Care Hospital Based Study. World Journal of AIDS. 2016;6(2):54-58.
Crossref - Kannangai R, Ramalingam S, Vijayakumar TS, Prabu K, Jesudason MV, Sridharan Gopalan. HIV-2 sub-epidemic not gathering speed: experience from a tertiary care center in South India. J Acquir Immune Defic Syndr. 2003;32(5):573-575.
Crossref - Kannangai R, Nair SC, Sridharan G, Prasannakumar S, Daniel D. Frequency of HIV type 2 infections among blood donor population from India: a 10-year experience. Indian J Med Microbiol. 2010;28(2):111-113.
Crossref
© The Author(s) 2022. Open Access. This article is distributed under the terms of the Creative Commons Attribution 4.0 International License which permits unrestricted use, sharing, distribution, and reproduction in any medium, provided you give appropriate credit to the original author(s) and the source, provide a link to the Creative Commons license, and indicate if changes were made.