

ISSN: 0973-7510
E-ISSN: 2581-690X
CXCL10 (rs201830102) is a chemokine involved in immune cell recruitment, while its receptor, CXCR3 (rs779120264), mediates immune responses through the activation of T cells. These genes are critical in the immune response to viral infections, including COVID-19. The study aimed to explore the relationship between polymorphisms in the CXCL10 gene and CXCR3 receptor with disease severity in COVID-19 patients. In this cross-sectional analytical study, 100 COVID-19 patients were enrolled after ethical approval, and written informed consent was obtained from each participant. Polymorphisms in CXCL10 and CXCR3 were analyzed by sequencing, while biochemical and hematological parameters were assessed using appropriate methods. Descriptive and inferential statistics were employed to analyze continuous and categorical data. Significant associations were observed between severe COVID-19 cases and elevated levels of serum D-dimer, ferritin, random blood sugar (RBS), neutrophils, and erythrocyte sedimentation rate (ESR), along with reduced hemoglobin levels. Lymphocyte and platelet counts were significantly lower with increased disease severity. The wild genotype of CXCL10 was notably associated with elevated ferritin levels, suggesting that certain gene variants may offer protective effects. However, no significant correlation was found between CXCR3 and CXCL10 polymorphisms and other serum biomarkers. Our study confirmed a significant rise in serum D-dimer, ferritin, RBS, neutrophils, and ESR, along with a reduction in hemoglobin, lymphocyte, and platelet counts in severe COVID-19 cases compared to mild ones. Notably, mutations in the CXCL10 gene were linked to less severe COVID-19 outcomes.
COVID-19, CXCL10 Gene, CXCR3 receptor, Single Nucleotide Polymorphism
The viral pandemic called the coronavirus disease 2019 (COVID-19) started in East Asia had rapidly spread to the rest of the world.1 One of the most clinically significant effects of COVID-19 infection in such patients was acute respiratory distress syndrome (ARDS). The most frequently occurring consequence in COVID-19 infection patients was initially pneumonia. However, ARDS, the distinguishing feature of immune-mediated clinical consequence gradually follows COVID-19-related pneumonia.2
ARDS may be defined as an uncontrolled and generalized inflammatory response, potentially responsible for a significant number of deaths among infected patients. ARDS can occur in a variety of clinical situations including pneumonia, sepsis, pancreatitis, blood transfusion being associated with an elevated mortality. Cytokine storm occurs during infection of several viruses including influenza viruses and coronaviruses,3,4 and is the main reason for acute lung injury and subsequent development of ARDS. In COVID-19 infection, ARDS represents the most serious consequence of the so-called “cytokine storm”.5,6
An important factor in the surge of cytokines associated with COVID-19 and the onset of the profound lung dysfunction seen in these individuals is the pro-inflammatory chemokine CXCL10.7 It is also known that this chemokine contributes to nerve degeneration brought on by coronaviruses. Chemokines are a subgroup of cytokines and have low molecular weight. They have the peculiar property of being able to chemo-attract cells called leukocyte and other antibody-producing cells to the location of injury or infection, which helps to trigger an inflammatory reaction.8,9
The CXCL10 gene, located on chromosome 4 at band q21, encodes a protein with a molecular weight of approximately 12 kDa. This protein contains two internal disulfide bonds, which are essential for stabilizing its structure. After cleavage, a 10 kDa form of the protein, containing four conserved cysteine residues in the N-terminal region, is produced and released. These cysteines are important for forming disulfide bridges that help maintain the protein’s characteristic structure, known as the chemokine fold, which consists of a three-stranded beta sheet overlaid by an alpha helix. Unlike some other CXC chemokines, CXCL10 lacks the tripeptide motif “Glu-Leu-Arg,” which is associated with anti-angiogenic properties. However, CXCL10 plays a key role in immune response regulation, particularly through its interaction with receptors such as CXCR3. Specific regions of the protein, particularly in the loops between its structural elements, are involved in receptor binding, and these loops are stabilized by the disulfide bonds. Through these interactions, CXCL10 helps recruit immune cells, particularly T cells, to sites of inflammation or infection. Several extrinsic cues, like IFN- and bacterial substances like lipopolysaccharides, control the production of CXCL10.10 The chemokine CXCL10, also known as IP-10 or interferon-inducible 10 kDa protein, plays a crucial part in the onset and regulation of immune reactions. The interferon-gamma is required to produce CXCL10 by cluster immune cells. CXCL10 is a Th1-chemokine that can draw other Th1 lymphocytes. It expresses itself via the seven transmembrane G-protein coupled receptor CXCR3. Immune cells move towards the infection location as a result of the chemokine CXCL10 binding to its receptor CXCR3. Therefore, the emergence of various disorders is linked to the hyperactivity of the CXCL10-CXCR3 axis.11 Until the adaptive immune system is activated, this chemokine is known to promote viral eradication as part of the host anti-viral response. It is surplus in circulation in respiratory tract infections.12
Studies that looked at the prospect of finding biomarkers for the severity and progression of COVID-19 revealed that CXCL10 cytokines were markedly higher in cases when compared to healthy controls.13,14 It has thus been postulated that the CXCL10-CXCR3 axis may be involved in the onset of COVID-19 and the level of the disease severity may be related to cytokines and chemokines SNPs. CXCL10 gene polymorphism and the degree of severity of SARS-CoV-2 illness is therefore justified. This made us to undertake this study to study the pattern of CXCL10 and CXCL3 gene polymorphisms and its association with biochemical and hematological parameters and disease outcome.
The objectives of the study were to determine the pattern of single nucleotide polymorphism of CXCL10 gene (rs201830102) and CXCR3 gene (rs779120264) in patients with COVID-19 and to determine the association of biochemical parameters and its expression with CXCL10/CXCR3 gene and the disease outcome.
In this cross-sectional study, one hundred patients diagnosed of COVID-19 aged more than 18 years were participated. The diagnosis and severity of the disease was staged according to comprehensive guidelines for management of COVID-19 patients published by Director General of Health Services, Ministry of Health and Family Welfare (MoHF), Government of India. This study was conducted in the Department of Biochemistry, in collaboration with COVID-19 task force of Justice KS Hegde Charitable Hospital and Molecular Genetics Division of Central research laboratory/Virology of KS Hegde Medical Academy, Mangalore, India. The study was conducted after the approval of Central Ethics Committee, Nitte (Deemed to be University) (INST.EC/EC/110/2021-22). Informed consent was also obtained from the study subjects.
Patients who were clinically diagnosed of hypertension, pre-existing co-morbid conditions were excluded from the study.
The demographic (age, gender), clinical and laboratory parameters such as medical histories, clinical symptoms (fever, cough, expectoration, dyspnea, chest pain, diarrhea, headache, anorexia, nausea and vomiting), vital signs (temperature, heart rate, respiratory rate, oxygen saturation, blood pressure) were collected from the patient medical records and recorded in the data collection form.
Two milliliters of venous fasting blood sample was collected with the standard precautions from COVID-19 diagnosed patients from COVID wards/ ICU in EDTA, plain, and fluoride tubes after wearing personal protective equipment. The blood samples were centrifuged at 3000 rpm for 15 minutes. EDTA sample was used for genotyping, plain blood for serum insulin whereas fluoride sample was analyzed for fasting blood glucose estimation. D-dimer, ferritin and other biochemical and hematological parameters were taken from the medical records
DNA was extracted and genotyped using EDTA blood. Miller’s DNA isolation technique was modified, and the DNA was isolated and stored at -20°C. The DNA was amplified by PCR and pattern was analyzed by Sanger sequencing technique (Figure) to study the SNP for CXCL10 (rs201830102) and CXCR3 (rs779120264). The primers were designed by using the software Primerblast.The suitable forward and reverse primers .
CXCL10: (rs201830102)
Forward Primer: 5’- TGTGATCCATTCCTCCTCAGAT – 3’
Reverse Primer: 5’-ACAACCAGGGAAGTGATAATCAGA- 3’
CXCR3: (rs779120264)
Forward Primer: 5’-CCACCTAGCTGTAGCAGACA-3’
Reverse Primer: 5’-TCCCGGGAGCGAGGATATT-3’
By electrophoresis on 0.8% agarose gel with ethidium bromide (0.5 g/mL) in TAE buffer, the DNA’s quality was examined. The quantification and purity of DNA was checked by the spectrophotometer (ratio of OD260/OD280) after the amplification of DNA, that is after PCR. DNA concentration was calculated using the following formula:
Concentration (µg/mL) of DNA in original solution= Absorbance x 100 x 50 µg/mL.
Fasting blood sugar, urea, creatinine, total protein, albumin, globulin, electrolytes, D dimer, ferritin, SGOT, SGPT were estimated by commercially available reagent kits using fully automated clinical chemistry analyzer, Cobas C-311. Fasting insulin was assayed by ELISA. Hb %, neutrophil %, lymphocyte %, platelet count and total leucocyte count was done using fully automated hematology instrument Sysmex XN 1000.
Descriptive statistics of the exploratory and outcome variables was calculated be mean
± SD, percentage, median ± IQR based on normality of the data. Hardy Weinberg equilibrium was performed in the cases for each genotype variant. Chi square analysis was used to find the association of gene polymorphisms with severity of infection and serum biochemical parameters. Metabolic parameters were compared between different stages of severity (severe, moderate and mild) by Kruskal-Wallis test and one-way ANOVA test. Dunn’s multiple comparison test was used to determine the statistical differences between the biochemical parameters in the three groups.
The distribution of genotypes and alleles of CXCL10 (rs201830102) and CXCR3 (rs779120264) gene variants are provided in Table 1 and Table 2. The chromatogram of the sequenced genes are represented in Figure.
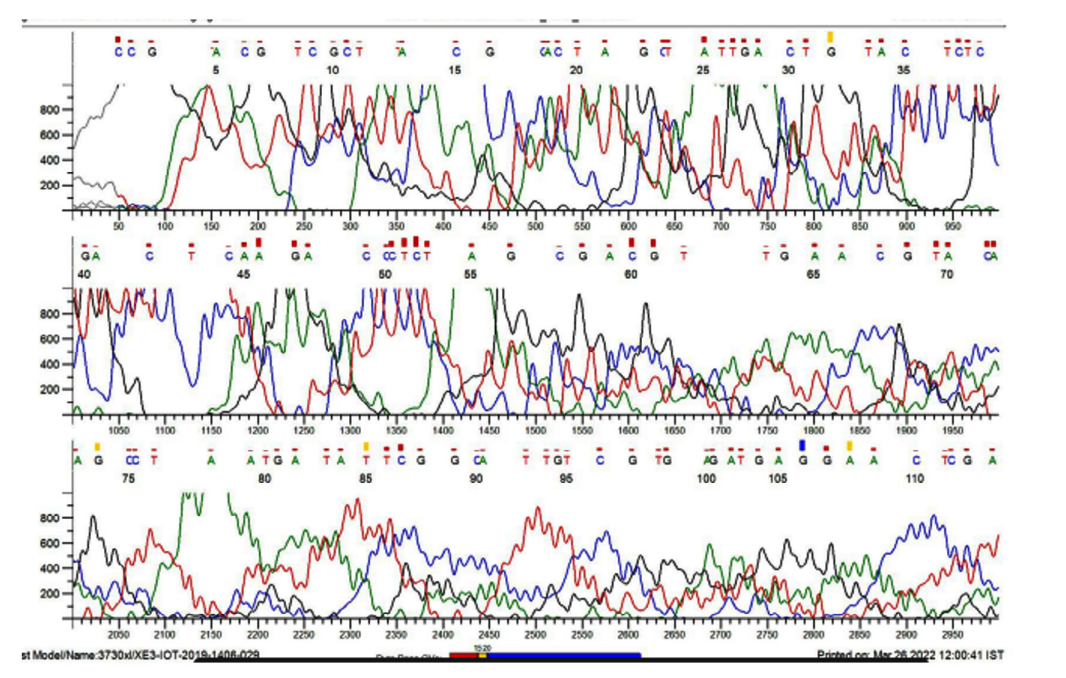
Figure. Chromatogram of sequenced genes
Table (1):
Hardy Weinberg Equilibrium of CXCL10 genotype in study participants
| CXCL10 (rs201830102) C/T | Cases | Chi square value | P value | |
|---|---|---|---|---|
| Expected | Observed | |||
| Dominant homozygotes (CC) | 97.02 | 97 | 0.0232 | 0.985 |
| Heterozygotes (CT) | 2.95 | 03 | ||
| Recessive Homozygotes (TT) | 0.025 | 0 | ||
Table (2):
Hardy Weinberg Equilibrium of CXCR3 genotype in study participants
| CXCR3 (rs779120264) | Cases | Chi square value | P value | |
|---|---|---|---|---|
| Expected | Observed | |||
| Dominant homozygotes (AA) | 86.49 | 92 | 71.6376 | 0.00 |
| Heterozygotes (AC) | 13.02 | 02 | ||
| Recessive Homozygotes (CC) | 0.49 | 06 | ||
The genotype frequency distributions for CXCL10 (rs201830102) showed no significant deviation from HWE in COVID-19 cases, suggesting that the alleles were in equilibrium and CXCR3 (rs779120264) gene variant deviated significantly from HWE in COVID-19 cases
(P < 0.05), suggesting that alleles were not in equilibrium. The percentage of mutations in the CXCL10 gene (rs201830102) is very low, with 3% of patients showing the heterozygous genotype (CT) and no patients showing the recessive homozygous genotype (TT). In contrast, the CXCR3 gene (rs779120264) showed 2% of patients with the heterozygous genotype (AC) and 6% with the recessive homozygous genotype (CC), which gives a combined prevalence of 8% for patients carrying either the heterozygous or recessive genotype. (Table 1 and Table 2) CXCL10 showed no deviation from Hardy-Weinberg equilibrium (p = 0.985), while CXCR3 significantly deviated (p < 0.05). These results emphasize the importance of CXCR3 gene variants in the patient cohort studied.
Random blood sugar (RBS) level varied widely among severe, moderate, mild case and this variation was statistically significant (P < 0.0001) (Table 3). Post hoc test showed highly significant values between RBS values of severe and mild cases (P < 0.001) and significant value (P < 0.05) between moderate and mild cases. Blood urea also showed highly significant difference in various severity of COVID-19 infection (P < 0.0001) (Table 3). AST and AST levels in moderate and severe were significantly high compared to mild cases of COVID-19 cases, respectively (P-0.0003) ALT (P-0.0046) (Table 4). Total protein (P-0.009) and serum albumin levels (P < 0.0001) were significantly less in moderate and severe cases of COVID-19 cases as shown in Table 4.
Table (3):
Comparison of biochemical parameters in various severity COVID-19 groups
Parameters |
Mild |
Moderate |
Severe |
P value |
|---|---|---|---|---|
FBS (mg/dL) |
142 (80-224) |
146 (127-170) |
141.5 (73-196) |
0.5988 |
Insulin (µIU/ml) |
2.77 (0.020-34.8) |
6.37 (1.71-32.5) |
2.67 (0.02-56.716) |
0.1588 |
RBS (mg/dL) |
105 (77-292) |
150 (93-450) |
169 (90-497) |
|
C-peptide (ng/ml) |
1.7 (0.27-7.75) |
2 (1.25-4.9) |
1.89 (0.06-7.75) |
0.28 |
Leptin (ng/ml) |
60.92 (2.7-92.88) |
69.23 (30.5-98.03) |
56.295 (4.34-102.6) |
0.73 |
Potassium (mEq/dL) |
4.081 ± 0.4480 |
4.148 ± 0.616 |
4.161 ± 0.6190 |
0.8122 |
Uric acid (mg/dL) |
4.94 (1.59-10.41) |
3.43 (1.93-5.59) |
3.98 (1.7-10.62) |
0.1805 |
Sodium (mEq/dL) |
138 (124-144) |
135 (129-140) |
137 (116-148) |
0.0607 |
Creatinine (mg/dL) |
0.86 (0.48-3.8) |
0.725 (0.53-1.24) |
0.85 (0.44-8.72) |
0.429 |
Urea (mg/ml) |
19.3 (10.4-82.30) |
21.8 (16.9-30.3) |
34.1 (12.3-123.5) |
P < 0.0001, RBS between mild and severe COVID cases
P < 0.001, Blood urea level between mild and severe cases
Table (4):
Comparison of hepatic parameters in various severity COVID-19 groups
Parameters |
Mild |
Moderate |
Severe |
P value |
|---|---|---|---|---|
Albumin (g/dL) |
4.29 ± 0.88 |
3.89 ± 0.377 |
3.54 ± 0.44 |
|
Globulin (g/dL) |
2.95 (1.98-4.61) |
3.055 (2.41-3.98) |
2.925 (2.17-4.43) |
0.49 |
TP (g/dL) |
7.3 (4.1-8.1) |
7.15 (6.1-8.0) |
6.5 (5-8.6) |
0.0009** |
ALP (IU/L) |
80 (38-248) |
77 (40-205) |
85 (34-229) |
0.872 |
AST (IU/L) |
24.8 (14.1- 143.7) |
44.7 (11-187.7) |
52.5 (9.5-452.7) |
0.0003** |
ALT (IU/L) |
23.20 (7.2-85.10) |
42.15 (13.3-124) |
32.5 ( 6.4-877.2) |
0.0046** |
P < 0.0001 in serum albumin, P < 0.0005 in AST, P < 0.005 in ALT and P < 0.001 in total protein values between mild and severe cases
There was a significant difference in all hematological parameters except total leucocyte count in different grades of COVID-19 severity. Hemoglobin (P = 0.0156), lymphocyte (P = 0.0049 and platelet counts (P < 0.013) were significantly less in moderate and severe cases compared to mild cases while rest of the parameters such as neutrophils (P = 0.0016), ESR (P < 0.0001), Ferritin (P < 0.0001) and D-dimer (P < 0.0001) showed highly significant difference in their values. All these parameters were higher in moderate and severe cases of COVID-19 compared to mild cases (Table 5).
Table (5):
Comparison of haematological parameters in various severity COVID-19 groups
Parameters |
Mild |
Moderate |
Severe |
P value |
|---|---|---|---|---|
Haemoglobin (g/dl) |
13 (1.8-17) |
13.1 (9.6-14.1) |
11.6 (3.1-15.2) |
0.0156* |
ESR mm/hr |
19.50 (2-74) |
53 (30-98) |
56 (2-100) |
|
TLC (cmm) |
7814.28 ± 3139.3 |
8370 ± 4323.6 |
8327.9 ± 3287.5 |
0.7753 |
Neutrophils (cmm) |
79.5 (50-93) |
81 (70-96) |
89 (36-96) |
0.0016** |
Lymphocyte (cmm) |
19 (5-48) |
18 (2-29) |
10 (5-48) |
0.0049** |
Platelet count (Lakh/mm3) |
240000 (4000-468000) |
232000 (120000-493000) |
182000 (28000-514000) |
|
Ferritin (μg/mL |
135.15 (10.41-1542) |
464 (126.7-1064) |
643.85 (5.82-4283) |
|
D dimer (μg/mL) |
0.24 (0.01-20.66) |
0.45 (0.12-4.51) |
1.305 ( 0.01-24.56) |
P < 0.0001 in ESR, Ferritin, D-dimer values between mild and severe cases
P < 0.005 in Neutrophils (mild), Lymphocytes (mild, moderate), with severe cases
P < 0.05 in haemoglobin between mild and severe cases
P < 0.05 in platelet count between mild, moderate with severe cases
There was no association of gene polymorphism with D dimer, SGOT, ESR, RBS, HB, lymphocytes and disease severity (P> 0.05) (Tables 6-11). Increased ferritin levels showed significant association between wild (CC) and mutant type of CXCL10 gene polymorphism (P=0.0123) (Table 12), as was neutrophil count in moderate COVID-19 infection (P=0.016) (Table 13). Additionally, increased platelet count in mild cases showed highly significant association between wild (CC) and mutant variant of CXCL10 gene polymorphism (P = 0.0003) (Table 14).
Table (6):
Association of expression of D-dimer with CXCL10 gene polymorphism in various stages of COVID-19
| Severity of COVID | D-Dimer μg/mL | CC | CT+TT | Chi Square value | P VALUE | OR (95% CI) |
|---|---|---|---|---|---|---|
| Severe | <0.5 μg/mL | 09 | 00 | 0.255 | 0.613 | 0.00 (0.0 to 0.28) |
| >0.5 μg/mL | 35 | 01 | ||||
| Moderate | <0.5 μg/mL | 06 | 00 | P value could not be calculated as dataset is 0 | ||
| >0.5 μg/mL | 05 | 00 | ||||
| Mild | <0.5 μg/mL | 23 | 00 | 0.2524 | 0.00 (0.00 to 1.420 | 0.2524 |
| >0.5 μg/mL | 17 | 01 | ||||
Table (7):
Association of SGOT levels with CXCL10 gene polymorphism in various stages of COVID-19
| Severity of COVID | SGOT | CC | CT+TT | Chi Square value | P VALUE | OR (95% CI) |
|---|---|---|---|---|---|---|
| Severe | <59 | 24 | 01 | 0.03629 | 0.9520 | 1.091 (0.05515 to 21.50) |
| >59 | 22 | 01 | ||||
| Moderate | <59 | 06 | 00 | P value could not be calculated as one of the data set was 0 | ||
| >59 | 05 | 00 | ||||
| Mild | <59 | 30 | 01 | 0.3306 | 0.5653 | 0 (0 to 27.90) |
| >59 | 10 | 00 | ||||
Table (8):
Association of ESR levels with CXCL10 gene polymorphism in various stages of COVID-19
| Severity of COVID | ESR | CC | CT+TT | Chi Square value | P VALUE | OR (95% CI) |
|---|---|---|---|---|---|---|
| Severe | <20 | 04 | 01 | 3.504 | 0.0612 | 0.09524 (0.004951 to 2.237) |
| >20 | 42 | 01 | ||||
| Moderate | <20 | 00 | 00 | P value could not be calculated as one of the data set was 0 | ||
| >20 | 11 | 00 | ||||
| Mild | <20 | 17 | 00 | 0.7260 | 0.3942 | 0 (0.07870 to 0.00) |
| >20 | 23 | 01 | ||||
Table (9):
Association of RBS levels with CXCL10 gene polymorphism in various stages of COVID-19
| Severity of COVID | RBS | CC | CT+TT | Chi Square value | P VALUE | OR (95% CI) |
|---|---|---|---|---|---|---|
| Severe | <140 mg/dL | 15 | 01 | 0.2609 | 0.6095 | 0.4839 (0.02479 to 9.761) |
| >140 mg/dL | 31 | 01 | ||||
| Moderate | <140 mg/dL | 03 | 00 | P value could not be calculated as sample size was 0 | ||
| >140 mg/dL | 08 | 00 | ||||
| Mild | <140 mg/dL | 24 | 01 | 0.6560 | 0.4180 | 0 (0 to 14.06) |
| >140 mg/dL | 16 | 00 | ||||
Table (10):
Association of Hb% levels with CXCL10 gene polymorphism in various stages of COVID-19
| Severity of COVID | Hb% | CC | CT+TT | Chi Square value | P VALUE | OR (95% CI) |
|---|---|---|---|---|---|---|
| Severe | <15 | 41 | 02 | 0.2427 | 0.6223 | 0 (0 to 19.72) |
| >15 | 05 | 00 | ||||
| Moderate | <15 | 10 | 01 | P value could not be calculated as sample size was 0 | ||
| >15 | 00 | 00 | ||||
| Mild | <15 | 25 | 01 | 0.5913 | 0.4419 | 0 (0 to 15.60) |
| >15 | 15 | 00 | ||||
Table (11):
Association of lymphocyte levels with CXCL10 gene polymorphism in various stages of COVID-19
| Severity of COVID | Lymphocytes | CC | CT+TT | Chi Square value | P VALUE | OR (95% CI) |
|---|---|---|---|---|---|---|
| Severe | <20 | 32 | 02 | 0.8593 | 0.3539 | 0 (0 to 5.279) |
| >20 | 14 | 00 | ||||
| Moderate | <20 | 06 | 00 | |||
| >20 | 05 | 00 | ||||
| Mild | <20 | 20 | 01 | 0.9762 | 0.3231 | 0 (0 to 9.450) |
| >20 | 20 | 00 | ||||
Table (12):
Association of ferritin levels with CXCL10 gene polymorphism in various stages of COVID-19
| Severity of COVID | Serum Ferritin | CC | CT+TT | Chi Square value | P VALUE | OR (95% CI) |
|---|---|---|---|---|---|---|
| Severe | <464 ng/mL | 12 | 02 | 6.26 | 0.0123* | 0 (0 to 0.6869) |
| >464 ng/mL | 34 | 00 | ||||
| Moderate | <464 ng/mL | 03 | 03 | 0.110 | 0.7401 | 0.6667 (0.07613 to 5.848) |
| >464 ng/mL | 03 | 02 | ||||
| Mild | <464 ng/mL | 27 | 01 | 0.4511 | 0.5018 | 0 (0 to 21.00) |
| >464 ng/mL | 13 | 00 |
Table (13):
Association of neutrophil count with CXCL10 gene polymorphism in various stages of COVID-19
| Severity of COVID | Neutrophils | CC | CT+TT | Chi Square value | P VALUE | OR (95% CI) |
|---|---|---|---|---|---|---|
| Severe | <80% | 08 | 00 | 0.4174 | 0.5182 | 0 (0 to 0.00899) |
| >80% | 38 | 02 | ||||
| Moderate | <80% | 05 | 07 | 5.727 | 0.0167* | 0 (0 to 0.6999) |
| >80% | 06 | 00 | ||||
| Mild | <80% | 19 | 00 | 0.8852 | 0.3468 | 0 (0.09596 to 0.000) |
| >80% | 21 | 01 |
Table (14):
Association of platelet levels with CXCL10 gene polymorphism in various stages of COVID-19
| Severity of COVID | Platelets | CC | CT+TT | Chi Square value | P VALUE | OR (95% CI) |
|---|---|---|---|---|---|---|
| Severe | <1,50,000 | 11 | 01 | 0.6957 | 0.4042 | 0.3143 (0.01617 to 6.479) |
| >1,50,000 | 35 | 01 | ||||
| Moderate | <1,50,000 | 01 | 00 | |||
| >1,50,000 | 11 | 00 | ||||
| Mild | <1,50,000 | 02 | 01 | 12.98 | 0.0003** | 0 (0 to 0.7105) |
| >1,50,000 | 38 | 00 |
There were no significant associations found between CXCR3 gene polymorphisms and the biochemical or hematological parameters measured (D-dimer, ferritin, neutrophils, SGOT, ESR, RBS, and hemoglobin) in severe, moderate, or mild COVID-19 cases (Tables 15-21). This suggests that, unlike CXCL10, the CXCR3 gene polymorphisms do not significantly influence these clinical markers in relation to COVID-19 severity.
Table (15):
Association of D-dimer levels with CXCR3 (rs779120264) gene polymorphism and COVID-19 cases
| Severity of COVID | D-Dimer μg/mL | AA | AC+CC | Chi Square value | P VALUE | OR (95% CI) |
|---|---|---|---|---|---|---|
| Severe | <0.5 μg/mL | 09 | 00 | 0.4816 | 0.487 | 0 (0 to 0.1044) |
| >0.5 μg/mL | 37 | 02 | ||||
| Moderate | <0.5 μg/mL | 03 | 03 | 0.6268 | ||
| >0.5 μg/mL | 05 | 00 | ||||
| Mild | <0.5 μg/mL | 21 | 02 | 0.326 | 0.568 | 2.100 (0.1224 to 20.36 to) |
| >0.5 μg/mL | 14 | 02 | ||||
Table (16):
Association of ferritin levels with CXCR3 (rs779120264) gene polymorphism and COVID-19 cases
| Severity of COVID | Serum Ferritin | AA | AC+CC | Chi Square value | P VALUE | OR(95% CI) |
|---|---|---|---|---|---|---|
| Severe | <464 ng/mL | 13 | 01 | 0.4384 | 0.5079 | 0.3939 (0.02022 to 8.021) |
| >464 ng/mL | 33 | 01 | ||||
| Moderate | <464 ng/mL | 05 | 01 | 0.900 | 0.3428 | 0.00 (0.000 to 11.25) |
| >464 ng/mL | 03 | 02 | ||||
| Mild | <464 ng/mL | 26 | 01 | 1.415 | 0.234 | 4.375 (0.2451 to 42.24) |
| >464 ng/mL | 12 | 03 |
Table (17):
Association of neutrophil count with CXCR3 (rs779120264) gene polymorphism and COVID-19 cases
| Severity of COVID | Neutrophils | AA | AC+CC | Chi Square value | P VALUE | OR (95% CI) |
|---|---|---|---|---|---|---|
| Severe | <80% | 08 | 00 | 0.4174 | 0.5182 | 0 (0 to 0.00899) |
| >80% | 38 | 02 | ||||
| Moderate | <80% | 04 | 1 | 0.2444 | 0.6210 | 2.000 (0.1640 to 35.37) |
| >80% | 04 | 02 | ||||
| Mild | <80% | 16 | 03 | 3.748 | 0.0529 | 0 (0 to 0.9417) |
| >80% | 22 | 00 |
Table (18):
Association of SGOT levels with CXCR3 (rs779120264) gene polymorphism and COVID-19 cases
| Severity of COVID | SGOT | AA | AC+CC | Chi Square value | P VALUE | OR (95% CI) |
|---|---|---|---|---|---|---|
| Severe | <59 | 23 | 02 | 1.920 | 0.1659 | 0 (0 to 2.322) |
| >59 | 23 | 00 | ||||
| Moderate | <59 | 05 | 01 | 0.7486 | 0.3869 | 3.333 (0.2586 to 56.53) |
| >59 | 03 | 02 | ||||
| Mild | <59 | 29 | 02 | 0.1404 | 0.7079 | 1.611 (0.1009 to 14.93) |
| >59 | 09 | 01 |
Table (19):
Association of ESR levels with CXCR3 (rs779120264) gene polymorphism and COVID-19 cases
| Severity of COVID | ESR | AA | AC+CC | Chi Square value | P VALUE | OR (95% CI) |
|---|---|---|---|---|---|---|
| Severe | <20 | 05 | 00 | 0.2427 | 0.6223 | 0 (0 to 0.05072) |
| >20 | 41 | 02 | ||||
| Moderate | <20 | 00 | 00 | P value could not be calculated as sample size was | ||
| >20 | 08 | 03 | ||||
| Mild | <20 | 16 | 01 | 0.08815 | 0.7665 | 1.455 (0.1572 to 22.25) |
| >20 | 22 | 02 | ||||
Table (20):
Association of RBS levels with CXCR3 (rs779120264) gene polymorphism and COVID-19 cases
| Severity of COVID | RBS | AA | AC+CC | Chi Square value | P VALUE | OR (95% CI) |
|---|---|---|---|---|---|---|
| Severe | <140 mg/dL | 16 | 00 | 1.043 | 0.3070 | 0 (0 to 0.2310) |
| >140 mg/dL | 30 | 02 | ||||
| Moderate | <140 mg/dL | 01 | 02 | 3.227 | 0.0724 | 0.07143 (0.004481 to 1.409) |
| >140 mg/dL | 07 | 01 | ||||
| Mild | <140 mg/dL | 24 | 01 | 0.7691 | 0.3805 | 0.2917 (0.01486 to 6.282) |
| >140 mg/dL | 14 | 02 |
Table (21):
Association of Hb% levels with CXCR3 (rs779120264) gene polymorphism and COVID-19
| Severity of COVID | Hb% | AA | AC+CC | Chi Square value | P VALUE | OR (95% CI) |
|---|---|---|---|---|---|---|
| Severe | <15 | 41 | 02 | 0.2427 | 0.6223 | 0 (0 to 19.72) |
| >15 | 05 | 00 | ||||
| Moderate | <15 | 07 | 03 | 0.4123 | 0.5207 | 0 (0 to 24.00) |
| >15 | 01 | 00 | ||||
| Mild | <15 | 24 | 02 | 0.01475 | 0.9033 | 0.8571 (0.05557 to 7.915) |
| >15 | 14 | 01 |
Ichikawa and colleagues elegantly demonstrated that the CXCL10-CXCR3 binding signalling plays a major role in the exacerbation of ARDS in mice.15 ARDS was induced by viral infection (with influenza H5N1 virus) in both wild-type and CXCL10/CXCR3 knock-out mice. The authors observed that wild type mice developing ARDS showed a concomitant increase of CXCL10 levels mainly due to an increased secretion by infiltrating neutrophils, which induced an autocrine loop mechanism on the chemotaxis of inflamed neutrophils, leading to fulminant pulmonary inflammation. On the other hand, CXCL10 or CXCR3 knock-out mice showed less severe lung injury.16,17 Additionally, in ARDS patients undergoing mechanical ventilation, CXCL10 and CXCR3 levels were measured, revealing a significant correlation between elevated CXCL10 and CXCR3 expression and the severity of ventilator-induced lung injury, which appears to be mediated by mast cell chemotaxis.18
In our study, increased ferritin levels, an inflammatory marker, were significantly associated with the CXCL10 gene polymorphism, specifically the wild-type (CC) genotype, in severe COVID-19 cases. Additionally, the same genotype (CC) showed a significant decrease in platelet count in severe cases. Moreover, CXCR3 gene polymorphisms were observed in a significant number of patients, although no significant associations were found between CXCR3 polymorphisms and biochemical or hematological markers. In a study published in 2020, Chua et al. examined the immune response and pathways linked to severe COVID-19. The authors stated that when compared to the moderate cases, the expression of the various chemokine-encoding genes CCL2, CCL3, CCL20, CXCL1, CXCL3, and CXCL10 increased noticeably in the critical cases, which may have boosted the recruitment of cells from the immune system to the areas of inflammation (lung), leading to respiratory distress.19
Role of hepatic markers with severity of COVID-19 infections
Patients with severe COVID symptoms in our study had significantly higher AST and ALT levels which was similar with a study done with increased AST and ALT levels in COVID cases by Hwaiz et al.20 It was also said that a very high level of AST could predict overall survival in individuals with severe COVID-19. Similarly, our study exhibited significant association of serum AST with disease severity. AST levels were elevated more than the normal range in patients with severe symptoms, whereas in mild and moderate these levels were within the normal range. The hepatic damage could be due to consumption of antipyretic drugs and antiviral medications, oxygen deficiency and ATP consumption in liver cells that can release ROS and trigger pro-inflammatory factors resulting in hepatocyte damage.21
Role of hematological markers with severity of COVID-19 infections
In the current study, COVID-19 patients had a drop in lymphocyte that substantially correlated with the severe COVID cases. These results were in accordance with a meta-analysis study by Huang et al.22 One hypothesis states that the virus instantly targets and kills, cells that express the SARS-CoV-2 receptor ACE2. Another theory is that in COVID-19, high levels of pro-inflammatory cytokines such as tumor necrosis factor (TNF) and IL-6 encourage lymphocyte apoptosis.23 Our study showed no significant association of lymphocyte level with disease severity. Increased neutrophil percentage was observed in severe COVID cases which was in accordance to many studies. In response to infection neutrophils release neutrophil extracellular trap, cytokines and produce reactive oxygen species that help combust infection. This explains the increase of neutrophils in COVID-19.24
A meta-analysis study comprising of nine research papers involving 1779 COVID-19 patients showed thrombocytopenia in COVID-19 infection thus indicating the advancing illness while hospitalized.25 In our study, 24% and 21.5% decrease in platelet count was observed in severe COVID cases compared to mild and moderate cases.
Role of acute phase reactants with severity of COVID-19 infections
Zhou et al stated that increased D-dimer is a separate risk factor for disease progression and is markedly elevated in instances of severe pneumonia. Our study supported this observation as elevated d D-dimer levels, more than the normal range were observed in severe COVID cases (1.305 microgram/mL) with a highly increased significant association of D dimer in these patients. Increased D-dimer indicates an imbalance between pro-inflammatory and anti-inflammatory cytokines and a surge of cytokines that results in severe damage to endothelial cells that can cause hypercoagulation, disseminated intravascular coagulation, and acute respiratory distress in COVID-19.26
Cytokine storm, numerous inflammatory triggers, cellular damage, metabolic acidosis and associated release of ROS in COVID-19 illness release ferritin from macrophages in lung parenchyma. In acute as well as chronic inflammatory reactions, the acute phase reactant serum ferritin is released.27 Hence serum ferritin levels was increased significantly in severe COVID cases in our study and an association between increased serum ferritin level and severe COVID-19 disease. Serum ferritin was thus found to be an independent predictor of severe SARS-CoV-2 disease.28-30 Our study has also reported that patients with severe COVID-19 showed notable elevations and significant association with ESR. Similarly, ESR was significantly elevated in serious COVID-19 patients in ICU with oxygen support as compared to other COVID cases. ESR which is also a measure of inflammation is not specific and can increase in various other pathological conditions. 31 Perhaps making ferritin and D dimer the trademark for disease severity in COVID-19 cases.
Our study demonstrated significant associations between elevated serum D-dimer, ferritin, RBS, neutrophil count, ESR, and hemoglobin levels in severe COVID-19 cases compared to mild cases. Lymphocyte and platelet count also varied significantly with disease severity, suggesting they may be more reliable predictors in distinguishing between moderate and severe COVID-19 cases. No significant associations were observed between gene polymorphisms and markers of disease severity, except for the wild-type CXCL10 genotype, which was linked to increased ferritin levels. This suggests that mutations in CXCL10 may provide protective effects compared to the wild-type variants.
Although CXCR3 gene polymorphisms were prevalent in a significant number of patients, no significant associations were observed between CXCR3 polymorphisms and biochemical or hematological markers. These findings suggest that while CXCL10 polymorphisms may influence the severity of COVID-19, CXCR3 polymorphisms may not have a direct impact on clinical outcomes. Further research is required to understand the role of these genetic variations in the progression and severity of COVID-19.
ACKNOWLEDGMENTS
None.
CONFLICT OF INTEREST
The authors declare that there is no conflict of interest.
AUTHORS’ CONTRIBUTION
All authors listed have made a substantial, direct and intellectual contribution to the work, and approved it for publication.
FUNDING
None.
DATA AVAILABILITY
All datasets generated or analyzed during this study are included in the manuscript.
ETHICS STATEMENT
This study was approved by the Central Ethics Committee, Nitte (Deemed to be University) with protocol number INST.EC/EC/110/2021-22.
INFORMED CONSENT
Written informed consent was obtained from the participants before enrolling in the study.
- Guan W-J, Ni Z-Y, Hu Y, et al. Clinical Characteristics of Coronavirus Disease 2019 in China. N Eng J Med. 2020;382(18):1708-1720.
Crossref - Xu G, Yang Y, Du Y, et al. Clinical Pathway for Early Diagnosis of COVID-19: Updates from Experience to Evidence-Based Practice. Clin Rev Allergy Immunol. 2020;59(1):89-100.
Crossref - Faure E, Poissy J, Goffard A, et al. Distinct Immune Response in Two MERS-CoV-Infected Patients: Can We Go from Bench to Bedside?. PLoS ONE. 2014;9(2):e88716.
Crossref - Zhang C, Wu Z, Li JW, Zhao H, Wang GQ. Cytokine release syndrome in severe COVID-19: interleukin-6 receptor antagonist tocilizumab may be the key to reduce mortality. Int J Antimicrob Agents. 2020;55(5):105954.
Crossref - Channappanavar R, Fehr AR, Vijay R, et al. Dysregulated Type I Interferon and Inflammatory Monocyte-Macrophage Responses Cause Lethal Pneumonia in SARS-CoV-Infected Mice. Cell Host Microbe. 2016;19(2):181-193.
Crossref - Channappanavar R, Perlman S. Pathogenic human coronavirus infections: causes and consequences of cytokine storm and immunopathology. Semin Immunopathol. 2017;39(5):529-539.
Crossref - Coperchini F, Chiovato L, Croce L, Magri F, Rotondi M. The Cytokine storm in COVID-19: An overview of the involvement of the chemokine/chemokine-receptor system. Cytokine Growth Factor Rev. 2020;53:25-32.
Crossref - Rotondi M, Chiovato L, Romagnani S, Serio M, Romagnani P. The Chemokine System as a Therapeutic Target in Autoimmune Thyroid Diseases: A Focus on the Interferon-g Inducible Chemokines and their Receptor. Curr Pharm Des. 2011;17(29):3202-3216.
Crossref - Rotondi M, Chiovato L, Romagnani S, Serio M, Romagnani P. Role of Chemokines in Endocrine Autoimmune Diseases. Endocr Rev. 2007;28(5):492-520.
Crossref - Vazirinejad R, Ahmadi Z, Arababadi MK, Hassanshahi G, Kennedy D. The Biological Functions, Structure and Sources of CXCL10 and Its Outstanding Part in the Pathophysiology of Multiple Sclerosis. Neuroimmunomodulation. 2014;21(6):322-330.
Crossref - Liu M, Guo S, Stiles JK. The emerging role of CXCL10 in cancer (Review). Oncol Lett. 2011;2(4):583-589.
Crossref - Xagorari A, Chlichlia K. Toll-Like Receptors and Viruses: Induction of Innate Antiviral Immune Responses. Open Microbiol J. 2008;2(1):49-59.
Crossref - Lore NI, De Lorenzo R, Rancoita PMV, et al. CXCL10 levels at hospital admission predict COVID-19 outcome: hierarchical assessment of 53 putative inflammatory biomarkers in an observational study. Mol Med. 2021;27(1):129.
Crossref - Zhang N, Zhao YD, Wang XM. CXCL10 an important chemokine associated with cytokine storm in COVID-19 infected patients. Eur Rev Med Pharmacol Sci. 2020;24(13):7497-505.
- Ichikawa A, Kuba K, Morita M, et al. CXCL10-CXCR3 Enhances the Development of Neutrophil-mediated Fulminant Lung Injury of Viral and Nonviral Origin. Am J Respir Crit Care Med. 2013;187(1):65-77.
Crossref - Hou YJ, Okuda K, Edwards CE, et al. SARS-CoV-2 Reverse Genetics Reveals a Variable Infection Gradient in the Respiratory Tract. Cell. 2020;182(2):429-446.e14.
Crossref - Peiris JSM, Yuen KY, Osterhaus ADME, Stohr K. The severe acute respiratory syndrome. N Engl J Med. 2003;349(25):2431-2441.
Crossref - Xie Y, Zheng H, Mou Z, Wang Y, Li X. High Expression of CXCL10/CXCR3 in Ventilator-Induced Lung Injury Caused by High Mechanical Power. Biomed Res Int. 2022;2022:6803154.
Crossref - Chua RL, Lukassen S, Trump S, et al. COVID-19 severity correlates with airway epithelium-immune cell interactions identified by single-cell analysis. Nat Biotechnol. 2020;38(8):970-979.
Crossref - Hwaiz R, Merza M, Hamad B, HamaSalih S, Mohammed M, Hama H. Evaluation of hepatic enzymes activities in COVID-19 patients. Int Immunopharmacol. 2021;97:107701.
Crossref - Nazar HAZ, Oead MSB, Al-obidy M. Hepatocellular Damage and Severity of COVID-19 Infection in Iraqi Patients: A Biochemical Study. Rep Biochem Mol Biol. 2022;11(3):524-531.
Crossref - Huang I, Pranata R. Lymphopenia in severe coronavirus disease-2019 (COVID-19): systematic review and meta-analysis. J Intensive Care. 2020;8(1):36.
Crossref - Tan L, Wang Q, Zhang D, et al. Lymphopenia predicts disease severity of COVID-19: a descriptive and predictive study. Signal Transduct Target Ther. 2020;5(1):33.
Crossref - Cunha LL, Perazzio SF, Azzi J, Cravedi P, Riella LV. Remodeling of the Immune Response With Aging: Immunosenescence and Its Potential Impact on COVID-19 Immune Response. Front Immunol. 2020;11:1748.
Crossref - Lippi G, Plebani M, Henry BM. Thrombocytopenia is associated with severe coronavirus disease 2019 (COVID-19) infections: A meta-analysis. Clinica Chimica Acta. 2020;506:145-148.
Crossref - Nemec HM, Ferenczy A, Christie B, Ashley DW, Montgomery A. Correlation of D-dimer and Outcomes in COVID-19 Patients. 2022;88(9):2115-2118.
Crossref - Kaushal K, Kaur H, Sarma P, et al. Serum ferritin as a predictive biomarker in COVID-19. A systematic review, meta-analysis and meta-regression analysis. J Crit Care. 2022;67:172-181.
Crossref - Alroomi M, Rajan R, Omar AA, et al. Ferritin level: A predictor of severity and mortality in hospitalized COVID 19 patients. Immun Inflamm Dis. 2021;9(4):1648-1655.
Crossref - Rasyid H, Sangkereng A, Harjianti T, Soetjipto AS. Impact of age to ferritin and neutrophil lymphocyte ratio as biomarkers for intensive care requirement and mortality risk in COVID 19 patients in Makassar, Indonesia. Physiol Rep. 2021;9(10):e14876.
Crossref - Mehta P, McAuley DF, Brown M, Sanchez E, Tattersall RS, Manson JJ. COVID-19: consider cytokine storm syndromes and immunosuppression. Lancet. 2020;395(10229):1033-1034.
Crossref - Kurt C, Yildirim AA. Contribution of erythrocyte sedimentation rate to predict disease severity and outcome in COVID-19 patients. Can J Infect Dis Med Microbiol. 2022;11:2022.
Crossref
© The Author(s) 2024. Open Access. This article is distributed under the terms of the Creative Commons Attribution 4.0 International License which permits unrestricted use, sharing, distribution, and reproduction in any medium, provided you give appropriate credit to the original author(s) and the source, provide a link to the Creative Commons license, and indicate if changes were made.