

ISSN: 0973-7510
E-ISSN: 2581-690X
Pleione maculata has no scientific reports on quantitative phytochemical and antibiofilm activity till date. The objective of the study was to quantify and determine medicinally important bioactivity in P. maculata and analyse its anti-biofilm activity against clinical isolates Staphyloccocus aureus, Klebsiella pneumoniae and Proteus mirabilis. P. maculata exhibited the highest Total Antioxidant Capacity (TAC) about 193.98±0.1 mg, highest Total Phenolic Content (TPC) at 552±0.0 mg and Total Flavonoid Content (TFC) were observed highest at 879.5±0.2 mg. The acetone and ethyl acetate extracts of P. maculata pseudobulb showed distinct and significant zone of inhibition (ZOI) against drug-resistant S.aureus about 16±0.00 mm (MIC 0.875 mg/mL), ZOI of acetonitrile pseudobulb extract against P. mirabilis was 15.33±0.4 mm (MIC 1 mg/mL), ZOI of acetonitrile extracts of leaves and stem, ethyl acetate extract of pseudobulb was 12±0.0 mm, 12±01.4 mm, 12±2.8 mm against K. pneumoniae (MIC 1.8 mg/mL, 0.68 mg/mL and 3 mg/mL). Acetonitrile extract of pseudobulbs exhibited the highest Minimum Biofilm Inhibition concentration (MBIC) at 0.25 mg/mL against S. aureus, water root extract inhibited attachment of K. pneumoniae with lowest MBIC value 0.093 mg/mL, water and acetone extract of leaves inhibited cell attachment of P. mirabilis at lowest MBIC 0.117 and 0.171 mg/mL. The UV-VIS absorption band of P. maculata extracts ranges from 204-665 nm indicating the presence of phenolic and flavonoid compounds. The study indicates the potentiality of P. maculata as a rich source of medicinal active compounds as an antibiofilm agent against antibiotic-resistant clinical isolates.
Quantitative analysis, Antibiofilm agent, UV-VIS, Pleione maculata, endangered orchid
Orchids are the largest flowering plants and most threatened species in the plant kingdom, with 25,000 to 35,000 species1,2. Due to favourable climatic conditions and phytogeographical conditions, the North Eastern Region (NER) of India is abundant in orchid diversity3 and commonly found in region viz. Meghalaya3 Arunachal Pradesh4 Manipur, Nagaland, and Sikkim5. The aesthetic aspects of orchids have been studied and exploited for centuries. But the rare and largely unexplored orchid flora of Northeast India is a potential goldmine from the view of medicinally important molecules. Urbanization, overexploitation, and illegal trade, orchids face climatic changes, biodiversity loss, habitat destructions, and extinction1. The Convention on International Trade in Endangered Species of Wild Fauna and Flora (CITES) put all Orchidaceae species under Appendix II to conserve biodiversity. It ensures that their trade is only through permits of export6. One such unexplored, rare epiphytic orchid in the scientific research field belongs to the genus Pleione. Species of Pleione viz. Pleione chunii, P. formosana, P. forrestii, and P. pleionoides also appear in the IUCN list as endangered or vulnerable. Pleione is a small genus of orchids comprising of nineteen species only. The orchid is divided into two sections Pleione Humiles (autumn flowering) and Pleione Pleiones (spring flowering)7. Pleione maculata is a medicinally important epiphytic8 rare species and is autumn flowering. In Nepal9 and North Eastern states of India such as Sikkim and Arunachal Pradesh10, the rhizome of P. maculata therapeutic uses is for liver complaints and stomach ailments. P. maculata is one among several orchids species listed and notified as threatened under Schedule-38 of Biological Diversity Act, 200211. Unbalances of highly reactive free radical molecules are causing various health problems across the world today12. Reactive oxygen species (ROS) and reactive nitrogen species (RNS), such as hydrogen peroxide and nitrous acid, are examples of free radicals13. Free radicals develop many diseases such as cardiovascular diseases, cancer, aging, and diabetes due to imbalances in their electron molecules14. Plants include numerous phytoconstituents, such as phenolic compounds, flavonoids, vitamin C, vitamin E, and carotenoids, that generate and have various biological effects, including free radical scavenging, antioxidant activity, and anti-tumor activity15.
Today, the science of dealing with the prevention and treatment of diseases caused by microorganisms has come down due to some antibiotic-resistant bacteria. The resistance may be due to the wide use of antibiotics as growth promoters in animal food and maybe overuse of antibiotics in humans1. Traditional treatment processes against bacterial infections depend on different antimicrobial compounds or antibiotics that can either inhibit or kill the growing microbial cells17. But pathogenic microorganisms can resist themselves against those inhibitory compounds by forming microbial communities termed biofilms16. Biofilms are the assemblages of microbial cells embedded in a matrix of self-produced polymeric substances consisting of polysaccharides, proteins, and DNA. The transcribed genes of biofilm-associated microorganisms differ from their planktonic cells18. Adhesion, followed by microcolony development, maturation, and dispersion, are the four distinct phases of microbial biofilm formation19. The dispersal mechanism is critical because it starts a new infection cycle by the colonization of a new surface, allowing microbial infection to spread quickly20. Biofilms adhere to biological and non-biological medical devices, urinary catheters, living tissue, dental and industrial setting surfaces21. The biofilm has a slower growth rate and secretes various surface chemicals and virulence factors, increasing their toxicity by hundreds of times22. Microbial biofilms are involved in several chronic infectious diseases in humans, an estimated 65% of all infections according to the Centre for disease control (CDC) and 80% according to the National Institutes of Health (NIH)16. Urinary tract infections, pneumonia, cystic fibrosis, periodontitis, endocarditis, osteomyelitis, rhinosinusitis are caused by bacterial biofilm24. Several bacteria are highly pathogenic to humans. Staphylococcus aureus is a pathogen causing various diseases on the human host through biofilm formation25 and is multidrug-resistant26,27. Klebsiella pneumoniae isolated from urine, sputum, or wound swabs can form up to 40% biofilm. That can cause nosocomial infections such as urinary tract infections, septicemia, pneumonia, and tissue infections26. The Gram-negative rod-shaped bacteria Proteus mirabilis is the most common cause of community and healthcare-associated illnesses. Multidrug-resistant (MDR) strains of P. mirabilis can cause severe complications in the survival of hospitalized patients28. Thus, effective strategies can combat these biofilm-linked diseases caused by different microbes. A phytochemical analysis can examine quantitative phytoconstituents in plants to assess plant characteristics. There are few techniques and give a brief idea for identifying the compounds. The most popular ones are spectroscopic and chromatographic techniques. A simple, cost-effective, and sensitive technique is UV-Visible spectroscopy29. There are no scientific reports on total antioxidant activity, total phenolics, and total flavonoid content of Pleione maculata, and the antibiofilm activity against clinical isolates.
The study aims to evaluate the bioactive phytochemicals in Pleione maculata. Also, to assess the antibiofilm activity against select antibiotic-resistant isolates. The target isolates are Staphylococcus aureus (Gram-positive), Klebsiella pneumoniae (Gram-negative), and Proteus mirabilis (Gram-negative).
Collection, preparation, and extraction of phytocompounds
Pleione maculata (Fig. 1.) was collected in Khliehriat, East Jaintia Hills District, Meghalaya, India, during the spring season (temperature was 19°C). For the plant sample, herbarium sheets were prepared. The leaves, pseudobulbs, stems, and roots of P. maculata were weighed individually after being surface sterilized with 70% ethanol. Plant parts were separated and dried in the shade for two weeks. Using a household grinder, the dry materials were ground into a fine powder and kept in microcentrifuge tubes at 4˚C30. The powdered plant material was weighed and soaked in a 1:45 (w/v) ratio in several solvent systems (acetone, acetonitrile, chloroform, ethanol, ethyl acetate, methanol, water). The extracts were agitated for 48 hours at 37°C in an incubator shaker31. Extracts were filtered using Whatman filter paper No. 1 after incubation. For the remaining fractions, filtration was repeated. Evaporation at a constant temperature of 30°C concentrated the extracts. The concentration of extracts obtained is listed in Table 1.
Fig. 1. Pleione maculata collected from Khliehriat, East Jaintia Hills (a) Habitat of P. maculata (b) P. maculata flowering during October.
Table (1):
Stock concentration of P. maculata extracts.
Pleione maculata extracts |
Stock Conc. of extracts (mg/mL) |
|---|---|
LA |
22.5 |
PA |
7 |
SA |
31.25 |
RA |
29.5 |
LAN |
15 |
PAN |
8 |
SAN |
5.5 |
RAN |
11 |
LC |
13.5 |
PC |
18.5 |
SC |
17.25 |
RC |
12 |
LE |
35 |
PE |
20 |
SE |
43.75 |
RE |
29.75 |
LEA |
6.25 |
PEA |
12 |
SEA |
7 |
REA |
13 |
LM |
24.75 |
PM |
16.75 |
SM |
19.5 |
RM |
24.75 |
LW |
7.5 |
PW |
8 |
SW |
15.5 |
RW |
6 |
Sample = Leaves (L), Pseudobulb(P), Stem(S), Root(R), solvent = acetone(A), acetonitrile(AN), chloroform(C), ethanol(E), ethyl acetate(EA), methanol(M), water(W)
Antioxidant activity
Determination of antioxidant activity by 2, 2-diphenyl-1-picrylhydrazyl (DPPH) radical scavenging activity
Each extract (leaves, pseudobulb, stems, and roots) of Pleione maculata was tested to determine the radical scavenging activity36. For this, 2,2-diphenyl-1-picryl-hydrazyl (DPPH) (HiMedia) solution was prepared at a concentration of 1 mg/mL with methanol. The mixture was set in the dark. A stock concentration (1mg/mL) of plant extracts was prepared. The plant extracts and the standard L-ascorbic acid (HiMedia) were diluted at different concentrations (20, 40, 60, 80, 100 µg/mL). A 0.1 mL methanolic DPPH solution was combined with varying concentrations of test extracts on a 96-well microtiter plate. The solution was mixed thoroughly and incubated in the dark at room temperature for 30 minutes. The colour reduction of DPPH was measured at 520 nm in BioEra Life Science Microplate reader Model Nova. A standard curve was plotted with absorbance against the concentration of extracts. The blank and control OD was measured. DPPH free radical scavenging activity can be determined using the formula:
![]()
The test was performed in triplicates and a graph was plotted with the percentage of DPPH radical scavenging activity against the concentration of samples extracts in µg/mL. IC50 values were calculated using statistical functions in Microsoft excel 2010.
Determination of Total antioxidant capacity by Molybdate Assay
The total antioxidant activity was measured using a modified molybdate assay37. The test relies on the reduction of Mo (VI) to Mo (V) after the creation of a complex green-blue phosphate/Mo (V) complex at an acid pH. Molybdate reagent solution was prepared using the ascorbic acid standard solution at various concentrations (20, 60, 80, and 100 mg/mL). The plant extracts were made with dimethyl sulphoxide (DMSO) (HiMedia) at a concentration of 2 mg/mL. A 400µl of plant extract was pipetted out and diluted with methanol, 1.5 mL of molybdate reagent solution was added, and test tubes were sealed with aluminum foil before incubation in water bath at 95°C for 90 minutes. At room temperature, the mixture was allowed to cool. An SYSTRONICS PC-based double beam UV-VIS spectrophotometer-2202 was used to measure the absorbance at 695nm. The blank was made by combining 400 µl of the solvent used for sample extraction with 1.5 mL of molybdate reagent.
The total antioxidant capacity was measured in grams of ascorbic acid equivalents. The antioxidant activity was measured in milligrams of ascorbic acid equivalents (AAE) per milliliter of solution.
Determination of Total phenolic content by Folin Ciocalteau assay
Folin Ciocalteau test38 with modification was used to measure the total phenolic content in each extract. Plant extracts were diluted in 3 mL of DMSO to achieve a concentration of 2 mg/mL. For the calibration curve, gallic acid (3, 4, 5-Trihydroxy benzoic acid – SRL) was collected at various concentrations (20, 40, 60, 80, 100, 120, 140, and 160 mg/mL)39. A 400µl of the test extracts (leaves, pseudobulb, stems, and roots) were mixed with 100µl ethanol and 0.2 mL of Folin Ciocalteau reagent (MERCK-DJ4D640513). The final volume was adjusted with distilled water. Then, 1 mL of 7% sodium carbonate solution was added. The tubes were vortexed and incubated in the dark at room temperature for 2 hours. Using an SYSTRONICS PC-based double beam UV-VIS spectrophotometer-2202, the mixture’s absorbance was measured at 760 nm. The total phenolic content (TPC) was expressed in milligrams of Gallic acid equivalent per gram of P. maculata extracts (mg GAE/g of P. maculata extracts). The following formula was used to determine the total phenolic content of the extract with gallic acid equivalent12.
TPC = C x V/M
Where TPC is the Total Phenolic Content
‘C’ is the concentration of phenolic calculated from the equation obtained from the calibration curve
‘V’ is the volume of the extracts added for the test (mL)
‘M’ is the weight of evaporated extracts (g)
Blank was prepared by adding only methanol in equal volume
Determination of Total flavonoid content by Aluminium chloride method
The AlCl3 technique with modification was used to determine the total flavonoid content of various plant extracts38. Plant extracts were prepared at a concentration of 2 mg/mL. A standard quercetin solution was prepared by pipetting 5 mL of stock and diluting it to make a final volume of 10 mL with 80 percent ethanol. For the calibration curve, a reference solution of quercetin (HiMedia- RM6191-25G) was obtained at various concentrations (20, 40, 60, 80, 100, 120, 140, and 160 mg/mL). A 400µl of the test extracts (leaves, pseudobulb, stems, and roots) and standard quercetin solution were diluted with ethanol. To this, 0.3 mL of 5% NaNO3, 0.3 mL of 10% aluminium chloride solution, and 1M NaOH solution were added. The final volume was adjusted with distilled water. The tubes were vortexed and incubated at room temperature for 40 minutes. Using an SYSTRONICS PC-based double beam UV-VIS spectrophotometer-2202, the mixture’s absorbance was measured at 510 nm. The total flavonoid content (TFC) of Pleione maculata extracts was measured in mg quercetin equivalent per gram of extracts (mg Quercetin/g of P. maculata extracts). The following formula was used to determine the total flavonoid content in the extract with quercetin equivalent12.
TFC = C x V/M
Where TFC is the Total Flavonoid Content
‘C’ is the concentration of quercetin calculated from the equation obtained from the calibration curve
‘V’ is the volume of the extracts added for the test (mL)
‘M’ is the weight of evaporated extracts (g)
Collection of clinical isolates, sub-culturing, and Inoculum preparation
A Gram-negative Proteus mirabilis from feces, a Gram-negative Klebsiella pneumoniae from a urine sample, and a Gram-positive Staphylococcus aureus from a urine sample were provided by Miss Bahunlang Susngi, Medical Microbiologist from Bethany Hospital Shillong, Meghalaya. These clinical isolates were transferred to the Microbiology laboratory of Assam Don Bosco University, Sonapur. Mannitol Salt Agar (HiMedia MH118-500MG) for clinical Staphylococcus aureus and Mac Conkey agar (HiMedia M081B-100G) for Proteus mirabilis and Klebsiella pneumoniae were used.
Preparation of inoculums
The overnight microbial culture was prepared using Luria Bertani broth (Miller- HiMedia M1245-1KG) at 37±2˚C. A 40µl of the microbial culture was diluted in Eppendorf containing 1 mL of sterile double distilled water33. A 0.5 McFarland turbidity standard is a reference used to adjust the inoculum density at 1.5 X 10⁸ CFU/mL34.
Antibacterial activity by Kirby-Bauer Disc diffusion susceptibility method
Antibacterial activity was tested by the disc diffusion method using a 6mm disc. A Luria Bertani agar (Miller-HiMedia M1151-500G) was prepared and sterilized in an autoclave for 15 minutes at 121˚C. The standard working inoculums were swab using a sterile L-shaped glass spreader at an angle of 60˚C with three times rotation34. The discs were dipped in different extracts and dried, followed by inoculation in respected microbial plates. The plates were incubated at 37±2 ˚C for 24 hours in an incubator. The zone of inhibition was observed the next day and measured in millimetres (including 6 mm diameter of the disc). The experiments were performed in duplicates. The ZOI was compared with standard reference antibiotic35.
Broth micro-dilution method (MIC) with Resazurin indicator
MIC is the lowest concentration of extract required to inhibit the growth of microbes in comparison with non-treated (negative) control. Overnight clinical isolates suspension was incubated at 37˚C for 24 hours. Initial suspension was diluted (1:20 ratio) to adjust optical density with 0.5 McFarland’s standards (0.5 OD). Luria Bertani broth was added to a sterile 96-wells microtitre plate containing test extracts followed by serial dilution. To 10µL of the inoculum in each well, 10µL of resazurin indicator (7-hydroxy-3H-phenoxazin-3-one-10-oxide sodium salt) (HiMedia RM125-1G) was added. A negative control containing 10% DMSO with inoculated medium, and a positive control containing antibiotics with the inoculated medium were also prepared. The 96-well plates were sealed with parafilm and incubated at 37±2˚C for 24 hours. The experiment was repeated in duplicates. The lowest concentration was the MIC for the extracts with inhibited growth of test organisms48.
Antibiofilm assay
Screening biofilm formation ability of the test organisms (Tube method)
Clinical isolates (S. aureus, K. pneumoniae, and P. mirabilis) were tested via biofilm screening conducted using the tube method with minor modifications47. To do so, 10 µl loopful of overnight bacterial cultures were added to tubes containing 5 mL of Luria-Bertani (LB) Broth and incubated at 37±2˚C for 24–48 hours. After the incubation period, the tubes were washed off three times using sterile double-distilled water and dried prior to staining. The tubes were then stained with 0.1% (v/v) crystal violet and allowed to stand for 10 minutes. Subsequently, the tubes were washed off and the excess stain was removed, followed by drying at room temperature to observe biofilm formation. The stained was re-dissolved in 30% (v/v) glacial acetic acid and absorbance was measured at 492 nm using a SYSTRONICS PC-based double beam UV-VIS spectrophotometer-2202 with glacial acetic acid suspension.
Minimum Biofilm Inhibitory Concentration (MBIC) of initial cell attachment assay
The minimum inhibitory concentration of test plant extracts was estimated by ten-fold serial dilution in 96-well polystyrene plates. From fresh LB broth, 100 µl was pipetted to each well of a microtiter plate, and 50 µl of overnight cultured biofilm-forming isolates added. Positive control contained bacteria with the reference antibiotic, and negative control was bacteria without antibiotics prepared for each isolate for comparison. The plates were then sealed with a parafilm and kept for 24–48 hours incubation at 37±2˚C to check the potentiality of test plant extracts to inhibit initial cell attachment of biofilm-forming clinical isolates. The plates were washed and stained with 0.1% (v/v) crystal violet for 10 minutes, and the excess stain was removed with double distilled water and dried at room temperature. Absorbance was measured at 492nm using a BioEra Life science Microplate reader Model Nova. The percentage of biofilm inhibition was compared with untreated control.
Percentage biofilm inhibition was calculated using the following formula:
% biofilm inhibition = (OD of untreated control) – (OD of treated sample) X 100 / OD of untreated control
Preparation of extracts for UV-VIS spectroscopy analysis
Dried plant samples weighing 0.25g were soaked in 5mL different solvents (acetone, acetonitrile, chloroform, ethanol, ethyl acetate, methanol, and water)40, and were incubated in a shaker for 24 hours. The extracts were centrifuged at 3000 rpm for 10 minutes and filtered using Whatman filter paper No. 1 qualitative circle 125mm diameter. The filtrates were scanned ranging from 200–1100nm in a spectrophotometer29.
Statistical analysis
Experiments were conducted in duplicates, triplicates, and experimental data were presented as mean values ± SD. The concentration of IC50 that could inhibit 50% DPPH free radical was calculated using statistical Microsoft excel 2010. Using IBM SPSS Ver 20 Multivariate statistical analysis viz. Hierarchical cluster analysis (HCA) was performed. The relationship among different samples was presented as clades of a dendrogram which measured Squared Euclidean distance (clustered by the average linkage between groups)41.
The finely powdered sample of P. maculata was solvent extracted. The antioxidant activity, quantitative phytochemical analysis, and antibiofilm activity were determined using the solvent extracts. Preliminary compounds were identified using SYSTRONICS PC-based double beam UV-VIS spectrophotometer-2202.
The fresh and dry weight of different parts of P. maculata
The length of P. maculata leaves measured 15.5 cm in matured leaves with a surface area of 2.3 cm width; pseudobulb length measured 2.3 cm with green and purplish colour. It gave an aroma of locally prepared medicine. Table 2 lists the differences between the fresh and dry weights. For instance, fresh pseudobulb weighed about 200.59 grams, whereas 27.6 grams in dry weight. It indicates high water storage and mineral content in pseudobulb.
Table (2):
Fresh and dry weight of different parts of P. maculata (in grams).
Samples of P. maculata |
Fresh weight (in grams) |
Dry weight (in grams) |
|---|---|---|
Leaves |
150.50 |
55.9 |
Pseudobulb |
200.59 |
27.6 |
Stem |
26.55 |
13.4 |
Roots |
65.21 |
41.55 |
Antioxidant activity
Antioxidant activity using DPPH radical
The extracts of P. maculata were able to decolorize the deep purple color of DPPH radical to yellow color. This indicates the capability of extracts to scavenge and neutralize free radicals. Acetone and acetonitrile are suitable solvents for the extraction of antioxidant compounds present in P. maculata. The capability to neutralize DPPH harmful free radicals indicates extracts’ potentiality as an antioxidant source attributed to the presence of a high amount of polyphenols42. The standard ascorbic acid showed no significant difference between the extracts of P. maculata. The different solvent extracts of P. maculata can be a promising source of antioxidant compounds with the highest scavenging activity of about 89.583% observed in acetone extract of pseudobulb, 89.216 % in methanol extract of pseudobulb, 88.235% in acetone extract of leaves, 82.598% in reference ascorbic acid standard as presented in Fig. 2.
Solvents- A: Acetone; AN: acetonitrile; C: chloroform; E: ethanol; EA: ethyl acetate; M: methanol: W: water
AA: Ascorbic acid, Extracts – L: leaves; P: pseudobulb; S: stems; R: roots
Solvents- A: Acetone; AN: acetonitrile; C: chloroform; ETH: ethanol; EA: ethyl acetate; M: methanol: W: water
Fig. 2. A plot showing the percentage of DPPH radical scavenging activity of different (a) leave (b) pseudobulb (c)stem and (d) root extracts of P. maculata against Ascorbic acid standard.
The IC50 value calculated was found lowest in acetone extract of leaves (20.76±0.00 µg/mL), acetonitrile extract of the stem (22.30±0.00 µg/mL), acetone extract of pseudobulb (23.03±0.00 µg/mL) which is lower than ascorbic acid standard (30.80±0.01µg/mL). The lower the IC50 concentration value than the ascorbic acid standard, the higher the antioxidant activity of samples. The observed IC50 value of different extracts of P. maculata was lower in acetone extracts than other solvent extracts represented in Table 3.
Table (3):
IC50 of DPPH radical scavenging activity of Pleione maculata extracts.
| Plant extracts | IC50 (µg/mL) | ||||||
|---|---|---|---|---|---|---|---|
| Acetone | Acetonitrile | Chloroform | Ethanol | Ethyl acetate | Methanol | Water | |
| Leaves | 20.76 ± 0.00 | 30.37 ± 0.01 | 23.60 ± 0.00 | 34.86 ± 0.01 | 31.63 ± 0.00 | 25.86 ± 0.00 | 30.45 ± 0.00 |
| Pseudobulb | 23.03 ± 0.00 | 30.13 ± 0.00 | 25.47 ± 0.00 | 22.26 ± 0.00 | 31.07 ± 0.02 | 25.51 ± 0.00 | 29.32±0.00 |
| Stem | 23.9 ± 0.00 | 22.30 ± 0.00 | 34.16 ± 0.00 | 34.45 ± 0.00 | 33.36 ± 0.12 | 28.23 ± 0.00 | 24.34±0.00 |
| Root | 26.87 ± 0.00 | 24.82 ± 0.01 | 26.71 ± 0.01 | 24.22 ± 0.0 | 24.44 ± 0.11 | 27.48 ± 0.00 | 26.92±0.00 |
| Standard Ascorbic acid | 30.80 | ||||||
TAC was calculated using the linear equation obtained by plotting the absorbance value of standard ascorbic acid against the concentration. The equation was y = 0.0241x + 0.1176 with R2 = 0.9677 where ‘y’ is absorbance of extracts, and ‘x’ is Total Ascorbic acid equivalent (TAE) in mg per grams of extracts. Total antioxidant capacity was highest in ethanol, ethyl acetate, methanol, and acetone extracts of P. maculata (Table 4). The TAC of ethyl acetate extract of leaves was 193.98±0.1 mg of TAE/gram of extracts, 198.14±0.3 mg of TAE/grams of ethanol extract of leaves. The least antioxidant capacity was 2 mg of TAE/grams of water extracts of roots.
Table (4):
Total antioxidant capacity (TAC) of P. maculata by Phosphomolybdenum assay.
Plant extracts |
Leaves TAC (mg of TAE/ g of extracts) |
Pseudobulbs TAC (mg of TAE/ g of extracts) |
Stems TAC (mg of TAE/ g of extracts) |
Roots TAC (mg of TAE/ g of extracts) |
|---|---|---|---|---|
Acetone |
167.0 ± 0.5 |
129.68 ± 0.2 |
47.59 ± 0.1 |
74.56 ± 0.7 |
Acetonitrile |
62.27 ± 0.1 |
75.30 ± 0.1 |
52.89 ± 0.0 |
53.56 ± 0.1 |
Chloroform |
39.54 ± 0.1 |
114.05 ± 0.9 |
49.16 ± 0.3 |
69.49 ± 0.7 |
Ethanol |
193.14 ± 0.3 |
190.57 ± 0.3 |
184.76 ± 0.3 |
177.96 ± 0.1 |
Ethyl acetate |
193.98 ± 0.1 |
190.57 ± 0.2 |
184.85 ± 0.4 |
177.88 ± 0.3 |
Methanol |
165.68 ± 0.3 |
177.29 ± 0.5 |
161.94 ± 0.3 |
64.887 ± 0.0 |
Water |
142.94 ± 0.5 |
73.81 ± 0.2 |
109.60 ± 0.2 |
2.85 ± 0.0 |
TAE; Total ascorbic acid equivalent (mg of TAE/ g of extracts ± SD)
Quantitative phytochemical analysis
The concentration of phenolics in P. maculata extracts was expressed as gallic acid equivalent per gram of the extract using the gallic acid standard calibration curve. The equation obtained by plotting a graph with the absorbance value of gallic acid standard on the y-axis against concentration on the x-axis was y = 0.0096x + 0.0966 with the R2 = 0.9898.
Phytochemical screening was performed for the seven solvents extracts of P. maculata. The solvents were acetone, acetonitrile, chloroform, ethanol, ethyl acetate, methanol, and water. LEA showed the highest phenolic content with 552±0.0 mg of GAE/ grams of extracts listed in Table 5. PAN extracts yielded 509.375±0.0 mg of GAE/ grams of extracts. Total phenolic content was lowest in chloroform (SC) extracts of the stem with 25.48±0.0 mg of GAE/ grams of extracts. Chloroform may not be an ideal solvent choice for phenolic extraction of P. maculata. The concentration of flavonoids in various extracts of P. maculata was expressed as Quercitin equivalent per gram of the extracts using the quercetin calibration curve equation obtained by plotting a graph with absorbance value of the standard quercitin on the y-axis against concentration on the x-axis. The equation obtained was y = 0.0046x + 0.0819 with the R2 = 0.9733.
Table (5):
Total Phenolic content (TPC) of different parts of P. maculata by Folin Ciocalteau reagent.
Plant extracts |
Leaves TPC (mg of GAE/ g of extracts) |
Pseudobulbs TPC (mg of GAE/ g of extracts) |
Stems TPC (mg of GAE/ g of extracts) |
Roots TPC (mg of GAE/ g of extracts) |
|---|---|---|---|---|
Acetone |
429.166 ± 0.0 |
372.54 ± 0.0 |
336.11 ± 0.1 |
315.6 ± 0.0 |
Acetonitrile |
207.77 ± 0.0 |
509.375 ± 0.0 |
378.18 ± 0.0 |
203.59 ± 0.0 |
Chloroform |
149.8 ± 0.0 |
111.88 ± 0.2 |
25.48 ± 0.0 |
67 ± 0.0 |
Ethanol |
127.58 ± 0.1 |
272.2 ± 0.0 |
108.73 ± 0.0 |
111.94 ± 0.0 |
Ethyl acetate |
552 ± 0.0 |
228.45 ± 0.0 |
457 ± 0.0 |
282.61± 0.0 |
Methanol |
238.299 ± 0.0 |
351.49 ± 0.0 |
227.135 ± 0.0 |
166 ± 0.0 |
Water |
495 ± 0.0 |
288.67 ± 0.0 |
214.51 ± 0.0 |
66 ± 0.0 |
GAE; Gallic acid Equivalent (mg of GAE/g of extracts ± SD)
The total flavonoid content was highest in LA extracts with 879.5±0.2 mg of QE/ grams, and PAN showed 845.2±0.2 mg of QE/ grams as listed in Table 6. Total flavonoid content was the least in SW extracts with 20.40±0.0 mg of QE/ grams of extracts. Leaves and pseudobulb of P. maculata showed better results for antioxidant capacity, phenolics, and flavonoid content.
Table (6):
Total flavonoid Content (TFC) of different parts of P. maculata by Aluminium Chloride method.
Plant extracts |
Leaves TFC (mg of QE/ g of extracts) |
Pseudobulbs TFC (mg of QE/ g of extracts) |
Stems TFC (mg of QE/ g of extracts) |
Roots TFC (mg of QE/ g of extracts) |
|---|---|---|---|---|
Acetone |
879.5 ± 0.2 |
548.56 ± 0.0 |
552.62 ± 0.1 |
547.72 ± 0.4 |
Acetonitrile |
516.014 ± 0.3 |
845.2 ± 0.2 |
676.08 ± 0.0 |
224.40 ± 0.1 |
Chloroform |
234 ± 0.1 |
293.78 ± 0.0 |
246.44 ± 0.1 |
154 ± 0.0 |
Ethanol |
159.03 ± 0.1 |
218.53 ± 0.0 |
84 ± 0.0 |
97.58 ± 0.1 |
Ethyl acetate |
179.30 ± 0.0 |
104.25 ± 0.0 |
406.98 ± 0.1 |
75.33 ± 0.0 |
Methanol |
263.109 ± 0.2 |
270.671 ± 0.1 |
152.78 ± 0.0 |
153.31 ± 0.1 |
Water |
127.68 ± 0.0 |
277.31 ± 0.0 |
20.40 ± 0.0 |
175.90 ± 0.0 |
QE; quercitin equivalent (mg of QE/g of extracts ± SD)
Effect of Pleione maculata against clinical isolates
P. maculata extracts were effective against all three clinical isolates. Table 7 presents the effective zone of inhibition, and Table 8 presents the MIC value of all the tested extracts. The acetone and ethyl acetate extracts of pseudobulb showed the highest diameter of inhibition (16±0.00mm) against S. aureus with a MIC value of 0.875 mg/mL for PA. Acetonitrile extracts of leaves and stem, and ethyl acetate extract of pseudobulb showed inhibition of 12±1.00 mm against K. pneumoniae with MIC value of 1.375 mg/mL for LAN, 0.6875 mg/mL for SAN and, 3 mg/mL for PEA. The acetonitrile extracts of pseudobulb showed a zone of inhibition (ZOI) of about 15.33±0.33 mm with a MIC value of 1 mg/mL against P. mirabilis. Amoxicillin, a reference antibiotic, showed a ZOI of 11.33±0.00 mm against S. aureus and a ZOI of 10.66±0.00 mm against P. mirabilis with a MIC value of 1mg/mL. Amoxicillin did not inhibit K. pneumoniae. Inhibition by amoxicillin was less effective as compared to acetone pseudobulb extract of P. maculata.
Table (7):
Antibacterial screening of different parts of P. maculata against some clinical isolates.
| Solvents | Parts of P. maculata used | Zone of inhibition (in mm ± SD) | ||
|---|---|---|---|---|
| Staphylococcus aureus | Klebsiella pneumoniae | Proteus mirabilis | ||
|
Acetone
|
Leaves | N | N | 7.98 ± 0.9 |
| Pseudobulb | 16 ± 0.0 | 10 ± 0.00 | 10.33 ± 0.4 | |
| Stem | N | N | 7.75 ± 1.7 | |
| Root | N | N | 8.655 ± 0.4 | |
| Acetonitrile | Leaves | N | 12 ± 0.00 | 9.665 ± 0.9 |
| Pseudobulb | 12 ± 1 | 11 ± 1.4 | 15.33 ± 0.4 | |
| Stem | N | 12 ± 1.4 | 10.33 ± 1.8 | |
| Root | N | N | 8.5 ± 0.7 | |
| Chloroform
|
Leaves | N | N | N |
| Pseudobulb | 10 ± 2 | 9 ± 1.4 | 9.2 ± 1.1 | |
| Stem | N | N | N | |
| Root | N | N | N | |
| Ethanol
|
Leaves | N | N | N |
| Pseudobulb | N | N | N | |
| Stem | N | N | N | |
| Root | N | N | N | |
| Ethyl acetate
|
Leave | N | 8 ± 1.4 | N |
| Pseudobulb | 16 ± 0.5 | 12 ± 2.8 | N | |
| Stem | N | 10.5 ± 0.7 | N | |
| Root | N | 10.5 ± 0.7 | N | |
| Methanol
|
Leaves | N | 10 ± 0.00 | 8.1 ± 1.2 |
| Pseudobulb | N | 11 ± 0.00 | 11.1 ± 0.8 | |
| Stem | N | 10.5 ± 0.70 | N | |
| Root | N | 10.50 ± 0.70 | N | |
| Water | Leaves | N | N | N |
| Pseudobulb | N | N | N | |
| Stem | N | N | N | |
| Root | N | N | N | |
| Amoxicillin (1mg/mL) | 11.33 ± 0.00mm | No Inhibition | 10.66±0.00mm (turbid) | |
N: No inhibition
Screening of biofilm formation on the selected clinical isolates
The clinical isolates screened for biofilm formation were observed to be positive for the three isolates. Gram-positive bacteria S. aureus showed a slightly stained film on the end walls of the test tubes, gram-negative bacteria K. pneumoniae formed a very thick stained film on the sides of the test tubes, and gram-negative bacteria P. mirabilis formed a moderately stained film on the end walls of the tubes.
Table (8):
MIC value of the effective extracts of P. maculata against the clinical isolates.
| Pleione maculata extracts | Conc. of extracts showing minimum inhibition against the microbes (mg/mL) | ||
|---|---|---|---|
| S. aureus | K. pneumoniae | P. mirabilis | |
| LA | N | 1.375 | 2.75 |
| PA | 0.875 | 0.875 | 0.875 |
| SA | N | N | 3±0.0 |
| RA | N | N | 2.60 |
| LAN | N | 1.875 | 1.875 |
| PAN | 1 | 2 | 1 |
| SAN | N | 0.6875 | 0.6875 |
| RAN | N | N | 2.75 |
| LC | N | N | N |
| PC | 2.25 | 4.5 | N |
| SC | N | N | N |
| RC | N | N | N |
| LE | N | N | N |
| PE | N | N | N |
| SE | N | N | N |
| RE | N | N | N |
| LEA | N | 0.78 | 1.56 |
| PEA | 1.5 | 3 | 3 |
| SEA | N | 1.75 | 1.75 |
| REA | N | 3.25 | 3.25 |
| LM | N | N | N |
| PM | N | N | N |
| SM | N | N | N |
| RM | N | 6.1875 | 6.1875 |
| LW | N | N | N |
| PW | N | N | N |
| SW | N | N | N |
| RW | N | N | N |
Sample = Leave(L), Pseudobulb(P), Stem(S), Root(R), solvent = acetone(A), acetonitrile(AN), chloroform(C), ethanol(E), ethyl acetate(EA), methanol(M), water(W), antibiotic = AMX(Amoxicillin), N= Negative
Effect of P. maculata on the inhibition of initial biofilm attachment
The Minimum Biofilm Inhibition Concentration (MBIC) for all extracts is presented in Table 9. Among Pleione maculata extracts, the pseudobulb acetonitrile extract of P. maculata exhibited the highest inhibitory activity against initial cell attachment of clinical isolates at its highest dilution, 10−5, with 87% inhibition of S. aureus cell attachment and the lowest MBIC at 0.25mg/mL. At a 10−6 dilution water extract of root and leaves, pseudobulb acetonitrile extracts inhibited 97%, 90%, and 87% attachment of K. pneumoniae with MBIC values of 0.093, 0.117, and 0.125 mg/mL, respectively. Water extract of leaves, acetone extract of leaves, water root extracts, ethyl acetate leaf extracts, and pseudobulb acetonitrile extracts inhibited 100%, 91%, 89%, 87%, and 86% attachment of P. mirabilis at the lowest dilution, 10−6, with MBIC values of 0.117, 0.171, 0.090, 0.097, and 0.125 mg/mL, respectively. These results indicate that P. maculata is as effective as many known medicinal plants and antimicrobial agents.
Table (9):
Minimum Biofilm Inhibitory Concentration (MBIC) of Pleione maculata based on highest dilution to show inhibition against tested clinical isolates.
| Solvents | Parts ofP. maculata used | Minimum biofilm inhibitory concentration (MBIC) of P. maculata extracts with highest dilution factor showing good inhibitory percentage against attachment of biofilm forming microbes to glass surfaces | ||||||||
|---|---|---|---|---|---|---|---|---|---|---|
| Staphylococcus aureus | Klebsiella pneumoniae | Proteus mirabilis | ||||||||
| dilution | Concentration (mg/mL) | dilution | Concentration (mg/mL) | dilution | Concentration (mg/mL) | |||||
| Acetone | L | 10-5 | 0.344 | 10-6 | 0.171 | 10-6 | 0.171 | |||
| P | 10-3 | 1.218 | 10-6 | 0.152 | 10-6 | 0.152 | ||||
| S | 10-2 | 3 | 10-2 | 3 | 10-6 | 0.187 | ||||
| R | 10-1 | 5.25 | 10-2 | 2.625 | 10-6 | 0.164 | ||||
| Acetonitrile | L | 10-4 | 0.93 | 10-6 | 0.234 | 10-6 | 0.234 | |||
| P | 10-5 | 0.25 | 10-6 | 0.125 | 10-6 | 0.125 | ||||
| S | 10-5 | 0.171 | 10-6 | 0.085 | 10-6 | 0.085 | ||||
| R | 10-3 | 1.375 | 10-6 | 0.171 | 10-6 | 0.171 | ||||
| Chloroform | L | 10-2 | 3.375 | 10-6 | 0.21 | 10-6 | 0.210 | |||
| P | 10-2 | 4.625 | 10-6 | 0.289 | 10-6 | 0.289 | ||||
| S | N | N | 10-6 | 0.269 | 10-6 | 0.269 | ||||
| R | N | N | 10-6 | 0.187 | 10-6 | 0.187 | ||||
| Ethanol | L | N | N | 10-6 | 0.546 | 10-6 | 0.546 | |||
| P | N | N | 10-2 | 5 | 10-5 | 0.625 | ||||
| S | N | N | 10-6 | 0.68 | 10-6 | 0.683 | ||||
| R | 10-2 | 7.44 | 10-3 | 3.718 | 10-6 | 0.464 | ||||
| Ethyl acetate | L | N | N | 10-6 | 0.097 | 10-6 | 0.097 | |||
| P | N | N | 10-2 | 3 | 10-6 | 0.187 | ||||
| S | N | N | 10-6 | 0.109 | 10-6 | 0.109 | ||||
| R | N | N | 10-6 | 0.20 | 10-6 | 0.203 | ||||
| Methanol | L | N | N | 10-6 | 0.386 | 10-6 | 0.386 | |||
| P | N | N | 10-6 | 0.2617 | 10-6 | 0.261 | ||||
| S | N | N | 10-6 | 0.304 | 10-6 | 0.304 | ||||
| R | N | N | 10-6 | 0.386 | 10-6 | 0.386 | ||||
| Water | L | 10-2 | 1.875 | 106 | 0.117 | 10-6 | 0.117 | |||
| P | N | N | 10-6 | 0.125 | 10-6 | 0.125 | ||||
| S | 10-1 | 7.75 | 10-6 | 0.242 | 10-6 | 0.242 | ||||
| R | 10-1 | 3 | 10-6 | 0.093 | 10-6 | 0.09 | ||||
| AMX (control) | 10-1 | 1 | 10-1 | 1 | 10-1 | 1 | ||||
Sample = Leaves (L), Pseudobulb (P), Stem (S), Root (R), antibiotic = AMX (Amoxicillin), N= Negative
UV-VIS spectrophotometer
The results of UV-VIS spectrogram of seven solvents (acetone, acetonitrile, chloroform, ethanol, ethyl acetate, methanol, and water) extracts of P. maculata exhibited absorption band ranging from 204- 665 nm, as shown in Fig. 3. The UV-VIS spectrogram results of P. maculata extracts indicate phenolic compounds such as flavonoids, terpenoids, and tannins in the plant extracts. The absorption band ranging from 204–665 nm is a characteristic feature of flavonoids and their derivatives44,35. The absorption of flavonoids ranges from 230–285 (Band I) and 300–350 (Band II)45,35. There are two absorption bands of flavonoid and terpenoids that range from 230–290 nm (Band I) and range from 400–550 nm (Band II), whereas the range between 600–700 nm represents the absorption of chlorophyll44.

Fig. 3. UV-VIS spectrogram peaks of different extracts {(a) acetone (b) acetonitrile (c) chloroform (d) ethanol (e) ethyl acetate (f) methanol and (g) water} of P. maculata
Hierarchical cluster analysis (HCA)
HCA between DPPH and Total antioxidant capacity
Hierarchical Cluster Analysis (HCA) is a multivariate analysis that identifies natural clusters without prior knowledge about the data to provide useful information such as the graphical representation of the resulting partitions in the form of a hierarchy or dendrogram revealing more information50. HCA was performed to determine the similarity or dissimilarity of clusters between various extracts of P. maculata to determine the robustness of the analysis. The horizontal axis of a dendrogram indicates the distance or dissimilarity between clusters whereas the vertical axis represents object clusters. In the HCA dendrogram, six individual clusters were grouped as shown in Fig. 4. to form two grand clusters based on two different methods used for the experiments. In Fig. 4. (i)(a), the rows of leaves of DPPH and pseudobulb DPPH are remarkably similar and have low dissimilarity as they are closely clustered at a rescaled distance of 1 unit from each other as compared to the stem DPPH, which also shows some minute similarities at a rescaled distance of 14 units. The root DPPH shows a completely different clade from the leaves DPPH, pseudobulb DPPH, and stem DPPH. In Fig. 4 (i)(b), the rows of leaves TAC and pseudobulb TAC have low dissimilarity as they are closely clustered at a rescaled distance of 2 units from each other and from stem TAC, which also shows some minute dissimilarity at a rescaled distance of 1 unit. The root TAC shows a completely different clade from the leaves TAC, pseudobulb TAC, and stem TAC.
Fig. 4. Hierarchical cluster analysis between (i) DPPH Scavenging activity and TAC, and (ii) TFC and TPC
HCA between TFC and TPC
Fig. 4 illustrates two grand clusters based on two different methods used for the experiments. Six individual clusters were grouped together. In Fig. 4 (ii) (a), the rows of stem TFC and root TFC are very similar as they are closely clustered at a rescaled distance of 1 unit as compared to the pseudobulb TFC, which also shows similarities at a rescaled distance of 3 units. The leaves TFC shows a completely different clade with few similarities in the pseudobulb, stem and root TFC at a rescaled distance of 3 units. In Fig. 4 (ii) (b), the rows of leaves TPC and pseudobulb TPC have low dissimilarity as they are clustered at a rescaled distance of 2 units from each other and from stem TPC, which also shows some minute dissimilarity at a rescaled distance of 3 units. The root TPC shows a completely different clade from leaves TPC, pseudobulb TPC, and stem TPC at a rescaled distance of 6 units.
HCA of antibiofilm activity
Fig. 5 illustrates the extracts cluster based on similarities in the presence of antibiofilm activity in a series of dilution factors. In Fig. 5 (a), there are five grand clusters of extracts: RW, AMX, and SW form a single cluster with a similar dilution factor 10−1 at a rescaled distance of 1 unit, PAN and SAN form one cluster with a similar dilution factor 10−5 at a rescaled distance of 1 unit, and LAN forms one grand cluster with a dilution factor 10−4, which indicates large differences with other extracts at a rescaled distance of 23 units. In Fig. 5 (b), the HCAs of various extracts against K. pneumoniae form two grand clusters. Each grand cluster is further divided into two grand clades based on the similarities in their dilution factors. Extracts LM, PM, LA, PA, and SETH fall under the same clade, which indicates similarities in the presence of antibiofilm activity with the same dilution factor 10−6 at a rescaled distance of 1 unit. LETH extracts fall under one sub-clade alone because of their dissimilarity with other extracts at a rescaled distance of 17 units. In Fig. 5 (c), the HCAs of extracts against P. mirabilis reveal two grand clusters representing two grand clades, with four sub-clades. Extracts PW, SW, and RW are remarkably similar as they belong to the same leaf in a sub-clade with a dilution factor of 10−6 whereas extract PETH exhibits a single separate grand cluster, which indicates high dissimilarity with other extracts at a rescaled distance of 25 units.
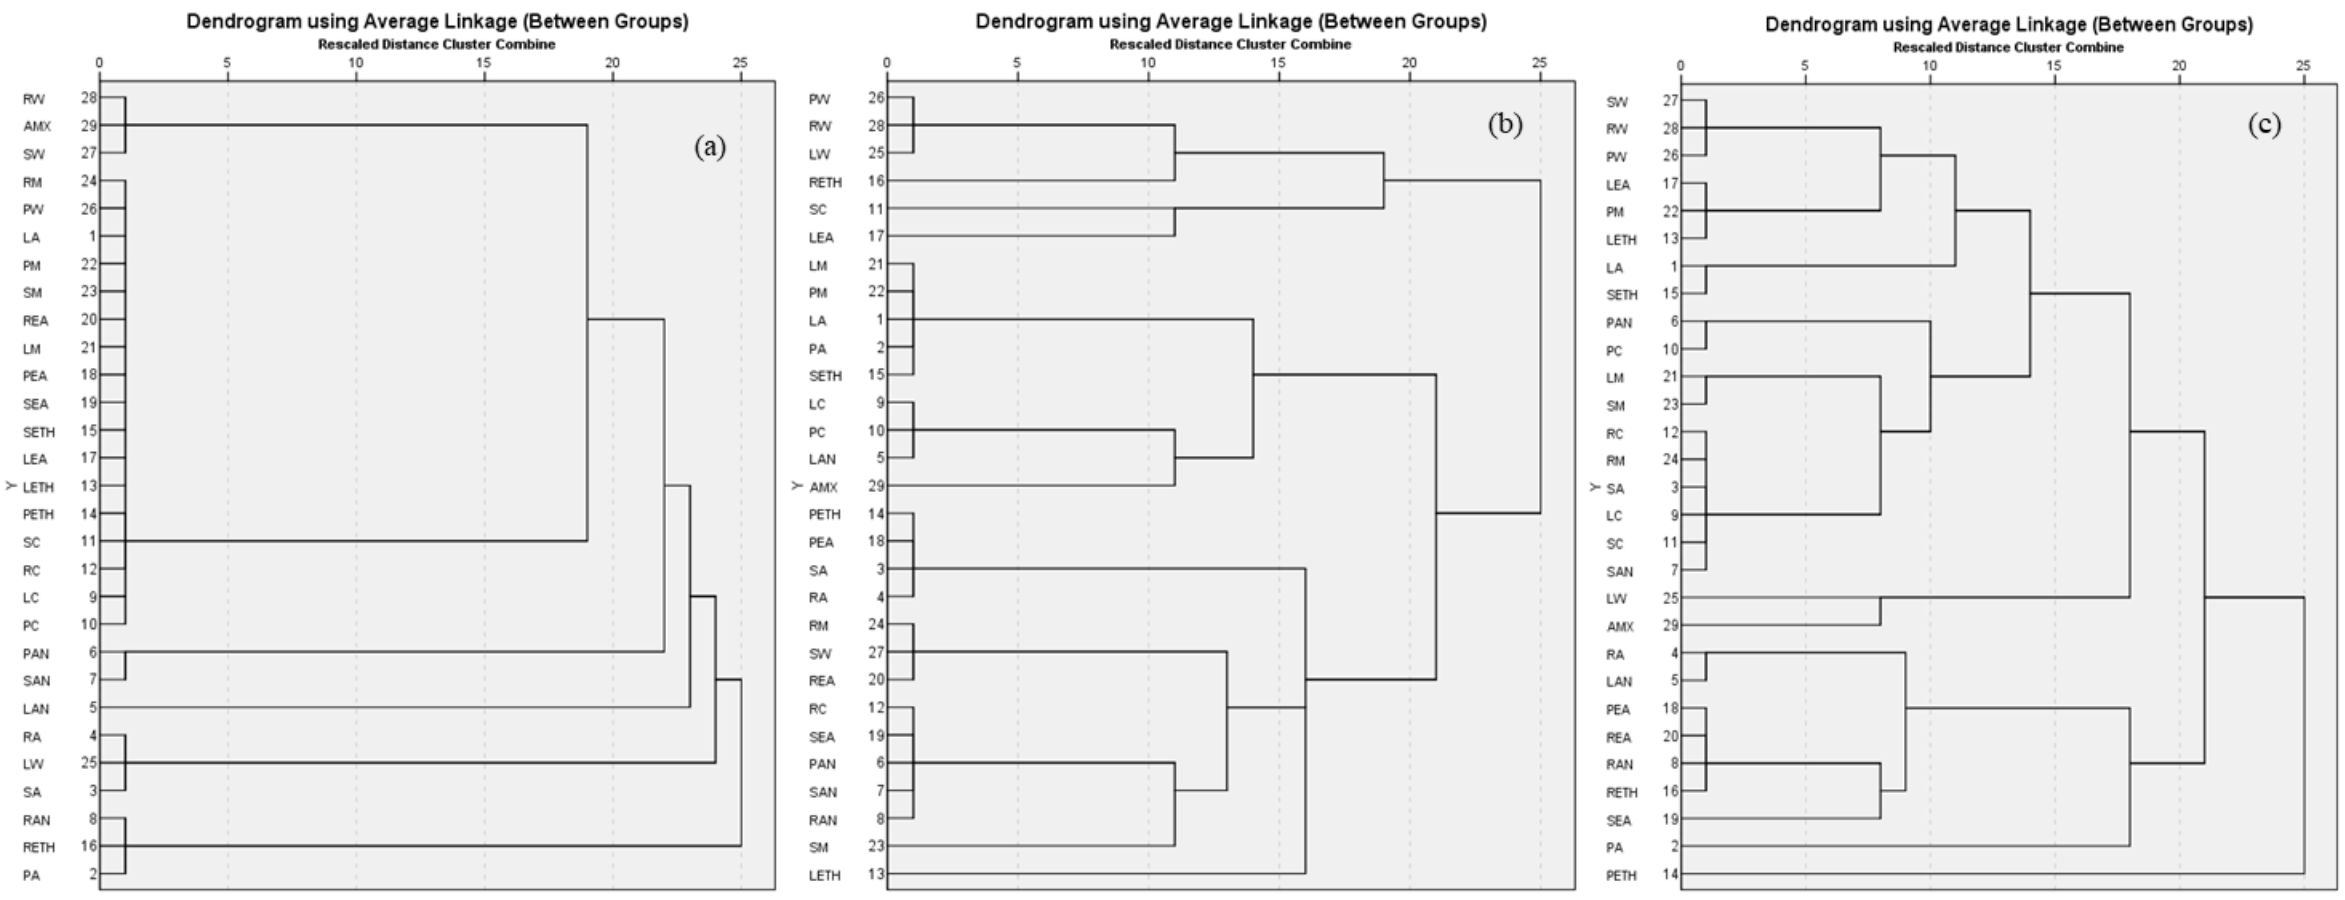
Fig. 5. Hierarchical cluster analysis of antibiofilm activity between different extracts of P. maculata against (a) S. aureus (b) K. pneumoniae and (c) P. mirabilis.
Preliminary qualitative phytochemicals were earlier reported in P. maculata collected from Meghalaya, which showed the presence of secondary metabolites such as terpenoid, phenol, tannin, saponin, coumarin, and cardiac glycosides in the leaves, pseudobulb, and seeds51. In vitro pseudobulb explants regeneration was conducted for the conservation of the rare and therapeutically important P. maculata5. P. maculata collected from Arunachal Pradesh also reported the presence of phytochemicals such as flavonoids, steroids, cardiac glycosides, and alkaloids52. The bioactivity of P. maculata was compared mainly with the closely related genus Coelogyne and its various species. A species of Coelogyne stricta exhibited 93% antibiofilm activity53. The aqueous leaf extracts of Coelogyne nervosa yielded the best DPPH radical scavenging activity, with IC50 values of 126 µg/mL and 206 µg/mL for ethanol leaves and 312 µg/mL for ethyl acetate leaf extracts54. The ethyl acetate extracts of Coelogyne stricta exhibited a good DPPH scavenging activity with an IC50 value of 47.0 µg/mL. The IC50 values of methanol and water extracts were 72 µg/mL and 112 µg/mL, respectively 54. Antioxidant activity was also reported in extracts of Coelogyne breviscapa, with an IC50 value of 71.91 µg/mL55. The total phenolic content (TPC) of Coelogyne brevis was 0.081 mg/mL43 and that of Coelogyne stricta was estimated to be a maximum of 0.090 mg/gram of dry extract53. In Moin et al., 2012, ethyl acetate extracts of Coelogyne stricta had the highest phenolic content of 90 µg GAE/mg of the sample and 39.20 µg GAE/mg in methanol extracts. The total flavonoid content was higher in ethyl acetate at 37.25 µg QE/mg of sample55. They also reported the TPC of Coelogyne breviscapa, which yielded 25.00 mg of GAE/gram of extracts. Coelogyne brevis TFC was observed to be less than 0.0625 mg/mL43. Coelogyne stricta reported a TFC of about 0.037mg/gram of dry extract53.
At present, several microbes that cause severe diseases affecting people around the globe have become strongly resistant to prescribed antibiotics, so new antibiotics need to be discovered to combat them effectively. Pleione maculata, an epiphytic rare medicinal orchid containing numerous effective secondary metabolites, was evaluated to gauge its antimicrobial and antibiofilm activity51. The ethanolic pseudobulb extract of Coelogyne speciosa exhibited strong antibacterial activity against S. aureus (ZOI was 19 mm) and methanolic pseudobulb extracts (ZOI was 8 mm), whereas ethyl acetate extracts showed no bacterial inhibition56. The extracts of Coelogyne stricta showed no antibacterial activity against S. aureus. The ethanolic extracts of Coelogyne brachyptera showed good antibacterial activity with a ZOI of 20 mm against gram-positive S. aureus56. It has also exhibited antibacterial activity against S. aureus with a strong ZOI of 17±0.6 mm52. Coelogyne stricta exhibited antibacterial activity at a ZOI of 8 mm against K. pneumoniae and 14 mm against S. aureus, whereas Coelogyne cristata showed an inhibition of about 12 mm against S. aureus while its MIC was 31.25 mg/mL 34. P. maculata extracts also showed a good ZOI ranging from 7.75–16 mm in diameter and a very low MIC value ranging from 0.875–14.875 mg/mL. This result indicates that Pleione maculata is as effective as many other medicinal plants and antimicrobial agents. P. maculata and its closely related genus Coelogyne have not been the subjects of existing antibiofilm research reports.
Oxidative stress causes imbalances of oxygen species in the body. It results in health problems such as cancer, cardiovascular disease, neurological disorders, liver malfunction, and other complications caused by DNA damage. Coelogyne and its related genus, Pleione, have previously been studied for their antioxidant and antibacterial properties. However, there were no antibiofilm investigations reported thus far. Pleione and its members, on the other hand, remain an unknown orchid genus. There is a lack of documentation of its antibiofilm efficacy and quantifiable TPC, TFC, or antioxidant activity. As a result, this study aimed to determine the bioactivity of Pleione maculata. P. maculata has potent antioxidant and antibiofilm properties attributed to secondary metabolites such as phenolics and flavonoids. Antibiotic-resistant pathogens forming biofilms are a global concern. Primarily due to the treatment failures for infectious diseases. Pleione maculata exhibits antibacterial and antibiofilm action against Staphylococcus aureus, Klebsiella pneumoniae, and Proteus mirabilis. Future research can focus on developing unique and broad-spectrum antimicrobial compounds. Further studies are required to understand how the extracts work. This study demonstrates the therapeutic potential of Pleione maculata. It establishes the importance of this epiphyte in pharmaceutical and nutraceutical companies. Besides, creating awareness for preventing its extinction and overexploitation.
Additional file: Additional Figures and Tables.
ACKNOWLEDGMENTS
The authors acknowledge the contribution of Assam Don Bosco University, Tapesia, Assam for the facilities provided for conducting the above research work. The authors sincerely acknowledged the Ministry of Tribal affairs/Scholarship division for the funding support.
CONFLICT OF INTEREST
The authors declare that there is no conflict of interest.
AUTHORS’ CONTRIBUTION
All authors listed have made a substantial, direct and intellectual contribution to the work, and approved it for publication.
FUNDING
This work was supported by the Ministry of Tribal Affairs/ National Fellowship for Higher Education for ST, Government of India. (Grant Number: 201819-NFST-MEG-00850)
ETHICS STATEMENT
This article does not contain any studies with human participants or animals performed by any of the authors.
AVAILABILITY OF DATA
All datasets generated or analyzed during this study are included in the manuscript and in the supplementary file.
- Pant B. Medicinal orchids and their uses: Tissue culture a potential alternative for conservation. Afr J Plant Sci. 2013;7(10):448-467.
Crossref - De LC, Medhi RP. Orchid- A diversified component of farming systems for profitability and livelihood security of small and marginal farmers. J Global Biosci. 2015;4(2):1393 -1406.
- Kumar R, Deka BC, Roy AR. Evaluation of orchid species under Sub-Tropical Mid-hills of Meghalaya. Hort Flora Res Spectrum. 2012;1(1):24-28.
- Rao Nageswara A. Orchid flora of Arunachal Pradesh- An update. Bulletin Arunachal For Res. 2010;26(2):82-110.
- Chauhan S, Sharma S. Conservation of rare and threatened therapeutically important orchid Pleione maculata (Lindl.) Lindl. & Paxton through Pseudobulb culture in vitro. Ind J Sci Res. 2017;15:22-26.
- Jalal JS. Status, threats and conservation strategies for orchids of western Himalaya, India. J Threatened Taxa. 2012;4(15):3401-3409.
Crossref - Zhu G. Humiles, a new section of Pleione (Orchidaceae). Missouri Botanic Garden. 1998(4):461-463.
Crossref - Yonzone R, Lama D, Bhujei RB, Rai S. Orchid species diversity of Darjeeling Himalaya of India. Int J Pharm Life Sci. 2012;3(3):1533-1550.
- Vaidya B, Shrestha M, Joshee N. Report on Nepalese orchid species with medicinal properties. Proceedings of Nepal-Japan Joint Symposium. 2000;146-152.
- Tsering J, Tam N, Tag H, Gogoi BJ, Apang O. Medicinal orchids of Arunachal Pradesh: A review. Bulletin of Arunachal For Res. 2017;32(1&2):1-16.
- Agrawala DK, Singh P. Legislations for orchid conservation in India and development of National Red List as per IUCN criteria. J Orchid So Ind. 2013;27(1-2):27-35.
- Aliyu AB, Ibrahim H, Ibrahim MA, et al. Free radical scavenging and total antioxidant capacity of methanol extracts of Ethuliaconyzoides growing in Nigeria. Roma Biotech Let. 2012;17(4):7458-7465.
- Aliyu AB, Ibrahim MA, Musa AM, Musa AO, Musa Kiplimo JJ, Oyewale AO. Free radical scavenging and total antioxidant capacity of root extracts of Anchomanes difformis Engl. (Araceae). Acta Poloniae Pharmaceu- Drug res. 2013;70(1):115-121.
- Maswada FH. Assessment of total antioxidant capacity and antiradical scavenging activity of three Egyptian wild plants. J med Sci. 2013;13(7):546-554.
Crossref - Olugbami OJ, Gbadegesin MA, Odunola OA. In-vitro free radical scavenging and antioxidant properties of ethanol extract of Terminalia glaucescens. Pharmacog Res. 2015;7(1):49-56.
Crossref - Johnson RL. Microcolony and biofilm formation as a survival strategy for bacteria. J Theoretical Bio. 2008;251:24-34.
Crossref - Ojha AK, Baughn AD, Sambandan D, et al. Growth of Mycobacterium tuberculosis biofilms containing free mycolic acids and harbouring drug-tolerant bacteria. Mol Microbio. 2008;69(1):164-174.
Crossref - Donlan MR. Biofilms: Microbial Life on surfaces, Emerging Infectious diseases. Centers for Disease Control and Prevention, Atlanta, Georgia, USA. 2002;8(9):881-890.
Crossref - Gupta P, Sarkar S, Das B, Bhattacharjee S, Tribedi P. Biofilm, pathogenesis and prevention- a journey to break the wall: a review. Arch Microbio. 2016;198:1-15.
Crossref - Kaplan JB. Biofilm dispersal: Mechanism, clinical implications, and potential therapeutic uses. J Dent Res. 2010;89(3):205-218.
Crossref - Oldak E, Trafny EA. Secretion of proteases by Pseudomonas aeruginosa biofilms exposed to cipeofloxacin. Antimicro Agents Chemother. 2005;49(8):3281-3288.
Crossref - Hall-Stoodley L, Stoodley P. Evolving concepts in biofilm infections. Cell Microbiol. 2009;11(7):1034-1043.
Crossref - Joo HS, Otto M. Molecular basis of in vivo biofilm formation by bacterial pathogens. Chem Biol. 2012;19(12):1503-1513.
Crossref - Bjarnsholt T, Alhede M, Alhede M. et al. The in vivo biofilm. Trends in Microbiology. 2013;21(9):466-474.
Crossref - Bogaert D, De Groot R, Hermans PW. Streptococcus pneumoniae colonization: the key to pneumococcal disease. Lancet Infect Dis. 2004;4(3):144-154.
Crossref - Jamal M, Tasneem U, Hussain T, Andleeb S. Bacterial biofilm: its composition, formation and role in human infections. Research and reviews. J Microbio Biotech. 2015;4(3):1-14.
- El- Bashiti TA, Masad AA, Mosleh FN, Abu Madi YM. Antibacterial and antibiofilm activity of selected plant extracts against some human pathogenic microorganisms. Pakistan J Nutri. 2019;18(11):1014-1020.
Crossref - Tumbarello M, Trecarichi EM, Fiori B, et al. Multidrug-resistant Proteus mirabilis bloodstream infections: Risk factors and Outcomes. Amer Socie Microbio. 2012;56(6):3224-3231.
Crossref - Kalaichelvi K, Dhivya SM. Screening of Phytoconstituents, UV-VIS Spectrum and FT-IR analysis of Micrococca mercurialis (L.) Benth. Int J Herb Med. 2017;5(6):40-44.
- Do QD, Angkawijaya EA, Tran-Nguyen LP, et al. Effect of extraction solvent on total phenol content, total flavonoid content, and antioxidant activity of Limnophila aromatic. J Food Drg Anal. 2014;22(3):296-302.
Crossref - Rabeta MS, Nur FR. Total phenolic content and ferric reducing antioxidant power of the leaves and fruits of Garcinia atrovirdis Cynometra cauliflora. Int Food Res J. 2013;20(4):1691-1696.
- Nkafamiya II, Maina HM, Osemeahon SA, Modibbo UU. Percentage oil yield and physiochemical properties of different groundnut species (Arachis hypogea). Afri J Food Sci. 2010;4(7):418-421.
- Mostafa AA, Al-Askar AA, Almaary SK, Dawoud MT, Sholkamy NE, Bakri MM. Antimicrobial activity of some plant extracts against bacterial strains causing food poisoning diseases. Saud J Biol Sci. 2018;25(2):361-366.
Crossref - Marasini R, Joshi S. Antibacterial and Antifungal activity of medicinal orchids growing in Nepal. J Nep Chem Socie. 2013;29:104-109.
- Singariya P, Mourya KK, Kumar P. Identification of antibacterial efficacy of flavonoids of Anaegissus rotundifolia against some pathogens. Int J Pharma Biol Arch. 2018;9(1):142-152. https://www.researchgate.net/publication/327792902
- Brand-Williams W, Cuvelier ME, Berset C. Use of a free radical method to evaluate antioxidant activity. LWT- Food Sci Techn. 1995;28(1):25-30.
Crossref - Prieto P, Pineda M, Aguilar M. Spectrophotometric quantification of antioxidant capacity through the formation of a Phosphomolybdenum complex: specific application to the determination of Vitamin E. Anal Biochem. 1999;269(2):337-341.
Crossref - Gurnani N, Gupta M, Mehta D, Mehta BK. Chemical composition, total phenolic and flavonoid contents, and in vitro antimicrobial and antioxidant activities of crude extracts from red chilli seeds (Capsicum frutescens L.). J Taibah Univ Sci. 2016;10(4):462-470.
Crossref - Cindric IJ, Kunstic M, Zeiner M, Stingeder G, Rusak G. Sample preparation methods for the determination of the antioxidative capacity of apple juice. Croa Chem Acta. 2011;84(3):435-438.
Crossref - Nguyen HC, Lin F, Huang M, et al. Antioxidant activities of the methanol extracts of various parts of Phalaenopsis Orchids with white, yellow and purple flowers. Notulae Botani Horti Agrobotan Cluj-Napoca. 2018;46(2): 457-465.
Crossref - Sen S, Talukdar NC, Khan M. A simple metabolite profiling approach reveals critical biomolecular linkages in fragrant agarwood oil production from Aquilaria malaccensis- a traditional agro-based industry in North East India. Current Sci. 2015;108(1):63-71.
- Tsao R. Chemistry and Biochemistry of Dietary Polyphenols. Nutri. 2010;2(12):1231-1246.
Crossref - Praveen S, Ramesh CK, Mahmood R, Pallavi M. Folklore medicinal orchids from South India: The potential source of antioxidants. Asian J Pharma Cli Res. 2018;11(6):194-198.
Crossref - Renuka B, Sanjeev B, Ranganathan D. Evaluation of Phytoconstituents of Caralluma nilagiriana by FTIR and UV0VIS spectroscopic analysis. J Pharm Phytochem. 2016;5(2):105-108.
- Rajeshkumar R, Jeyaprakash K. Screening of UV-VIS, TLC and FTIR spectroscopic studies on selected red seaweed (Acanthophora specifera) collected from Gulf of Mannar, Tamil nadu, India. World J Pharm Sci. 2016;4(10):28-33.
- Paul P, Chowdhury A, Nath D, Bhattacharjee MK. Antimicrobial efficacy of orchid extracts as potential inhibitors of antibiotic resistant strains of Escherichia coli. Asian J Pharm Cli Res. 2013;6(3):108-111.
- Onsare JG, Arora DS. Antibiofilm potential of flavonoids extracted from Moringa oleifera seed coat against Staphylococcus aureus, Pseudomonas aeruginosa and Candida albicans. J App Microbio. 2015;118:313-325.
Crossref - Sarkar SD, Nahar L, Kumarasamy Y. Microtitre plate-based antibacterial assay incorporating resazurin as an indicator of cell growth, and its application in the in vitro antibacterial screening of phytochemicals. Methods. 2007;42(4):321-324.
Crossref - Askarinia M, Ganji A, Jadidi-Niaragh F, et al. A review on medicinal plant extracts and their active ingredients against methicillin-resistant sensitive Staphylococcus aureus. J Herbmed Pharm. 2019;8(3):173- 184.
Crossref - Sousa L, Gama J. The application of Hierarchical clustering algorithms for recognition using Biometrics of the hand. Int J Adv Eng Res Sci. 2014;1(7):14-24.
- Sympli HD, Paul S, Borah VV, Choudhury MG. Phytochemical and antibacterial activity of an endangered orchid Pleione maculata (Orchidaceae) of Meghalaya. Int J Res Anal Rev. 2019;6(2):221-232.
Crossref - Bhatnagar M, Ghosal S. Antibacterial and antimycobacterial activity of medicinal orchid of Arunachal Pradesh. Int J Pharm Sci Res. 2018;9:712-717.
Crossref - Moin S, Shibu SB, Wesley SP, Devi CB. Bioactive potential of Coelogyne stricta (D. Don) Schltr: An ornamental and medicinally important orchid. J Pharm Res. 2012;5(4):2191-2196.
- Shibu BS, Devi BC, Moin S, Wesley S. Evaluation of bioactive potential of Coelogyne nervosa A. Rich and endemic medicinal orchid of western ghats, India. Asian J Pharm Cli Res. 2013;6:114-118
- Rashmi K, Shweta SD, Sudeshna SC, Vrushala PS, Kekuda TRP, Raghavendra HL. Antibacetrial and radical scavenging activity of selected orchids of Karnataka, India. Sci Tech Arts Res J. 2015;4(1):160-164.
Crossref - Buyun L, Tkachenko H, Osadowski Z, Kovalska L, Gyrenko O. The antimicrobial activity of ethanolic extract obtained from leaves of Coelogyne brachyptera RCHB.F. (Orchidaceae). Agrobiologiya. 2017.
Crossref
© The Author(s) 2021. Open Access. This article is distributed under the terms of the Creative Commons Attribution 4.0 International License which permits unrestricted use, sharing, distribution, and reproduction in any medium, provided you give appropriate credit to the original author(s) and the source, provide a link to the Creative Commons license, and indicate if changes were made.