

ISSN: 0973-7510
E-ISSN: 2581-690X
and Shashank Garg1
Cellulose nanostructures, particularly bacterial nanocellulose (BNC), have gained significant attention due to their superior mechanical strength, biodegradability, and biocompatibility, making them promising alternatives to petrochemical-based plastics. However, large-scale BNC production is limited by low yields and high processing costs, with culture media contributing approximately 30% of the total production expenditure. In the present study, a BNC-producing bacterium, Kosakonia radicincitans wava 1, was isolated from rotten Totapuri mango and evaluated for cost-effective BNC production using mango peel waste extract as a substitute for glucose in the conventional Hestrin–Schramm medium. Morphological analysis of the synthesized BNC using scanning electron microscopy revealed a dense, three-dimensional network of interwoven ribbon-like nanofibers with an average fiber width ranging from 88-111 nm. Process optimization was carried out using response surface methodology (RSM) with a randomized three levels factorial design, resulting in a quadratic model (p < 0.05). The optimal conditions for maximum BNC yield were determined to be 5% (w/v) mango peel extract concentration, pH 8.0, and an incubation temperature of 26 °C. Experimental validation under these optimized conditions produced a BNC yield (0.46 g/L) closely matching the model-predicted value (0.44 g/L), confirming the reliability of the statistical optimization. The results demonstrate that mango peel waste is an effective low-cost substrate for enhanced BNC production and offers a sustainable approach for valorizing agro-industrial waste.
Bacterial Nanocellulose, Kosakonia radicincitans, Mango Peel Waste, Response Surface Methodology, Biodegradable Plastics
Cellulose is a natural biopolymer found abundant in nature. Cellulose consists of a repeating sequences of β-D-glucopyranose units bonded through β-1,4 glycosidic linkages to form a straight chain polymer. Cellulose biosynthesis occurs across diverse biological kingdoms such as plants, animals, algae, fungi, bacteria, and tunicates. “Nanocellulose” comprises cellulose-derived materials possessing at least one nanoscale dimension. Nanocellulose is a renewable, lightweight material having high strength and durability. Nanocellulose is grouped into three categories viz; cellulose nanocrystals (CNC), cellulose nanofibrils (CNF) and Bacterial nanocellulose (BNC),1 depending upon the structural features and method of production. Bacterial Nanocellulose (BNC) is synthesized by bacteria intracellularly which extruded extracellularly as a pellicle. In recent years bacterial nanocellulose are gaining much attention because of its interesting characteristics.
Bacterial nanocellulose is composed of ribbon-shaped cellulose nanofibers interwoven into a three-dimensional reticulated network.2 These ribbons are made up of cellulose microfibril bundles which are 2-4 nm in diameter. The BNC nanofibers have an average length of about 100 µm and a diameter of around 100 nm. Structurally, BNC has a molecular formula equivalent to that of plant cellulose.
Bacterial cellulose exhibits greater crystallinity than plant cellulose and possesses high degree of chemical purity. Unlike plant cellulose, BNC does not contain lignin, hemicelluloses, and pectin. BNC has outstanding properties like high tensile strength (200-300 MPa), hydrophilic nature, porosity, high water absorption capacity, high mechanical strength, high suspension stability, biocompatible and biodegradable, excellent permeability, flexibility, crystallinity (84%-89%) and elasticity (15-35 GPa).2-5 Depending on the bacterial strain employed and the environmental condition during cultivation, BNC exhibits polymerization degree from 300 up to 10000.6
Due to their extraordinary characteristics, BNC is widely used across multiple fields like food sector, personal care products, clinical applications, textiles, household chemicals, paper, the electronic industry, and many more. BNC exhibits neither cytotoxic nor genotoxic effects; hence BNC is widely used in medical products.7 BNC comes under the GRAS (Generally Recognized as Safe) category, widely applied in the food industry. The biomedical applications of BNC include use of BNC as bioactive implants, cartilage, dressing materials, and surgical implants.
BNC is mainly produced by static or agitated fermentation.8 During static fermentation, a gelatinous layer is synthesized at the air-liquid interface of the culture medium surface. BNC produced through static culture exhibits a compact texture, superior tensile properties, increased elastic modulus and exhibits excellent shape retention and strong tear resistance. In static fermentation, the bacterial strains show higher genetic stability and efficiency in producing cellulose. Static cultivation is a simplified process that does not need complex instruments. The factors that influence the overall processing cost of BNC are the culture conditions, nutrients used, the fermentation process, purification process, energy consumption, and human resources. Among these factors, approximately 30% of the aggregate cost in BNC processing is attributed to culture medium.2,8-10 The common carbon sources used in the BNC production are sucrose, glucose and fructose. To improve the productivity, a high concentration of these sugars is required which ultimately increases the total processing cost. Therefore, the utilization of agro-industrial residues as a nutrient substrate for BNC production will reduce the total processing cost of BNC production up to certain extent and also helps in reducing the environmental pollution. Mango is the major tropical fruit of the world. India is known as the “Mango Capital of the World” as India is the World’s largest Mango Producer. Valorization of mango peel waste for BNC production will be a sustainable solution as well as an alternative revenue option for the fruit processing industry. It will also reduce the environmental burden caused due to the improper disposal of industrial waste. The increasing potential for the BNC application needs the cost effective and enhanced productivity of the BNC. Valorizing the mango peel waste for the BNC production will not only economically beneficial but also will help in reducing the environmental pollution.
Optimization of biochemical processes are routinely performed with Response Surface Methodology (RSM) which uses statistical models to simulate the responses and finding the best with mathematical model based for ANOVA.11 Several studies have been performed to establish the strength of RSM in optimizing process for production of biodiesel,12,13 evaluating performance of engine running on biodiesel,14 organic polymers like carboxy methyl cellulose,15 and bioplastic.16
Despite the promising properties and expanding applications of BNC, its large-scale commercialization remains constrained by low productivity and high production costs, particularly those associated with conventional culture media. Although several agro-industrial wastes have been explored as alternative substrates, the potential of mango peel waste an abundant and underutilized by-product of the fruit processing industry remains insufficiently investigated for efficient BNC production. The novelty of the present study lies in the isolation and utilization of Kosakonia radicincitans wava 1 for BNC synthesis using mango peel waste extract as a low-cost carbon source, coupled with systematic process optimization. The primary objective of this work is to develop a sustainable and economically viable BNC production strategy by optimizing key process parameters, namely substrate concentration, pH, and incubation temperature, using RSM. This approach not only enhances BNC yield but also contributes to the valorization of agro-industrial waste, thereby addressing both economic and environmental challenges associated with BNC production.
Sample collection
BNC producing bacterium was isolated from the rotten totapuri mangoes, collected from Jain Farm Fresh Foods Limited, Unit I, Chittoor, Andhra Pradesh, India. These rotten totapuri mango samples were aseptically collected in the sterile polythene bags separately. These samples were collected manually and randomly. D-glucose, peptone, yeast extract, agar powder were procured from Himedia, India. Di-sodium hydrogen phosphate, sodium chloride were purchased from Merck Life Science Private Limited and Fischer Scientific. 0.85 g of NaCl was dissolved in 100 mL of distilled water to prepare a saline solution. The standard Hestrin-Schramm (HS) medium was employed to cultivate the BNC producing organism containing D-glucose 2.0% w/v, yeast extract 0.5% w/v, peptone 0.5% w/v, Citric acid 0.115% w/v, Di-sodium hydrogen phosphate 0.27% w/v. Mango peel waste was collected from Jain Farm Fresh Foods Limited, Chittoor, Andhra Pradesh, India. Modified Hestrin and Schramm medium without glucose added with 1%-5% of mango peel extract supplemented with 0.5% ethanol was used for optimization study.
Isolation of bacterial culture
The BNC producing bacteria was isolated from the rotten totapuri mangoes. The rotten portion of all the three mango samples were cut, mixed and pooled into the one sample. The 25 g of this pooled sample was taken into the sterile bottle and diluted with of sterile saline solution (225 mL) and the mixer was agitated intensely and serial dilutions of the sample were performed with 9 mL of sterile saline solution. The 0.1 mL of serially diluted sample was plated on sterile pre- incubated nutrient agar medium using spread plate method and incubated at 28 °C for 48 hrs. The bacterial colonies formed were subcultured on sterile standard HS agar medium. Pure colonies were picked and transferred into 50 mL of modified HS medium and incubated at 28 °C for 3 days. After incubation, 10% aliquot of inoculum was used for transfer into 100 mL of modified HS media and incubated at 28 °C for 7 days.17,18 Formation of a thin layer on the air-media interface represents BNC production.
Selection of BNC producing bacteria
The formed thin layer was removed and rinsed thoroughly with distilled water. This washed thin layer was immersed in 1N NaOH at 60 °C for 90 min. After cooling, the treated layer was rinsed with distilled water until the pH of the solution became neutral. The purified thin film was dried at 60 °C for 6-7 hrs. in hot air oven.19
For the confirmation of cellulose production, the formed layer was mixed in Cupriethylenediamine solution to check the solubility.20 The organism which was producing prominent pellicle in the HS medium was selected for further study.
Characterization of the formed thin layer
The characterization of the formed thin layer was done through Fourier Transformed Infrared (FTIR) Spectroscopy, Scanning Electron Microscopy (SEM) and X-ray diffraction (XRD). The FTIR was conducted to give the bonding interactions and functional groups of the material. The SEM was employed to obtain the detailed information about surface topography, microstructure and composition of the sample. X-ray diffraction (XRD) was employed to determine the crystallinity of the sample.
Identification of BNC producing bacteria
The preliminary bacterial identification was performed by checking cultural characteristics like shape, size, colour, elevation, surface, margin, texture, etc. Gram’s staining was carried out to check the Gram’s character and the shape of the bacteria. Biochemical tests like IMViC test, oxidase test and catalase test carried out. The bacterial isolate was identified using molecular techniques in Acme ProGen Biotech (India) Pvt. Ltd., Salem, Tamil Nadu with the help of 16S rRNA gene sequencing using standard steps. BLAST search was carried out for the maximum similarity with the available sequences using 16S ribosomal RNA (rRNA) through NCBI GenBank database. The neighbor-joining algorithm in MEGA software (version 11) was employed to construct the phylogenetic tree.
Preparation of the mango peel extract
The disease free, spotless totapuri mango peels were sampled randomly and cleaned using distilled water to eliminate any impurities or dirt and dust. The peels were finely chopped and immersed in distilled water mixed in a 1:3 (w/v) ratio. This mixture was brought to boil and the top layer appeared during boiling was taken off for any dust and dirt. After cooling, the mango peel pieces were squeezed and the formed pulp extract was passed through a filter. Thereafter, the mango peel extract was autoclaved at 121 °C and 15 psi for 15 min and kept at 4 °C for further use.21
Production of BNC
For the production of BNC, 50 ml of standard HS medium was prepared and added with 0.5% of ethanol. A pure colony of the isolate (Kosakonia radicincitans wava 1) was inoculated into 50 ml of standard HS media and incubated at 28 °C for 3 days in a static condition. Modified Hestrin and Schramm medium supplemented with 0.5% ethanol was used in which glucose is replaced with mango peel extract as a substrate in the concentration of 1%-5% (v/v).
Purification of BNC films
After 7 days of incubation, the produced BNC film was collected and rinsed with distilled water to remove the media content attached to the film. The rinsed film was immersed in 1N NaOH at 60 °C for 90 min to remove the attached bacterial cells and any other impurities. After NaOH treatment, the film was rinsed with distilled water up to the pH of the drained water comes to neutral. The treated film was dried in hot air oven at 60 °C. The BNC yield was calculated by measuring its dry weight.19
Calculation of BNC yield
Comparative study of BNC yield using mango peel extract as a substrate at different concentration with standard HS medium was carried out. The dry weight of the purified BNC films to determine the production yield was measured after drying the films at 60 °C in hot air oven.22 The yield of BNC was quantified as grams of dry BNC per Liter of culture medium.19,23
BNC production optimization using Response Surface Methodology (RSM)
BNC production optimization was achieved using RSM. Three factors namely pH, substrate concentration, and temperature were taken as independent variables for the optimization of production of BNC. A Randomized 3 level factorial design created using Design Expert V. 8.0 which produced 32 runs. The lower and upper levels of substrate concentration, pH, and temperature were taken as 20 °C and 30 °C, respectively. Experiments were carried out as per the run table and response was analysed with same software. After optimization, validation experiment was run the response was obtained for that.
Isolation, selection and characterization of BNC producing bacteria
A total of two hundred and forty three rotten mango samples were collected from the different evaporative cooling ripening chambers (ECRCs) for the isolation of the BNC producing bacteria. After processing of the rotten mangoes and sub-culturing of the bacterial isolates, 108 bacterial isolates were selected and out of which only a single bacterial isolate was identified as a BNC producing bacteria. A layer formed in the air-medium interface remained insoluble after 1N NaOH treatment. The formed layer was treated with Cupriethylenediamine solution and became soluble after treatment. This shows that the formed layer was cellulose.20
Characterization of the layer
FTIR analysis of the formed layer
FTIR analysis gives the bonding interactions and functional groups present in the material. The FTIR spectrum of cellulose displays the broad absorption band between 3000 and 3700 cm-1 corresponding to the stretching vibrations of -OH groups in both primary and secondary hydroxyls. Figure 1 represents the FTIR spectra obtained for the formed thin layer in which the wide peak obtained at 3174.51 cm-1 reveals the O-H hydroxyl groups. The peak obtained at 1653.92 cm-1 is relates to a C=O stretching. A peak at 1379.02 cm-1 arises from stretching of -C-H bending in glucose units. A peak obtained at 1058.87 cm-1 corresponds to -C-O stretching. A peak appeared at 511.06 cm-1 shows anti symmetric out of phase ring stretching of β-glycosidic linkages between carbohydrate and glucose peak. Table 1 represents the peak interpretation of FTIR spectra of the thin layer obtained in HS medium. The FTIR analysis of this film indicates that the material obtained in this research shows the similar bonding interactions and functional groups to that of cellulose.
Table (1):
Peak interpretation of FTIR Spectra of the thin layer obtained in HS medium
Peakwave number(cm-1) |
Peak Assignment |
Ref. |
|---|---|---|
3174.51 cm-1 |
O-H hydroxyl groups |
[1,24] |
1653.92 cm-1 |
C=O stretching |
[4] |
1379.02 cm-1 |
C-H bending |
[10,24] |
1058.87 cm-1 |
-C-O stretching |
[24,25] |
511.06 cm-1 |
Anti-symmetric anti-phase ring stretching associated with β-glycosidic bonds |
[4] |
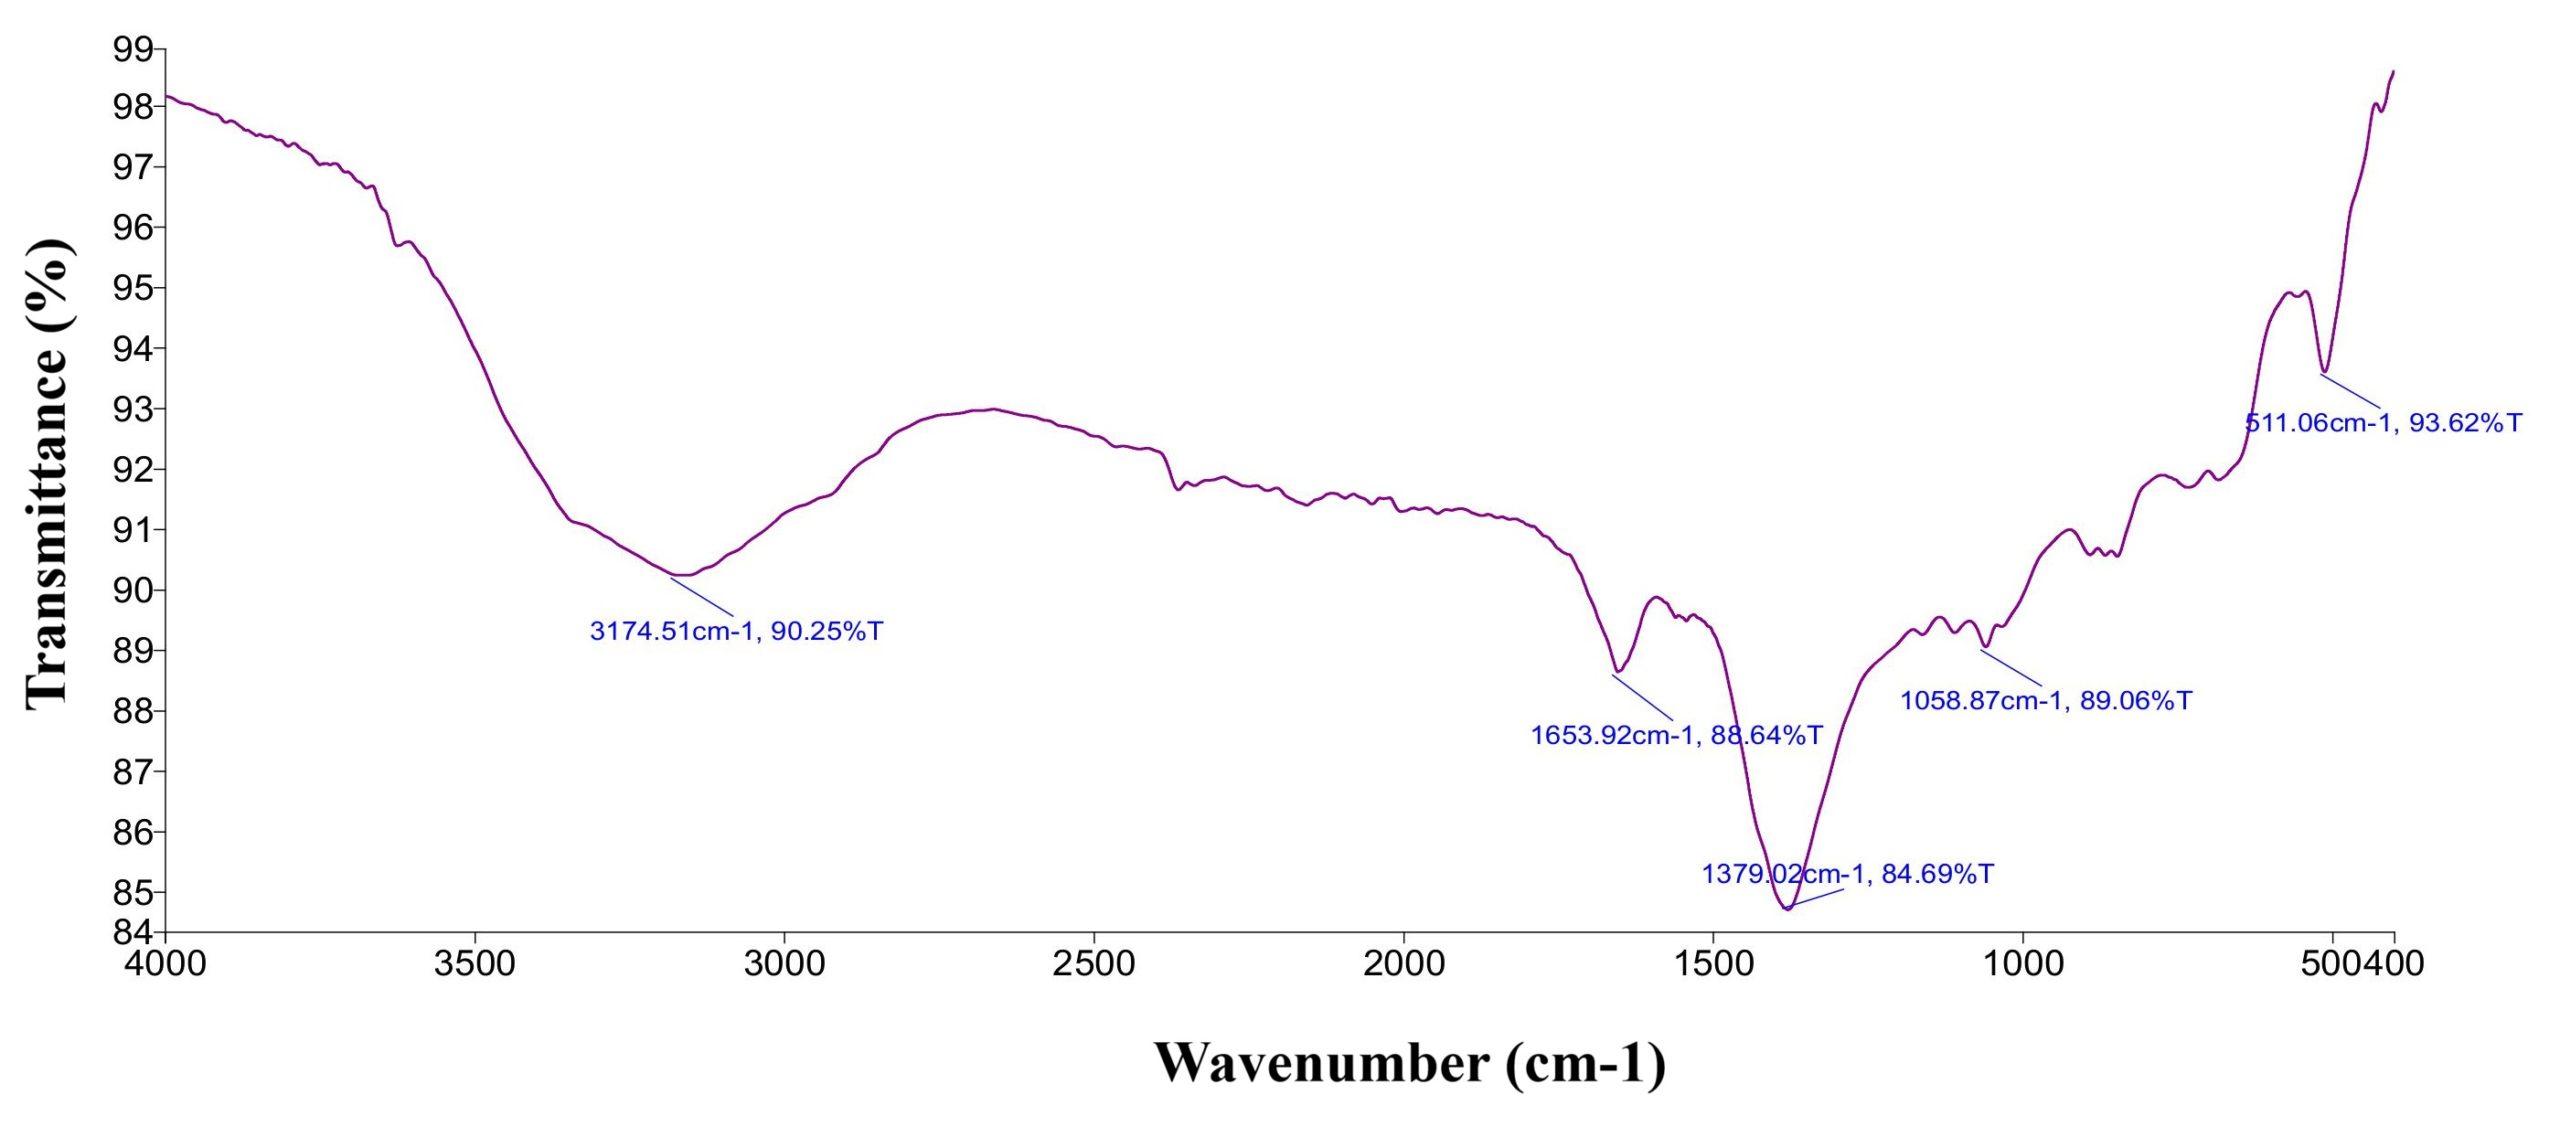
Figure 1. FTIR Spectra of the thin layer obtained in HS medium
SEM Results of the formed thin layer
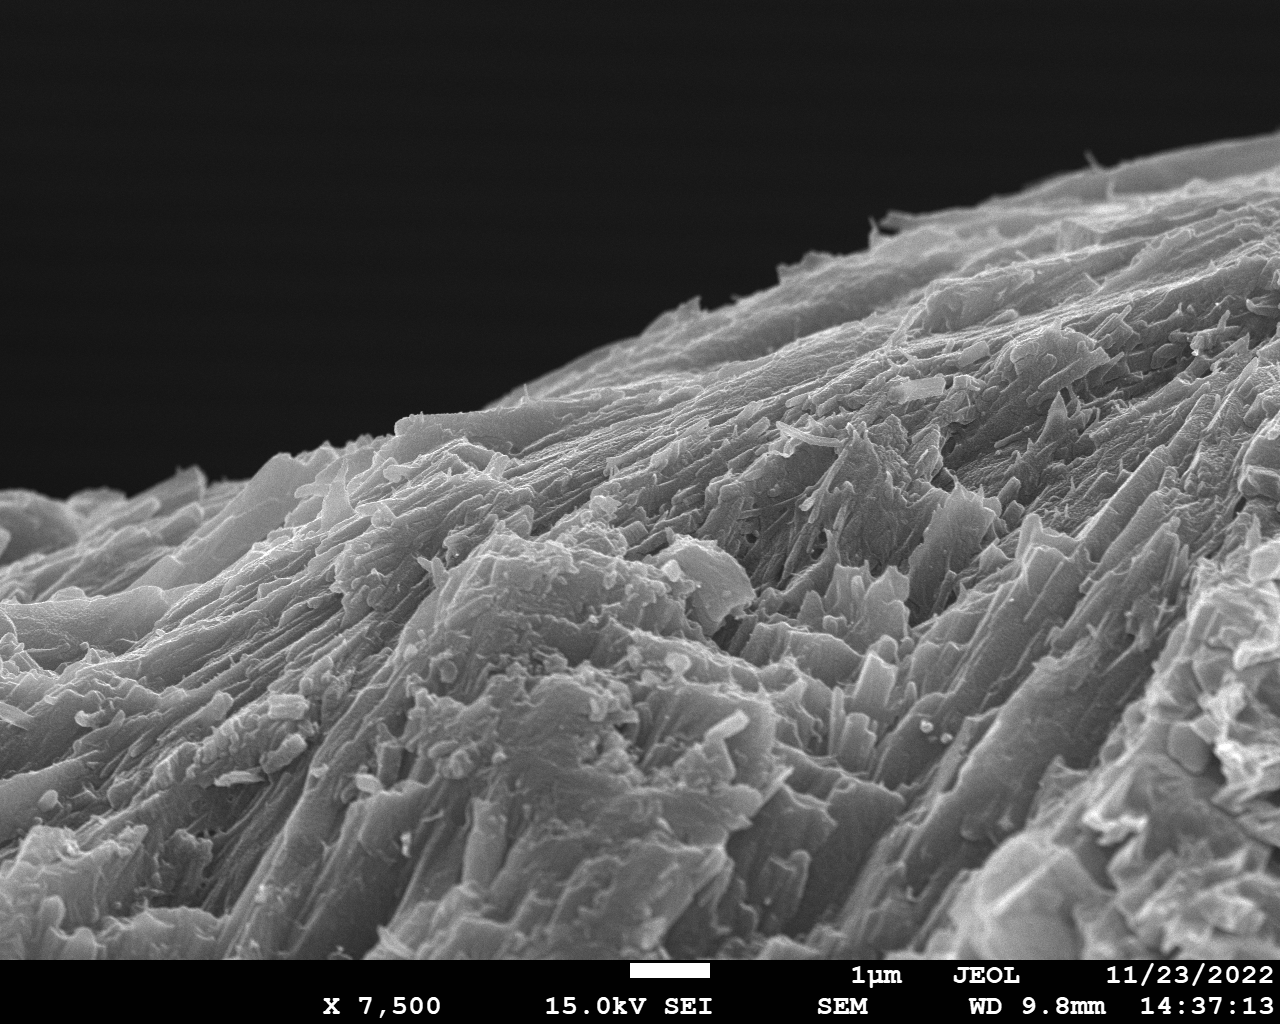
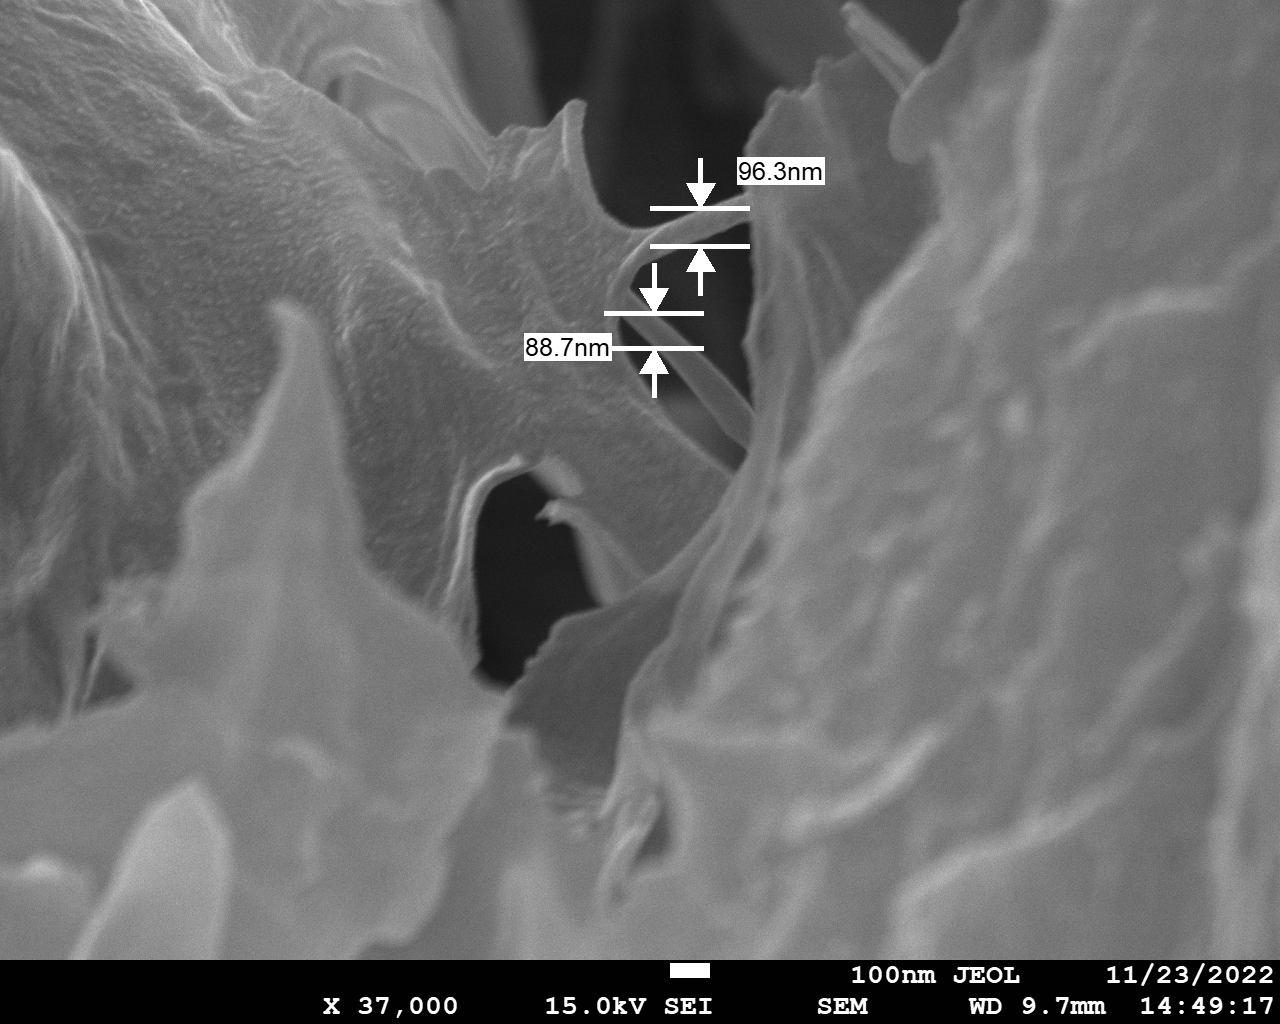
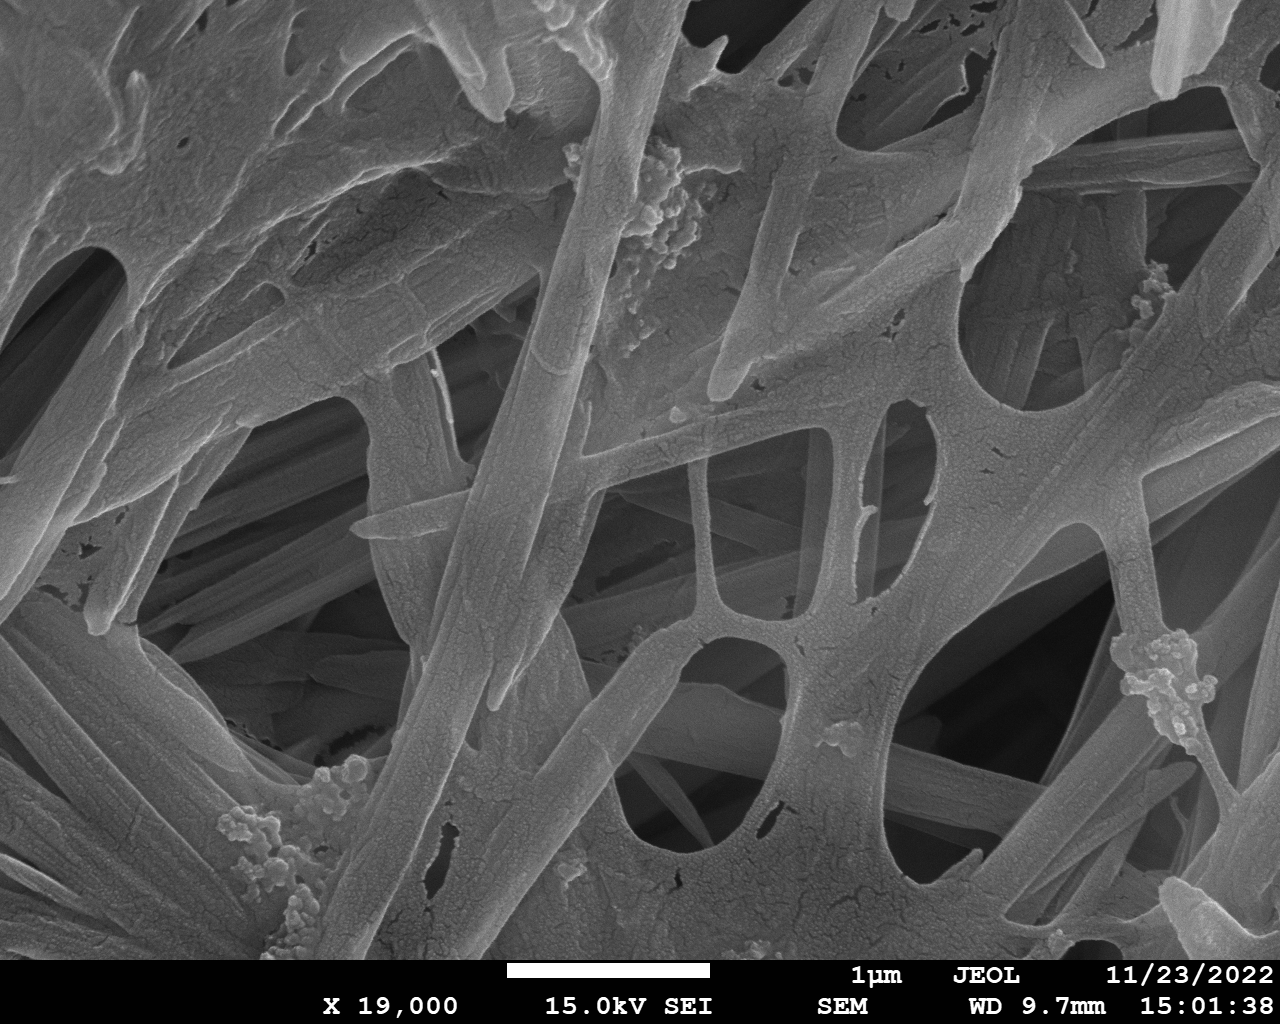
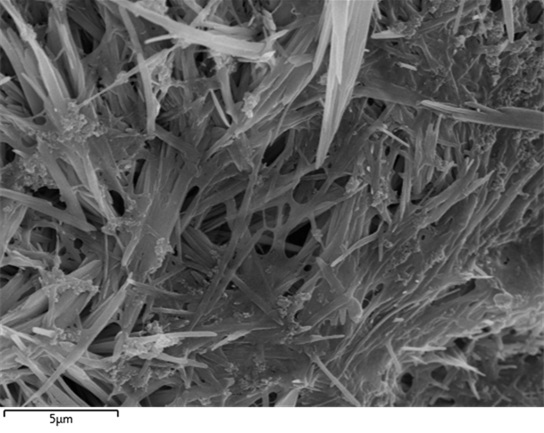
The SEM is used to obtain the detailed information about surface topography, microstructure and composition of the sample. The SEM results of the sample showed that the surface of the produced layer is smooth and it represents the relatively low porous structure (Figure 2a). The average width of the fibres was observed in the range of 88-111 nm (Figure 2b). The SEM images of the layer revealed the interwoven tri-dimensional reticulated ribbon like ultrafine cellulose nanofibers which were densely arranged (Figure 2 c,d).
(A)
 (B)
(B)
 (C)
(C)
 (D)
(D)
Figure 2. SEM images for the thin layer obtained from HS medium, (A) cross-sectional view of the thin layer (B) fibre dimensions, (C) and (D) surface morphology of the thin layer
XRD Results of the formed thin layer
XRD is a widely used technique for characterizing the crystallinity of materials. Figure 3 shows the XRD profile of the obtained thin layer. The XRD pattern of the thin layer is showing similarity with the XRD pattern obtained by Liu et al.26 The notable peak closure to 19.7 matches with cellulose Iα (0-1-0 planes) and cellulose Iβ(planes of the 1-1-0) of native cellulose. The narrow peaks obtained in this XRD pattern indicate the crystallinity of the substance whereas, the broad peaks correspond to the amorphous nature of the material. The peak observed at 2θ = 37 attributed to the crystallographic planes (0-4-0) of cellulose II.27
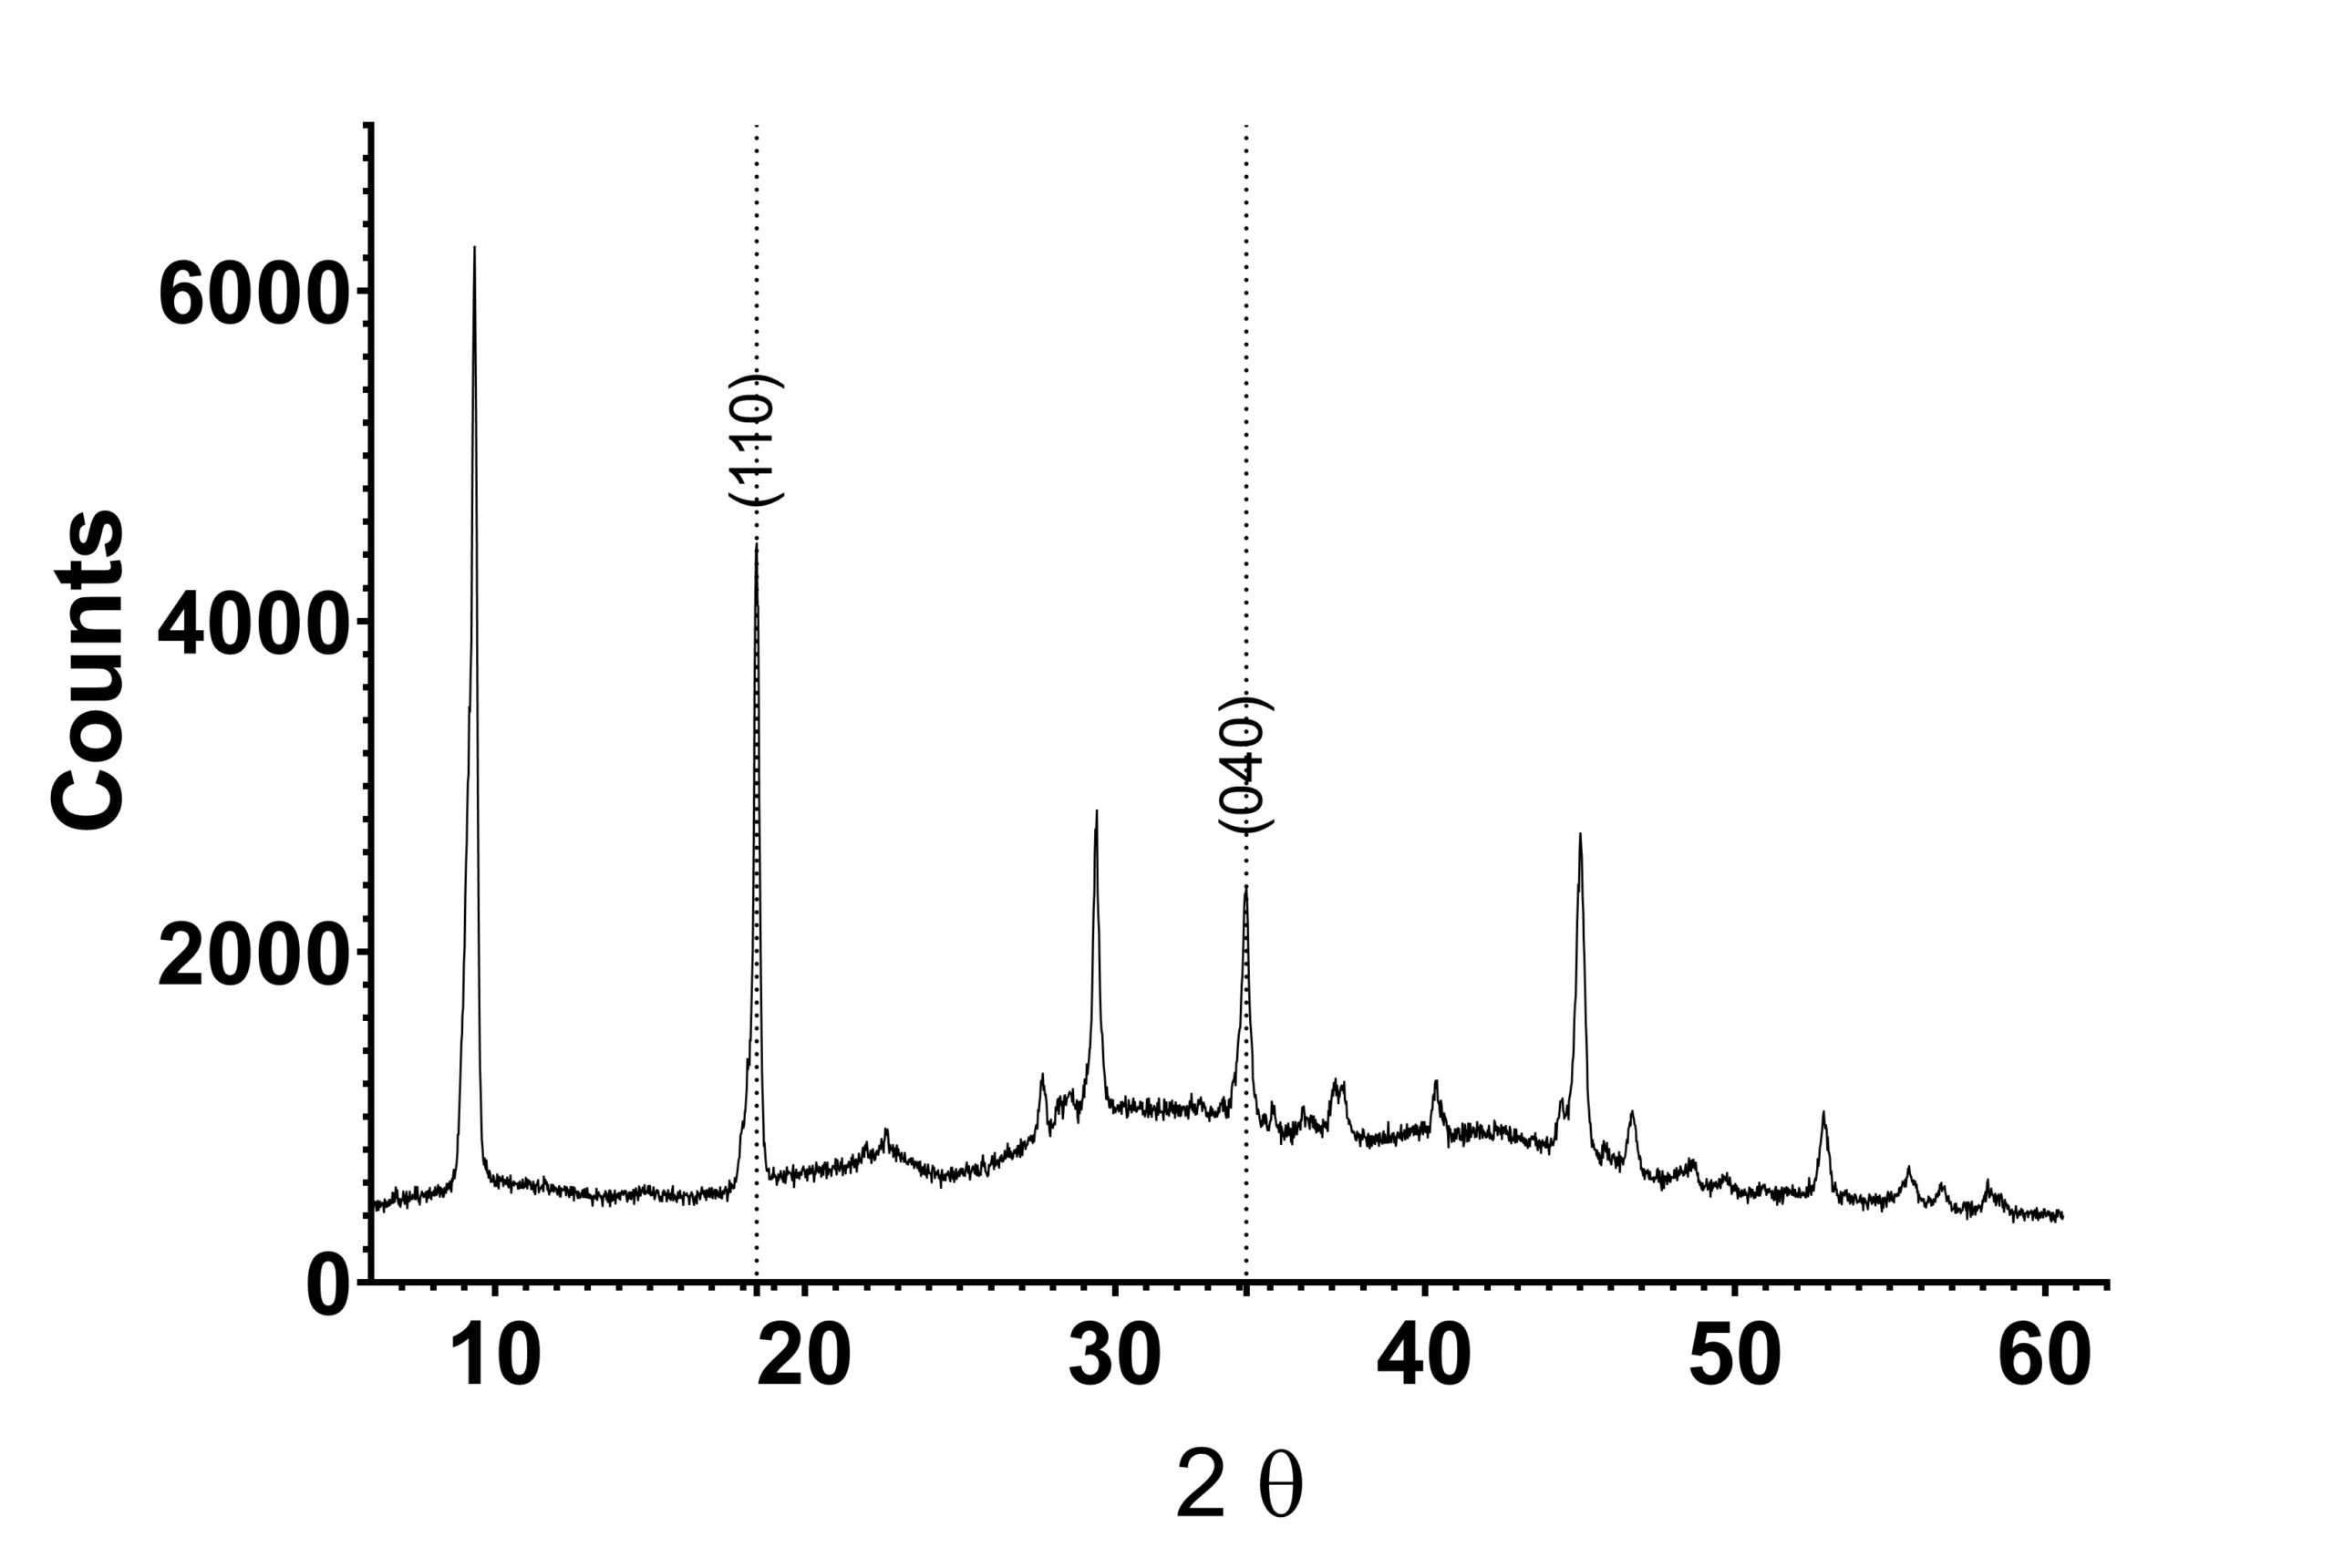
Figure 3. X-ray Diffraction Profile of the thin layer
After confirming the formed layer as cellulose, the bacteria identified as a BNC producer was selected for further study. The cultural characteristics, biochemical tests and molecular identification were carried out for the BNC producing bacteria.
Identification of the BNC producing bacteria
The microscopic studies revealed that the isolated bacterium was Gram-negative short rod (Figure 4). The cultural characteristics of the isolate on HS media showed that the bacterial colonies are aerobic, smooth, circular, 6-7 mm in diameter, creamish in colour, having no pigmentation, with entire margin, convex, mucoid, and opaque (Figure 5). The biochemical tests revealed that the bacterial isolate was Oxidase negative, catalase positive, Indole negative, Methyl Red positive, Voges Proskauer negative and showed citrate utilization.
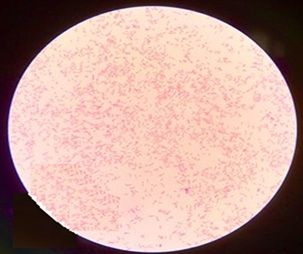
Figure 4. Microscopic observation of the bacterial isolate under compound microscope
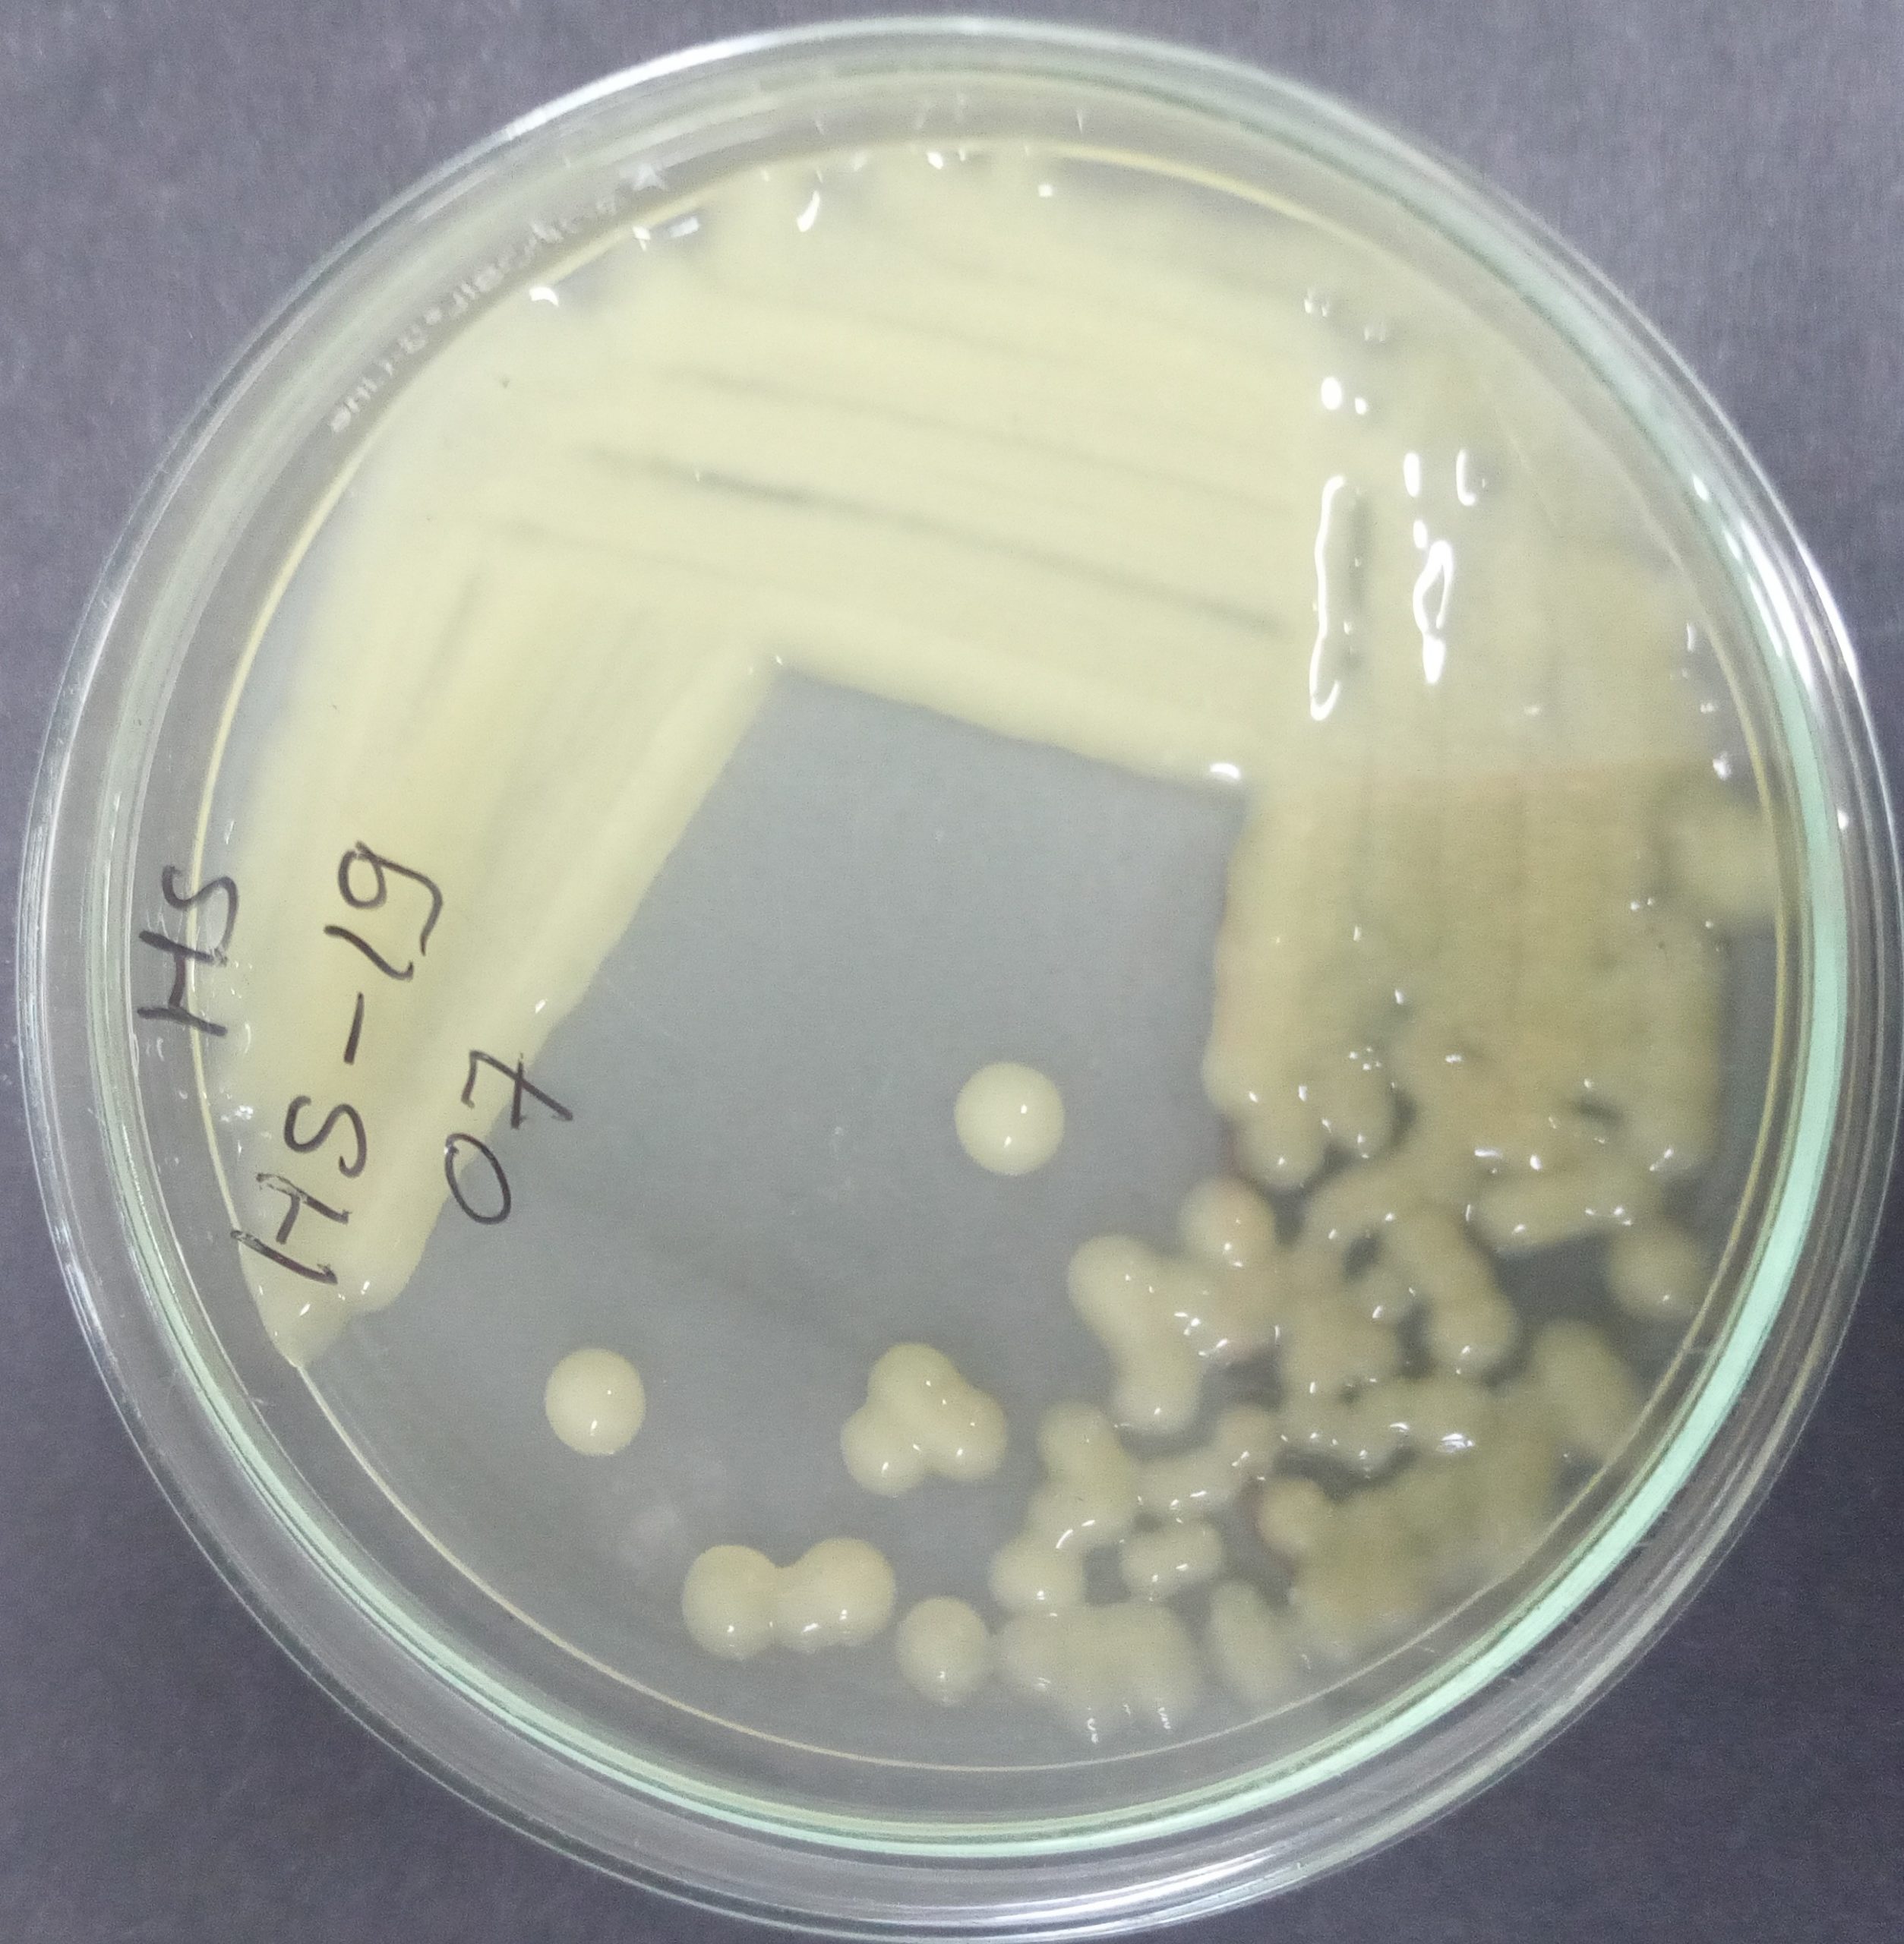
Figure 5. Bacterial isolate grown on HS media
Molecular identification of the bacterial isolate using 16S rRNA
The molecular identification of bacterial isolate was done using 16S rRNA gene sequencing. The 16S rRNA gene of the isolate was found to contain 1374 bp with homology of 98.91% with Kosakonia radicincitans DSM 16656 species. The rRNA sequence was submitted to Genbank and the isolate was identified as Kosakonia radicincitans wava 1 strain with accession number OR129982.
A BLAST search using 1374 bp through NCBI nucleotide database was presented the maximum similarity with the members of the genus Kosakonia. The evolutionary relationships were inferred by constructing the phylogenetic tree through a neighbor-joining method in MEGA software (version 11).
This phylogenetic tree reveals the close association of the K. radicincitans wava 1 strain with K. quasisacchari NR 169476.1, E. cloaceae NR 044978.1 and E. cloaceae NR 102794.2 (Figure 6).
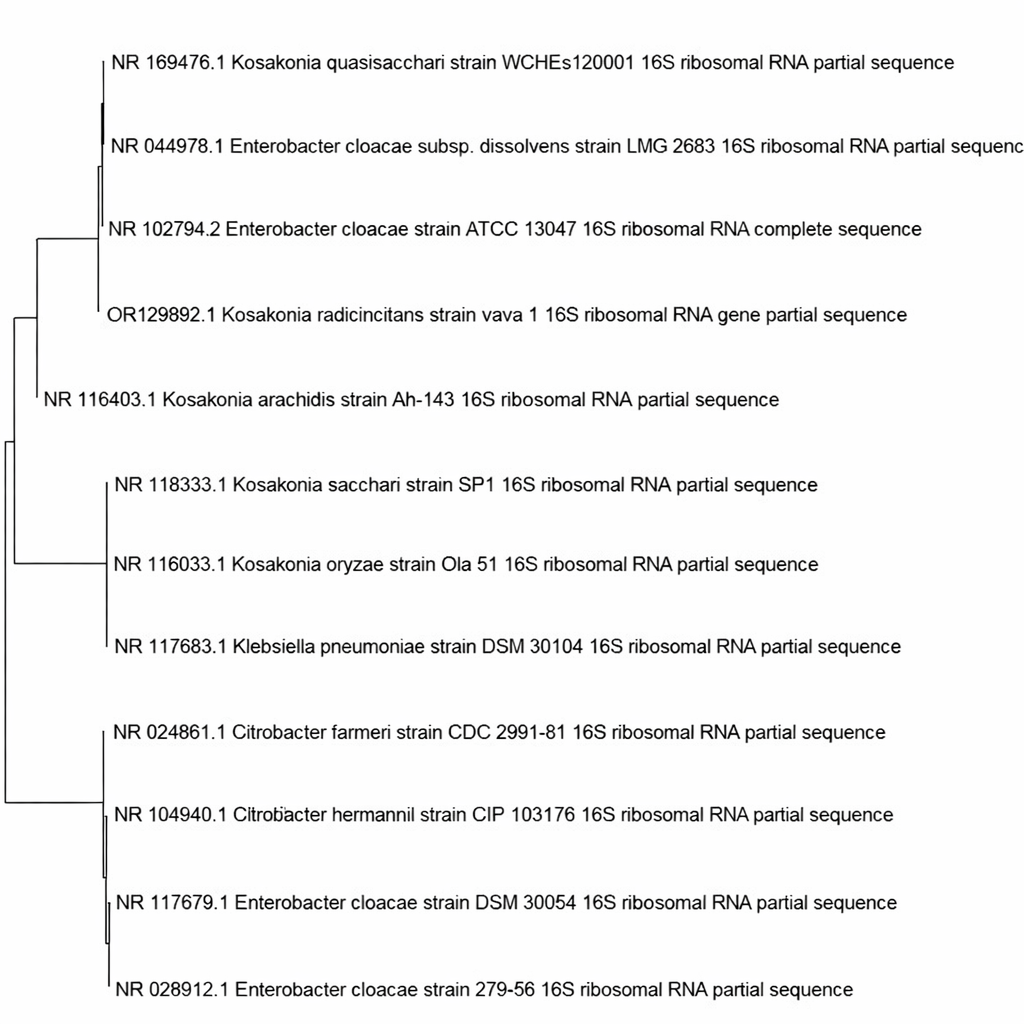
Figure 6. Phylogenetic analysis of the bacterial isolate
BNC production optimization using Response Surface Methodology (RSM)
The experimental runs used to perform experiments of RMS with its corresponding actual responses are given in Table 2. From the suggested list of fitted models, a quadratic model was chosen in the basis of goodness of fit value of the model and lack of fit value. The mathematical model of the fit is given in equation 1. The model was further utilized for maximizing the BNC production with the given parameters. The fit of the model was deduced using Analysis of Variance (ANOVA) which is a statistically robust technique for evaluating the fit of models. The ANOVA table of the model is given in Table 3. R2 value of the model which was found to be 0.748 and a p-value of <0.0001 associated with the model implies a significantly adaptable model. The p-value of Lack of fit was found to be 0.3565 that is above the threshold value of 0.05 and it implicates that the lack of fit of the model is insignificant and hence further strengthens the accuracy and predictability of the model. The model explained 74.78% of the total variation, supporting the reliability of the response surface analysis. The main factors i.e. substrate concentration, pH were found to be significantly affecting the production process (p < 0.001) while temperature was not found to affect the output in a significant way (p > 0.05). From the p-values of the interaction terms in Table 3, it can be deduced that the factors are not interacting with each other the output is most likely being affected by substrate concentration and pH individually. However, in the squared terms, C2 corresponding to temperature is observed to be significant which can be interpreted its optimum effect, not a simple increasing or decreasing trend.
BNC (g/L) = -1.8027 – (0.134 × Substrate concentration) + (0.139 × pH) + (0.137 × temp) + (0.00583 × Substrate concentration × pH) + (0.0027 × substrate concentration × temp) + (0.00025 × pH × temp) + (0.00973 × substrate concentration2) – (0.0107 × pH2) – (0.0029 × temp2)
…(1)
Figure 7 exhibits the scatter plot of predicted versus actual values of the experimental runs. There is a good agreement between the two values which further validates the model. Plot of residual with runs is given in Figure 8. The pattern of the points suggests the errors are evenly distributed around the modelled fit line and gives additional strength to the validity of the model. A non-random and even patterned distribution is not considered as a sign of well fitted model.
Table (2):
Run table with responses used to perform RSM modelling
Run number |
Substrate concen. (%) |
pH |
Temp. (°C) |
BNC (g/l) |
|---|---|---|---|---|
1 |
5 |
4 |
30 |
0.18 |
2 |
3 |
4 |
25 |
0.19 |
3 |
3 |
6 |
25 |
0.35 |
4 |
5 |
8 |
25 |
0.43 |
5 |
1 |
4 |
25 |
0.15 |
6 |
1 |
6 |
30 |
0.19 |
7 |
5 |
4 |
25 |
0.18 |
8 |
3 |
6 |
20 |
0.24 |
9 |
1 |
4 |
30 |
0.11 |
10 |
3 |
8 |
30 |
0.22 |
11 |
5 |
4 |
20 |
0.16 |
12 |
1 |
8 |
30 |
0.12 |
13 |
5 |
8 |
30 |
0.41 |
14 |
5 |
8 |
20 |
0.26 |
15 |
5 |
6 |
25 |
0.51 |
16 |
1 |
6 |
25 |
0.3 |
17 |
1 |
8 |
25 |
0.34 |
18 |
5 |
6 |
30 |
0.34 |
19 |
3 |
8 |
25 |
0.41 |
20 |
3 |
6 |
25 |
0.23 |
21 |
5 |
6 |
20 |
0.29 |
22 |
3 |
4 |
30 |
0.15 |
23 |
1 |
6 |
20 |
0.21 |
24 |
3 |
8 |
20 |
0.23 |
25 |
3 |
6 |
25 |
0.23 |
26 |
3 |
6 |
30 |
0.25 |
27 |
3 |
6 |
25 |
0.24 |
28 |
1 |
8 |
20 |
0.21 |
29 |
1 |
4 |
20 |
0.11 |
30 |
3 |
6 |
25 |
0.21 |
31 |
3 |
6 |
25 |
0.24 |
32 |
3 |
4 |
20 |
0.15 |
Table (3):
Fitting parameters for the linear model adopted in study
Source |
Sum of Squares |
df |
Mean Square |
F-value |
p-value |
|---|---|---|---|---|---|
Model |
0.2238 |
9 |
0.0249 |
7.25 |
|
A-Substrate concentration |
0.0578 |
1 |
0.0578 |
16.85 |
0.0005 |
B-pH |
0.0868 |
1 |
0.0868 |
25.31 |
|
C-temp |
0.0007 |
1 |
0.0007 |
0.1960 |
0.6623 |
AB |
0.0065 |
1 |
0.0065 |
1.91 |
0.1814 |
AC |
0.0091 |
1 |
0.0091 |
2.65 |
0.1180 |
BC |
0.0001 |
1 |
0.0001 |
0.0219 |
0.8838 |
A2 |
0.0108 |
1 |
0.0108 |
3.16 |
0.0893 |
B2 |
0.0131 |
1 |
0.0131 |
3.81 |
0.0638 |
C2 |
0.0379 |
1 |
0.0379 |
11.04 |
0.0031 |
Residual |
0.0754 |
22 |
0.0034 |
||
Lack of fit |
0.0628 |
17 |
0.0037 |
1.47 |
0.3565 (not significant) |
Pure error |
0.0126 |
5 |
0.0025 |
||
Cor Total |
0.2992 |
31 |
|||
R2 value |
0.7478 |
||||
Adjusted R2 value |
0.6447 |
||||
Predicted R2 value |
0.5004 |
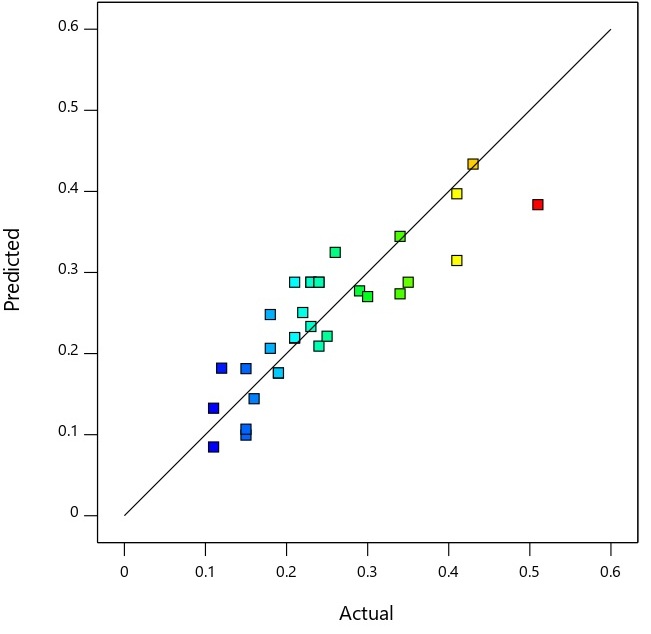
Figure 7. Scatter plot of predicted versus actual (experimental) value of runs
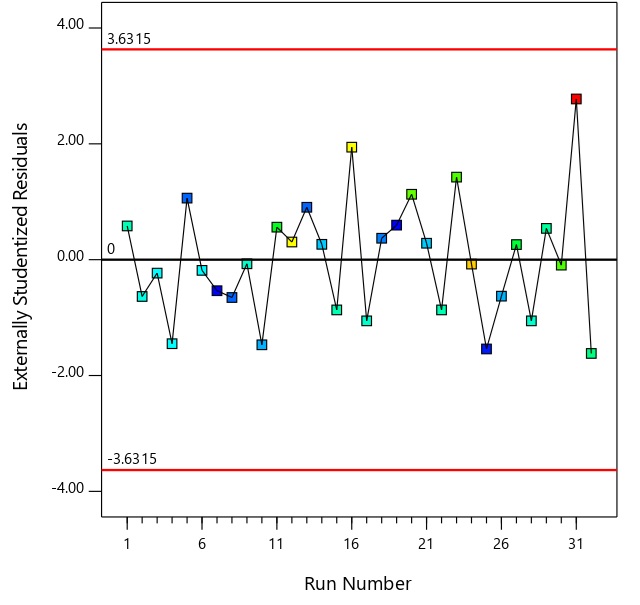
Figure 8. Distribution of residual with runs obtained in optimization procedure
Three-dimensional response surfaces and corresponding contour plots for the experiment are depicted in Figure 9a-f. The contour plots are 3D representation of the responses various combinations, where blue colour represents low response, green colour for moderate response and yellow colour for high response. It can be seen from Figure 9b that the highest BNC yield was obtained at nearly higher pH and higher substrate concentration. For interpreting the response of temperature and substrate concentration,
Figure 9d was utilized and it was observed that the 3D surface was curved from central region for temperature axis which signifies that responses are increasing and then decreasing with change in temperature in the given range. Observation of Figure 9f suggests that BNC production is best at higher pH and moderate temperature as the curvature of response curve is bulged from middle in temperature axis and increasing for pH with increase in pH.
Next, contour plots are utilized to assess for interactions between the factors under study. From Figure 9a the pH and substrate concentration are showing interactive effect at lower substrate concentration as evident from the curvature of the contour plot. The BNC production is predicted to be highest in the yellow region of the plot with lies at higher pH and higher substrate concentration. The contour lines are closely spaced along the substrate axis suggesting a strong effect of substrate concentration which is consistent with the ANOVA table values (p < 0.005). The slope of contour lines was found to be steeper in the middle region suggesting pH as the most significant factor in the optimization process which is also suggested by the ANOVA table value of p < 0.001. From the curve of the contour lines of Figure 9a, a weak interaction between substrate concentration and pH was observed. The fact was supported by a high p-value (p = 0.1814) of the AB term in Table 3. From Figure 9c it was revealed that substrate concentration is having a positive effect on BNC production (p < 0.001). While with temperature the BNC production was found to increase and then decrease. This is a nonlinear effect suggesting and optimal range in between the extreme values rather than a linear trend in one direction. This was well evident from the p-values of term C and C2 in the Table 3. P-value for C was 0.6623, while for C2 was 0.0031. When term was squared the effect becomes significant as the negative values of errors are squared and adds to the response. The interaction of temperature and substrate concentration were found to be weak as interpreted by smooth form of contour plot curves. The interactive effect of pH and temperature was depicted in the contour plot in Figure 9e. BNC production was clearly observed to be increasing as the pH changes from acidic to higher values. On the temperature axis, the colour gradient changes from blue to green and again towards blue suggesting an increase in BNC first and then again a decrement in the same. The concentric curved nature of contour lines suggests a clear quadratic effect that is also evident from p-value of C and C2 as discussed previously in the text. The smooth contour patterns indicate a weak interaction between pH and temperature, which is consistent with the non-significant BC interaction term observed in ANOVA.
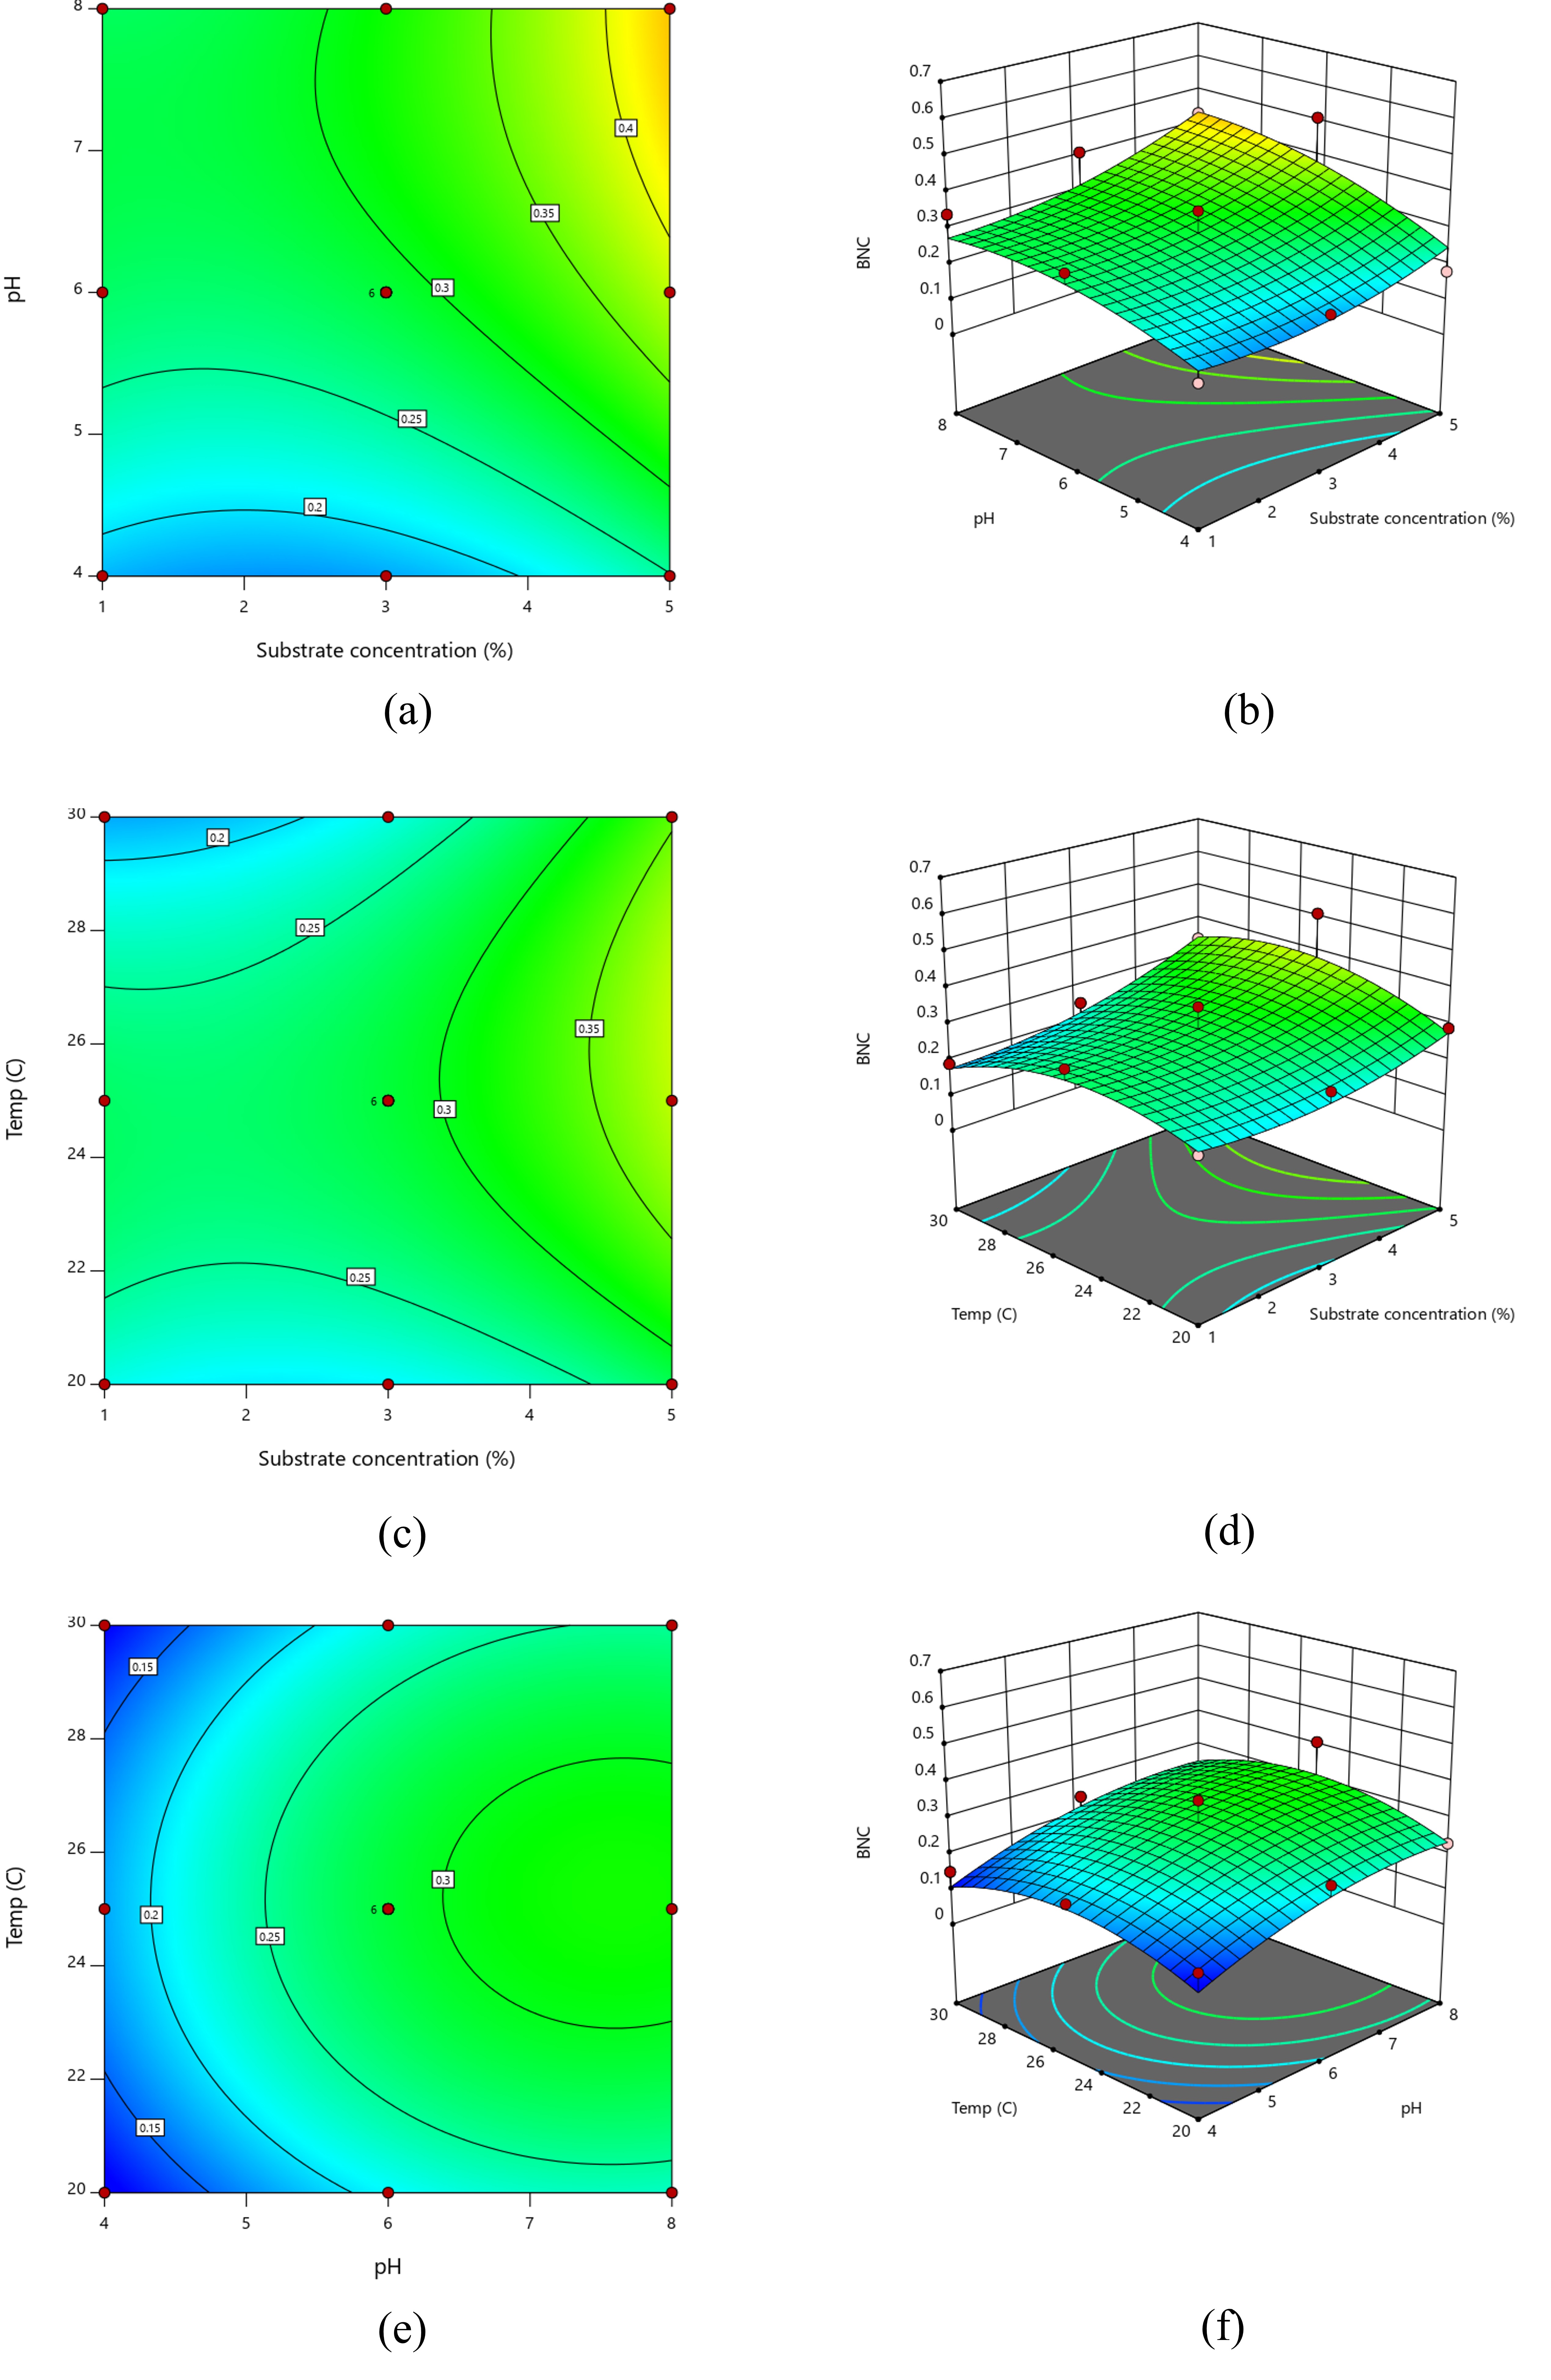
Figure 9. Contour plots (a, c, e) and 3D surface plots (b, d, f) for the three factors under study
Prediction of optimized parameters was done which suggested that the production of BNC will be best at a substrate concentration of 5%, pH value of 8.0, and 26 °C of temperature. The predicted value of BNC under these conditions was 0.44 g/L. The validation experiment on these parameters gave the BNC concentration of 0.46 g/L which established the validity of an optimization process.
The novel nanocellulose producing bacterial strain Kosakonia radicincitans wava 1 was isolated from rotten mango fruit. The strain significantly produce high BNC yield in the modified HS media where glucose is replaced by mango peel extract as a substrate as compared to standard HS media. The Scanning electron microscopy results of the formed thin layer showed the interwoven tri-dimensional reticulated ribbon like ultrafine cellulose with average fibre width in the range of 88-111 nm. An effect of substrate concentration, the pH of media and incubation temperature on BNC production was studied under static cultivation. Optimization of BNC production was performed with RSM using a randomized 3 level factorial design which yielded a quadratic model. The interactions of the input parameters were weak among the input variables. The optimized values were obtained as 5% concentration of substrate, pH 8, and 26 °C temperature. Validation experiment gave nearly similar yield of BNC as predicted by the statistical model.
Limitations and future recommendations
The present study was performed under laboratory-scale static cultivation, which may limit its direct applicability to industrial production systems. Variations in the chemical composition of mango peel extract could influence process reproducibility and BNC yield consistency. Furthermore, process optimization was confined to substrate concentration, pH, and temperature, while other critical parameters such as oxygen transfer, nitrogen source, incubation time, and inoculum density were not investigated.
Future research should focus on bioreactor-based scale-up and techno-economic analysis to evaluate industrial feasibility. Incorporation of additional operational variables in optimization frameworks is recommended. Detailed physicochemical, mechanical, and functional characterization of the produced BNC is essential to determine its suitability for targeted applications. In addition, genetic and metabolic profiling of Kosakonia radicincitans wava 1, along with sustainability and life-cycle assessments, would further support the valorization of mango peel waste for BNC production.
ACKNOWLEDGMENTS
The authors gratefully acknowledge the Jain Farm Fresh Foods Limited, Chittoor, India, for providing infrastructure to perform this research work. The authors also express their gratitude to the Central instrumentation facility, Lovely Professional University, Punjab, India, for analysing our sample for FTIR, SEM and XRD.
CONFLICT OF INTEREST
The authors declare that there is no conflict of interest.
AUTHORS’ CONTRIBUTION
JS conceptualized the study. VDK, JS and SG designed and performed the experiments. SS performed RSM analysis. JS and SG performed data analysis. VDK and SG wrote the manuscript. VDK, SS and SG revised the manuscript. All authors read and approved the final manuscript for publication.
FUNDING
None.
DATA AVAILABILITY
All datasets generated or analyzed during this study are included in the manuscript.
ETHICS STATEMENT
Not applicable.
- Arserim-Ucar DK, Korela F, Liuc L, Yamb KL. Characterization of bacterial cellulose nanocrystals: Effect of acid treatments and neutralization. Food Chem. 2021;336:127597.
Crossref - Zhong C. Industrial-Scale Production and Applications of Bacterial Cellulose. Front Bioeng Biotechnol. 2020;8:605374.
Crossref - Jaceka P, da Silva FAGS, Dourado F, Bielecki S, Gama M. Optimization and characterization of bacterial nanocellulose produced by Komagataeibacter rhaeticus K3. Carbohydr Polym Technol Appl. 2021;2:100022.
Crossref - Rahman SSA, Vaishnavi T, Vidyasri GS, et al. Production of bacterial cellulose using Gluconacetobacter kombuchae immobilized on Lufa aegyptiaca support. Sci Rep. 2021;11:2912.
Crossref - Ramirez CM, Gutierrez AC, Castro C, Zuluaga R, Ganana P. Effect of production process scale-up on the characteristics and properties of bacterial nanocellulose obtained from overripe Banana culture medium. Carbohydr Polym. 2020;240:116341.
Crossref - Huang Y, Zhu C, Yang J, Nie Y, Chen C, Sun D. Recent advances in bacterial cellulose. Cellulose. 2014;21:1-30.
Crossref - Stanislawska A. Bacterial Nanocellulose as a Microbiological Derived Nanomaterial. Adv Mater Sci. 2016;16(4):45-57.
Crossref - Andriani D, Apriyana AY, Karina M. The optimization of bacterial cellulose production and its applications: a review. Cellulose. 2020;27:6747-6766.
Crossref - Jozala AF, Pertile RAN, dos Santos CA, et al. Bacterial cellulose production by Gluconacetobacter xylinus by employing alternative culture media. Appl Microbiol Biotechnol. 2014;99(3):1181-1190.
Crossref - Fotouh DA, Hassan MA, Shokry H, Roig A, Azab MS, Kashyout AEB. Bacterial nanocellulose from agro-industrial wastes: low-cost and enhanced production by Komagataeibacter saccharivorans MD1. Sci Rep. 2020;10(1):3491.
Crossref - Reji M, Kumar R. Response surface methodology (RSM): An overview to analyze multivariate data. Indian J Microbiol Res. 2022;9(4):241-248.
Crossref - Rao TSSB, Manimaran R, Sankar P, Sreedhara S, Kottala RK, Guntreddi V. Sustainable Gossypium arboreumbiodiesel production using an industrial waste heterogeneous catalyst for RCCI engine applications. Sci Rep. 2025;15(1):38069.
Crossref - Duraisamy S, Giri J, Rao TSSB, Kanan M, Manimaran R. Optimization of cashew nut shell biodiesel production with industrial waste catalysts and butanol additives for ecofriendly CRDI engine applications. Sci Rep. 2025;15(1):957.
Crossref - Rao TSSB, Manimaran R, Manivannan C, Reddy VSN, Mehar K. Advanced prediction and optimization of VCR engine characteristics using RSM with DFA for sustainable biofuel derived from waste lemon Peel. Sci Rep. 2025;15(1):34661.
Crossref - Abou-Taleb KAA, Elkelish A, Mahdi NZ, et al. Maximizing polylactic acid bioplastic yield from Lactobacillus rhamnosus L6 via Response Surface Methodology: evaluating antimicrobial effectiveness, Physical, and chemical properties of PLA. ACS Omega. 2025;10(29):32038-32052.
Crossref - Abd Rauf M, Jalil R, Sapiee NH. Optimized carboxymethyl cellulose (CMC) preparation from oil palm trunk (OPT) by response surface methodology (RSM). Int J Biol Macromol. 2025;313;144235.
Crossref - De Andrade Arruda Fernandes I, Pedro AC, Ribeiro VR, et al. Bacterial cellulose: From production optimization to new applications. Int J Biol Macromol. 2020;164:2598-2611.
Crossref - Abba M, Abdullahi M, Nor MHM, Chong CS, Ibrahim Z. Isolation and characterisation of locally isolated Gluconacetobacter xylinus BCZM sp. with nanocellulose producing potentials. IET Nanobiotechnol. 2017;12(1):52-56.
Crossref - Abdelraof M, Hasanin MS, El-Saied H. Ecofriendly green conversion of potato peel wastes to high productivity bacterial cellulose. Carbohydr Polym. 2019;211:75-83.
Crossref - Sharma C, Bhardwaj NK. Bacterial nanocellulose: Present status, biomedical applications and future perspectives. Mater Sci Eng. 2019;104:109963.
Crossref - Sijabat EK, Nuruddin A, Aditiawati P, Purwasasmita BS. Synthesis and Characterization of Bacterial Nanocellulose from Banana Peel for Water Filtration Membrane Application. IOP Conf Ser J Phys Conf Ser. 2019;1230:012085.
Crossref - Zeng X, Small DP, Wan W. Statistical optimization of culture conditions for bacterial cellulose production by Acetobacter xylinum BPR 2001 from maple syrup. Carbohydr Polym. 2011;85(3):506-513.
Crossref - Rodrigues AC, Fontao AI, Coelho A, et al. Response surface statistical optimization of bacterial nanocellulose fermentation in static culture using a low-cost medium. New Biotechnology. 2019;49:19-27.
Crossref - Singh SS, Salem DR, Sani RK. Spectroscopy, microscopy, and other techniques for characterization of bacterial nanocellulose and comparison with plant-derived nanocellulose. In: Microbial and Natural Macromolecules. Elsevier; 2021:Chapter 17.
Crossref - Molina-Ramírez C, Castro M, Osorio M, et al. Effect of Different Carbon Sources on Bacterial Nanocellulose Production and Structure Using the Low pH Resistant Strain Komagataeibacter Medellinensis. Materials. 2017; 10(6):639.
Crossref - Liu D, Labas A, Long B, et al. Bacterial nanocellulose production using cost-effective, environmentally friendly, acid whey based approach. Bioresour Technol Rep.2023:101629, Volume 24.
Crossref - EI-Naggar NEA, Mahammad ABA, EI-Malkey SE. Bacterial nanocellulose production using Cantaloupe juice, Statistical optimization and Characterization. Sci Rep. 2023;13(1):51.
Crossref
© The Author(s) 2026. Open Access. This article is distributed under the terms of the Creative Commons Attribution 4.0 International License which permits unrestricted use, sharing, distribution, and reproduction in any medium, provided you give appropriate credit to the original author(s) and the source, provide a link to the Creative Commons license, and indicate if changes were made.