


ISSN: 0973-7510
E-ISSN: 2581-690X
Water quality of the Karnaphuli river, located in the southern region of Bangladesh, was assessed. A large population living in the area depend on this river for drinking, household, or recreational water. Several standard physicochemical and microbiological parameters were used to determine the level of pollution. The mean values of the physicochemical parameters were significantly different from those of the WHO guideline values. The microbiological examination of the river water as determined by measuring total coliform and total fecal coliform demonstrated that the water is highly contaminated by pathogenic bacteria. Coliform and fecal coliform counts were also significantly higher than those of the standards recommended by WHO. Water quality indices (WQI) of the river water at different stations were calculated to determine the severity of pollution. The results indicate that the river is highly polluted by various chemical pollutants and pathogenic bacteria. Regular monitoring and immediate measures are required to reduce risks for public health and safety.
Karnaphuli, Bangladesh, Water pollution, Physicochemical parameters, Bacteriological assessment, Water quality index.
Pollution of water resources by toxic chemicals and pathogenic microorganisms is a global public health concern. Rivers, lakes, ponds and other water bodies are polluted by multiple natural and anthropogenic factors including precipitation, weather, industrial and agricultural activities. Seasonal variations in temperature, precipitation, surface runoff, ground water flow, and water interception and abstraction have significant effects on river discharge, and subsequently, on the concentration of pollutants in river water. Untreated or improperly treated industrial effluents and residential wastewater also pollute waterbodies. Other anthropogenic activities such as direct discharge of fecal materials into rivers and channels contaminate river water with pathogenic microorganisms. The resulting impacts of these factors add many nutrients, toxic substances and pathogens to waterbodies. Subsequently, use of the contaminated water for drinking, household or recreational purposes greatly affects public health. Therefore, assessment of water quality is inevitable for the sake of public health and safety.
The Karnaphuli is the most important river in the Chittagong region, the second largest city of Bangladesh. Many industries and slaughterhouses are located in the city, and most of the effluents from these industries enter directly or indirectly into the Karnaphuli, often without any pretreatment. Sewage containing large amounts of nitrogen and phosphorus compounds discharged into aquatic environment is a major concern of pollution as it induces excessive algal growth and resulting eutrophication1. Presence of nitrogen and phosphorus compounds containing nutrients in river water may have adverse physiological effects on humans and may interfere with growth and reproduction of aquatic organisms. Sewage polluted water is also a significant source of epidemic threat due to the presence of disease-causing bacteria. In developing countries like Bangladesh, many latrines are connected directly to the river and the Karnaphuli is not an exception. Consequently, fecal contamination is a frequent occurrence in this river. For example, Ahmed et al2 demonstrated that the Karnaphuli water contains ~18,000 coliforms/100 ml near sewage disposal areas, which is significantly higher than the World Health Organization (WHO) standard safety levels (0/100 ml for drinking, <200/100 ml for bathing)3. This river is also the sole source of drinking and household water for a large population of this region. Therefore, pollution of the Karnaphuli is a major concern for public health and environment. Therefore, we aimed to investigate and evaluate the water quality of the Karnaphuli using several standard physicochemical and microbiological parameters.
Collection of Water Samples and sampling sites
Water samples were collected from four selected stations (Station 1 to 4) of the Karnaphuli (Fig. 1) in the winter (November 2014 to February 2015) and rainy (June 2015 to September 2015) seasons. Samples in the rainy season were collected after sufficient rainfall. All samples were collected manually following standard procedures and precautions to avoid any extraneous contamination during collection, processing, and transportation. Samples were transported to the laboratory on ice pack and preserved in the laboratory at 4°C until analysis.
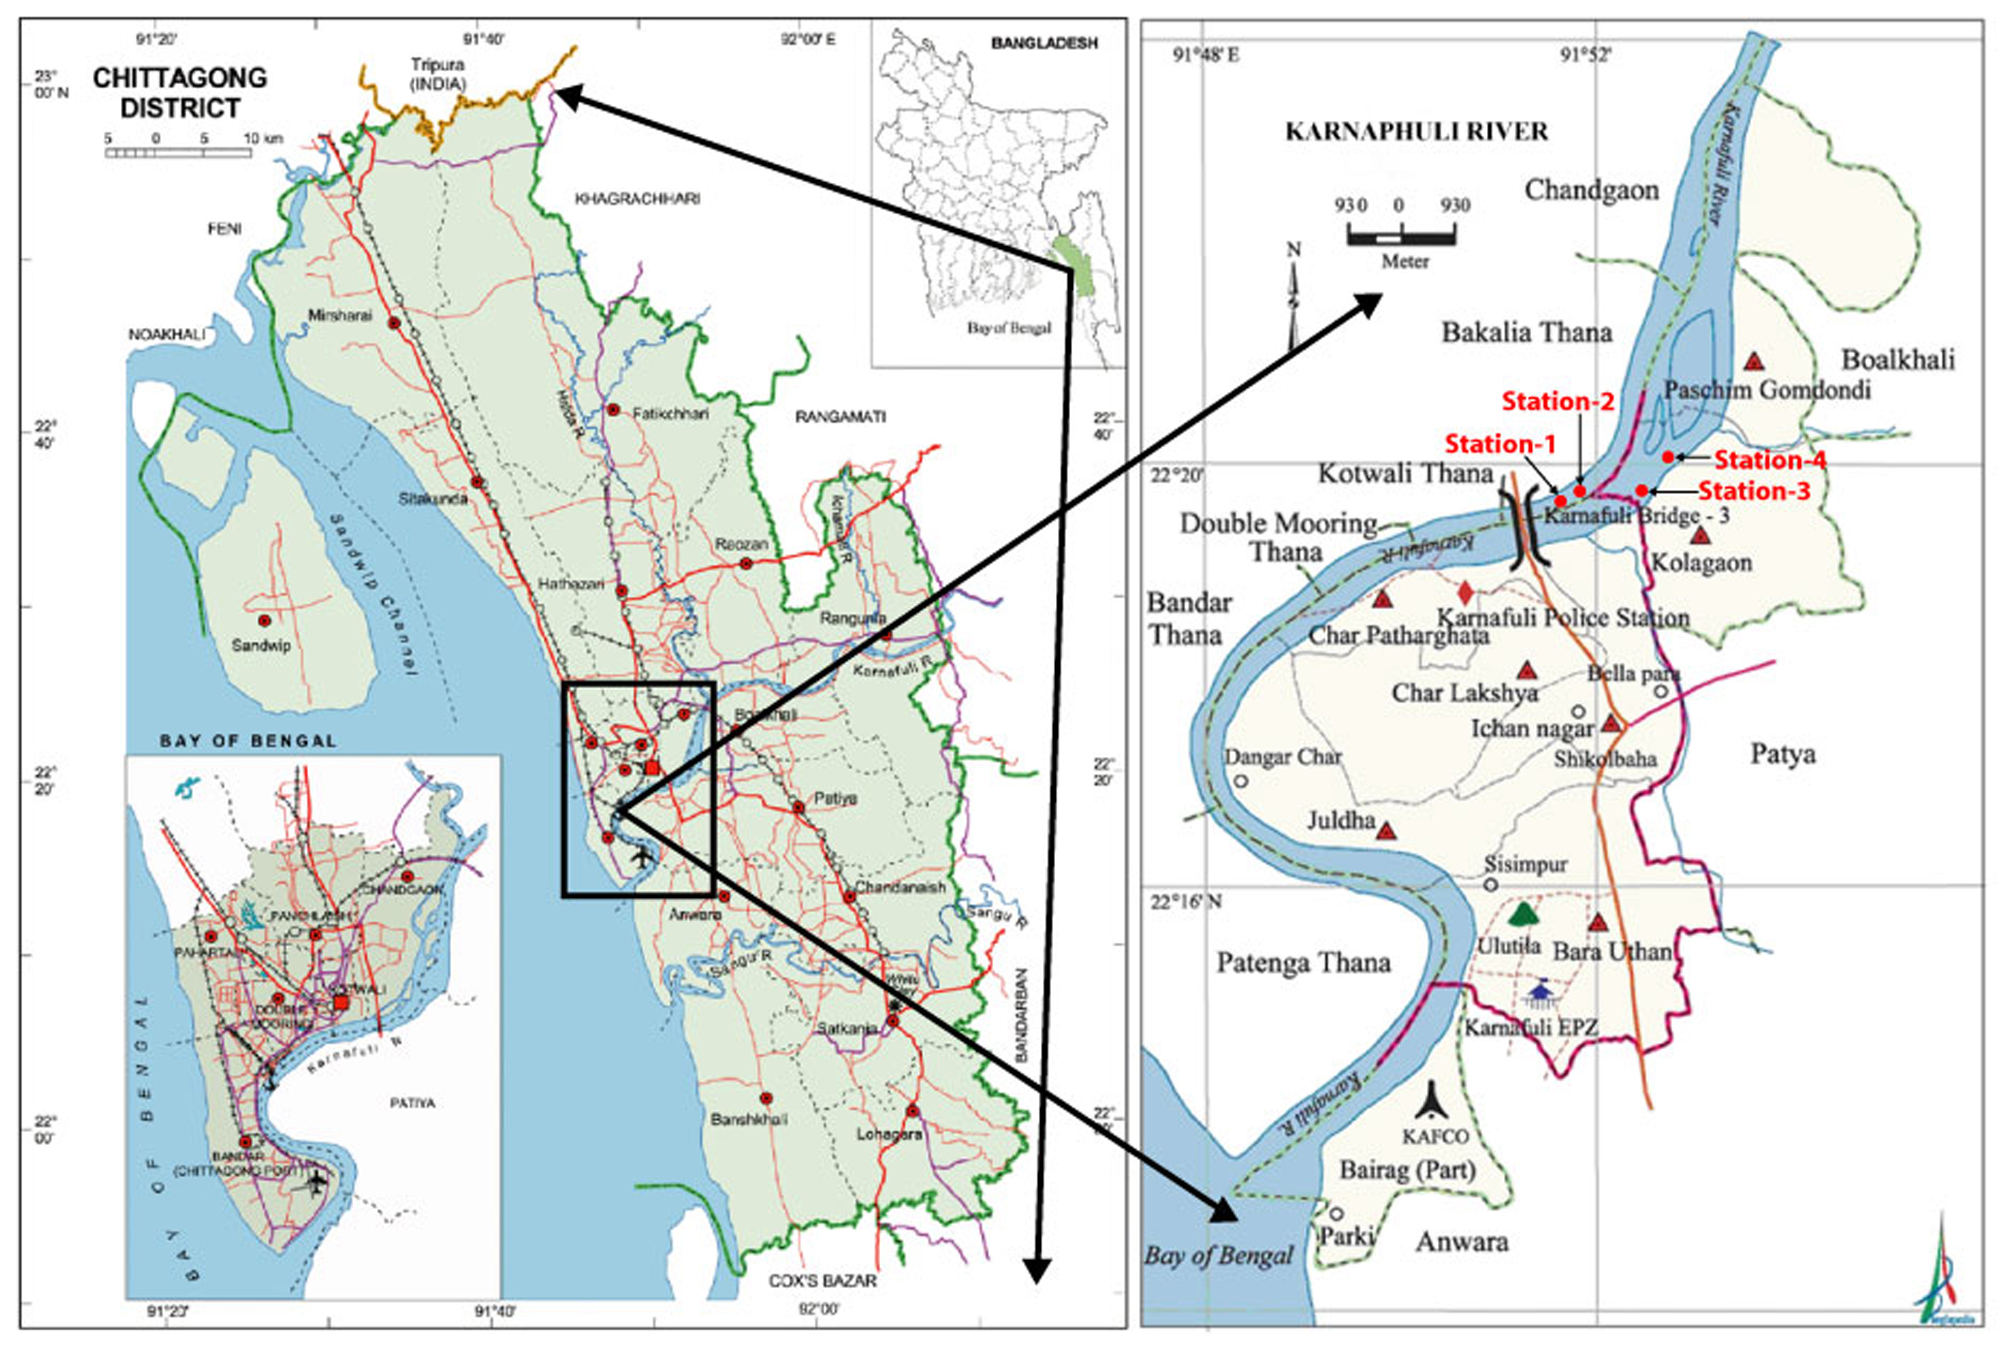
Fig. 1. Geographical location of the Karnaphuli and sampling sites. The Karnaphuli is located in the southern region of Bangladesh. Sample collection points are labeled as station 1 to 4.
Physicochemical Analysis of the Samples
Temperature and pH of each sample were recorded at the sampling sites using portable laboratory thermometer (Mercury 305 MM thermometer, Zeal, England) and pH meter (HI98107, Hanna instruments &, Germany), respectively. Electrical conductivity (EC) of the samples were measured by EC meter (EC-214, Hanna instrument Ltd. UK). Biological oxygen demand (BOD), chemical oxygen demand (COD), dissolved oxygen (DO), total dissolved solids (TDS), and total suspended solids (TSS) of the samples were analyzed in the laboratory following standard methods4-6. For statistical analysis, One-way ANOVA followed by Dunnett’s multiple comparison test was used to determine statistical significance using Graph Pad Prism (n = 3; p < 0.05).
Enumeration of Bacteria
Total heterotrophic bacteria present in the samples were determined through standard plate count (SPC) employing pour plate technique6 using nutrient agar media. The most probable number (MPN) method was employed for the enumeration of total coliform bacteria. Five tubes MPN dilutions technique using MacConkey broth media was used to count the total coliform (TC). MPN technique was also employed to estimate the fecal coliform (FC) bacteria following standard methods for the examination of water and wastewater6.
Isolation and identification of bacterial isolates
Standard microbiological methods were used for isolation. Briefly, serial dilution plating method using nutrient agar (NA) medium was used to isolate bacteria from the samples. Colonies with distinct colony morphologies were isolated, purified through repeated transfer in NA media, and preserved on NA slants. Aliquots from MPN tubes having characteristics of presence of coliform and fecal coliform bacteria were streaked on MacConkey agar, Brilliant Green agar (BGA) and Bismuth Sulfate agar (BSA) plates. Colonies showing characteristics growth of coliform and fecal coliform on the above-mentioned media were isolated and purified. Identification of bacterial isolates was done on the basis of standard cultural, morphological, physiological and biochemical characteristics. For the identification of coliform and fecal coliform bacteria, the isolates from MacConkey, BGA and BSA agar plates were subjected to standard cultural, morphological, physiological and biochemical tests. The isolates were identified up to species based on critical comparison of the observed characteristics with the description of bacterial strains given in Bergey’s Manual of Determinative Bacteriology, 8th ed7.
Water quality index (WQI)
To summarize the data recorded during our study period, water quality index was determined using the method as described by several
authors 8-11. Nine parameters (pH. BOD, COD, DO, TSS, TDS, EC, TC, and FC) were considered for calculation of water quality index.
Pollution of water bodies is a major threat to public health world wide. The Karnaphuli is the largest river in Chittagong region of Bangladesh. Majority of the industrial effluents and wastes of this region enter into this river through numerous streams and channels resulting in pollution spreading across a large area. Because a large population depends on this river for drinking and household waters causing great concern for public health. We carried out this investigation to determine the level of pollution of this river to examine its effect on public health. Many natural and anthropogenic activities including rapid urbanization, industrialization, population growth, lack of waste management etc. have greatly increased pollution of the river. We assessed the level of water pollution of this river based on several standard physicochemical and microbiological parameters.
Physicochemical analysis of the Karnaphuli river: Several standard physicochemical parameters were used to measure the pollution of surface water: pH, temperature, biological oxygen demand (BOD), chemical Oxygen demand(COD), dissolved oxygen(DO), total dissolved solids (TDS), total suspended solids(TSS) and electrical conductivity(EC). Samples were collected from four different stations in winter and rainy seasons. All samples were collected in triplicates and analyzed. The results of physicochemical parameters are presented in table 1.
Water temperature usually depends on the season, geographic location, sampling time, and temperature of effluents entering the stream (12). Temperature affects solubility of different chemical pollutants and essential elements in the water and thereby affects the toxicity of some chemicals to the living organisms in the aquatic system. Thus temperature plays crucial roles in water quality and pollution. The average temperature of the water ranged from 22°C to 30°C at different sampling sites and in the two seasons. The average temperatures in the winter and the rainy seasons were 24°C and 30°C, respectively. The observed temperatures are within the tolerable limits for aquatic organisms and thus may not adversely affect the homeostatic balance of the water ecosystem. Therefore, the factors influencing the temperature of the river including the effluents entering into the river may not adversely affect the water quality.
Table (1):
Results of Physicochemical parameters of the samples in rainy and winter seasons.
| Parameters 1991 |
Seasons | Stations | Mean | WHO Stand.(1993) | DoE (1991) | |||
|---|---|---|---|---|---|---|---|---|
| S1 | S2 | S3 | S4 | |||||
| Temperature (°C) | Rainy | 29 | 31 | 29 | 30 | 30 ± 0.9 | – | 25 |
| Winter | 23 | 26 | 25 | 25 | 24 ± 0.6 | |||
| pH | Rainy | 7.2 | 7.3 | 7.4 | 7.5 | 7.3±0.1 | 6.5 – 8.5 | 6.5 – 8.5 |
| Winter | 7.9 | 6.8 | 7.2 | 6.6 | 7.0±0.6 | |||
| BOD (mg/L) | Rainy | 5.9 | 9.7 | 4.9 | 7.8 | 7.0± 2 | 5 | ≤2 |
| Winter | 5.2 | 8.6 | 4.7 | 5.6 | 6.0±1.8 | |||
| COD (mg/L) | Rainy | 38.6 | 86.7 | 26.9 | 76.6 | 57±29 | 10 | 4 |
| Winter | 41.2 | 89.2 | 25.7 | 70.1 | 56±28 | |||
| DO (mg/L) | Rainy | 4.1 | 3.3 | 5.1 | 3.7 | 4±0.8 | 4-6 | ≥7.5 |
| Winter | 4.1 | 3.4 | 5.7 | 3.9 | 4±0.9 | |||
| TDS (mg/L) | Rainy | 1380 | 1532 | 1362 | 1514 | 1447±88 | 1000 | 500 |
| Winter | 1265 | 1497 | 1294 | 1450 | 1376±114 | |||
| TSS (mg/L) | Rainy | 916 | 991 | 811 | 965 | 920±79 | 500 | ≤25 |
| Winter | 800 | 922 | 764 | 908 | 848±78 | |||
| Conductivity (µScm-1) | Rainy | 2295 | 2499 | 2138 | 2455 | 2346±164 | 1000 | 800-1000 |
| Winter | 2161 | 2412 | 2110 | 2265 | 2237±133 | |||
Very high or low pH values are toxic to aquatic life and affect the solubility of chemical pollutants and some essential elements in the water. Therefore, extreme pH values can cause adverse effects on the river ecosystem. The mean pH of the Karnaphuliwater at the sampling sites ranged from 6.6 to 7.9. The results indicate that the water is slightly acidic to alkaline. Higher pH at some sites could be due to the presence of bicarbonates and carbonate of calcium and magnesium in the water. These chemicals may have entered into the water from urban runoff or industrial wastewater. However, the pH values are within the European Union tolerance limits (6.0-9.0) for pH in water for the support of fisheries and aquatic life (13). Our results suggest that the water is suitable for domestic, fishery, and recreational purposes with reference to pH standards.
Biological oxygen demand (BOD),chemical oxygen demand (COD), and dissolved oxygen (DO) values are frequently used to monitor water quality and level of pollution. In Karnaphuli river, the mean BOD values ranged from 4.7mg/L to 9.7 mg/L. The lowest and the highest BOD values were observed in sampling sites 3 and 2, respectively. The mean BOD values in the rainy season were higher than that of the winter season at all sampling sites. BOD values observed at two sampling sites (2 and 4) exceeded permissible limit of river water guided by WHO (3)indicating that these two sampling sites receive organic pollutants discharged from house hold and / or industrial sources. The COD values in our study ranged from 25.7 mg/Lto86.7 mg/L at different sampling sites and in the two seasons with the highest value recorded at sampling site 2.All COD values were significantly (P<0.05) higher than that of the WHO standard. These values suggest that the effluent received by the river from different sources may negatively affect the river and the overall ecosystem of the river. The BOD and COD values observed in our study were higher than those reported in a previous study (14) indicating increased pollution of the Karnaphuli river compared to previous years. The DO values in the river varied from 3.3 mg/L to 5.7 mg/Lat all sampling sites and in both seasons. No significant difference in DO values was observed between the two seasons. The DO values were lower than that of the WHO standards for river water (3). The DO values observed in our study were lower than those reported in a previous study (14) indicating that the river is more polluted than the previous years. As DO is one of the most important factor for healthy aquatic ecosystem, decreased DO values pose potential threat for various aquatic organisms including fishes. The level of dissolved oxygen is critical for maintaining oxygen balance in an aquatic ecosystem. Reduced DO levels adversely affect the aquatic environment by lowering the availability of oxygen for living organisms in the river. DO values might be reduced due to the presence the different organic and inorganic pollutants in higher concentration and due to higher temperature of water.
Electrical conductivity (EC) of the Karnaphuli river was significantly (P<0.05) different among sampling sites, varying from 2109.750 to 2498.500 µS/cm. High conductivity of all the sampling sites in both seasons indicates mixing of excessive discharge of industrial effluent from different non-point and point sources. The EC values reported in this study were significantly (P<0.0001)higher than the permissible limit of WHO (3) for river water. However, all the recorded EC values were lower than those observed by others workers (15).
Total suspended solids (TSS) and total dissolved solids (TDS) indicate the salinity behavior and the amount of other substances suspended and / or dissolved in the water. These substances affect the sunlight reaching to submerged aquatic plant and consequently reduce photosynthesis and decrease the amount of dissolved oxygen released by aquatic plants. TDS and TSS also increase water temperature by absorbing heat from sunlight and thereby reduce dissolved oxygen further (16). Mean TSS content of the river varied from~764 to ~991mg/L at different sampling sites and in the two seasons. Unlike TSS, TDS contain mineral ions including carbonate, bicarbonate, chloride, sulfate, phosphate, nitrate, calcium, magnesium, sodium, organic ions, and other ions (17). Therefore, a certain levels of TDS are essential for aquatic organisms and high levels of TDS are unfavorable for aquatic life. The mean TDS content ranged from1265.25 to 1532.25 mg/L with the highest TDS observed in S2 sampling site. The TDS values were higher than those of the WHO standards for river water(3). High TDS in water values might be due to mixing of sewerage, washing of clothes, garbage dumping etc. in addition to industrial effluents from various sources. Similar TSS and TDS values were reported a previous study (2).
Table (2):
Comparison of the physicochemical parameters with previous results (Ahmed et. al. 2010).
| Parameters | Present Study | Previous study | WHO standard (1993) | DoE (1991) | ||
|---|---|---|---|---|---|---|
| Winter | Rainy | Winter | Rainy | |||
| Temperature /°C | 24 | 30 | 19.5 | 34.3 | —- | 25 |
| pH | 7.0 | 7.3 | 6.4 | 9.7 | 6.5-8.5 | 6.5-8.5 |
| BOD/ mgL-1 | 6.0 | 7.0 | 0.2 | 9.2 | 5 | ≤ 2 |
| COD / mgL-1 | 56 | 57 | 11.4 | 179.9 | 10 | 4 |
| DO / mgL-1 | 4 | 4 | 0.00 | 7.91 | 4-6 | ≥ 7.5 |
| TDS/ mgL-1 | 1376 | 1447 | 45 | 20000 | 1000 | 500 |
| TSS / mgL-1 | 848 | 920 | 14.41 | 5100 | 500 | ≤ 25 |
| Conductivity/µScm-1 | 2237 | 2346 | 90 | 45600 | 1000 | 800-1000 |
Bacteriological analysis:
Contaminated water is a major source of infectious diseases. Because the water of the Karnaphuli is used for drinking and recreational purposes by a large population, it is important to determine the health risks the water poses. Microbiological quality of water is acritical parameter to measure health risks. (18). Surface waters often receive gut microbiota from humans and other animals and therefore disseminate the pathogens in the environment. Therefore, we tested for the presence of coliform and fecal coliform in the water. The total coliform in the water samples ranged from ~8.7× l03to ~8.2×l04/100 ml indicating that the water is highly contaminated We also found that total Coliform count in the rainy season was higher than that of the winter season. These results indicate that level of contamination increases during the rainy season, which can be attributed to excessive nutrient runoff and / or the washing off the microbes from the land during this season. Furthermore, microorganisms in the soil and air can have access to the water bodies and contamination may take place under certain unusual conditions. Seasonal variation of bacterial load is a common phenomenon (19). We also determined the level of fecal contamination by measuring the fecal coliform in the water. Fecal coliform count was found to range from ~9.2× l03 to ~9.6× l04/100mlat different sampling sites. Fecal coliform count was significantly (P<0.05) higher in the rainy season as compared to that of the winter season. The total coliform count observed throughout the study was much higher than the standard values of EQSB (20). The counts were also higher than the guideline values (5000/100 ml for river water) set by WHO (3). The results indicate that the water is highly contaminated with contamination from fecal origin. Therefore, the water of this river is risky and poses threat to public health. Our analysis also revealed that the coliform count observed in our study is higher than that of the previous study (2) indicating that microbial contamination of this river is gradually increasing. The fecal coliform counts in most of the stations were also higher than those reported by other workers (21).Thus our findings indicate that the river water is continuously being contaminated by human excreta and makes the water very offensive for drinking purposes.
Because many poor and vulnerable populations live in the surrounding areas and many of them use the river water without any treatment for subsistence, the water poses significant health risks for these people. To assess the health risks for these people, we decided to determine the presence of five common bacteria that can cause water-borne diseases using standard methods. We found all the five bacteria in the water: Escherichia coli, Pseudomonas aeruginosa, Salmonella typhi, Shigellady senteriae, and Vibrio cholerae. Occurrence of these pathogens in the Karnaphuli was also reported in previous studies (22). Presence of these pathogenic bacteria in the water indicate that the water poses significant health risks for the public health. The present study demonstrated that Karnaphuli river was heavily polluted with myriads of pollutants. Presence of such water quality indicators make the river water unsuitable for drinking and recreational purposes. A large number of people live on the bank of the river and use the river water for household and recreational purposes. The present study paved the way to further research on the river water quality and urges to take preventive measures to protect the river from devastating pollution.
Water Quality Index
WQI indicates the overall quality of water based on the values of various parameters(23).The mean WQI values obtained from our study indicated seasonal and station wise variation of water quality (Table 3 and Table 4). In both seasons, WQI values of all four stations were ≥~100 indicating that all sites were severely polluted. However, levels of pollution were found to vary among stations. More specifically, the degree of pollution in the four stations was in the order of S2>S4>S1>S3 in both seasons. The results indicate that the water is unfit for human consumption and steps must be taken to reduce pollution(Table 3 and Table 4). Although the WQI values were calculated based on several standard parameters, more parameters could be included to determine the water quality. However, the parameters used in our study are the most common ones and thus the WQI values reflect the level of pollution to a great extent. Compared to the previous study carried out in 2010, the level of pollution is higher. This might be due to accumulation of pollutants over the years, increase of industrial and agricultural activities, and disposal of untreated sewage to the river. The sample collection sites in our study are also different from the previous study. We collected samples from sewage disposal points whereas the previous researchers collected samples from other locations away from the sewage disposal points.
Table (3):
Water quality indices for the Karnaphuli river during rainy season.
| Parameters | Water quality ratings | Unit weights (wi) | Water quality indices (qiwi) | ||||||
|---|---|---|---|---|---|---|---|---|---|
| S1(qi) | S2(qi) | S3(qi) | S4(qi) | S1(qiwi) | S2(qiwi) | S3(qiwi) | S4(qiwi) | ||
| pH | -40 | -60 | -80 | -100 | 0.2449 | -9.80 | -14.70 | -19.60 | -24.49 |
| BOD | 118.0 | 194 | 98 | 156 | 0.3184 | 37.57 | 61.76 | 31.20 | 49.66 |
| COD | 386 | 867 | 269 | 766 | 0.1592 | 61.44 | 138.01 | 42.82 | 121.93 |
| DO | 122.1 | 131.4 | 110.5 | 126.7 | 0.2653 | 32.39 | 34.85 | 29.30 | 33.63 |
| TDS | 276 | 306.4 | 272.4 | 302.8 | 0.0032 | 0.88 | 0.98 | 0.87 | 0.96 |
| TSS | 183.2 | 198.2 | 162.2 | 193 | 0.0032 | 0.58 | 0.63 | 0.52 | 0.61 |
| EC | 229.5 | 249.9 | 213.8 | 245.5 | 0.0016 | 0.37 | 0.40 | 0.34 | 0.39 |
| TC | 780 | 1640 | 260 | 920 | 0.0003 | 0.25 | 0.52 | 0.08 | 0.29 |
| FC | 6000 | 24000 | 2450 | 4500 | 0.0040 | 23.88 | 95.51 | 9.75 | 17.91 |
| WQI | 147.6 | 318 | 95.3 | 201 | |||||
Table (4):
Water quality indices for the Karnaphuli river during winter season.
| Parameters | Water quality ratings | Unit weights (wi) | Water quality indices (qiwi) | ||||||
|---|---|---|---|---|---|---|---|---|---|
| S1(qi) | S2(qi) | S3(qi) | S4(qi) | S1(qiwi ) | S2(qiwi) | S3(qiwi) | S4(qiwi) | ||
| pH | -180 | 40 | -40 | 80 | 0.2449 | -44.08 | 9.80 | -9.79 | 19.59 |
| BOD | 104 | 172 | 94 | 112 | 0.3184 | 33.11 | 54.76 | 29.92 | 35.66 |
| COD | 412 | 892 | 257 | 701 | 0.1592 | 65.58 | 142 | 40.91 | 111.59 |
| DO | 122.1 | 130.2 | 103.5 | 124.4 | 0.2653 | 32.39 | 34.6 | 27.45 | 33.01 |
| TDS | 253 | 299.4 | 258.8 | 290.1 | 0.0032 | 0.81 | 0.95 | 0.82 | 0.92 |
| TSS | 160 | 184.4 | 152.8 | 181.7 | 0.0032 | 0.51 | 0.59 | 0.49 | 0.58 |
| EC | 216.1 | 241.2 | 211 | 226.5 | 0.0016 | 0.34 | 0.38 | 0.33 | 0.36 |
| TC | 500 | 1340 | 174 | 660 | 0.0003 | 0.16 | 0.43 | 0.06 | 0.21 |
| FC | 4500 | 19250 | 2300 | 3750 | 0.0040 | 17.91 | 76.60 | 9.15 | 14.92 |
| WQI | 106.7 | 320.1 | 99.3 | 216.8 | |||||
Water quality Index (WQI)was calculated using the formula
WQI = ∑QiWi
Where, Qi (water quality rating)= 100 × (Va-Vi)/(Vs-Vi);
Va= actual value present in the water sample;
Vi= ideal value (0 for all parameters except pH and DO which are 7.0 and 14.6 mg-1 respectively);
Vs= Standard value.
If quality rating Qi= 0 means complete absence of pollutants
While 0<Qi<100 implies that the pollutants are prescribed standard.
When Qi> 100 implies that the pollutants are above the standards.
Wi (Unit weight) = K/Sn
Where K (constant) = 1/(1/Vs1+1/Vs2+1/Vs3+1/Vs4……………+1/Vsn)
Sn= ‘n’ number of standard values.
This study was carried out to assess the water quality of the Karnaphuli river in Bangladesh to determine the risks for public health and safety. Our results indicate that the water is highly contaminated with toxic chemicals and microorganisms. We also showed that water pollution has increased significantly compared to previous years. Furthermore, this study indicates that the water is unsafe for drinking, household, or recreational purposes. The main sources of pollution of this river are sewage discharges, industrial pollutants, city run-off, domestic wastes, and anthropogenic activities. Therefore, proper steps must be taken to prevent further deterioration of water pollution to reduce risks for public health.
ACKNOWLEDGMENTS
The authors like to convey their thanks to the University Grants Commission of Bangladesh and the University of Chittagong, Bangladesh for financial support.
- (Christensen and Pope 1997)- Christensen, V. G., and Pope, L. M. (1997). Occurrence of dissolved solids, nutrients, atrazine, and fecal coliform bacteria during low flow in the Cheney Reservoir watershed, south-central Kansas, 1996. U.S. Geological Survey Water-Resources Investigations Report, 97-4153, 13 p.
- Ahmed, M.J., Haque, M. R., Ahsan, A., Siraj, S., Bhuiyan, M. H. R., Bhattacharjee, S.C. and Islam, S. (2010). Physicochemical Assessment of Surface and Groundwater Quality of the Greater Chittagong Region of Bangladesh. Pak. J. Anal. Environ. Chem, 11(2), 1 – 11
- W.H.O. (1993). Guidelines for drinking water quality. World Health Organization, Geneva, Switzerland.
- Manivasakam, N. (1987). Industrial Effluents. Origin, characteristics, effects, analysis and treatment. (4th Edition.), Sakthi publications, Coimbatore, 267-333
- Saxena, M.M. (1994). Environmental Analysis – water, soil and air. Agro Botanical Publishers (India), 2nd Edition, 4-86, 121-125
- A.P.H.A (1998). Standard methods for the examination of water and wastewater. (20th edition). American public health Association, American water works association, Water environment federation, Washington DC
- Buchanan, R. E., Gibbons, N. E. and Cowan, R. R. (1974). Bergey’s manual of determinative bacteriology. (8thed). The Williams of Wilkins Co. Baltimore.
- Tiwari, T. N., & Ali, M. (1988). Water quality index for Indian rivers. In R. K. Trivedy (Ed.), Ecology and pollution in Indian rivers (pp. 271–286). New Delhi: Ashish Publishing House.
- Mohanta, B. K. and Parta, A. K. (2000). Studies in the water quality index of river Sanamachhla Kananda at Keonjargarh at, Orissa, India. Pollut. Rex., 19, 377-385
- Kesharwani, S., Mandoli, A.K. and Duke, K.K. (2004). Determination of water quality index (WQI) of Amkhera pond of Jabalpur city (M.P). Nit.J.Life Sci.,1, 61-66
- Padmanabha, B. and Bengali, S.L. (2005). Comparative study of water quality index of fur lakes in the mysore city. IJEP, 25,873-876
- Ahipathi, M.V., Puttaiah, E.T. (2006). Ecological Characteristics of Vrishabhavathi River in Bangalore (India). Environmental Geology,49, 1217-1222
- D.W.A.F. (1996). South African Water Quality Guidelines. (2nd Edition), Volume 7: Aquatic Ecosystems. Department of Water Affairs and Forestry, Pretoria.
- Islam, M. N., Ahmed, J. M., Hossain A. and Seraj, S. Physicochemical assessment of water pollutants due to ship breaking activities and its impact on the coastal environment of chittagong-Bangladesh, Eur. Chem. Bull., 2013; 2(12): 1053-1059
- Sarwar, M. I., Majumder, A.K., Islam, M. N. Water quality parameters: A case study of Karnafully river Chittagong, Bangladesh. Bangladesh J.Sci. Ind. Res., 2010; 45(2): 177-181.
- Mitchell and Stapp. Field manual for water quality monitoring 1992.
- Mahananda, M.R. Physicochemical analysis of surface water and ground water of Bargarsh District, Orissa,India. International Journal of Research and Review in Applied Sciences, 2010; 2(3): 284-295
- NHMRC, NRMMC. Australian drinking water guideline 6– version 2.0. Canberra: National Health and Medical Research Council and Natural Resource Management Ministerial Council 2013.
- Ajibade, W. A., Ayodele, I. A. and Agbede, S. A. Microbiological Characteristics of Waters in the Major Rivers in Kainji Lake National Park. African Journal of Environmental science and Technology, 2008; 2(8): 208-216.
- E.Q.S.B. (Environmental Quality Standard for Bangladesh). Department of Environment, Government of the People’s Republic of Bangladesh 1991.
- Islam, N. M. Study on the pollution indicating bacteria in the brackish water environment with reference to Karnafully river estuary. Unpublished M. Sc. thesis, Institute of Marine Sciences, Chittagong University, Chittagong, Bangladesh 1998.
- Alam, M.W. Microbial species diversity and hydrological effects on their occurrence at Karnaphuli River estuary. Agricultural Science Research Journal, 2013; 3(6): 158- 166.
- Khan, F., Husain, T. and Lumb, A. water quality evaluation and trend analysis in selected watersheds of the Atlantic region of Canada. Environ. Monit. and Assess., 2003; 88: 221-242.
© The Author(s) 2017. Open Access. This article is distributed under the terms of the Creative Commons Attribution 4.0 International License which permits unrestricted use, sharing, distribution, and reproduction in any medium, provided you give appropriate credit to the original author(s) and the source, provide a link to the Creative Commons license, and indicate if changes were made.