ISSN: 0973-7510
E-ISSN: 2581-690X
Pectinases (EC 3.2.1.15) are a class of enzymes that catalyze the depolymerization or de-esterification reactions that degrade pectic substances. In the present study, we have isolated the Aspergillus niger strain from soil samples, in India and evaluated pectinase production. The highest pectinase producing A. niger strain was further evaluated and optimized with various agricultural wastes. Plackett-Burman design (PBD) and Central composite design ‘(CCD)’ were used to determine the best parameters for maximum pectinase production. Pectinase activity was increased to 99.21 U/ml after optimizing the production medium using PBD and CCD statistical analysis. A positive correlation of pectinase activity between predicted (112.65 U/ml) and experimental (99.21 U/ml with SD=0.005) optimum was observed. Maximum pectinase was produced by A. niger under submerged fermentation, utilizing orange peel, which is a cost-effective, adaptable, and environmentally friendly approach. The partially purified pectinase showed significant application for apple juice clarification and showed the ability to degrade pectin and therefore the colour change was observed in apple juice within 120 min. Maximum pectinase was produced by A. niger using agricultural waste orange peel under submerged fermentation which is an economical, versatile and eco-friendly process and pectinase showed a significant application for apple juice clarification.
Plackett-Burman Design (PBD), Central Composite Design (CCD), Orange Peel, Pectin, Pectinase
Pectinase is a group of an enzyme, that appeared as the most important enzyme, with the ability to degrade the pectin by depolymerization and de-esterification reactions, the foremost sources for enzymes are microorganisms and plants but from a commercial point of view, as compared to plants, microorganisms like fungi, bacteria and yeast are major sources.1 Industrially significant enzymes like pectinases are extensively being used in the food industry for instance to improve the production of fruit juices, fruit texture, enzymatic peeling of fruits2 fruit juice clarification and wine also.3 The most frequently used fungi for the production of pectinases are species of Aspergillus, Rhizopus and Penicillium.4 Most cost-effective pectinases are produced by filamentous fungi, principally of the genus Aspergillus because these fungi recommended the benefit of secreting 90% of enzymes in culture medium and which are frequently used for clarification of fruit juices.5 In the whole global food enzyme market, pectinase brings up about 25%.6 Pectinases are significantly produced by some fermentation methods like semi solid and submerged, these fermentations specifically carried out by the fungi which belonging to the genus Aspergillus.7 In the world, citrus is the most copious crop and most important byproduct of industries of orange processing is orange peel, making about 50% of fresh fruit weight.8 The enzymatically treated fruit peel releases phenolic content9, phenolic constituents which released from fruit peels have a noteworthy antioxidant capacity.10 Orange peel contains several high-value products like fibers (pectin, lignin, cellulose and hemicellulose), proteins, pectin and flavonoids for the production of many pharmaceutical and nutraceutical products while sugars are generally used for bioethanol production.11 Response surface methodology ‘through CCD’ is a functional statistical analysis performed for multiple regression using assessable data.12 CCD has been effectively being used for optimizing growth medium and culture conditions for maximum pectinase production.13 In the present study, A. niger showed maximum pectinase production under optimized production medium by statistical analysis such as PBD and CCD. Furthermore, partially purified enzymes were also evaluated for their applications in apple juice clarification. The commercial, versatile and eco-friendly submerged fermentation process was employed for pectinase production by A. niger by utilizing agricultural waste material like orange peel as a substrate and carbon source.
Collection of Samples
Soil samples were collected from agricultural and vegetable waste dump from Onjal (Navsari) Gujarat, India. All sampling was done as per the standard biological protocols.
Isolation of Pectinolytic Fungal Isolates
Isolation of fungi from the soil samples was performed as per the method suggested by Ramchandran and Kurup, 2013.14 Briefly, 1 gram of each soil sample was taken and homogenized in sterile distilled water and 10 fold serial dilutions were prepared. From 10-5, 10-6, and 10-8 dilutions, 0.1 ml of aliquot was inoculated on previously prepared Pectic Agar (PAM) [Composition (g/L): ‘Pectin. 5.00’, ‘K2HPO4. 0.50’ ‘MgSO4.7H2O 0.10’, ‘NaCl. 0.20’, ‘CaCl2 . 2H2O 0.20’, ‘FeCl3 . 6H2O 0.01’, ‘yeast extract. 1.00’, and ‘agar. 20.00 g’, containing pectin. Thus, prepared agar plates were inoculated and for 7 days, these plates were incubated at 28°C. Isolated colonies were subcultured and preserved at 4°C for further analysis.
Screening of Pectinolytic Fungal Isolates
Isolated fungal cultures were inoculated on pectic agar medium for the rapid screening of pectinase production. The inoculated plates were incubated at 28°C for 48 to 72 h. After completion of the incubation period, plates were flooded with freshly prepared potassium iodide solution15, and the colour change of the medium to translucent halo region around the colony showed pectin degradation with pectinolytic activity during spot inoculation method.
Molecular Identification of Aspergillus niger
For molecular characterization, DNA was isolated in pure form from F-1 fungal culture. Its quality was evaluated with 1.0% agarose gel. For Internal transcribed spacer (ITS) amplicon sequencing, the ITS gene was amplified using ITS primers. The ITS gene sequence was used to carry out BLAST with the NCBI GenBank database. Based on the maximum identity score, the first ten sequences were selected and aligned using multiple alignment software programme ‘ClustalW’ for the study of phylogenetic tree.
Submerged and solid-state fermentation
Different agricultural wastes such as orange peel, banana peel and rice bran (in a dried form) were used for a solid-state fermentation while apple juice was submerged for pectinase production by A. niger. During solid-state fermentation, about 10 g of solid agricultural wastes and micronutrients like KH2PO4, 0.2; MgSO4, 0.1; FeSO4, 0.1; MnSO4, 0.01 g/L were added and inoculated with 1 ml spore suspension of A. niger (1×10³ spores/ml) followed by incubation at 28°C for 5 to 7 days. Submerged fermentation was performed by using a 250 ml Erlenmeyer flask containing apple pulp (quantity of pulp) and inoculated with A. niger as described above at 28°C on a rotary shaker for 7 days.
Pectinase Assay and Total Protein Estimation
Pectinase activity was determined by the 3,5-Dinitrosalicylic acid (DNSA) method. A standard graph of galacturonic acid (R2 = 0.99) was used for calculations of pectinase activity and estimation of liberated reducing sugar8, in 24 h time interval, absorbance was measured at 540 nm. Total protein content was estimated by Lowery’s method. One unit of enzyme activity was defined as the amount of enzyme that catalyzes the formation of 1 µmol of galacturonic acid per minute under the specified assay conditions.
Selection of Significant Factors by PBD
In the present investigations, improvement of enzyme activity was performed using engineering of production medium in a submerged fermentation using statistical PBD.16 Medium components were screened by PBD and all experiments were performed by statistical software MINITAB 2019. Seven different variables were evaluated in twelve combinations. Orange peel, yeast extract and other physical parameters like pH, temperature, incubation time, inoculums size and agitation speed were implied as A to G correspondingly. Each independent variable was investigated at the two levels (high and low concentrations/values). A total of 12 experimental runs were performed in triplicates and the average (± standard deviation) of pectinase activity (U/ml) was considered as the final response (Table 1). Pectinase production (U/ml) was calculated on the basis of effect of every momentous variable on pectinase production. The recommended model is represented by a first-order polynomial equation which is as follows:
‘Y’ = β0 + Ʃ βi Xi (i = 1…….k)
In the above-mentioned equation, Y is the predicted response of pectinase production (U/ml). β0 is a constant, β1 is the regression coefficient, Xi is independent variables which are coded as A, B, C, D, E, F and G and k is a number of variables.
Ccd Statistical Analysis for Optimization of Pectinase Production from Aspergillus niger
Response surface methodology through CCD was used to obtain the optimum values of significant factors obtained from the PB design. The interactive effect of main variables and their optimum levels was analyzed using response surface methodology through CCD.17 The significant variables founded on the low p-value (<0.05) for pectinase activity were responsible for influencing pectinase production viz. pH, orange peel, agitation speed and yeast extract selected from the trials of PBD were considered for the next statistical analysis CCD. Coding levels and experimental range of significant variables for CCD are mentioned in Table 3. Experimental design or factorial design of CCD consists of 31 experimental runs with 4 significant factors (<0.05), 1 block, 3 replicates with total 93 runs. The composition of production medium, culture conditions, fungal spore inoculation, and extraction of samples for analysis of pectinase activity were the same as mentioned above for Plackett- Burman trials.
The following multiple regression equation was used to fit the second-order polynomial equation based on the experimental data.
‘Y’ = β0 + β1A + β2B+ β3C+ β4G+ β11AA+ β22 BB+ β33CC+ β44 GG+ β12AB+ β13AC+ β14AG+ β23BC + β24BG+ β34CG, where Y is the predicted response, β0, is the model intercept, β1, β2, β3, β4, β11, β22, β33, β44 and β12, β13, β14, β23, β24 and β34 are linear quadratic and interaction coefficients respectively, and A, B, C and G are the independent variables. All the experiments were conducted in triplicates to entree constancy of results in terms of pectinase activity (U/ml). Statistical and numerical analyses were carried out using the software MINITAB 2019 (Minitab Inc., USA). The supremacy of this statistical model was determined by analysis of variance (ANOVA) and by R2 and predicted R2.
Experimental Validation of Statistical Model CCD
To approve the accuracy of the statistical model, an experiment was carried out in 500ml flask by 100 ml of the improved medium. Pectinase activity was checked at 24 h time intervals (24 to 120 h) while total protein content was checked simultaneously. Validation of statistical model CCD was approved by yielding optimized values of CCD for maximum pyrrolnitrin (PRN) secretion.18
Partial Purification of Pectinase
The partial purification of pectinase was performed by ammonium sulphate precipitation method. “Pectinase activity and total protein content of partially purified enzymes were estimated according to the method suggested by Klug-Santner et al.11 After that, fold purification of pectinase was calculated using the formula mentioned below.
Fold purification = Final specific activity / Initial specific activity
Application of Pectinase for Fruit Juice Clarification
The apple juice was prepared by using apple pieces and distilled water to the ratio of 1:2 (w/v). Supernatant was collected by centrifugation at 3000 rpm and 1 ml of partially purified pectinase was added to test and control samples. Juice clarification was checked by visual observation and spectrophotometer at 660 nm. After the clarification of juice, the properties of experimental apple juice like pH, solubilized solids and titrable acidity were compared with control and commercially available apple juice.
Isolation and Rapid Screening of Pectinolytic Fungi
A total of 20 fungal isolates were isolated from agricultural and vegetable waste dump soils. Out of which 4 fungal isolates showed pectinolytic ability. In this investigations, fungal strain F-1 showed a maximum zone of clearance (15.3 mm) at a concentration of 6% (w/w) of pectin and absence of glucose in the medium.7 Pectinase production was carried out by cultivation of 5 days old cassava based staple meal known as ‘Eba’ on potato dextrose agar to obtain A. niger.19 For pectinase production by A. niger-ATCC 16404, pure culture of A. niger was prepared by mixed it with 25 ml of sabouraud broth.20
Molecular Identification of A. niger
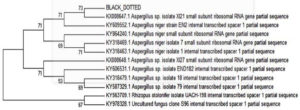
Based on microscopic, colony characteristics and molecular characterization, the fungal strain F-1 was confirmed as A. niger. Furthermore, morphologically confirmed A. niger strain was further confirmed with molecular identifications using ITS region of the fungi. A single PCR amplification was observed at 550 bp of when resolved onto 1% agarose gel electrophoresis. A. niger strain was showed 100% sequence similarity with A. niger. Based on nucleotide homology and phylogenetic analysis, we confirmed it as A. niger (Figure 1).
Pectinase Activity
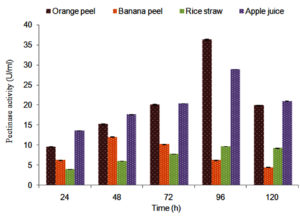
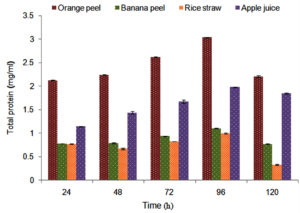
A. niger showed maximum pectinase activity (36.39 ± 0.01 U/ml) in presence of orange peel (Figure 2) than other agricultural substrates therefore this substrate was selected for further study. Pectinolytic microbial strain PJ02 showed the highest ability for exo-pectinase (26.8 ± 0.005 U/ml) production8 while a significant amount of the extracellular pectinase was produced by Penicillium spp. under submerged fermentation process.21 A. niger also showed maximum total protein content (3.035 ± 0.001 mg/ml) in presence of orange peel in 96 h of time interval (Figure 3).
Figure 2. Amount of pectinase released by Aspergillus spp. in presence of agricultural waste substrates and apple pulp
Figure 3. Amount of total proteins released during pectinase production by Aspergillus spp. in presence of agricultural substrates and apple pulp
Plackett- Burman Design
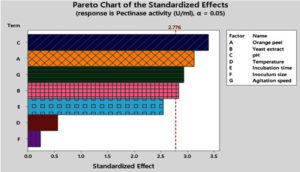
The PBD effect of seven variables on maximum pectinase production by A. niger was analyzed in 12 experimental runs with two levels of each variable as described in Table 1. The experimental responses in the form of pectinase production for various combinations of variables are represented in Table 1. The Pareto chart demonstrates the order of significance of significant variables affecting pectinase production by A. niger (Figure 4). The variables viz. pH, orange peel, agitation speed and yeast extract were found to be most significant for pectinase production as indicated by p-value < 0.05. The appropriateness of any pectinase producing microbial strain for industrial appliances depends on the pectinase yield. Among the seven variables, four variables i.e pH (p = 0.027); orange peel (0.035); agitation speed (0.043) and yeast extract (0.047) showed positive effects with p-value < 0.05 (Table 4) entailing that the model was significant. These four factors were substantial at the 0.05 α level and on the basis of slopes of the line of each pane on the plots, the other three aspects i.e. temperature, incubation time and inoculum size resulted as non-significant factors with p-value > 0.05 as shown in Table 4. Based on regression coefficient values of responses (Table 2).
Table (1):
Pectinase activity by Aspergillus spp. as function of independent factors per the Plackett-Burman design in random order.
No. of run |
Orange peel (g/L) |
Yeast extract (g/L) |
pH |
Temperature (°C) |
Incubation time (h) |
Inoculum size (spores/ml) |
Agitation speed (rpm) |
Pectinase activity (U/ml) |
|---|---|---|---|---|---|---|---|---|
1 |
11 |
0.5 |
4.5 |
25 |
144 |
1×10⁴ |
120 |
63.72±0.33 |
2 |
11 |
1.5 |
4.5 |
35 |
144 |
1×10² |
120 |
79.18±0.92 |
3 |
09 |
0.5 |
6.5 |
35 |
144 |
1×10² |
120 |
72.00±0.29 |
4 |
09 |
0.5 |
4.5 |
35 |
144 |
1×10⁴ |
80 |
45.32±0.92 |
5 |
09 |
1.5 |
4.5 |
25 |
96 |
1×10⁴ |
120 |
60.00±2.15 |
6 |
11 |
0.5 |
6.5 |
35 |
96 |
1×10⁴ |
80 |
60.70±0.97 |
7 |
11 |
0.5 |
6.5 |
25 |
96 |
1×10² |
120 |
74.67±0.41 |
8 |
09 |
1.5 |
6.5 |
25 |
144 |
1×10² |
80 |
71.00±1.91 |
9 |
11 |
1.5 |
6.5 |
25 |
144 |
1×10⁴ |
80 |
77.41±0.14 |
10 |
09 |
0.5 |
4.5 |
25 |
96 |
1×10² |
80 |
20.22±0.95 |
11 |
11 |
1.5 |
4.5 |
35 |
96 |
1×10² |
80 |
60.70±0.68 |
12 |
09 |
1.5 |
6.5 |
35 |
96 |
1×10⁴ |
120 |
64.22±0.27 |
Figure 4. Pareto chart showing the order of significance of the variables affecting pectinase production by Aspergillus spp. Standardized effect value of all four variables >2.776 is disclosed to be very significant for the PBD
pH (7.57); orange peel (6.97); agitation speed (6.54); yeast extract (6.32) and values of effect; pH (15.14); orange peel (13.94); agitation speed (13.07) and yeast extract (12.65), these four significant factors showed a positive influence on pectinase production by Aspergillus niger and consequently these four factors were selected for CCD while remaining three factors temperature, incubation time and inoculum size which showed maximum p-value, minimum regression coefficient and effect, therefore taken in low-level for succeeding experiment.
Table (2):
Student test (t-test) results of Plackett-Burman design for screening variables for maximum pectinase production by Aspergillus spp. (R2 = 91.80% and R2 (adj) = 77.45%).
Variable code |
Variable |
Effect |
Coefficient |
t-value |
p-value |
|---|---|---|---|---|---|
A |
Orange peel (g/L) |
13.94 |
6.97 |
3.12 |
0.035* |
B |
Yeast extract (g/L) |
12.65 |
6.32 |
2.84 |
0.047* |
C |
pH |
15.14 |
7.57 |
3.40 |
0.027* |
D |
Temperature (°C) |
2.52 |
1.26 |
0.56 |
0.603 |
E |
Incubation time (h) |
11.35 |
5.68 |
2.55 |
0.064 |
F |
Inoculum size |
-1.07 |
-0.53 |
-0.24 |
0.823 |
G |
Agitation speed (rpm) |
13.07 |
6.54 |
2.93 |
0.043* |
(*, Values are significant at p<0.05)
Table (3):
Central composite design (CCD) experiment in random order for four significant variables.
Run |
‘C’ pH |
‘A’ Orange peel (g/L) |
‘G’ Agitation speed (rpm) |
‘B’ Yeast extract (g/L) |
Pectinase activity (U/ml) |
Predicted pectinase activity (U/ml) |
|---|---|---|---|---|---|---|
1 |
5.5 |
10 |
100 |
1.0 |
71.20±0.24 |
68.40 |
2 |
5.5 |
10 |
100 |
1.0 |
70.82±0.24 |
68.40 |
3 |
5.5 |
10 |
60 |
1.0 |
41.50±0.35 |
40.69 |
4 |
6.5 |
11 |
120 |
1.5 |
93.14±0.33 |
95.98 |
5 |
4.5 |
11 |
120 |
1.5 |
54.82±0.35 |
61.63 |
6 |
6.5 |
09 |
80 |
0.5 |
10.14±0.08 |
5.94 |
7 |
4.5 |
09 |
80 |
1.5 |
18.20±0.21 |
24.70 |
8 |
4.5 |
09 |
80 |
0.5 |
12.46±0.27 |
20.61 |
9 |
4.5 |
11 |
120 |
0.5 |
58.62±0.52 |
71.80 |
10 |
5.5 |
12 |
100 |
1.0 |
102.92±0.08 |
96.77 |
11 |
6.5 |
11 |
80 |
0.5 |
62.80±0.17 |
65.11 |
12 |
5.5 |
10 |
100 |
1.0 |
68.88±0.20 |
68.40 |
13 |
5.5 |
10 |
100 |
0.0 |
48.12±0.74 |
45.32 |
14 |
5.5 |
10 |
100 |
1.0 |
65.76±0.06 |
68.40 |
15 |
6.5 |
09 |
80 |
1.5 |
36.18±0.64 |
33.99 |
16 |
4.5 |
09 |
120 |
0.5 |
26.33±0.23 |
30.47 |
17 |
5.5 |
10 |
100 |
1.0 |
69.12±1.14 |
68.40 |
18 |
5.5 |
10 |
100 |
1.0 |
66.54±0.75 |
68.40 |
19 |
7.5 |
10 |
100 |
1.0 |
39.43±0.72 |
45.82 |
20 |
6.5 |
11 |
80 |
1.5 |
86.07±0.22 |
84.54 |
21 |
4.5 |
11 |
80 |
0.5 |
58.62±0.52 |
55.94 |
22 |
5.5 |
08 |
100 |
1.0 |
12.36±0.26 |
4.88 |
23 |
6.5 |
11 |
120 |
0.5 |
86.07±0.22 |
82.18 |
24 |
4.5 |
11 |
80 |
1.5 |
42.58±0.26 |
51.40 |
25 |
5.5 |
10 |
100 |
2.0 |
74.03±0.21 |
63.20 |
26 |
3.5 |
10 |
100 |
1.0 |
46.16±0.97 |
26.15 |
27 |
4.5 |
09 |
120 |
1.5 |
20.24±0.27 |
28.92 |
28 |
5.5 |
10 |
100 |
1.0 |
66.54±0.75 |
68.40 |
29 |
6.5 |
09 |
120 |
0.5 |
14.83±0.25 |
17.00 |
30 |
6.5 |
09 |
120 |
1.5 |
34.12±0.37 |
39.41 |
31 |
5.5 |
10 |
140 |
1.0 |
74.8±0.58 |
61.98 |
Table (4):
Analysis of variance (ANOVA) of response surface methodology as per second order polynomial equation for maximum pectinase production by Aspergillus spp.
Source of variation |
SS |
DF |
MS |
F-value |
P-value prob>F |
|---|---|---|---|---|---|
Model* |
18331.5 |
14 |
1309.4 |
14.49 |
< 0.001 |
Linear* |
14405.4 |
4 |
3601.4 |
39.85 |
< 0.001 |
pH |
580.4 |
1 |
580.4 |
6.42 |
0.022* |
Orange peel (g/L) |
12665.7 |
1 |
12665.7 |
140.16 |
< 0.001 |
Agitation speed (rpm) |
679.7 |
1 |
679.7 |
7.52 |
0.014* |
Yeast extract (g/L) |
479.7 |
1 |
479.7 |
5.31 |
0.035* |
Square |
2639.3 |
4 |
659.8 |
7.30 |
0.002* |
pH*pH |
1878.8 |
1 |
1878.8 |
20.79 |
< 0.001 |
Orange peel (g/L)*Orange peel |
552.2 |
1 |
552.2 |
6.11 |
0.025* |
Agitation speed (rpm)* Agitation speed (rpm) |
520.6 |
1 |
520.6 |
5.76 |
0.029* |
Yeast extract (g/L)*Yeast extract (g/L) |
357.5 |
1 |
375.5 |
3.96 |
0.064 |
2-Way Interaction |
1286.8 |
6 |
214.5 |
2.37 |
0.078 |
pH*Orange peel (g/L) |
568.8 |
1 |
568.8 |
6.29 |
0.023* |
pH*Agitation speed (rpm) |
1.5 |
1 |
1.5 |
0.02 |
0.901 |
pH*Yeast extract (g/L) |
574.3 |
1 |
574.3 |
6.36 |
0.023* |
Orange peel (g/L)*Agitation speed (rpm) |
36.1 |
1 |
36.1 |
0.40 |
0.536 |
Orange peel (g/L)* Yeast extract (g/L) |
74.3 |
1 |
74.3 |
0.82 |
0.378 |
Agitation speed (rpm)*Yeast extract (g/L) |
31.8 |
1 |
31.8 |
0.35 |
0.562 |
Error |
1445.8 |
16 |
90.4 |
||
Lack-of-fit* |
1417.5 |
10 |
141.7 |
30.02 |
< 0.001 |
Pure Error |
28.3 |
6 |
4.7 |
||
Total |
19777.3 |
30 |
p values are significant at p < 0.05
Where, SS: Sum of squares; DF: Degree of freedom; MS: Mean sum of squares; F: Fishers’s function; p, Level of significance R-squares, 92.69%; Adjusted R-squares, 86.29%
Table (5):
Properties of experimental and commercial apple juice samples.
Parameters |
Commercial apple juice |
Experimental test sample (treated) |
|---|---|---|
pH |
3.5±0.02 |
3.8±0.01 |
Total soluble solid |
6.8±0 |
7.1±0.1 |
Titrable acidity |
8.16±0.02 |
7.46±0.01 |
The Pareto chart of the standardized effects (Figure 4) corresponds to the order of significance for the factors affecting pectinase production by A. niger. In the previous study, during the screening of significant factors for exo-pectinase production by P. oxalicum using orange peels, NH4Cl and temperature were significant (p-value <0.05) factors.8 Moreover, in the present study, PBD analysis showed three significant factors viz. nitrogen source, inoculum size and incubation time for maximum protease production by Bacillus subtilis under submerged fermentation.16 PBD analysis showed also satkara peel (Citrus macroptera), urea and (NH4)2SO4 noteworthily affected on pectinase production by A. niger-ATCC 1640 in solid state fermentation.20
Regression equation for an existing experiment in terms of uncoded units is as follows
Pectinase activity (U/ml) = [62.43 + 6.97 (Orange peel) + 6.32 (Yeast extract) + 7.57 (pH) + 1.26 (Temperature) + 5.68 (Incubation time) – 0.53 (Inoculum size) + 6.54 (Agitation speed)]
According to the ANOVA, the determination coefficient (R2) and the adjusted determination coefficients (R2 adj.) were 0.91 and 0.77 respectively which supported the significance of the model.
Central Composite Design (CCD)
The experimental range and levels as per the CCD are shown in Table 3. The predicted values of pectinase activity showed a close resemblance with experimental values (Table 3). Statistical significance of the second model order quadratic model was checked using analysis of variance (ANOVA) and the results are presented in Table 4. The multiple correlation coefficient (R2) value of the model was 92.69%. The model F-value of 14.49 ascertains the significance of the model. The values of ‘prob>F’ less than 0.05 were indicative of the model terms significance. As shown in Table 4, the linear terms of pH, orange peel, agitation speed and yeast extract (C, A, G and B) and the square terms of pH, orange peel and agitation speed (C2, A2 and G2) showed a substantial effect (p<0.05). The two-way interaction of factors (pH*Orange peel and pH*Yeast extract) also showed a significant effect (p<0.05). The basis of a less p-value (p<0.05) and large F-value (139.39) of A (orange peel) showed an important effect on pectinase activity. The second order polynomial response equation for maximum pectinase production by Aspergillus niger is generated as given below:
Pectinase activity (U/ml) = -609 + 21.0 pH + 76.9 Orange peel (g/L) + 1.71 Agitation speed (rpm) + 28.5 Yeast extract (g/L) – 8.11 pH*pH – 4.39 Orange peel (g/L) *Orange peel (g/L) – 0.01067 Agitation speed (rpm)*Agitation speed (rpm) – 14.14 Yeast extract (g/L)*Yeast extract (g/L) + 5.96 pH*Orange peel (g/L) + 0.015 pH*Agitation speed (rpm) + 11.98 pH*Yeast extract (g/L) +0.075 Orange peel (g/L)*Agitation speed (rpm) – 4.31 Orange peel (g/L)* Yeast extract (g/L) – 0.141 Agitation speed (rpm)* Yeast extract (g/L).
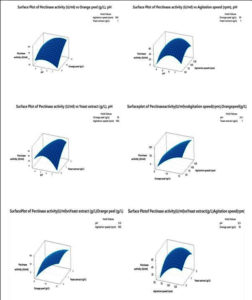
Figure 5. Response surface plots showing interaction of different variables on pectinase production by Aspergillus spp. (a): The interactive effect of pH and orange peel concentration on pectinase production (b): The interactive effect of pH and agitation speed on pectinase production (c): The interactive effect of pH and yeast extract on pectinase production (d): The interactive effect of orange peel and agitation speed on pectinase production (e): The interactive effect of orange peel and yeast extract on pectinase production and (f): The interactive effect of agitation speed and yeast extract on pectinase production
Response surface models were generated by plotting the pectinase enzyme activity U/ml) on Z-axis against the two variables although retaining the remain variables at a stable level. Figure 5 showing the response surface plots for the model to understand the interaction between the components and the optimum level for maximum pectinase production. The value of all independent variables was held at the middle level. In Figure 5a values of agitation speed (100 rpm) and yeast extract (1.0 g/L) were held in middle, highest pectinase activity showed towards the higher pH and orange peel concentration. In Figure 5b orange peel and yeast extract were kept constant at 10 and 1 g/L respectively and the combined effect of pH and agitation speed was stimulated. Figure 5c shows the relationship between pH and yeast extract when orange peel (10 g/L) and agitation speed (100 rpm) was held at middle value. Figure 5d values of pH (5.5) and yeast extract (1 g/L) were held in the middle, responsible for maximum pectinase activity. Figure 5e shows the relationship between the orange peel and yeast extract while Figure 5f shows the relationship between agitation speed and yeast extract for maximum pectinase activity. In previous work, during CCD, optimal lipase and protease production was obtained at a temperature of 43.4°C, sucrose 20 g/L, peptone 20 g/L and corn oil 4 ml/L.22
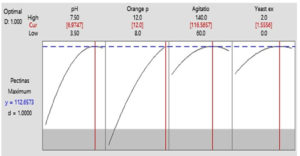
The response optimization was calculated to obtain the optimized values for maximum pectinase production. The optimization plot shows how significant factors affected on the pectinase activity (predicted) where apiece column of the optimizer plot resembled to individual factor (Figure 6). This graph shows the parameters for pectinase production to be achieved for optimization. When a response optimizer option was selected in Minitab software 2019 to obtain maximum pectinase production at an optimum condition from the predicted model, it showed the values of 12 g/L for orange peel concentration, a value of pH 6.97, agitation speed 116.56 rpm and concentration of yeast extract 1.55 g/L, the highest predicted pectinase activity was 112.65 U/ml (Figure 6). Significant pectinase activity was 15.46 U/ml under optimized media conditions.23
Figure 6. Optimization plot for the given model and variables pH 6.97, orange peel 12.0 g/L and yeast extract 1.55 g/L
Validation of the Model CCD
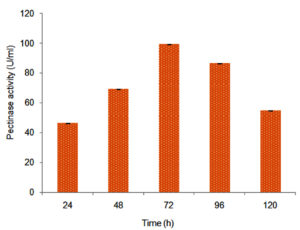
Statistical model CCD was validated by using the optimized values accomplished through CCD. The validation of the model showed good proximity between the predicted (112.65 U/ml) and experimental value (99.21 U/ml with SD=0.005) of pectinase activity by Aspergillus niger (Figure 7). Under un-optimized conditions, pectinase activity was 36.39 U/ml in 96 h, and under optimized conditions, it reached up to 99.21 U/ml (Figure 7) in 72h. After validation of the statistical model CCD, the predicted and experimental values for PRN secretions were109.54 and 96.54 µg ml-1 respectively.18
Figure 7. Pectinase activity by Aspergillus spp. after media optimization by central composite design
Partial Purification of Pectinase
After partial purification of pectinase produced by A. niger, enzyme activity and total protein contents were 103.65 U/ml and 6.16 mg/ml, respectively. Fold purification of pectinase was 1.16, the basis of this value was calculated by initial (14.48 U/mg) and final (16.82 U/mg) specific activity of crude and partially purified enzymes.
Application of Pectinase
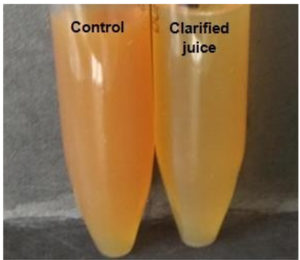
As discussed above, pectinase produced by A. niger showed a significant ability to degrade pectin. This enzyme was evaluated for their apple juice clarification. Interestingly, pectinase showed significant ability for fruit juice clarification within 30 min was detected by UV-VIS spectrophotometer. As compared to control, a clear colour change was observed in 120 min in the test sample during visual observation (Figure 8). The properties of experimental apple juice and commercially available apple juice showed a close resemblance with each other (Table 5). Sandri and Moura, (2018) reported that pH of control; commercial prepared apple juice and experimental prepared apple juice were 3.50, 3.48 and 3.64 respectively, when total soluble solids of control, commercial prepared apple juice and experimentally prepared apple juice were 5.10, 5.47 and 6.00 respectively. Titratable acidity of control; commercial prepared apple juice and experimental prepared apple juice were 7.66, 8.25 and 7.13 respectively.
In the present investigations, we have isolated A. niger that catalyzes a variety of agricultural substrates such as orange peel, banana peel, rice straw and apple pulp. A. niger had exhibited a significant ability on orange peel produced maximum pectinase (99.21 U/ml) in 72 h under optimized conditions. Furthermore, statistical medium engineering enhanced the enzyme activity by optimizing various parameters. Partially purified pectinase exhibited capable of not only fruit juice clarification, but also to improve the quality and texture of fruit juices. Pectinase enzyme plays crucial role, because in food industry, fruit juice clarification is a significant step in the processing of fruit juice principally with the aim to remove pectin and additional carbohydrates which are present in the fruit juice. In food and beverages industries, pectinases are widely used for juicing and clarification of fruit and vegetable juice drinks and wine with virtuous effect on degradation of pectin.
ACKNOWLEDGMENTS
The authors would like to thank the Naran Lala College of Professional and Applied Sciences, Navsari, Gujarat, India for providing infrastructural and research facilities and Department of Microbiology, Palamuru University, Mahabubnagar Telangana State, India.
CONFLICT OF INTEREST
The authors declare that there is no conflict of interest.
AUTHORS’ CONTRIBUTION
FUNDING
None.
DATA AVAILABILITY
All datasets generated or analyzed during this study are included in the manuscript.
ETHICS STATEMENT
Not applicable.
- Yadav S, Yadav P, Yadav D, Yadav K. Pectin lyase: A review. Process Biochem. 2009;44(1):1-10.
Crossref - Okonji RE, Itakorode BO, Ovumedia JO, Adedeji OS. Purification and biochemical characterization of pectinase produced by Aspergillus fumigatus isolated from soil of decomposing plant materials. J Appl Biol. 2019;7(03):1-8.
Crossref - Akhter N, Alam MM, Uddin A, Begam F, Sultan T, Azad AK. Production of pectinase by Aspergillus niger cultured in solid state media. Int J Biosci. 2011;1:33-42.
- Abdullah R, Farooq I, Kaleem A, Iqtedar M, Iftikhar T. Pectinase production from Aspergillus niger IBT-7 using solid state fermentation. Bangladesh J Bot. 2018;47(3):473-478.
Crossref - Caroline R, Caroline R, Betina M, et al. Pectinase production by Aspergillus niger LB-02-SF is influenced by the culture medium composition and the addition of the enzyme inducer after biomass growth. Process Biochem. 2017;58:1-8.
Crossref - El Enshasy H, Ahmed Elsayed E, Suhaimi H, Abd Malek R. Bioprocess optimization for pectinase production using Aspergillus niger in a submerged cultivation system. BMC Biotechnol 2018.
Crossref - Sandri I, Silveira M. Production and application of pectinases from Aspergillus niger obtained in solid state cultivation. Beverages. 2018;4(48):1-10.
Crossref - Li P, Xia J, Shan Y, et al. Optimizing production of pectinase from orange peel by Penicillium oxalicum PJ02 using response surface methodology. Waste and Biomass Valorization. 2015;6(1).
- Sharma A, Shrivastava A, Sharma S, Gupta R, Kuhad R. Microbial pectinases and their applications. Biotechnology for Environmental Management and Resource Recovery. 2013;107-124.
Crossref - Miller NJ, Rice-Evans CA. The relative contributions of ascorbic acid and phenolic antioxidants to the total antioxidant activity of orange and apple fruit juices and blackcurrant drink. Food Chem. 1997;60(3):331-337.
Crossref - Klug-Santner B, Schnitzhofer W, Vrsanka M, et al. Purification and characterization of new bioscouring pectate lyase from Bacillus pumilus BK2. J Biotechnol. 2006;121(3):390-401.
Crossref - Yolmesh M, Habibi-Najafi M, Farhoosh R. Optimization of ultrasound assisted extraction of natural pigment from annatto seeds by response surface methodology (RSM). Food Chem. 2014;155: 319-324.
Crossref - Ajayi A, Salubi A, Lawal B, Onibokun A, Ajayi O, Ogunleye T. Optimization of pectinase production by Aspergillus niger using central composite design. Afr J Clin Exp Microbiol. 2018;19(4):314-319.
Crossref - Ramchandran S, Kurup G. Screening and isolation of pectinase from fruit and vegetable wastes and the use of orange wastes as a substrate for pectinase production. International Journal of Biological Sciences. 2013; ISSN 2278-3202, 2(9): 34-39.
- Hankin L, Zucker M, Sands D. Improved solid medium for the detection and enumeration of pectolytic bacteria. Appl Microbiol. 1971;22(2):205-209.
- Meerabai S, Ramachandran N. Process optimization by Plackett-Burman designs for the production of protease enzyme from Bacillus Subtilis under submerged fermentation. Int J Innov Eng Technol. 2014;4(4):34-39.
- Pathania S, Sharma N, Handa S. Optimization of culture conditions using response surface methodology for synergism production of cellulase, xylanase and pectinase by Rhizopus delemar F2 under solid state fermentation. J Pharmacogn Phytochem. 2017;6(6):1872-1878.
- Pawar S, Chaudhari A. Pyrrolnitrin from rhizosperic Serratia marcescens NCIM 5696: Optimization of process parameters using statistical tools and seed-applied bioprotectants for Vigna radiate (L.) against Fusarium oxysporum MTCC9913. Appl Biochem Biotechnol. 2019;190(3):803-825.
Crossref - Ajayi AA, Lawal B, Salubi AE, Onibokun A, Oniha M, Ajayi OM. Pectinase production by Aspergillus niger using pineapple peel pectin and its application in coconut oil extraction. IOP Conf. Ser.: Earth Environ. Sci. 2021; 655:012014.
Crossref - Ahmed T, Rana MR, Zzaman W, Ara R, Aziz M. Optimization of substrate composition for pectinase production from satkara (Citrus macroptera) peel using Aspergillus niger-ATCC 1640 in solid-state fermentation. Heliyon. 2021;7(10):e08133.
Crossref - Patil N, Chaudhari L. Production and purification of pectinase by soil isolate Penicillium sp and search for better agro-residue for its SSF. Recent Res Sci Technol. 2010;2(7):36-42.
- Esmaeili M, Yolmeh M, Shakerardakani A, Golivari H. A central composite design for the optimizing lipase and protease production from Bacillus subtillis PTCC 1720. Biocatal Agric Biotechnol. 2015;4(3):349-354.
Crossref - Palaniyappan M, Vijayagopal, V, Viswanathan R, Viruthagiri T. Statistical optimization of substrate, carbon and nitrogen source by response surface methodology for pectinase production using Aspergillus fumigatus MTCC 870 in submerged fermentation. Afr J Biotechnol. 2009;8(22): 6355-6363.
Crossref
© The Author(s) 2022. Open Access. This article is distributed under the terms of the Creative Commons Attribution 4.0 International License which permits unrestricted use, sharing, distribution, and reproduction in any medium, provided you give appropriate credit to the original author(s) and the source, provide a link to the Creative Commons license, and indicate if changes were made.


