

ISSN: 0973-7510
E-ISSN: 2581-690X
The main aim of this work was optimization of physical conditions as well as medium components for the maximum production of fibrinolytic enzyme. A fibrinolytic enzyme producing organism was isolated from soil and identified as Bacillus altitudinis strain S-CSR 0020. Various physical parameters such as temperature, pH, incubation time and medium components such as inoculum size, substrate (nitrogen and carbon) concentrations were optimized. A cultivation medium was designed using optimized conditions by Box Behnken Design for mass production of fibrinolytic enzyme and specific activity of enzyme was analyzed. The maximum enzyme production seen at 50 °C temperature, 10.0 pH, 4% substrate concentration with 3 ml inoculum size and 96 h. of incubation time. Among the different carbon sources tested, fructose (8%) showed maximum enzyme activity of 325 U/ml with a specific activity of 812.5 U/ml. Box Behnken Design was used to optimize the percentage of best nitrogen sources (casein, peptone, soya bean and yeast extract) with an enzyme activity of 1089.8 U/ml. Experiments were repeated with optimized condition manually and found with an enzyme activity of 1072.12 U/ml. Mass production of extracellular fibrinolytic enzyme was done with all these conditions and it showed an enzyme activity of 2070 U/ml with an initial activity of 400 U/ml without medium optimization. There was a fivefold increase in fibrinolytic activity after medium optimization that proved the reliability of optimization manually as well as using the Box Behnken design.
Bacillus altitudinis S-CSR 0020, Box Behnken Design, Fibrinolytic enzyme, Optimization.
Cardiovascular diseases, due to thrombosis in the form of myocardial infarction and stroke are the major causes of death in worldwide1 Para physiological disorders are the main causes of disturbance of dynamic balance between formation and degradation of fibrin2. Currently available thrombolytic agents include Alteplase (t-PA or Activase), Reteplase (r-PA or Retavaseurokinase (Abbokinase), prourokinase, Anisoylated Purified Streptokinase Activator Complex (APSAC) and streptokinase 2 are of human origin, which are very expensive. Due to serious limitations of fibrinolytic agents such as high cost, low specificity towards fibrin, gastrointestinal bleeding and resistance to allergic reactions1, there is much importance of fibrinolytic enzymes of microbial origin due to its wide range of applications in medicine, healthcare and pharmaceutical industry3. Fibrinolytic enzymes are derived mainly from plants, animals and microbial sources. Among various sources, due to advancement in molecular biology and fermentation technology, microbial fibrinolytic agents have much attention of research community4. There are fewer reports on fibrinolytic enzyme production optimization studies 5. Enzyme production from microbes favors the economy of bulk production6. As compared to fungi, bacteria can use crude raw material as nutrients to grow faster and are easily flexible to genetic manipulations. The major cost determining factors for microbial enzyme production is the substrate used. To study the interaction between different variables, Response Surface Methodology (RSM) helps to design model in the significant factors evaluation and to select the optimum value of variables for maximum desirable response. It requires only a minimum number of experiments for a large number of factors. Successful application of RSM is used in optimization of various processes like bio fuel production, enzyme production including alkaline proteases and xylanases7 The aim of the present study is to optimize physical parameters such as temperature, pH and incubation time, cultural conditions such as substrate concentration, inoculum size and chemical components such as nitrogen sources and carbon sources for fibrinolytic enzyme production. Percentage of nitrogen sources were optimized using RSM for the maximum production of fibrinolytic enzyme.
Chemicals and reagents
All the chemicals used in the present study were of analytical grade and bought from Sigma Aldrich, Mumbai, Maharashtra.
Microorganism used and its maintenance
Novel fibrinolytic enzyme producing organism, Bacillus altitudinis strain S-CSR 0020 with Genbank accession number KT369312 was used for the study8. Culture was maintained on nutrient agar slants as glycerol stocks, and then stored at 4 °C.
Preparation of substrate
Clot was prepared by incubating buffalo blood (500 ml) at room temperature, which was collected from the slaughter house. The substrate was prepared by shredding the clot using the surgical blade, then placed in distilled water in a beaker which was kept on the magnetic stirrer for further shredding and RBC removal; then grinded into fine powder, sterilized using ethanol and dehydrated by acetone and stored at 4 °C in refrigerator8.
Enzyme assay and protein content
Fibrinolytic enzyme activity was estimated using 0.5% bovine fibrin in 0.1 M carbonate buffer (1 ml) with an equal volume of extracted enzyme solution and incubated at 37 °C for 30 min and the reaction was stopped by adding cold tri chloroacetic acid (TCA); centrifuged at 10000 r/min for 10 min and the supernatant collected was read at 660 nm against a reagent blank using UV-Vis (Shimadzu) spectrophotometer. Tyrosine served as the reference standard9, 10. One unit of fibrinolytic activity was defined as the amount of enzyme required to catalyze the release 1 µg of tyrosine per ml under the reaction conditions. Protein content estimated by Lowry’s method11 and specific activity also were determined.
Optimization of physical and other factors for maximum enzyme production
Temperature optimization was done by incubating 20 ml minimal media with 0.5% fibrin as substrate at different temperatures from 10 to 70 °C. The influence of pH on the enzyme production was determined using 0.2 M buffers at various pH values ranges from 4 to 12 and the effect of substrate concentrations checked with different concentrations ranges from 0.5 to 5%. Effect of incubation time and inoculum size were optimized by incubating with different time intervals (24 to 120 h.) and different inoculum sizes (1 to 5 ml) from already prepared McFarland’s standard inoculum respectively. To study the effect of different carbon sources, media were prepared with 1% of different carbon sources such as glucose, lactose, fructose, maltose, sucrose, starch, glycerol, galactose, mannitol and malt extract in 20 ml minimal media with blood clot as substrate, the percentage of best carbon source also were optimized and the effect of different nitrogen sources by 1% of casein, peptone, soyabean meal, ammonium chloride, yeast extract, ammonium acetate, potassium nitrate, sodium nitrate, skim milk powder, and beef extract12. The enzyme activity and protein content were determined and thereby specific activity also calculated.
Statistical optimization of nitrogen source percentage using RSM
A four variable Box-Behnken design for randomized response surface methodology was used to study the combined effect of percentage of four nitrogen sources such as casein, peptone, yeast extract and soya bean on fibrinolytic enzyme production over three levels. The levels of the independent variables were selected based on preliminary experiments. The Box-Behnken design is suitable for the exploration of quadratic response surfaces and generates a second degree polynomial model, which in turn is used in optimizing a process using a small number of experimental runs. The design which was developed using Design Expert 10.0.6.0 resulted in 29 experimental runs which were randomized to maximize the effects of unexplained variability in the observed responses due to extraneous factors.
Mass production of enzyme
With all the physical and cultural conditions obtained through optimization studies (3 ml inoculum size, 4% substrate, 8% fructose, 3.99% casein, 3.32% yeast extract, 0.5% soya bean meal, 3.66% peptone, 10 pH, 50 °C temperature and incubation period of 96 h.), a final cultivation medium was designed to increase the fibrinolytic activity.
Optimization of physical and other factors for maximum enzyme production
Effect of temperature on enzyme production
Physical conditions such as temperature, pH and incubation time should be optimized for maximum enzyme production. B. altitudinis S-CSR 0020 showed high enzyme production at 40-60 °C, which indicated a thermophilic organism. Enzyme activity increased progressively with increase in temperature from 10 °C reaching a maximum to 50 °C with an enzyme activity of 158 U/ml and protein content of 0.4 mg/ml, there by a specific activity of 395 U/mg (Figure 1). Velocity of enzyme reaction determined by temperature and optimal temperature determines the maximum enzyme activity; in which rate of reaction is too fast without denaturation of enzyme [13]. Bacillus sphaericus MTCC 3672 had shown higher enzyme activity at 30 °C [4]. B. subtilis and mutant Bacillus cereus GD55 had produced fibrinolytic enzyme at 37 °C [14,15].
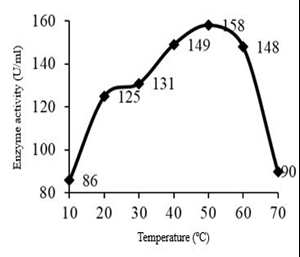
Fig. 1. Effect of temperature on fibrinolytic enzyme production
Effect of pH on enzyme production
Bacillus altitudinis S-CSR 0020 showed an optimum enzyme production at pH 10.0, with an enzyme activity of 270 U/ml and the protein content was found to be 0.59 mg/ml with a specific activity of 457.63 U/mg (Figure 2). Optimum pH for fibrinolytic enzyme production by B. altitudinis S-CSR 0020 was found to be 9.0-11.0, which indicated an alkaline organism. From the results it was understood that the organism isolated was highly thermo stable and pH tolerant. Change in pH can lead to change in the active site shape and due to denaturation enzyme activity loses at high or low pH values. B. subtilis showed an optimum pH at 9.0 [12]. Mutant Bacillus cereus GD55 showed maximum activity at pH 8 [15]. There were maximum fibrinolytic enzyme gene expression and very high biomass formation at optimum pH. Hence, all fermentation studies are performed at pH 8.0, but most of the Bacillus spp. grows best in a neutral or slightly basic pH environment. Thrombinase production has been studied at pH 7.4 from Bacillus sphaericus serotype H5a5b [16] and maximum fibrinolytic enzyme production from Bacillus sp. B24 obtained at pH 7 [17].
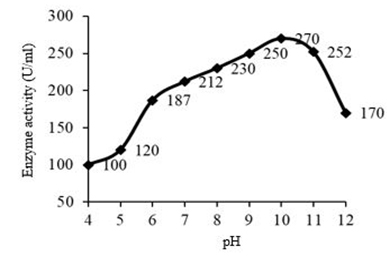
Fig. 2. Effect of pH on fibrinolytic enzyme production
Effect of substrate concentration on enzyme production
For the enzyme production, the organism is active on 4% substrate (blood clot) with an enzyme activity of 470 U/ml, 0.7 mg/ml protein content and with a specific activity of 671 U/mg. Fibrinolytic activity increased with increase in the substrate concentration from 0.5% to 4% (Figure 3).
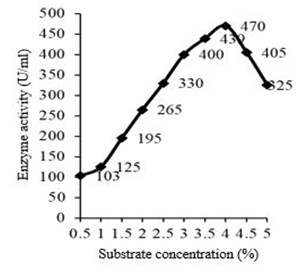
Fig. 3. Effect of substrate concentration on fibrinolytic enzyme production
Effect of inoculum size on enzyme production
The effect of inoculum size on fibrinolytic activity showed that enzyme activity increased progressively with increase in inoculum size from 1 ml reaching a maximum at 3 ml with an enzyme activity of 210 U/ml and protein content of 0.5 U/mg. The specific activity was found as 420 mg/ml. Above 3 ml, there was a sudden decrease in the fibrinolytic activity (Figure 4). Mutant Bacillus cereus GD55 showed maximum fibrinolytic enzyme production at 2 % inoculum size [15].
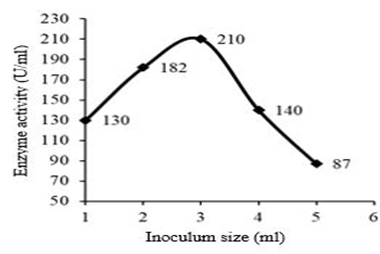
Fig. 4. Effect of inoculum size on fibrinolytic enzyme production
Effect of incubation period on enzyme production
The influence of incubation period on fibrinolytic activity showed that enzyme activity increased progressively with increase in incubation period, reaching a maximum at 96 h. (4 d.). The enzyme activity at optimum incubation period was found to be 690 U/mL, with a protein content of 0.85 mg/ml there by a specific activity of 811.76 U/mg (Figure 5). Fibrinolytic enzyme production usually lies between 48 to 96 h. [18]. In our results maximum enzyme production was seen at 96 h. Majority of extracellular enzyme produced during the log phase. Bacillus subtilis produced maximum enzyme production at 96 h. [12], but mutant Bacillus cereus GD55 and Bacillus sp. B24 showed maximum enzyme production after 3 days of incubation [15,17].
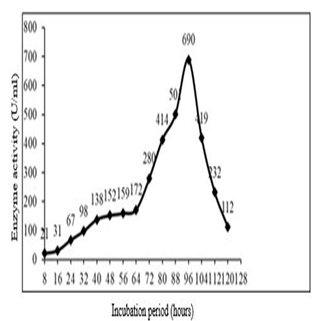
Fig. 5. Effect of incubation time on fibrinolytic enzyme production
Effect of carbon source on enzyme production
Among all supplementary carbon sources, fructose has been found to be the best carbon source for fibrinolytic enzyme production with an enzyme activity of 205 U/ml. The protein content was found to be 0.4 mg/ml and the specific activity was found to be 525 U/mg (Figure 6). Mutant Bacillus cereus GD55 also showed maximum fibrinolytic enzyme production with fructose as a carbon souce [15]. Mannitol showed the best carbon source in the case of fibrinolytic enzyme production from Bacillus lichniformis B4 local isolate [13].
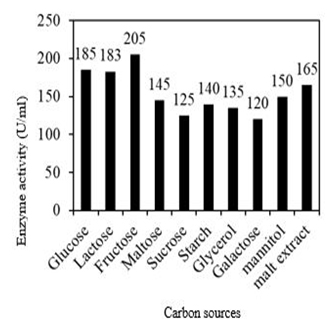
Fig. 6. Effect of carbon source on fibrinolytic enzyme production
Effect of fructose on enzyme Production
Among the carbon sources, fructose showed maximum enzyme activity, so the influence of fructose concentration on fibrinolytic activity of the crude enzyme were checked and concluded that enzyme activity increased progressively with an increase in fructose concentration from 1% reaching a maximum at 8% was 325 U/ml. The protein content was 0.4 mg/ml and the specific activity was found to be 812.5 U/ml (Figure 7). An alkali-thermotolerant extracellular protease from a newly isolated Streptomyces sp. DP2, Fructose was found to be the best substrate for protease production, followed by maltose, lactose and wheat bran[6].
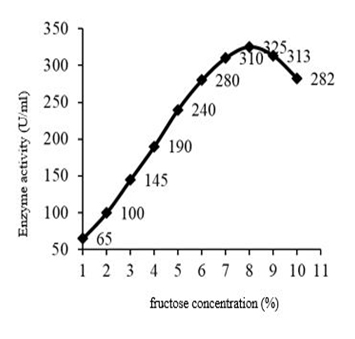
Fig. 7. Effect of fructose concentration on fibrinolytic enzyme production
Effect of nitrogen source on enzyme production
Among all supplementary nitrogen sources, casein has been found to be the best nitrogen source for fibrinolytic enzyme production with an enzyme activity of 525 U/ml with 0.55 mg/ml protein content and specific activity of 954 U/mg. Other nitrogen sources such as yeast extract, soya bean meal and peptone also showed increased fibrinolytic enzyme production (Figure 8).Culture medium provides nutrients required for the organism to grow. It plays an important role for the enzyme production [13]. Due to high cost of commercial fibrin, the production cost can be minimized by utilizing cheaper substrates such as blood clot as fibrin, carbon and nitrogen sources. Extracellular fibrinolytic enzyme production by Bacillus altitudinis is influenced greatly by cultural and environmental conditions and nitrogenous precursors in the medium . B. subtilis I-2 produced fibrinolytic protease using low-cost nitrogen sources such as cotton seed cake, soybean meal, malt extract, gelatin and beef extract. Medium components such as casein, peptone, yeast extract, soybean powder were reported as good nitrogen sources for protease enzyme production from Bacillus sp. [1,19]. Among nitrogen sources tested for fibrinolytic enzyme production, four nitrogen sources (casein, peptone, soya bean and yeast extract) were found as most significant. Among 11 variables investigated for production of protease from B. mojavensis A2, four variables (hulled grain of wheat, NaCl, K2HPO4 and KH2PO4) were found as most significant [20]. In another study, Soybean meal supported maximum protease production (797.28 U/mL), followed by malt extract, cotton cake and beef extract [21]. Among six kinds of nitrogen sources examined (casein, NH4Cl, KNO3, NH3PO4, peptone and soya peptone), the most promising one was found to be soy peptone [13].
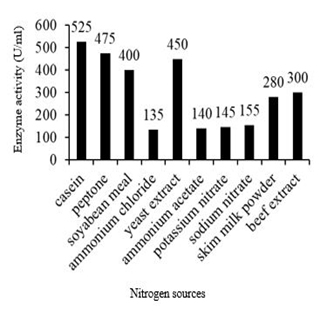
Fig. 8. Effect of nitrogen source on fibrinolytic enzyme production
Optimization of different nitrogen sources using Box Behnken Design
The results obtained from 29 experimental runs carried out according to the Box- Behnken design are summarized in Table 1. The significance of the fit of the second-order polynomial for enzyme activity was assessed by carrying out analysis of variance (ANOVA) for maximum enzyme production (Table 2 and 3). Standard errors should be similar within type of coefficient. Smaller is better, the ideal VIF value is 1.0. VIFs above 10 are the causes for concern. VIFs above 100 are the causes for alarm, indicating coefficients are poorly estimated due to multicollinearity. Ideal Ri-squared is 0.0. High Ri-squared mean terms are correlated with each other, possibly leading to poor models. The Model F-value of 33.23 implies the model is significant. There is only a 0.01% chance that an F-value this large could occur due to noise. Values of “Prob > F” less than 0.0500 indicate model terms are significant. In this case A, B, C, D, AB, AC, CD, A2, B2, D2 are significant model terms. The coefficient of variation (C.V.) obtained was 4.27%. The C.V. indicates the degree of precision with which the treatments are carried out. A low value of C.V suggests a high reliability of the experiment. The difference between the “Pred R-Squared” (0.8318) is in reasonable agreement with the “Adj R Squared”(0.9416). i.e., less than 0.2. Adeq Precision” measures the signal to noise ratio, represented by ratio 22.463 (ratio greater than 4 is desirable), this model can be used to navigate the design space. Final Equation in Terms of Coded Factors is, R1= + 845.00 + 103.54* A+ 96.87* B -22.50* C+83.33* D+61.25*AB-91.25*AC- 16.88*AD+6.25* BC-19.38* BD-57.50* CD-45.52* A2-99.90* B2-18.96* C2-65.21* D2. The equation in terms of coded factors can be used to make predictions about the response for given levels of each factor. By default, the high levels of the factors are coded as +1 and the low levels of the factors are coded as -1. Final equation in terms of actual factors, R1= 64.64286+160.49320* Casein+166.78571* Yeast extract+119.69388* Soya bean + 212.31293 * Peptone + 20.00000* Casein* Yeast extract-29.79592* Casein* Soya bean -5.51020* Casein* Peptone+2.04082* Yeast extract* Soya bean-6.32653* Yeast extract* Peptone-18.77551* Soya bean* Peptone-14.86395* Casein2-32.61905* Yeast extract2-6.19048* Soya bean2-21.29252* Peptone2.
Table (1):
Results obtained from experimental runs.
Runs |
A (Casein) % |
B (Yeast Extract) % |
C (Soyabean) % |
D(Peptone) % |
R1 (Response 1) Optical Density |
|---|---|---|---|---|---|
1 |
2.25 |
4 |
2.25 |
0.5 |
710 |
2 |
2.25 |
0.5 |
2.25 |
0.5 |
475 |
3 |
4 |
2.25 |
4 |
2.25 |
750 |
4 |
0.5 |
0.5 |
2.25 |
2.25 |
600 |
5 |
2.25 |
4 |
0.5 |
2.25 |
850 |
6 |
4 |
4 |
2.25 |
2.25 |
975 |
7 |
2.25 |
4 |
2.25 |
4 |
817.5 |
8 |
2.25 |
2.25 |
2.25 |
2.25 |
845 |
9 |
0.5 |
2.25 |
2.25 |
0.5 |
500 |
10 |
2.25 |
2.25 |
2.25 |
2.25 |
845 |
11 |
2.25 |
2.25 |
0.5 |
0.5 |
675 |
12 |
2.25 |
2.25 |
0.5 |
4 |
940 |
13 |
4 |
2.25 |
0.5 |
2.25 |
975 |
14 |
0.5 |
2.25 |
4 |
2.25 |
740 |
15 |
2.25 |
0.5 |
2.25 |
4 |
660 |
16 |
2.25 |
2.25 |
2.25 |
2.25 |
845 |
17 |
2.25 |
2.25 |
4 |
0.5 |
750 |
18 |
2.25 |
2.25 |
4 |
4 |
785 |
19 |
2.25 |
2.25 |
2.25 |
2.25 |
845 |
20 |
4 |
0.5 |
2.25 |
2.25 |
700 |
21 |
4 |
2.25 |
2.25 |
0.5 |
740 |
22 |
0.5 |
4 |
2.25 |
2.25 |
630 |
23 |
4 |
2.25 |
2.25 |
4 |
910 |
24 |
2.25 |
4 |
4 |
2.25 |
810 |
25 |
2.25 |
0.5 |
4 |
2.25 |
565 |
26 |
2.25 |
0.5 |
0.5 |
2.25 |
630 |
27 |
0.5 |
2.25 |
0.5 |
2.25 |
600 |
28 |
2.25 |
2.25 |
2.25 |
2.25 |
845 |
29 |
0.5 |
2.25 |
2.25 |
4 |
737.5 |
Table (2):
ANOVA for response surface quadratic model.
Source |
p-valueProb > F |
Ri-Squared |
Std Error |
VIF |
Source |
p-valueProb > F |
Ri-Squared |
Std Error |
VIF |
|---|---|---|---|---|---|---|---|---|---|
A-Casein |
0.0000 |
0.29 |
1.00 |
BC |
0.7022 |
0.0000 |
0.50 |
1.00 |
|
B-Yeast extract |
0.0000 |
0.29 |
1.00 |
BD |
0.2464 |
0.0000 |
0.50 |
1.00 |
|
C-Soya bean |
0.0290 |
0.0000 |
0.29 |
1.00 |
CD |
0.0030 |
0.0000 |
0.50 |
1.00 |
D-Peptone |
0.0000 |
0.29 |
1.00 |
A2 |
0.0028 |
0.0779 |
0.39 |
1.08 |
|
AB |
0.0019 |
0.0000 |
0.50 |
1.00 |
B2 |
0.0779 |
0.39 |
1.08 |
|
AC |
0.0000 |
0.50 |
1.00 |
C2 |
0.1540 |
0.0779 |
0.39 |
1.08 |
|
AD |
0.3099 |
0.0000 |
0.50 |
1.00 |
D2 |
0.0001 |
0.0779 |
0.39 |
1.08 |
Table (3):
Model summary Statistics.
SOURCE |
RESPONSE VALUE |
|---|---|
Std. Dev. |
32.03 |
Mean |
50 |
C.V. % |
4.27 |
R-Squared |
0.9708 |
Adj R-Squared |
0.9416 |
Pred R-Squared |
0.8318 |
Adeq Precision |
22.46 |
For given levels of factors, to make predictions, the equation in terms of actual factors can be used. From the 100 runs, 53rd run with maximum enzyme activity was selected and using contour plots and corresponding 3D plots optimization of parameters done by checking the maximum enzyme activity from the regression model. The three-dimensional (3D) plots were generated by keeping one variable constant at the center point and varying the others within the experimental range. The resulting response surfaces showed the effect of different nitrogen sources- casein, peptone, yeast extract and soya bean meal on fibrinolytic enzyme production. An increase in the concentration of casein with an accompanying increase in the concentration of yeast extract resulted in an increase in the fibrinolytic enzyme production with an enzyme activity of about 700 U/ml to a maximum value of 1049.4 U/ml at 3.99% casein and 3.56% yeast extract (Figure 9). An increase in the concentration of casein with an accompanying decrease in the concentration of soya bean meal resulted in an increase in the fibrinolytic enzyme production from an enzyme activity of about 767.27 U/ml to a maximum value of 1089.8 U/ml at concentration of 3.99% casein and 0.5% soya bean meal (Figure 10). An increase in the concentration of casein with an accompanying increase in the concentration of peptone resulted in an increase in the fibrinolytic enzyme production from 70.0 U/ml to a maximum value of 1042.55 U/ml at 3.99% casein and 3.53% peptone (Fig. 11). An increase in the concentration of yeast extract with a decrease in the concentration of soya bean meal resulted in an increase in the fibrinolytic enzyme production from 700 U/ml to a maximum value of 1037.37 U/ml at 3.16% yeast extract and 0.50% soya bean meal (Fig. 12). An increase in the concentration of yeast extract with an accompanying increase in the concentration of peptone resulted in an increae in the fibrinolytic enzyme production from 700 U/ml to a maximum value of 1004.66U/ml at 3.24% yeast extract and 3.54% peptone (Fig, 13). An increase in the concentration of peptone with an accompanying decrease in the concentration of soya bean meal resulted in an increase in the fibrinolytic enzyme production from 840.86 U/ml to a maximum value of 1033.47 U/ml at 3.89% peptone and 0.51% soya bean meal (Fig. 14).The R2 value showed a good fit to the model with the experimental data. The final optimized conditions obtained with RSM were 3.99% casein, 3.32% yeast extract, 0.5% soya bean meal and 3.66% peptone with a maximum enzyme activity of 1089.80 U/ml. Experiments were repeated with optimized condition manually and found with an enzyme activity of 1072.12 U/ml which is nearer to the model implies the accuracy.
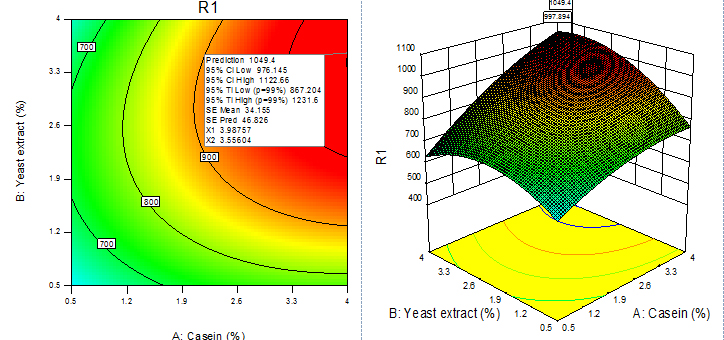
Fig. 9. Contour plot and 3D plot show the effects of yeast extract and casein on fibrinolytic enzyme activity
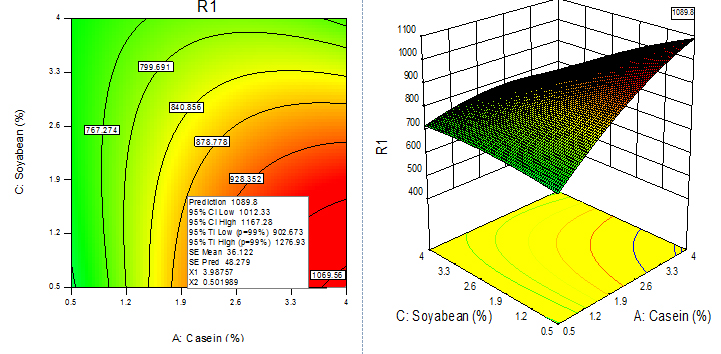
Fig. 10. Contour plot and 3D plot show the effects of soya bean meal and casein on fibrinolytic enzyme activity
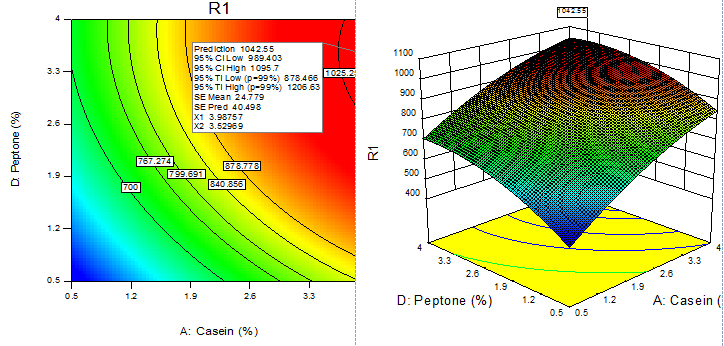
Fig. 11. Contour plot and 3D plot show the effects of peptone and casein on fibrinolytic enzyme activity
With the aid of the Special features of RSM and 3D plots, the optimum value of the percentage combination of the four factors were validated. There is a better understanding between all possible attributes that empowers the use of RSM. Experiments were carried out in Erlenmeyer flask in triplicates under theoretically predicted conditions to validate the model [22]. In the present study, the percentage of four nitrogen sources on fibrinolytic enzyme were tested using Box- Behnken Design, which detected the optimal concentrations of individual components and also determines the interaction among four nitrogen sources. Significant interaction between Casein and yeast extract (AB), casein and soya bean (AC), casein and peptone (AD), Yeast extract and soya bean (BC), Yeast extract and peptone (BD) and soya bean and peptone (CD) revealed their importance for mass cultivation in the production medium for fibrinolytic enzyme production. Four variables tested with 0.5% and enzyme activity found to be casein-525 U/ml, peptone-475 U/ml, soya bean-400 U/ml and yeast extract 450 U/ml and from the optimized conditions the maximum enzyme activity obtained was 1089.8 U/ml. By regression analysis we found that the percentage interaction of different variables tested were significant and the model validated by comparing the observed and predicted values at the optimum enzyme activity. With the optimized conditions, wet lab experiments were carried out in triplicates and found to be 1072.12 U/ml, which confirmed the reliability of the model. RSM was used to optimize the media components for maximum production of metalloproteases from Xenorhabdus indica KB-3 [23]. Statistical optimization of fibrinolytic enzyme production by Pseudoalteromonas sp. IND11 showed 3 fold increase in fibrinolytic enzyme [24] and also observed 4.0-fold increase in yield from Bacillus sp. strain AS-S20-I applying the Plackett–Burman and RSM experimental design [5]. From a newly isolated marine bacterium Bacillus subtilis A26, 4.2-fold increased level of fibrinolytic production (269.36 U/ml) was observed by statistical optimization [25]. Optimization of subtilisin NAT production using inoculum densities, glucose concentration and soya bean concentration were done by RSM [26]. After optimization of all physical as well as medium components, a production medium designed and by mass cultivation, a fivefold increase in activity was observed with an enzyme activity of 2070 U/ml with an initial enzyme activity of 400 U/ml without medium optimization, which indicated the reliability of medium optimization.
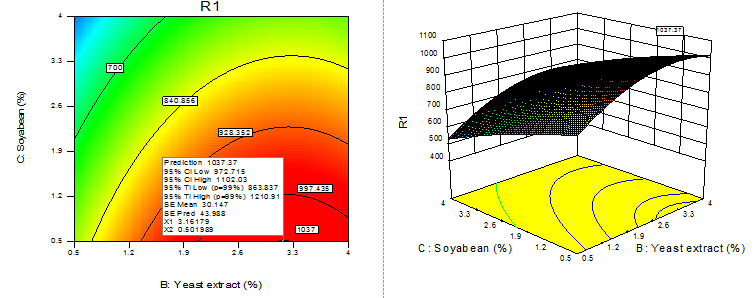
Fig. 12. Contour plot and 3D plot show the effects of soyabean meal and yeast extract on fibrinolytic enzyme activity
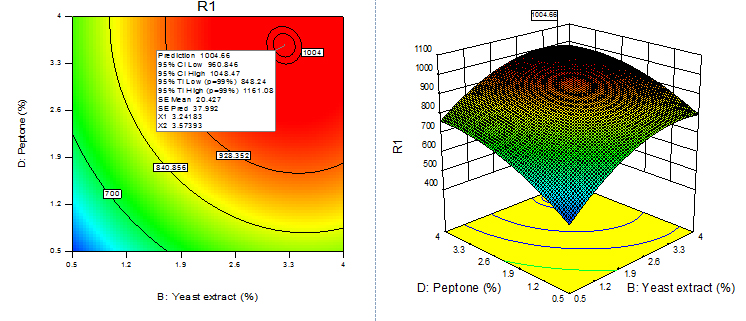
Fig. 13. Contour plot and 3D plot show the effects of peptone and yeast extract on fibrinolytic enzyme activity
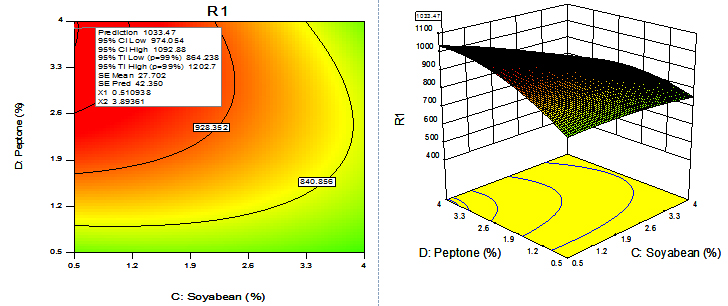
Fig. 14. Contour plot and 3D plot show the effects of soya bean meal and peptone on fibrinolytic enzyme activity
Mass production of enzyme
With all the physical and cultural conditions obtained through optimization studies both manually as well as using statistical methods, a final cultivation medium was designed which increased the fibrinolytic activity to 2070 U/ml which was 5 times more than the initial enzyme activity of 400 U/ml. For the industrial applications, huge quantities of enzymes are required that can be produced by medium optimization with process economy and genetic manipulation [6]. Medium components optimization of extracellular fibrinolytic protease from Citrobacter braakii showed 5.5 fold increased level of fibrinolytic production [27]
The present research is about media optimization by manual as well as statistical design and evaluation of a novel fibrinolytic enzyme from Bacillus altitudinis S-CSR 0020 through aerobic fermentation. Higher potency of a novel enzyme was evaluated by in-vitro blood clot degradation. Hence, an optimized medium established through present investigation will be useful for the development of an alternative to conventional fibrinolytic agents for cardiovascular disease treatments. Extensive purification, characterization and enzyme immobilization are on track. The optimized medium showed high fibrinolytic activities of 2070 U/ml, which were 5 -fold than that of the non-optimized medium.
ACKNOWLEDGMENTS
The authors are sincerely grateful to the Management, Karpagam Academy of Higher Education, Coimbatore – 641 021, Tamil Nadu, India, for the constant encouragement and support.
- Mahajan, P.M., Nayak, S., Lele, S.S. Fibrinolytic enzyme from newly isolated marine Bacillus subtilis ICTF-1: media optimization, purification and characterization. J Biosci Bioeng., 2012; 113: 307-14.
- Simkhada, J.R., Mander, P., Cho, S.S., Yoo, J.C. A novel fibrinolytic protease from Streptomyces sp. CS684. Process Biochemistry., 2010; 45: 88-93.
- Rajani, G.G., Nirmala, S., Narendar, S.S. Studies on a fibrinolytic enzyme from Bacillus species. Indian J Sci Technol., 2014; 7(10): 1632–42.
- Devchand, N.A., Swapnil, S.V., Virendra, K.R. A Novel Fibrinolytic Enzyme from Bacillus sphaericus MTCC 3672: Optimization and Purification Studies. American J Curr Microbiol., 2013; 1:1-13.
- Mukherjee, A.K., Rai, K.S. A statistical approach for the enhanced production of alkaline protease showing fibrinolytic activity from a newly isolated Gram- negative Bacillus sp. strain AS-S20-I. New Biotechnology., 2011; 28: 182-89.
- Bajaj, B.K., Sharma, P. An alkali-thermotolerant extracellular protease from a newly isolated Streptomyces sp. DP2. New Biotechnol., 2011; 28: 725-32.
- Sasikumar, E., Viruthagiri, T. Optimization of process conditions using Response Surface Methodology (RSM) for ethanol production from pretreated sugarcane bagasse: kinetics and modelling. Bioenergy Res 2008; 1: 239-47.
- K.V. Smitha., B.V. Pradeep. Application of Box-Behnken Design for the Optimization of Culture Conditions for Novel Fibrinolytic Enzyme Production by Bacillus altitudinis S-CSR 0020. Journal of pure and applied microbiology., 2017; 11(3): 1447-1456. http://dx.doi.org/10.22207/JPAM.11.3.28.
- Debajit, B., Yadav, R.N.S., Ankush, S., Lubana, S., Anand, K.C. Production, purification and characterization of nattokinase from Bacillus subtilis from tea garden soil samples of Dibrugarh. Assam. Asian J Pharm Clin Res., 2012; 5: 124-25.
- Dubey, R., Kumar, J., Agrawala, D., Char, T., Pusp, P. Isolation, production, purification, assay and characterization of fibrinolytic enzymes (Nattokinase, Streptokinase and Urokinase) from bacterial sources. Afr J Biotechnol., 2011; 10: 1408-20.
- Lowry, O.H., Rasebrough, N.J., Farr, A.R., Randall. R.J. Protein measurement with the Folin phenol reagent. J Biol Chem., 1951; 193: 265–75.
- Kumar, M.D.J., Rakshitha, R., Vidya, M.A., Jennifer, P.S., Prasad, S., Kumar, M.R. et al. Production, optimization and characterization of fibrinolytic enzyme by Bacillus subtilis RJAS19. Pak J Biol Sci., 2014; 17(4): 529-34.
- Al-Juamily, E.F., Al-Zaidy, B.H. Optimization conditions for production of fibrinolytic enzyme from Bacillus lichniformis B4 isolate. Br J Pharmacol., 2012; 3: 289-95.
- Chen, P.T., Chiang, C.J., Chao, Y.P. Medium Optimization for the production of recombinant nattokinase by Bacillus subtilis using Response Surface Methodology. Biotechnol Prog., 2007; 23: 1327-32.
- E. Venkata, Naga, Raju., Divakar, Goli. Effect of physiochemical parameters on fibrinolytic protease production by solid state fermentation, World journal of pharmacy and pharmaceutical sciences., 2014; 3(2):1937-1954.
- Mahadevan, P.S., Mahadevan. S., Sekar, S.C., Babu. S.S. Novel thrombolytic enzyme and process of its preparation. United patent application publication 2009, US 2009/0285793A1.
- Sumaya, Ali, Hmood., Ghazi, Munim, Aziz. Optimum conditions for fibrinolytic enzyme (Nattokinase) production by Bacillus sp. B24 using solid state fermentation. Iraqi Journal of Science., 2016; 57(2):1391-1401.
- D.J. Mukeshkumar., R, Rakshitha., M. Anu, etal., Production Optimization and Characterization of Fibrinolytic Enzyme by Bacillus subtilis RJAS19. Pakistan Journal of Biological Sciences., 2014; 17(4):529-534.
- Wang, S.H., Zhang, C., Yang, Y.L., Diao, M., Bai, M.F. Screening of high fibrinolytic enzyme producing strain and characterization of the fibrinolytic enzyme produced from Bacillus subtilis LD-8547. World J Microbiol Biotechnol., 2008; 24(4): 475-82.
- Haddar, A., Fakhfakh-Zouari, N., Hmidet, N., Frikh, F., Nasri, M., Kamoun, A.S. Low-cost fermentation medium for alkaline protease production by Bacillus mojavensis A21 using hulled grain of wheat and sardinella peptone. J Biosci Bioeng., 2010; 110: 288-94.
- Bijender, K.B., Satbir, S., Mowkshi, K., Kaurab, S,, Shikha, B. Optimization of fibrinolytic protease production from Bacillus subtilis I-2 using agro-residues. Braz Arch Biol Technol., 2014; 57: 653-62.
- Ponnuswamy, Vijayaraghavan., Samuel, Ghana, Prakash, Vincent. Medium optimization for the production of fibrinolytic enzyme by Paenibacillus sp. IND8 using response surface methodology. Sci World J., 2014; Article ID 276942, 9 pages http://dx.doi.org/10.1155/2014/276942.
- Kumar, P., Surender, S., Debjani, D., Surabhi, C., Sudershan, G., Lata, N. Statistical optimization of media components for production of fibrinolytic alkaline metalloproteases from Xenorhabdus indica KB-3. Biotechnol Res Int., 2014;Article ID 293434, 11 pages http://dx.doi.org/10.1155/2014/293434.
- Ponnuswamy, Vijayaraghavan., Samuel, Ghana, Prakash, Vincent. Statistical optimization of fibrinolytic enzyme production by Pseudoalteromonas sp. IND11 using cow dung substrate by response surface methodology. Springerplus., 2014; 3:60. doi: 10.1186/2193-1801-3-60.
- Rym, A., Noomen, H., Mohamed, H., Nawrez, K., Anissa, H., Fakhfakh-Zouari, N. et al. Fibrinolytic serine protease isolation from Bacillus amyloliquefaciens and grown on Mirabilis jalapa tuber powders. Appl Biochem Biotechnol., 2009; DOI 10.1007/s12010-009-8800-z.
- Ting-Wei, K., Ruei-Lan, T., Tzu-Ming, P. A simple and cost-saving approach to optimize the production of subtilisin NAT by submerged cultivation of Bacillus subtilis Natto. J Agri Food Chem., 2009; 57: 292–96.
- Anjana ,S., Arunima, S., Shivlata, L. Optimization of medium components for enhanced production of extracellular fibrinolytic protease from Citrobacter brakii. Int J Curr Microbiol App., 2015; 4(7): 248-59.
© The Author(s) 2018. Open Access. This article is distributed under the terms of the Creative Commons Attribution 4.0 International License which permits unrestricted use, sharing, distribution, and reproduction in any medium, provided you give appropriate credit to the original author(s) and the source, provide a link to the Creative Commons license, and indicate if changes were made.