


ISSN: 0973-7510
E-ISSN: 2581-690X
In the present study, 30 multidrug-resistant bacterial samples were isolated from different hospitals in the Taif governorate in Saudi Arabia. Given its discriminating power as a universal phylogenetic marker, the 16S rDNA gene was sequenced in a comprehensive diversity study to determine the evolutionary and phylogenetic relationships among the bacterial isolates. The 16S rDNA genes of all isolates were successfully amplified using PCR, and comprehensive identification results were based on GenBank databases. Analysis revealed nucleotide identities ranging from 76% to 100% based on the consensus sequences of 21 species, namely, Bacillus cereus, Bacillus subtilis, Bacillus tequilensis, Caldimonas manganoxidans, Citrobacter freundii, Enterococcus faecium, Escherichia fergusonii, Klebsiella pneumoniae, Lactobacillus plantarum, Lactococcus garvieae, Leuconostoc mesenteroides, Myristica yunnanensis, Pantoea eucrina, Pseudomonas aeruginosa, Staphylococcus aureus, Staphylococcus capitis, Staphylococcus caprae, Staphylococcus epidermidis, Staphylococcus hominis, Staphylococcus petrasii, and Staphylococcus saccharolyticus. We observed high variability in terms of DNA length and GC content between and within species. Phylogenetic analysis clustered the isolates into three groups. The number of sites ranged from 827 (S. aureus) to 1,219 (L. mesenteroides). Estimation of nucleotide diversity (ð) showed that all analyzed sequences were diverse site-wise and also exhibited high nucleotide diversity, with ð values ranging from 0.17 to 0.94. All isolates showed significantly conserved regions (P>0.05). In conclusion, the observed variations in the sequences of the target bacterial strains can be attributed to resistance to antibiotics and gene transfer among bacterial strains in the hospital environment. Further sequence analyses of antibiotic resistance genes are warranted.
Multi-drug resistant bacteria, 16s rDNA sequencing, PCR, nucleotide diversity.
A developed multidrug-resistant (MDR) hospital habitat microorganism for specific uses is part of understanding the mechanisms of the transfer of antibiotic resistance genes among different bacterial species. Isolation and identification of MDR microorganisms is challenging because these microorganisms exhibit highly specific characteristics that make them grow in their natural environments, such that they cannot be cultured using standard laboratory methods (Vijayan et al., 2012). Competition among microbes for space and nutrients in the hospital environment represents a powerful selection pressure that can confer enhanced resistance of MDR microorganisms to several drugs (Jeganathan et al., 2013). Biogeographical relationships among MDR bacteria can be structurally analyzed via 16S rDNA sequencing, which has become the cornerstone in microbial ecology for investigating bacterial community structures in various environments (Hur and Chun, 2004; Amann, 2000). The 16S rDNA sequence has properties that make it highly suitable as a universal phylogenetic marker. Furthermore, the 16S rDNA gene sequencing is a useful method for bacterial classification, in which the nucleotide sequences of the this region are determined and compared with sequences available from databases to yield homology matches, thereby allowing bacterial identification of the target samples (Clarridge 2004; Uyeno et al., 2004; Salman et al., 2012; Sabir et al., 2013). In the present study, MDR bacterial strains were isolated from patient samples collected from different hospitals in Taif City and grown in different culture media. Samples were classified into three phylogenetic groups based on 16S rDNA analysis (da Silva et al. 2013). Isolation and identification of potential strains of Streptomyces sp., Bacillus sp., Flavobacterium sp., and Pseudomonas sp. from patients has been previously conducted (Anand et al., 2011). Vibrio, Staphylococcus, and Bacillus are pathogenic MDR bacteria that cause infection in humans and harbors strains with antagonistic activity (Adiga et al., 2010; Gram et al., 2010; Wietz et al., 2010). In the present study, a total of 30 MDR bacterial strains were identified using 16S rDNA sequence analysis and bioinformatics analysis. Evolutionary and phylogenetic relationships among isolated strains were also studied. The effectiveness of this method was demonstrated by comparison with various bacterial communities collected from the GenBank database.
Sample collection
A total of 200 clinical samples of urine and stool swabs were collected from hospitalized patients in Taif hospitals, Saudi Arabia within a six-month period. Hospitalized patients were randomly selected and asked to undergo screening for nasal carriage of antibiotic resistance strains. Clinical samples were obtained under aseptic conditions and transported immediately to the microbial genetics laboratory at the Biotechnology and Genetic Engineering Unit at Taif University.
Isolation and purification of clinical bacterial isolates
Sterile dry swabs were used to streak bacterial samples onto sterile Petri dishes containing nutrient agar media (BioLife, USA). Inoculated dishes were incubated at 28 °C for 48 h. Single colonies were obtained using sterile inoculation needles, and slant cultures of nutrient agar media were prepared.
Genomic DNA extraction and PCR amplification
Genomic DNA was extracted from the cell pellets of all MDR isolates using a DNA extraction kit (Jena Bioscience, Germany) according to the manufacturer’s instructions. For each isolate, a single DNA fragment (about 1200 bp) of the 16S rDNA gene was amplified according to previously described methods (Hassan and Ismail, 2014). Fragments were purified using QIAquick PCR purification kit (QIAGEN, Valencia, CA, USA) and sequenced on an Applied Bioscience 3130 DNA analyzer (Applied Biosystems, USA). Sequence reads were edited and assembled using the DNASTAR software (Lasergene, Madison, WI, USA). BLAST searches were conducted using the NCBI server (http://www.ncbi.nlm.nih.gov/blast/Blast.cgi).
Bioinformatic analysis
The 30 sequences were analyzed using the BLAST query tool (http://blast.ncbi.nlm.nih.gov) to determine non-chance sequence similarities. BLAST queries were restricted to the 16S ribosomal RNA database. Models (XM/XP) and uncultured/environmental samples were also filtered out to obtain more reliable results. Each sequence was analyzed using blast, and the blast hit with the lowest expect-value (e-value, which indicates the number of non-chance alignments) was selected (Table 1). The stringent e-value value cutoff of 1e-6 was selected to ensure that significant blast outputs were obtained.
Alignment of the 30 sequences was carried out using Clustalx version 2 (Larkin et al., 2007) and MAFFT (Katoh et al., 2002). Exploratory and phylogenetic analyses were performed using the R Project for Statistical Computing (R Core Team, 2016). Exploratory analysis was conducted using the SeqinR package (Charif & Lobry, 2007), while phylogenetic analysis was performed using the ape package (Paradis et al., 2004). Phylogenetic tree reconstruction was performed using the neighbor-joining method (Nei, 1987). DnaSP (Librado & Rozas, 2009) software was used to determine the haplotype diversity (Hd), average number of nucleotide differences (Tajima, 1983), nucleotide diversity (ð), the polymorphic site, singleton variable sites, and the parsimony-informative sites (Lynch, 1990).
BLAST analysis and Sequence variation
Results of NCBI BLAST analysis of the 30 sequences are shown in Table (1). Query sequences were evaluated and compared with the database sequences based on the following criteria: query coverage, e-value, and percent identity. Query coverage represents the percentage of query sequence length that is included in the alignment. The e-value is a parameter that represents the number of chance alignment and directly depends on the size of the search space (database), such that a smaller the database has higher likelihood of containing the sequence of interest. Search queries were restricted to the 16S ribosomal RNA database. Models (XM/XP) and uncultured/environmental samples were filtered out. The percent identity refers to the percentage of residues in the aligned sequences that match at the same position. BLAST analysis classified the 30 isolates into the following 13 different genera: Bacillus, Caldimonas, Citrobacter, Enterococcus, Escherichia, Klebsiella, Lactobacillus, Lactococcus, Leuconostoc, Micrococcus, Pantoea, Pseudomonas, and Staphylococcus.
Table (1):
Blast results for 16S rDNA sequences from 30 isolates collected from Taif hospitals in Saudi Arabia.
Isolate |
Description |
Query coverage % |
E-value |
Identity % |
|---|---|---|---|---|
TU1 |
Bacillus subtilis |
95 |
0.0 |
98 |
TU2 |
Bacillus tequilensis |
90 |
0.0 |
96 |
TU3 |
Leuconostoc mesenteroides |
88 |
0.0 |
96 |
TU4 |
Caldimonas manganoxidans |
70 |
0.0 |
84 |
TU5 |
Staphylococcus epidermidis |
96 |
0.0 |
99 |
TU6 |
Micrococcus yunnanensis-1 |
97 |
0.0 |
97 |
TU7 |
Bacillus cereus-1 |
97 |
0.0 |
97 |
TU8 |
Bacillus cereus-2 |
96 |
0.0 |
98 |
TU9 |
Micrococcus yunnanensis-2 |
96 |
0.0 |
98 |
TU11 |
Enterococcus faecium-1 |
92 |
0.0 |
98 |
TU12 |
Staphylococcus devriesei |
95 |
0.0 |
95 |
TU13 |
Pantoea dispersa |
95 |
0.0 |
99 |
TU14 |
Lactococcus garvieae |
86 |
0.0 |
99 |
TU15 |
Enterococcus faecium-2 |
97 |
0.0 |
97 |
TU16 |
Bacillus cereus-3 |
96 |
0.0 |
98 |
TU17 |
Enterococcus faecium-3 |
89 |
0.0 |
98 |
TU18 |
Staphylococcus caprae |
95 |
0.0 |
99 |
TU19 |
Staphylococcus capitis |
95 |
0.0 |
99 |
TU20 |
Escherichia fergusonii |
97 |
0.0 |
99 |
TU22 |
Lactococcus garvieae-1 |
96 |
0.0 |
98 |
TU23 |
Lactococcus garvieae-2 |
96 |
0.0 |
97 |
TU24 |
Lactobacillus plantarum |
94 |
0.0 |
95 |
TU25 |
Citrobacter freundii |
96 |
0.0 |
99 |
TU26 |
Staphylococcus petrasii |
95 |
0.0 |
99 |
TU27 |
Staphylococcus saccharolyticus-1 |
96 |
0.0 |
99 |
TU29 |
Staphylococcus aureus |
98 |
0.0 |
99 |
TU30 |
Pseudomonas aeruginosa |
97 |
0.0 |
99 |
TU31 |
Staphylococcus hominis |
95 |
0.0 |
99 |
TU32 |
Klebsiella pneumoniae |
96 |
0.0 |
97 |
TU33 |
Staphylococcus saccharolyticus-2 |
97 |
0.0 |
99 |
Zero e-values were obtained for all 30 queries, which indicated that all alignments were significant. The percent query coverage values ranged from 76% to 100%. In addition, we observed high percent identities, which ranged from 84% to 99%. Table 2 shows the description, sequence length, and GC content for each isolate. Sequence length was highly variable among the 30 isolates and within genera. The shortest sequence was 728 bp, which corresponds to S. aureus, whereas B. cereus had the longest sequence of 1,219 bp. On the other hand, GC content ranged from 50% to 57%. The base frequencies of all 30 isolates are presented in Figure 1. Only the two M. yunnanensis isolates showed significant variation by having the lowest adenine and cytosine contents.
Table (2):
16S rDNA sequence lengths and %GC values of 30 isolates from Taif hospitals.
%GC |
Sequence length |
Species |
%GC |
Sequence length |
Species |
|---|---|---|---|---|---|
0.53 |
967 |
L.garvieae-3 |
0.54 |
1214 |
B. cereus-1 |
0.51 |
1219 |
L. mesenteroides |
0.53 |
1181 |
B. cereus-2 |
0.57 |
1145 |
M.yunnanensis-1 |
0.54 |
970 |
B. cereus-3 |
0.57 |
1172 |
M.yunnanensis-2 |
0.55 |
1184 |
B. subtilis |
0.55 |
969 |
P. eucrina |
0.54 |
1237 |
B. tequilensis |
0.55 |
973 |
P. aeruginosa |
0.53 |
1167 |
C. manganoxidans |
0.51 |
827 |
S. aureus |
0.55 |
975 |
C. freundii |
0.51 |
961 |
S. capitis |
0.54 |
983 |
E. faecium |
0.52 |
972 |
S. caprae |
0.54 |
976 |
E. faecium-1 |
0.52 |
1172 |
S. epidermidis |
0.54 |
974 |
E. faecium-2 |
0.51 |
979 |
S. hominis-1 |
0.55 |
968 |
E. fergusonii |
0.51 |
963 |
S. hominis-2 |
0.54 |
991 |
K. pneumoniae |
0.51 |
973 |
S. petrasii |
0.52 |
929 |
L. plantarum |
0.52 |
972 |
S. saccharolyticus-1 |
0.525 |
963 |
L. garvieae-1 |
0.52 |
975 |
S. saccharolyticus-2 |
0.52 |
967 |
L. garvieae-2 |
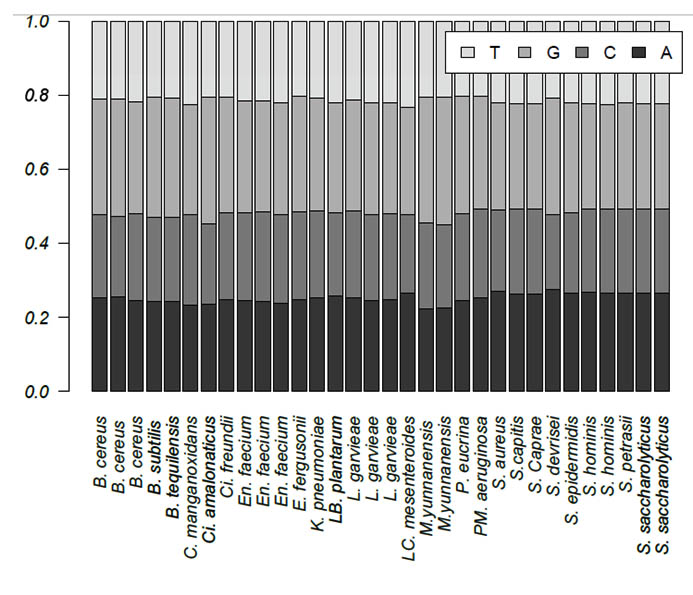
Fig. 1. Base frequencies of the 30 bacterial isolates obtained from Taif hospitals in Saudi Arabia
Polymorphism and genetic diversity among species
The 30 sequences were aligned using both Clustalx (Larkin et al., 2007) and MAFFT (Katoh et al., 2002) build in the ape package (Paradis et al., 2004). The alignment results of the two software were found to be identical, demonstrating the robustness of the alignment methods. The aligned sequences had the same length of 1,219 bp. Sequence analysis revealed a total of 285 polymorphic sites (excluding sites with gaps or missing data), which comprised 116 invariable (monomorphic) sites and 169 variable (polymorphic) sites. Of these, 36 sites were singletons (non-informative) and 133 were parsimony-informative sites. Results of DNA polymorphism analysis of the 30 isolates sequences are shown in Table 3. The nucleotide diversity (ð) was 0.17, while the number of haplotypes (h) was 23. The haplotype diversity (Hd) was 0.94, with a standard deviation of 0.04. Only four genomic conserved regions were detected along the 1480-bp region (Table 4). The shortest sequence was 106 bp, while the longest was 307 bp. These conserved regions ranged from 606 and 1453 bp in length, and no conserved regions were detected in almost first 600 bp. Furthermore, the two sequences contained overlapping regions.
Table (3):
Genetic diversity of 16S of rDNA sequences from the 30 isolates from Taif hospitals in Saudi Arabia.
| Diversity parameter a | |||
|---|---|---|---|
| h | Hd | K | π |
| 23 | 0.95 | 48.6 | 0.17 |
Table (4):
Conserved regions of the 16S rDNA sequences of the 30 isolates from Taif hospitals in Saudi Arabia.
Region |
Start-End |
Homozygosity |
P-value |
|---|---|---|---|
1 |
606-780 |
0.87 |
|
2 |
785-908 |
0.90 |
0.01 |
3 |
826-932 |
0.94 |
0.04 |
4 |
1146-1453 |
0.86 |
Phylogenetic analysis and evolutionary relationships
The evolutionary histories of 30 taxa were inferred using the neighbor-joining method (NJ) (Saitou & Nei, 1987) (Figure 2). The constructed phylogenetic tree clearly resolved the relationships among the 30 sequences, and most of bootstrap supports were high. The optimal tree with the sum of branch length = 1.44214152 is shown. The tree is drawn to scale, with branch lengths having the same units as those of the evolutionary distances used to infer the phylogenetic tree. The evolutionary distances were calculated using the Maximum Composite Likelihood method (Tamura et al., 2004) and were expressed as the number of base substitutions per site. All positions containing gaps and missing data were eliminated. The final dataset comprised a total of 285 positions. The 30 sequences were classified into three large clades and 18 nodes. All Staphylococcus, B. subtilis, and B. tequilensis isolates were grouped into one clade, where only two B. cereus isolates were grouped into one clade. The third B. cereus isolate and the rest of the evaluated species comprised a separate clade.
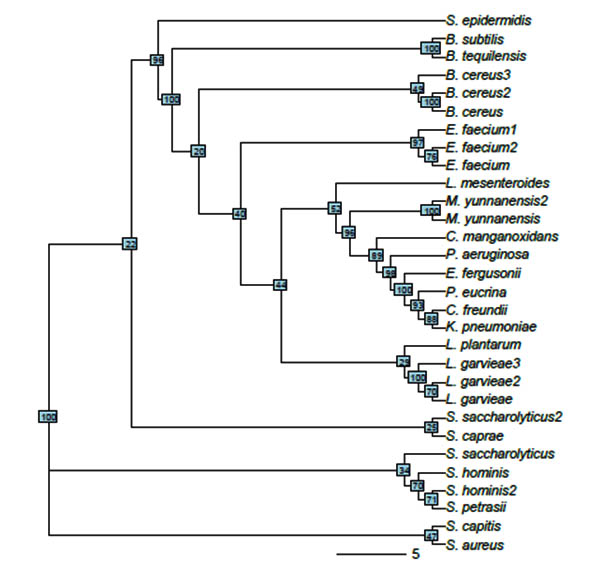
Fig. 2. Unrooted tree constructed from 30 isolates using neighbor-joining method. Without considering edge length, bootstrap values are shown in small boxes on each node
Transfer of MDR genes among different bacterial species leads to increased biological and genetic diversity. Studying MDR bacteria is important for elucidating the mechanisms of antibiotic resistance among different bacterial species. Despite very high microbial diversity, the lack of culture protocols for the microbes that are most abundant in the environment significantly limits bio-discovery research. Maintaining bacterial cultures is a critical step for developing applications of various microbes. Results of the present study clearly indicated that bacterial culture combined with 16S rDNA sequence analysis provides a novel means of comparing multiple bacterial community structures. We performed bioinformatics analysis to compare multiple bacterial communities and determine the evolutionary and phylogenetic relationships among our isolates. The following strains were identified from the isolates: 3 B. cereus, 1 B. subtilis, 1 B. tequilensis, 1 C. manganoxidans, 1 C. freundii, 3 E. faecium, 1 E. fergusonii, 1 K. pneumonia, 1 L. plantarum, 3 L. garvieae, 1 L. mesenteroides, 2 M. yunnanensis, 1 P. eucrina, 1 P. aeruginosa, 1 S. aureus, 1 S. capitis, 1 S. caprae, 1 S. epidermidis, 2 S. hominis, 1 S. petrasii, and 2 S. saccharolyticus. These results were consistent with the findings of several studies (Gram et al., 2010; Yu et al., 2012a; Yu et al., 2012b; Anand et al., 2011). We observed high variability of sequence length between and within species. Some species contained long 16S rDNA sequences, whereas other species contained short sequences. Furthermore, GC contents were highly variable among the target species. Consistent with the findings of previous studies, our results indicated no association between sequence length and GC content (Sabir et al., 2013; Ntushelo 2013; Di-silva, et al., 2013).
Phylogenetic tree construction of isolated MDR bacterial strains using the NJ method. Sequence variations and evolutionary distances were calculated using the maximum composite likelihood method. Data represented the relationship of the most isolated strains and it was high percentage of bootstrap. However, consistent with previous findings, the other isolates had longer branch lengths, which could be attributed to the partial 16S rDNA sequences (Sabir et al., 2013; Lee et al., 2006; Brettar et al., 2003; Kelly and Chistoserdov, 2001).
Analysis revealed monomorphic and polymorphic sites in some of the target strains, and parsimony-informative sites were identified in B. cereus and B. thuringensis. Nucleotide diversity (ð) is defined as the average number of nucleotide differences per site between two sequences (Nei, 1987). The ð estimates in the present study not only indicated that all the analyzed sequences not equally diverse site-wise, but also showed high nucleotide diversity, which ranged from 0.17 to 0.94. Our findings were consistent with those reported in previous study (Goodfellow and Bul, 2003) because the average nucleotide diversity (ð) showed high variability in terms of nucleotide diversity. In conclusion, our study indicated that the observed variability in sequences of our target bacterial strains can be attributed to antibiotic resistance and gene transfer among bacterial strains, which emerged because of the hospital environment.
ACKNOWLEDGMENTS
We gratefully thank all the patients who were enrolled in this study. We thank the technical staff, the nursing, medical assistant and medical staff at the participating hospitals for their help with recruitment of the patients for the study.
- Adiga, R., Karunasagar, I., & Karunasagar, I. Bioinformatics based analysis of Type III secretion system effector protein of Vibrio vulnificus. Advances in Applied Science Research, 2010; 1(3): 222-228.
- Amann, R. Who is out there? Microbial aspects of biodiversity. Syst. Appl. Microbiol. 2000; 23: 1-8.
- Anand, P., Chellaram, T., C., Kumarn, S & Felicia S, C. Screening for antibiotic producing marine bacterial against fish pathogens. International Journal of Pharma and Bio. Sciences, 2011; 2(1): 314-325.
- Brettar, I., Christen R. & Hofle M. G. Idiomarina baltica sp. nov., a marine bacterium with a high optimum growth temperature isolated from surface water of the central Baltic Sea. International Journal of Systematic and Evolutionary Microbiology, 2003; 53: 407–413.
- Charif, D., & Lobry, R. J. SeqinR 1.0-2: a contributed package to the R project for statistical computing devoted to biological sequences retrieval and analysis. Pages 207-232 of: Bastolla, U., Porto, M., Roman, H.E., & Vendruscolo, M. (eds), Structural approaches to sequence evolution: Molecules, networks, populations. Biological and Med- ical Physics, Biomedical Engineering. New York:2007; Springer Verlag. ISBN : 978-3-540-35305-8.
- Clarridge, J. E. 2004. Impact of 16S rDNA Gene Sequence Analysis for Identification of Bacteria on Clinical Microbiology and Infectious Diseases. Clinical Microbiology reviews, 17(4): 840–862.
- da Silva, M.A.C., Cavalett, A., Spinner, A., Rosa, D.C., Jasper, R.B., Quecine, M.C., Bonatelli, M .L., Pizzirani-Kleiner, A., Corção, G. & de Souza Lima1 , A.O. Phylogenetic identification of marine bacteria isolated from deep-sea sediments of the eastern South Atlantic Ocean. Springer Plus, 2013; 2(127):1-10.
- Goodfellow, M. & Bul, A. T. Statistical Approaches for Estimating Actinobacterial Diversity in Marine Sediments. Applied and environmental microbiology, 2003; 6189–6200.
- Gram, L., Melchiorsen, J. & Bruhn, J.B. Antibacterial activity of marine culturable bacteria collected from a global sampling of ocean surface waters and surface swabs of marine organisms. Mar. Biotechnol., 2010; 12: 439–451.
- Hassan MM, Ismail AI. Isolation and molecular characterization of some pathogenic mobile phone bacteria. Int J Biochem Biotechnol. 2014; 2014; 3: 516-522.
- Hur, I. & Chun, J. A Method for comparing multiple bacterial community structures from 16S rDNA clone library sequences. The Journal of Microbiology, 2004; 42(1): 9-13.
- Jeganathan, P., Rajasekaran, K.M., Asha Devi, N.K. & Karuppusamy, S. Antimicrobial activity and Characterization of Marine bacteria. Indian Journal of Pharmaceutical and Biological Research, 2013; 38-44
- Katoh, K.and Misawa, K., Kuma, K., & Miyata, T. MAFFT: A novel method for rapid multiple sequence alignment based on fast Fourier transform. Nucleic Acids Research, 2002; 30: 3059-3066.
- Kelly, K. M. & Chistoserdov A. Y. Phylogenetic analysis of the succession of bacterial communities in the Great South Bay (Long Island). FEMS Microbiology Ecology, 2001; 35: 85-95.
- Larkin, M.A., Blackshields, G., Brown, N.P., Chenna, R.and McGettigan, P.A., McWilliam, H., Valentin, F., Wallace, I.M., Wilm, A., Lopez, R., Thompson, J.D., & Gibson, T.J., Higgins D.G. Clustal W and Clustal X version 2.0. Bioinformatics, 2007; 23: 2947-2948.
- Lee, Y. K., Jung, H. J. & Lee, H. K. Marine Bacteria Associated with the Korean Brown Alga, Undaria pinnatifida . The Journal of Microbiology, 2006; 694-698.
- Librado, P., & Rozas, J. DnaSP v5: A software for comprehensive analysis of DNA polymorphism data. Bioinformatics, 2009; 25: 1451-1452.
- Lynch, M. andCrease, T.J. The analysis of population survey data on DNA sequence variation. Mol. Biol Evol, 1990; 7: 377-394.
- Nei, M. 1987. Molecular Evolutionary Genetics. New York: Columbia Univ. Press.
- Ntushelo, K. Identifying bacteria and studying bacterial diversity using the 16S ribosomal RNA gene-based sequencing techniques: A review. African journal of Microbiology research, 2013; 7(49):5533-5540.
- Paradis, E., Claude, J., & Strimmer, J. APE: analyses of phylogenetics and evolution in R language. Bioinformatics, 2004; 20: 289-290.
- R Core Team. R: A Language and Environment for Statistical Computing. R Foundation for Statistical Computing, Vienna, Austria 2016.
- Sabir, J. M. S., Abo-Aba, S. E. M., Sabry, A., Hussein, R M., Bahieldin, A., & Baeshen, N.A. Isolation, identification and comparative analysis of 16S rDNA of Bacillus subtilis grown around Rhazya stricta roots. Life Science Journal, 2013; 10(12s): 980- 986.
- Saitou, N., & Nei, M. The neighbor-joining method: A new method for reconstructing phylogenetic trees. Molecular Biology and Evolution, 1987′ 4: 406-425.
- Salman, V., Amann, R., Shub, D.A. & SchulzVogt, H. N. Multiple self-splicing introns in the 16S rDNA genes of giant sulfur bacteria. PNAS, 2012; 109(11): 4203–4208.
- Stach, J. E., Maldonado, L. A., Ward, A. C., Goodfellow, M., Bull, A. T. New primers for the class Actinobacteria: application to marine and terrestrial environments. Environ Microbiol. 2003; 5(10): 828-41
- Uyeno, Y., Sekiguchi, Y., Sunaga, A., Yoshida, H. & Kamagata, Y. Sequence Specific Cleavage of Small-Subunit (SSU) rDNA with Oligonucleotides and RNase H: a Rapid and Simple Approach to SSU rDNA-Based Quantitative Detection of Microorganisms. Applied and Environmental Microbiology, 2004; 70(6): 3650–3663.
- Vijayan, S. N., Arumugam, P., Jaffar, A.H. & Jayaprakashvel, M, Screening of Marine bacteria for multiple Biotechnological applications. J. Acad. Indus. Res, 2012; 1(6): 348-354.
- Wietz, M., Mansson, M., Gotfredsen, C.H., Larsen, T.O & Gram, L. Antibacterial Compounds from Marine Vibrionaceae Isolated on a Global Expedition. Mar. Drugs, 2010; 8: 2946-2960.
- Wietz, M., Mansson, M., Gotfredsen, C.H., Larsen, T.O & Gram, L. Antibacterial Compounds from Marine Vibrionaceae Isolated on a Global Expedition. Mar. Drugs, 2010; 8: 2946-2960.
- Tamura K, Nei M & Kumar S. Prospects for inferring very large phylogenies by using the neighbor-joining method. Proceedings of the National Academy of Sciences (USA), 2004; 101: 11030-11035.
© The Author(s) 2018. Open Access. This article is distributed under the terms of the Creative Commons Attribution 4.0 International License which permits unrestricted use, sharing, distribution, and reproduction in any medium, provided you give appropriate credit to the original author(s) and the source, provide a link to the Creative Commons license, and indicate if changes were made.