

ISSN: 0973-7510
E-ISSN: 2581-690X
N-methyl-N-nitro-N-nitrosoguanidine (NTG) mutagen was successfully used to induce hyper producing neomycin mutants. The neomycin-resistant mutants of Streptomyces albogriseolus, which harvested after treatment with NTG mutagen (100µg/ml) and growing with stress of neomycin (1.75 mg/ml), can produce neomycin with higher efficiency than the wild type strain. The T-40-22 mutant strain was the highest in neomycin production which gave 25 mm inhibition zone by using B. subtilis as the tester organism with 166.67 % relation to the wild type strain after tested of 85 mutants were examined after NTG-mutagenesis. When the above result on inhibition zone was compared with the standard data of neomycin concentrations in relation to inhibition area, the mutant T-40-22 which gave a 25 mm inhibition zone was produced 4.0 mg /mL of neomycin compared with 1.5 mg/mL neomycin of type wild strains and therefore the amount of neomycin production was reached to 2.66 folds of the mother strain production. In addition, the polymerase chain reaction (PCR) technique was applied to examine DNA fingerprint by three random primers on a number of excellent strains for neomycin production to link the genetic background of the tested mutants with the data obtained from the neomycin estimation compared to the wild type strain. Several different DNA fingerprints have been detected after random amplified polymorphic DNA (RAPD) analysis by PCR. Finally, phylogenetic analysis was used to divide the studied mutants into clusters which could reflect the genetic diversity of the new superior neomycin mutants.
Streptomyces albogriseolus, neomycin, NTG-mutagenesis, RAPD-PCR assay, phylogenetic analysis.
It is known that the major role of actinomycetes in the production of antibiotics especially the Streptomyces genus. Streptomycetes are a major pool of microbial natural agents, providing a different of antimicrobial and antitumor agents, extensively applied in medical care, animal husbandry, and plant protection (Li and Tan 2017; Niu et al. 2017). Neomycin is an aminoglycoside antibiotic first detected from Streptomyces fradiae in 1940. Moreover, Streptornyces albogriseolus, a Streptomyces species previously reported to produce neomycin (Benedict et al., 1954). Neomycin exhibits higher antibacterial activity than other classical antibiotics, like streptomycin and bacitracin (Waksman and Lechevalier 1949), and is mainly used as a veterinary antibiotic in the livestock husbandry for disease prevention and feed additives. In addition, neomycin could be used as anti-infective and potential antitumor agent for human (Jacela et al. 2009; Takahashi and Igarashi 2017; Bottero et al. 2013). Neomycin, which is mainly used as the sulphate, is a widely used broad spectrum, water soluble aminoglycoside antibiotic, produced during the fermentation of Streptomyces fradiae (Waksman and Lechevalier, 1949). It inhibits the growth of Gram-negative and Gram-positive bacteria. It has a narrow therapeutic range, is potentially toxic, like other aminoglycosides and may cause nephrotoxicity.
In general, the development of the microbial strain is a key in the increase of in amount of antibiotic as a powerful therapeutic biomaterial. Microbial strain improvement is intended to gain certain desirable characteristics for solving a particular problem. In an optimal manner, the microbial strain improvement includes mutation with a very potent mutagen and isolation of resultant mutants. The mutagenic N-Methyl-N-nitro-N-nitrosoguanidine (NTG) agent deserves special indication as a very potent mutagen to produce a large number of mutants (Cerda-Olmedo and Hanawalt, 1967). Many studies have been established to improve the antibiotic production by genetic improvement protocols from different Streptomyces species (Jin et al., 2002 a&b; El-Bondkly and Khattab 2004; Khattab and El-Bondkly 2006; Xiang-Jing et al., 2009; El-Sherbini and Khattab, 2018).
The DNA-fingerprinting of the selected strains by random amplified polymorphic DNA (RAPD) technique has been shown to be extremely powerful in determination of genetic relationship between different microbial isolates. The RAPD as ideal to study of genomic polymorphism as pre cited literatures and has been applied to compare intraspecific and interspecific variabilities within the bacterial strains (Williams et al., 1990; Caetono-Anolles 1993; Power 1996; Ikeh 2003). In the present literature use of NTG as mutagen or any mutagenic agents to enhance neomycin production by Streptomyces albogriseolus NRRL B-1305 is not reported. Thus, this research was initiated to take advantage of NTG-mutagenesis in S. albogriseolus to obtain neomycin overproducing strains. So, the objective of the present study was to induce mutation by NTG and detect this mutation through RAPD techniques in order to improve the production of neomycin using S. albogriseolus NRRL B-1305 strain.
Microorganism and culturing the microbe
Streptomyces albogriseolus NRRL B-1305 was obtained from Northern Regional Research Laboratories (NRRL), Peoria, IL, USA and used for neomycin production. Bacillus subtilis NRRL 543 was used as the test organisms for neomycin assay. This strain was also obtained from similar source. Glucose-yeast extract-malt extract (GYM) agar Glucose, 4.0 g/L, Yeast extract, 4.0 g, Malt extract, 10.0 g, Agar, 12.0 g addition of CaCO3, 2.0 g/liter, adjust medium to pH 7.2, is advantageous for streptomycetes growth (Peter et al., 1991). Inorganic salts-starch was used for neomycin production: starch, 10 g/L; (NH4)2SO4, 2.0 g/L; K2HPO4, 1.0 g/L; MgSO4·7H2O, 1.0 g/L; NaCl, 1.0 g/L; CaCO3, 2.0 g/L; Trace salts solution 1.0 ml; Agar, 12.0 g g/L. The pH should be 7.2. Trace salts solution: FeSO4·7H2O, 0.1 g; MnCl2·4H2O, 0.1 g; ZnSO4·7H2O, 0.1 g distilled water, 100.0 ml (Gause et al., 1957) and the fermentation was continued for 6 days before neomycin determination.
Estimation of neomycin productivity
The neomycin production of each strain was quantified by using B. subtilis as the tester on Nutrient agar (NA). After inoculation in the broth production medium for 6 days, the antibiotic productivity was examined for the individual strains. The incubated production medium flasks were examined for neomycin yields by a paper disk diffusion method. Standard data for neomycin concentrations was prepared with authentic neomycin (Table 1).
Table (1):
Diameters of inhibition area with several concentrations of neomycin were used.
Neomycin conc. (mg/ml) |
Inhibition area with B. subtilis (mm) |
|---|---|
0.25 |
8 |
0.50 |
10 |
0.75 |
12 |
1.00 |
13 |
1.50 |
15 |
2.00 |
16 |
2.50 |
18 |
3.00 |
20 |
3.50 |
23 |
4.00 |
25 |
5.00 |
26 |
6.00 |
27 |
NTG- mutagenesis and isolation of neomycin-resistant mutants
In the potent neomycin-producing mother strain which grown on GYM medium for 5 days, mutation was induced by centrifugation of 5 ml S. albogriseolus spores at 8000 rpm for 5 min and suspended in phosphate buffer 0.1 M, pH 7. The bacterial spores were treated with a NTG (100µg / mL) mutagen for 20, 40 and 60 minutes The suspension was then diluted and spread over the surface of the GYM medium with and without neomycin (1.75 mg / mL) to select highly resistant colonies of neomycin. The plates are then incubated for 2 days at 30°C. Developing colonies with high growth rate were transferred on slants for further studies. The resistant mutants with high growth rate were re-cultured on the same medium plates contained neomycin for 2 days at 30°C to confirm their resistance.
Total DNA isolation from mutant strains
BYF DNA extraction i-genomic Mini Kit, iNtRON Biotechnology Inc., South Korea was used to isolate total DNA from the selected mutants and the wild type strain. The extracted DNA was estimated according to Sambrook et al., (1989) through reading the UV-absorbance at 260 and 280 nm using spectrophotometer (Shimadzu model UV-240) to estimate the DNA quantity and purity.
Molecular characterization of some excellent mutants by PCR-RAPD assay
PCR analysis was done by 2xPCR Master Mix Solution (i-StarTaq), Hot-Start (iNtRON Biotechnology Inc.). Each vial contains all of the necessary reagents, except primer and DNA template, to carry out PCR in a 20µl volume. Three RAPD primers were used in the present study. The first primer (R1) sequence was 5′ – CATACC CCCGCCGTT -3′. The second primer (R2) sequence was 5′ – GTGTTG TGGTCCACT -3′. The third primer (R3) sequence was 5′ – AACCTCCCCCTGACC -3′. All primers were supplied by Operon Technologies Company, Netherlands. To each PCR vial, 15 ng of the used RAPD primer and 80 ng of the purified DNA sample were added. The total volume of the amplification reaction was made to 20µl using sterile distilled water. The amplification protocol was carried out according El-Sherbini and Khattab, (2018). The amplified DNA products from RAPD analysis were electrophoresed on 1.5% agarose gel at consistent 100 volt for about 2 hrs. The different band sizes were determined against Sizer™ -1000 plus DNA Marker (iNtRON Biotechnology Inc.) and the separated bands were stained with 10000X ViSafe Red Gel Stain (Vivantis # SD0103- Malaysia) and the gels were photographed using Gel Documentation System with UV Trans-eliminator.
The genetic distance and phylogenetic relationships of PCR-RAPD assay
The PCR-RAPD amplification patterns for the three mutants as a result of RAPD application were compared to each other as well as to compare them with the wild type strain of S. albogriseolus. DNA fragments were recorded as a binary data, where (1) means presence and (0) means absence of the band. The genetic distance and the phylogenetic relationships were calculated according to (Lynch, 1990; Hammer et al., 2001).
Effect of NTG mutagenesis on Streptomyces albogriseolus spores
The Streptomyces albogriseolus spores suspension was exposed to 100 µg/ml of NTG-mutagen for different periods (20, 40 and 60 minutes) and then diluted and overlaid on the GYM medium. Each single colony which appeared on the GYM plates after mutagen treatment was tested on both the GYM and the GYM supplemented with 1.75 mg/ml of neomycin by incubating them at 30°C. Then, the isolates which were able to grow on GYM plates supplemented with 1.75 mg/ml of neomycin were considered as resistant mutants. It was found that the number of resistant mutants increased with the increase of the exposure time up to 40 min and decreased sharply with the 60 min exposure time. i.e., it was 39 mutants for 20 min. exposure, 31 mutants for 40 min. and 15 mutants for 60 min (Table 2). It was also found that the survival percentages were decreased with the increase of the NTG- exposure time i.e., it was 16.87% for 20 min. and decreased drastically to reach 5.11 and 3.86% after 40 and 60 min of NTG-mutagenesis, respectively. From about 556 colonies obtained after NTG-mutagenesis, 85 mutants showed a desired resistance towards neomycin. The results obtained were indicated that the survival rate had decreased by increasing the NTG exposure time. This decrease in survival rate might be attributed to damage in nucleic acid and/or defects in other cell components caused by NTG-mutagen. The above data were agreement with those obtained by Yu et al., (2011). They observed that the survival rate in Streptomyces roseosporus after exposure to NTG-mutagen was decreased when increased the exposure time and increased NTG concentration from 0.1 to 0.7 mg/L.
Table (2):
Action of NTG on spores’ survival of S. albogriseolus NRRL B-1305.
| Expose time (min) |
No. of viable colonies and % |
Neomycin resistant mutants at 1.75 mg/ml |
||
|---|---|---|---|---|
| No. | % | No. | % | |
| 0 | 2152 | 00.00 | 0 | 00.00 |
| 20 | 363 | 16.87 | 39 | 10.74 |
| 40 | 110 | 5.11 | 31 | 28.18 |
| 60 | 83 | 3.86 | 15 | 18.07 |
Neomycin productivity after NTG mutagenesis
The mutation produces a change in DNA nucleotide sequence when mutations are induced using mutagenic agents that interact with DNA. Natural mutations are known to be rare compared to induced mutations. Large types of changes in the DNA sequence (base pair substitution, insertion, deletion) are introduced randomly in microbial DNA by applying chemical and physical mutagenic agents. In order to improve the genome of bacterial strains, common mutagenic agents such as ultraviolet rays and alkyl mutagenic agents (EMS and NTG), which usually produce different mutations in bacterial DNA, are used. The microbial mutant strains of are used at the industrial level to extensively promote the production of antibiotics through Streptomyces strains.
To test the effect of the NTG mutagenesis on neomycin production, the 85-mutants were evaluated by cultivating these into the fermentation medium for 6 days. Table (3) showed that the mother strain (wild type) gave 15 mm inhibition zone by using B. subtilis as the tester organism as shown also in Fig. 1, only two mutants of them showed neomycin at the same produced by the wild type strain, while three mutants produced lesser neomycin than it, 34 mutants of them showed neomycin produced more than the wild type strain, five of them showed neomycin produced up to 1.47 folds or more than that of the wild type strain. The mutant strain N-20-12 gave 23 mm inhibition zone or 1.53 folds of wild strain and considered as the highest neomycin producing strain after 20 min of NTG- induced mutagenesis followed by the mutant strain N-20-32 which gave 22 mm inhibition zone or 1.46 folds higher production in comparison to wild type as shown in Fig. 1.
Table (3):
Neomycin production of different mutants obtained under 1.75 mg/ml neomycin stress and treatment of S. albogriseolus with 100 µg/ml NTG for 20 min.
Strain code |
Inhibition area with B. subtilis (mm) |
% to wild type strain (W.T) |
Strain code |
Inhibition area with B. subtilis (mm) |
% To W.T |
|---|---|---|---|---|---|
W.T |
15 |
100.00 |
N-20-20 |
16 |
106.67 |
N-20-1 |
18 |
120.00 |
N-20-21 |
15 |
100.00 |
N-20-2 |
14 |
93.33 |
N-20-22 |
17 |
113.33 |
N-20-3 |
20 |
133.33 |
N-20-23 |
21 |
140.00 |
N-20-4 |
17 |
113.33 |
N-20-24 |
19 |
126.67 |
N-20-5 |
13 |
86.67 |
N-20-25 |
21 |
140.00 |
N-20-6 |
16 |
106.67 |
N-20-26 |
20 |
133.33 |
N-20-7 |
20 |
133.33 |
N-20-27 |
20 |
133.33 |
N-20-8 |
15 |
100.00 |
N-20-28 |
16 |
106.67 |
N-20-9 |
21 |
140.00 |
N-20-29 |
19 |
126.67 |
N-20-10 |
16 |
106.67 |
N-20-30 |
20 |
133.33 |
N-20-11 |
19 |
126.67 |
N-20-31 |
21 |
140.00 |
N-20-12 |
23 |
153.33 |
N-20-32 |
22 |
146.67 |
N-20-13 |
20 |
133.33 |
N-20-33 |
13 |
86.67 |
N-20-14 |
21 |
140.00 |
N-20-34 |
16 |
106.67 |
N-20-15 |
18 |
120.00 |
N-20-35 |
17 |
113.33 |
N-20-16 |
19 |
126.67 |
N-20-36 |
21 |
140.00 |
N-20-17 |
18 |
120.00 |
N-20-37 |
18 |
120.00 |
N-20-18 |
20 |
133.33 |
N-20-38 |
21 |
140.00 |
N-20-19 |
21 |
140.00 |
N-20-39 |
19 |
126.67 |
Furthermore, when tested the thirty one of neomycin resistant mutants obtained after 40 min. of NTG-treatment for neomycin production (Table 4), only one mutant (T-40-5) were produced neomycin lower than that of the wild type strain, 30 mutants of them showed neomycin produced more than the wild type strain, six of them showed neomycin produced up to 1.53 folds or more than that of the wild type strain. The mutant strain T-40-22 which gave 25 mm inhibition zone or 1.66 folds of the wild type production and considered as the highest neomycin producer after 40 min of NTG-mutagenesis. The following highest neomycin producer after 40 min. of NTG-mutagenesis was the mutant strain T-40-29 which gave 24 mm inhibition zone or 1.6 folds of the wild type production as shown also in Fig. 1. No mutants were produced neomycin lower than that of the mother strain after 60 min. of NTG-mutagenesis Table 5. The highest neomycin producer after 60 min. of NTG-mutagenesis was the mutant strain G-60-12 which gave 24 mm inhibition zone or 1.6 folds of the mother strain production as shown also in Figure 1. Meanwhile, the following highest neomycin producer after 40 min. of NTG-mutagenesis was the mutant G-60-7 strain which gave 23 mm inhibition zone or 1.53 folds of the wild type production.
Table (4):
Neomycin production of different mutants obtained under 1.75 mg/ml neomycin stress and treatment of S. albogriseolus with 100 µg/ml NTG for 40 min.
Strain code |
Inhibition area with B. subtilis (mm) |
% to wild type strain (W.T) |
Strain code |
Inhibition area with B. subtilis (mm) |
% To W.T |
|---|---|---|---|---|---|
W.T |
15 |
100.00 |
T-40-16 |
19 |
126.67 |
T-40-1 |
17 |
113.33 |
T-40-17 |
18 |
120.00 |
T-40-2 |
16 |
106.67 |
T-40-18 |
22 |
146.67 |
T-40-3 |
20 |
133.33 |
T-40-19 |
21 |
140.00 |
T-40-4 |
19 |
126.67 |
T-40-20 |
16 |
106.67 |
T-40-5 |
12 |
80.00 |
T-40-21 |
22 |
146.67 |
T-40-6 |
16 |
106.67 |
T-40-22 |
25 |
166.67 |
T-40-7 |
20 |
133.33 |
T-40-23 |
23 |
153.33 |
T-40-8 |
19 |
126.67 |
T-40-24 |
18 |
120.00 |
T-40-9 |
23 |
153.33 |
T-40-25 |
19 |
126.67 |
T-40-10 |
16 |
106.67 |
T-40-26 |
21 |
140.00 |
T-40-11 |
18 |
120.00 |
T-40-27 |
20 |
133.33 |
T-40-12 |
23 |
153.33 |
T-40-28 |
18 |
120.00 |
T-40-13 |
21 |
140.00 |
T-40-29 |
24 |
160.00 |
T-40-14 |
20 |
133.33 |
T-40-30 |
20 |
133.33 |
T-40-15 |
18 |
120.00 |
T-40-31 |
23 |
153.33 |
Table (5):
Neomycin production of different mutants obtained under 1.75 mg/ml neomycin stress and treatment of S. albogriseolus with 100 µg/ml NTG for 60 min.
Strain code |
Inhibition area with B. subtilis (mm) |
% to wild type strain (W.T) |
|---|---|---|
W.T |
15 |
100.00 |
G-60-1 |
16 |
106.67 |
G-60-2 |
19 |
126.67 |
G-60-3 |
20 |
133.33 |
G-60-4 |
18 |
120.00 |
G-60-5 |
21 |
140.00 |
G-60-6 |
16 |
106.67 |
G-60-7 |
23 |
153.33 |
G-60-8 |
15 |
100.00 |
G-60-9 |
20 |
133.33 |
G-60-10 |
16 |
106.67 |
G-60-11 |
18 |
120.00 |
G-60-12 |
24 |
160.00 |
G-60-13 |
21 |
140.00 |
G-60-14 |
20 |
133.33 |
G-60-15 |
18 |
120.00 |
The obtained results were agreement with those obtained with Yu et al., (2011). They improved the yield of daptomycin by Streptomyces roseosporus after exposure to different concentrations of NTG-mutagen and obtained a mutant strain LC-54-16, which was producing over 5 times higher antibiotic than the wild type strain. Khattab (2011) improved the production of kanamycin by Streptomyces kanamyceticus using UV-light and obtained the resistant mutants to 250µg/ml of Kanamycin which produced kanamycin higher than their wild type strain. Furthermore, Lyutskanova et al., (2005) obtained strains with an increased tylosin production by Streptomyces fradiae using conventional mutagenesis by UV and/or NTG and recombinant protoplast fusion technology. Also, Jin et al., (2002 a&b) improved the production of rifamycin B producing strain, Amycolatopsis mediterranei, by rational screening after mutagenesis.
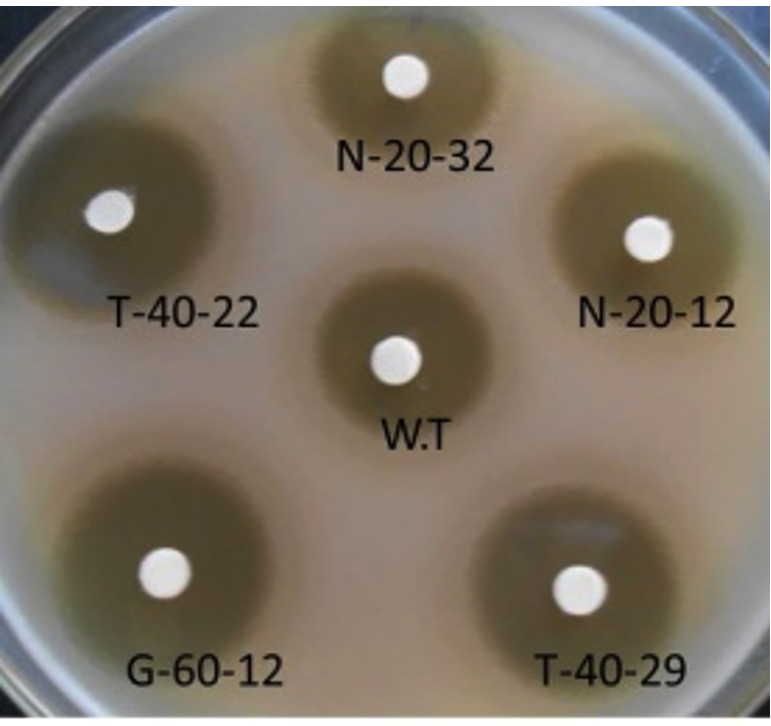 Fig. 1. Neomycin production of S. albogriseolus NRRL B-1305 (W.T) against superior mutant strains of N-20-12, N-20-32, T-40-29, G-60-12 and T-40-2
 Molecular characterization of the highest neomycin producing mutants
Three random primers with three NTG-mutants in comparison of S. albogriseolus NRRL B-1305 (W.T) were applied to detect the molecular variations after NTG-mutagenesis. Fig. (2) exhibited the amplified banding profiles of the selected three NTG-mutants and wild type strain when the random primer (R1) was used. Three faint bands (700, 850 and 1000bp) were detected for the original strain (W.T). Also, two very distinct bands (200 and 290 bp) were detected for the original strain (W.T). The mutant strain T-40-29 (lane 3) has the same number of bands and the same molecular weights as the wild type strain. But, the mutant strain G-60-12 (lane 4) did not give any bands compared to other tested strains. Furthermore, the mutant strain T-40-29 (lane 2) lost two bands (200 and 1000 bp) compared to the wild type strain and gave two new bands (700 and 1050 bp) compared to the wild type strain and also gave two bands (290 and 850 bp) with the same molecular weight compared to the wild type strain.
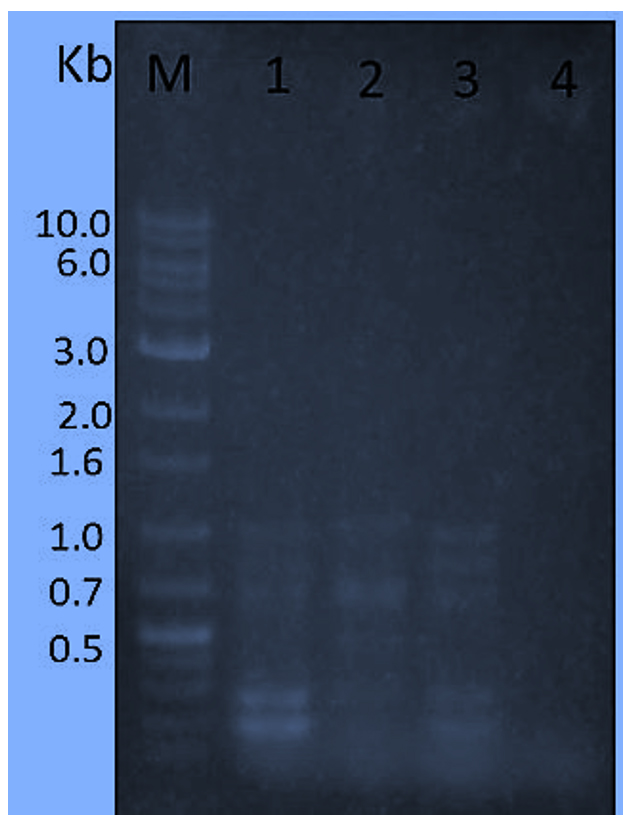 Fig. 2. amplified banding profiles using primer (R1) based on RAPD for three Superior mutants (Lanes 2 to 4) and S. albogriseolus W.T (lane 1) opposite to Sizer™ -1000 plus DNA Marker (lane M). Superior mutants sequence as follows: T-40-22, T-40-29 and G-60-12.
 Moreover, when using R2 primer (Figure 3) with the tested mutants in comparison of S. albogriseolus (W.T) exhibited two distinct amplified bands 600 and 850 bp detected for the original strain. Also, one very faint band (550 bp) was detected for the wild type strain (lane 1). Moreover, all mutant strains gave the two distinct amplified 600 and 850 bp bands except the mutant strain T-40-29 (lane 2) gave a distinctive and unique band (1300 bp) beside the two distinct amplified 600 and 850 bp bands compared to the wild type strain.
 Fig. 3. DNA amplified banding profiles using primer (R2) based on RAPD for three Superior mutants (Lanes 2 to 4) and S. albogriseolus W.T (lane 1) opposite to Sizer™ -1000 plus DNA Marker (lane M). Superior mutants sequence as follows: T-40-22, T-40-29 and G-60-12.
At the end of the molecular characterization by R3 primer with the tested mutants in comparison of wild type S. albogriseolus strain (Fig. 4), the wild strain ( lane 1) and the mutant strain T-40-22 (lane 2) gave three identical bands of molecular weight (520, 680 and 1850 bp). Also, the mutant strain T-40-29 (lane 3) gave a distinctive and unique band (850 bp) beside the three identical bands of molecular weight (520, 680 and 1850 bp) compared to the wild type strain. Finally, the mutant strain G-60-12 (lane 4) lost two bands (520 and 850 bp) compared to the wild type strain.
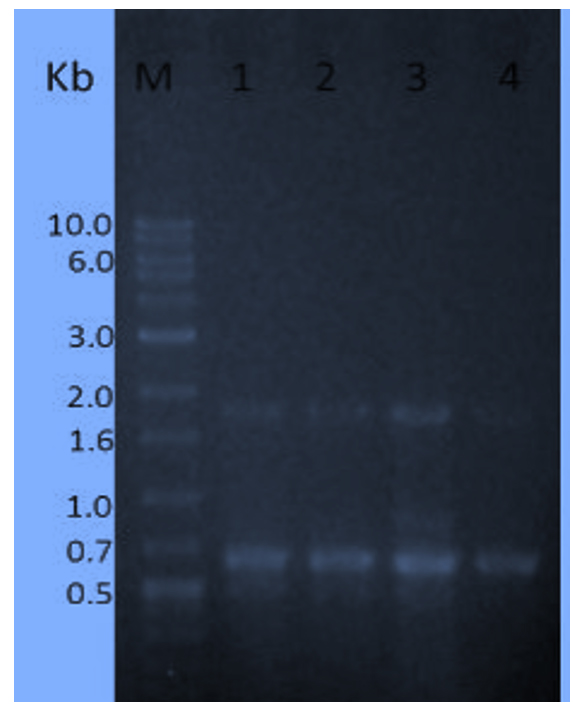 Fig. 4.DNA amplified banding profiles using primer (R3) based on RAPD for three Superior mutants (Lanes 2 to 4) and S. albogriseolus W.T (lane 1) opposite to Sizer™ -1000 plus DNA Marker (lane M). Superior mutants sequence as follows: T-40-22, T-40-29 and G-60-12.
In general, the number of the obtained amplified DNA bands as shown in (Table 6) when used the primer R1 and primer R3 were 12 bands while 10 bands were obtained when used the primer R2. On the other hands, the highest polymorphic bands were exhibited with the primer R1 and the lowest polymorphic bands were exhibited with the primer R3. No polymorphic bands were obtained with the primer R2. Furthermore, when used the primer R2 and primer R3, the produced monomorphic bands are the same number (8 bands) and no monomorphic bands produced when used the primer R1. Moreover, when used the primer R1 and primer R2, the produced unique bands are the same number (2 bands) and one unique bands produced when used the primer R3.
Table (6):
Types and number of the amplified DNA bands as well as the total polymorphism percentage generated by three RAPD primers.
Polymorphic percentage |
Polymorphic bands |
Unique bands |
Monomorphic bands |
Total bands |
Primer code |
|---|---|---|---|---|---|
83.33% |
10 |
2 |
0 |
12 |
R1 |
00.00% |
0 |
2 |
8 |
10 |
R2 |
25.00% |
3 |
1 |
8 |
12 |
R3 |
– |
13 |
5 |
16 |
34 |
Total |
It makes sense that the change in DNA nucleotides must have the effect on RAPD fingerprints. In theory therefore, one change base can detect mutations in genomic DNA by this method. The modifications at the annealing sites of the primer may inhibit annealing and can result in loss of corresponding amplified product. Alternatively, new annealing locations can arise from mutations in the template, thus producing new fragments. Many studies using PCR-RAPD fingerprinting protocols to differentiate of bacterial strains and mutants (Schaaper and Dunn, 1987; Welsh and McClelland, 1990; Symonds, 1991; Makino et al., 1994; Shoukry et al., 2013; Subedi et al., 2015; El-Sherbini and Khattab, 2018). Furthermore, Yongheng et al., (2011) confirmed that using PCR-RAPD, not only the difference between mutant strains and the wild type strain is identified but variable mutants also could be identified.
Phylogenetic tree in relation to PCR-RAPD assay
From the PCR-RAPD data, the genetic distance were performed to generate correct relationships based on different genome sites (Table 7). The highest percentage of genetic distance was detected between T-40-29 and W.T (90%) followed by (70%) between T-40-22 and T-40-29. Moreover, the lowest genetic distance matrix (57.10%) was obtained between G-60-12 and W.T, T-40-22 and T-40-29.
Table (7):
Relationship between the tested mutant strains against wild type strain based on RAPD analysis (Proximity Matrix).
Strain code |
W.T |
T-40-22 |
T-40-29 |
G-60-12 |
|---|---|---|---|---|
W.T |
1.000 |
0.700 |
0.900 |
0. 571 |
T-40-22 |
0.700 |
1.000 |
0.700 |
0. 571 |
T-40-29 |
0.900 |
0.700 |
1.000 |
0. 571 |
G-60-12 |
0.571 |
0. 571 |
0. 571 |
1.000 |
As shown in (Fig. 5), the dendrogram based on PCR-RAPD distance indicates separated the mutant T-40-29 and the wild type strain of S. albogriseolus into one first cluster and this cluster was linked with the mutant T-40-22 in the second cluster. Finally, the first and second clusters linked with the highly different mutant G-60-12 in the latest cluster.
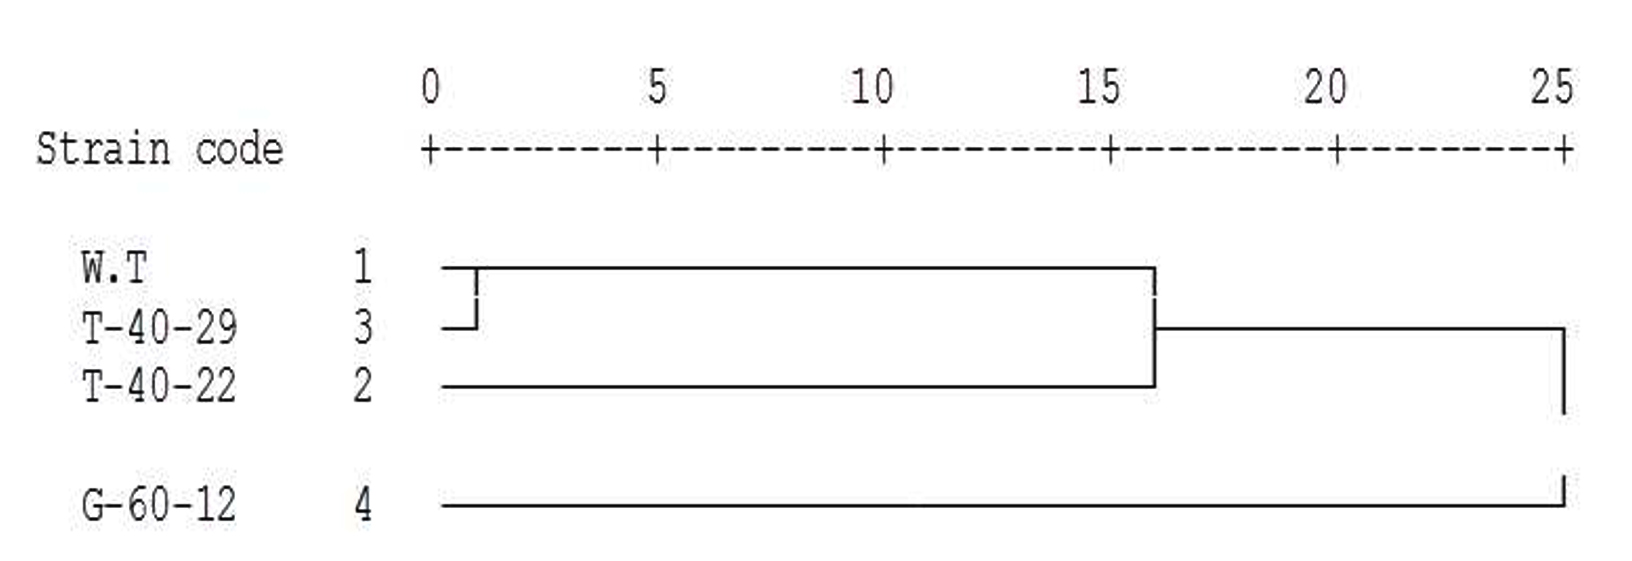 Fig. 5.Dendrogram using Average Linkage of the three mutant strains in comparison with W.T based on PCR-RAPD assay.
The above cluster analysis was applied to divide the studied genotypes into groups which could be reflecting the genetic diversity of the excellent neomycin producer mutants. Moreover, the dendogram illustrated that the new genotype (mutant T-40-29) which assumed to be highly neomycin producer was grouped together in one cluster, but the other new genotypes were highly different and located in other clusters.
The obtained results are in agreement with those reported by (Yongheng et al., 2011; Shoukry et al., 2013; Khattab et al., 2018). The five different mutants which superior for ochratoxin biosorption and the wild type strain of Lb. delbrueckii NRRL B-1024 were separated into two main clusters based on RAPD analysis (Khattab et al., 2018).
Enhancement of neomycin productivity using S. albogriseolus mutant strains after NTG-mutagenesis was produced by this manuscript. Moreover, variations in some excellent mutants PCR-RAPD profiles in relation to the wild type strain were detected and these variations at the same time proved as evidence of genetic deverisity of S. albogriseolus mutants. Also, phylogenetic analysis was used to divide the studied mutants into clusters which could reflect the genetic diversity of the new superior neomycin mutants.
Acknowledgement
None.
Conflict Of Interest
The authors declares that there is no conflict of interest.
Authors’ Contribution
All authors listed have made a substantial, direct and intellectual contribution to the work, and approved it for publication.
Funding
None.
Data Availability
All data is freely available from the corresponding author on request.
Ethics Statement
Not applicable.
- Benedict R.G., O.L. Shotwell, T.G. Pridham, L.A. Lindenfelser, W.C. Haynes. The production of the neomycin complex by Streptomyces albogriseolus nov.sp. Antibiot. & Chemother., 1954; 4: 653-656.
- Bottero V., S. Sadagopan, K.E. Johnson, S. Dutta, M.V. Veettil, B. Chandran. Kaposi’s sarcoma-associated herpesvirus-positive primary effusion lymphoma tumor formation in NOD/SCID mice is inhibited by neomycin and neamine blocking angiogenin’s nuclear translocation. J. Virol., 2013; 87(21): 11806–11820.
Crossref - Caetono-Anolles G. Amplifying DNA with arbitrary oligonucleotide primers. PCR Methods Applic., 1993; 3: 85–94.
Crossref - Cerda-Olmedo E., P.C. Hanawalt. Macromolecular action of nitrosoguanidine in Escherichia coli. Biochimica et Biophysica Acta (BBA) – Nucleic Acids and Protein Synthesis, 1967; 142: 450–464.
Crossref - El-Bondkly A.M., A.A. Khattab. Clavulanic acid and cephamycin improvement in Streptomyces clavuligerus by inducing combined resistant mutations and protoplast fusion. Egypt J. Genet. Cytol., 2004; 33: 217- 230.
- El-Sherbini A., A.A. Khattab. Induction of novel mutants of Streptomyces lincolnensis with high lincomycin production. J. Appl. Pharm. Sci., 2018; 8: 128-135.
- Gause G.F., T.P. Preobrazhenska, E.S. Kudrina, N.O. Blinov I.D. Rjabova, and M.A. Sveshnikova. Problems Pertaining to the Classification of Actinomycetesantagonists [in Russian]. Medgiz. Moscow, Russia, 1957.
- Hammer O., D.A.T. Harper, P.D. Ryan. PAST: Paleontological Statistics Software Package for Education and Data Analysis. Palaeontologia Electronica, 2001; 4(1): 1-9.
- Ikeh E.I. Methicilin-resistant Staphylococcus aureus (MRSA) at Jos University Teaching Hospital. African J. Clinic. Exp. Microbiol., 2003; 4: 52-55.
Crossref - Jacela J.Y., J.M. Derouchey, M.D. Tokach, R.D. Goodband, J.L. Nelssen, D.G. Renter, S.S. Dritz. Feed additives for swine: fact sheets – acidifiers and antibiotics. J. Swine Health Prod., 2009; 17(5): 270–275.
Crossref - Jin Z.H., J.P. Lin, Z.N. Xu, P.L. Cen. Improvement of industry-applied rifamycin B-producing strain, Amycolatopsis mediterranei, by rational screening. J. Gen.Appl. Microbiol., 2002a; 48: 329–334.
Crossref - Jin Z.H., M.R. Wang, P.L. Cen. Production of teicoplanin by valine analogue-resistant mutant strains of Actinoplanes teichomyceticus. Appl. Microbiol. Biotechnol., 2002b; 58: 63–66.
Crossref - Khattab A.A. Genetic construction of superior strains of Streptomyces kanamyceticus for kanamycin production. Egypt J. Biotechnol., 2011; 39: 95- 109.
- Khattab A.A., A.M. El-Bondkly. Construction of superior Streptomyces noursei fusants for nystatin and antibacterial antibiotic production. Arab J. Biotechnol., 2006; 9: 95 – 106.
- Khattab A.A., M. I.M. Ibrahim, A. EL-Kady. Ochratoxin A biosorption onto genetically improved of Lactobacillus delbrueckii mutants. Int. Food. Res. J., 2018; 25: 515-522.
- Li Y., H. Tan. Biosynthesis and molecular regulation of secondary metabolites in microorganisms. Sci. China Life Sci., 2017; 60(9): 935–938.
Crossref - Lynch M. The similarity index and DNA fngerprinting. Molecular Biology and Evolution, 1990; 7(5): 478-484.
- Lyutskanova D.G., M.M. Stoilova-Disheva, V.T. Peltekova. Increase in Tylosin Production by a Commercial Strain of Streptomyces fradiae. Appl. Biochem. Microbiol., 2005; 41, 165–168.
Crossref - Makino S.I., Y. Okada, T. Maruyama, S. Kaneko, C. Sasakawa. PCR-based random amplified polymorphic DNA fingerprinting of Yersinia pseudotuberculosis and its practical approach. J. Clin. Microbial., 1994; 32: 65-69.
- Niu G., J. Zheng, H. Tan. Biosynthesis and combinatorial biosynthesis of antifungal nucleoside antibiotics. Sci. China Life Sci., 2017; 60(9): 939–947.
Crossref - Peter K., M.K. Reiner, D. Wolfgang. A numerical classification of the genera Streptomyces and Streptoverticillium using miniaturized physiological tests. J. Gen. Microbiol., 1991; 137: 1831-1891.
Crossref - Power E.G. RAPD typing in microbiology – a technical review. J. Hosp. Infect., 1996; 34: 247–265.
Crossref - Sambrook J., E.F. Fritsch, T. Maniatis. Molecular Cloning; A Laboratory Manual, Second Edition Cold Spring Harbor, 1989.
- Schaaper R.M., R.L. Dunn. Spectra of spontaneous mutations in Escherichia coli strains defective in mismatch correction: the nature of in vivo DNA replication errors, Proc. Nat. Acad. Sci. U.S.A., 1987; 84: 6220–6224.
Crossref - Shoukry A.A., A.A. Khattab, M. Abou-Ellail and H.M. El-shabrawi. Molecular and biochemical characterization of new Rhizobium leguminosarum bio viciae strains isolated from different located of Egypt. Journal of App. Sci. Research, 2013; 9(11): 5864-5877.
- Subedi P., S. Simon, T. M. Rubin, P. Bharat, B. T. Kiran. Sodium azide induced mutaion of Actinomycetes II: Biochemical and Genetic Characterization. World J. Pharm. Sci., 2015; 3: 355-360
- Symonds N. A fitter theory of evolution? New Sci. 1991; 131: 30–34.
- Takahashi Y., M. Igarashi. Destination of aminoglycoside antibiotics in the ‘post-antibiotic era’. J. Antibiot (Tokyo), 2017; 71: 4–14.
Crossref - Waksman S.A., H.A. Lechevalier. Neomycin, a new antibiotic active against streptomycin-resistant bacteria, including tuberculosis organisms. Science, 1949; 109(2830): 305–307.
Crossref - Welsh J., M. McClelland. Fingerprinting genomes using PCR with arbitrary primers. Nucleic Acids Res., 1990; 18: 7213-7218.
Crossref - Williams J.K.G., A.R. Kubelik, K.J. Livak, J.A. Rafalski, S.V. Tingev. DNA polymorphisms amplified by arbitrary primers are useful as genetic markers. Nucleic Acids Res., 1990; 18: 6531-6535.
Crossref - Xiang-Jing W., Xiao-Chong Wang, Wen-Sheng Xiang. Improvement of milbemycin-producing Streptomyces bingchenggensis by rational screening of ultraviolet- and chemically induced mutants. World J. Microbiol. Biotechnol., 2009; 25: 1051–1056.
Crossref - Yongheng, B., S. Wang, J. Chen, J. Liang. RAPD analysis on avermectin high-producing strain of Streptomyces Avermilis Irradiated by 12C6+ ions. Adv. Mat. Res., 2011; 339: 701-704.
Crossref - Yu G., J. Xiaoqiang, W. Jianping, L. Wenyu, W. Guoying, C. Qinggele, C. Yunlin. Strain Improvement of Streptomyces roseosporus for Daptomycin Production by Rational Screening of He–Ne Laser and NTG Induced Mutantsand Kinetic Modeling. Appl. Biochem. Biotechnol., 2011; 163: 729–743.
Crossref - Zhihua J., L. Yinlin , L. Jianping , C. Peilin. Improvement of pristinamycin-producing Streptomyces pristinaespiralis by rational screening. World J. Microbiol. Biotechnol., 2006; 22: 129–134.
Crossref
© The Author(s) 2019. Open Access. This article is distributed under the terms of the Creative Commons Attribution 4.0 International License which permits unrestricted use, sharing, distribution, and reproduction in any medium, provided you give appropriate credit to the original author(s) and the source, provide a link to the Creative Commons license, and indicate if changes were made.