

ISSN: 0973-7510
E-ISSN: 2581-690X
In this work, a mixture design was used to investigate the influence of ten carbon sources on the production of two pigments, undecylprodigiosin and actinorhodin, from Streptomyces coelicolor. These carbon sources were glucose, sucrose, fructose, mannose, glycerol, mannitol, lactose, starch, maltose and methylcellulose. The effect of each carbon source on the production of each pigment was investigated separately and as a mixture of two carbon sources. According the mixture design, 3.29 of fructose and 6.66 g/L of sucrose can be used to achieve maximum production of undecylprodigiosin (58.07 mg/L). Whereas, in order to achieve maximum production of actinorhodin (67.9 mg/L), culture was supplemented with 9.8 g/L of glucose. However, if the target was to produce both pigments in the same culture, 7.1 g/L of fructose and 2.81 g/L of sucrose have to be used as carbon sources to produce 36.717 and 51.78 mg/L of undecylprodigiosin and actinorhodin respectively. The accuracy of model of the optimized carbon sources suggested by the mixture design for both pigments was verified in several experiments and results were approximately closed to the predicted values. Moreover, according to mixture design, the most carbon sources that influence production of undecylprodigiosin and actinorhodin were glucose, fructose and sucrose.
mixture design, optimization, carbon source, undecylprodigiosin, actinorhodin
Optimization of culture medium is a critical step in the development of fermentation process since it may affect the physiological behavior of the microorganism during growth and consequently control its productivity1. In general, the overproduction of a particular metabolite is affected by different fermentation parameters and perhaps the most important one is the carbon source. The type and amount of carbon source and the ability of microorganism to assimilate it effectively are the main determinants of microbial nature and its metabolic activity2. Thus, during the optimization of carbon source, it must be considered that a minimal growth requirement of the microorganism should be achieved for gaining maximum production of a particular metabolites. Therefore, in order to improve the microbial productivity of secondary metabolites, researchers optimized the type and concentration of carbon source and found that carbon source requirements were varying from strain to strain and from product to product3.
On the other hand, most research to date has tended to focus on using one carbon source in the fermentation medium rather than mixture. Although this may be feasible in terms of economics, but certainly does not display the full capacity of the microorganism in terms of metabolites production. As it is well known, the use of more than carbon source in the medium is usually accompanied with a phenomenon of carbon catabolite repression (CCR) in particular when the medium contains mixtures of rapidly and slowly used carbon sources4. In such a case, microorganism tend to consume the simplest one for example glucose and then turned to the second-best carbon source that usually associates temporally with the onset of secondary metabolites production and this normally correlate with growth cessation5. In general, for many microorganisms such as actinomycetes, monosaccharide for instance glucose is an ideal carbon source that effects global repression of secondary metabolites production. For that reason,, in industrial fermentations polysaccharides (e.g., sucrose and starch), oligosaccharides (e.g., lactose) and oils are generally used6.
For designing a production medium with most suitable carbon source, both classical and statistical strategies were used. The classical optimization is usually described as an expensive method with time consuming as it involves plenty of experiments. However, with modern mathematical/statistical techniques, optimization process has become more effective and efficient in giving the results7. In fact, the statistical method is a powerful tool for the optimization process which is basically based on finding the significant variables from large sets of variables through a set of planned experiments. It involves changing more than one component at a time instead of changing only one-factor. Therefore, the statistical method which is also called design of experiment can be more efficient because all the limitations of classical methods can be overcome7,8. In this work, a mixture design which is a special class of response surface methodology was used to evaluate the influence of ten carbon sources separately and as a mixture of two carbon sources on the production of undecylprodigiosin and actinorhodin from Streptomyces coelicolor.
Microorganism
MT1110 strain of Streptomyces coelicolor A3 (2) was used throughout this work which originally derived from the wild type strain 1147 (20). This strain was kindly provided by Professor Ferda Mavituna /The University of Manchester in UK. Streptomyces coelicolor was grown on MS agar slant at 30 C for 10-14 days. 5 ml of sterile distilled water was added to the slant to collect spores by scraping the growth gently with loop and then the obtained water was centrifuged at 8000 rpm for 15 min. Next, the collected spores were washed and re-suspend in 1ml of sterile distilled water which then counted using a haemocytometer.
Medium and culture conditions
A chemically defined liquid medium described by G. HOBBS et al.9 was used throughout this work for the production of undecylprodigiosin and actinorhodin by Streptomyces coelicolor A3 (2). It contains (10 glucose, 5 NaCl, 5 Na2SO4, 4.5 NaNO3, 2.0 K2HPO4, 1.2 tris base, 1.0 MgSO4.7H2O, 0.0178 ZnSO4.7H2O) g per L. The pH was adjusted to 7.2 prior to autoclaving.
In all experiments, spore inoculum was used which was kept to be approximately contain 1×10⁹ spores/mL. 500 microliter of this spore suspension was used to inoculate 100 ml defined liquid medium which then incubated in an orbital shaker at 30°C and agitated at 200 rpm.
Carbon source optimization using mixture design
Ten carbon sources (glucose, sucrose, fructose, mannose, glycerol, mannitol, lactose, starch, maltose, methyl cellulose) were used and tested in terms of supporting production of undecylprodigiosin and actinorhodin. A statistical method using response surface methodology (RSM) was used to optimize undecylprodigiosin and actinorhodin production using mixture design. The effect of each variable and their interaction as well as the statistical analysis were investigated in order to obtain the predicted production of each pigment.
Analytical method
Actinorhodin was extracted from Streptomyces coelicolor culture by adding an equal volume of 2 N NaOH and then pH was adjusted to 12. The mixture was mixed vigorously for at least three hours. Thereafter, the absorbance of the supernatant was measured at 640 nm after removing the cell debris and actinorhodin concentration was determined using the specific extinction coefficient E (1 %, 1 cm) = 35510.
Undecylprodigiosin was calculated based on the method described by Kang, et al.11. Undecylprodigiosin was first extracted by adding an equal volume of methanol to the cell pellets collected from a known volume of the Streptomyces coelicolor growth culture. Then, the mixture was mixed vigorously for at least 3 hours. Next, after removing cell debris, the absorbance of the supernatant was determined at 530 nm. Molar extinction coefficient (E 530 =100150 M-1 cm-1) was used to calculate the concentration of undecylprodigiosin.
A carbon source is essential to provide the cell with materials necessary for most biological reactions leading to growth, provide energy source as well as product formation. Basically, they have a major effect on the expression of biosynthetic genes in microorganisms and therefore, selection of a good and adequate carbon source is vital and required to support production of a particular metabolite. In our work, a chemically defined medium was used which initially designed in 1982 by Roth and Noack and next developed by Hobbs and co-workers9 for studying the physiology of the genus Streptomyces with glucose as a sole carbon source. Preliminary results showed that the blue pigmented actinorhodin was mainly produced in this medium with maximum concentration of 64.2 mg/L after seven days of incubation. Whereas, 11.6 mg/L was the maximum production of the red pigment undecylprodigiosin obtained at the fifth day of incubation (Figure 1).
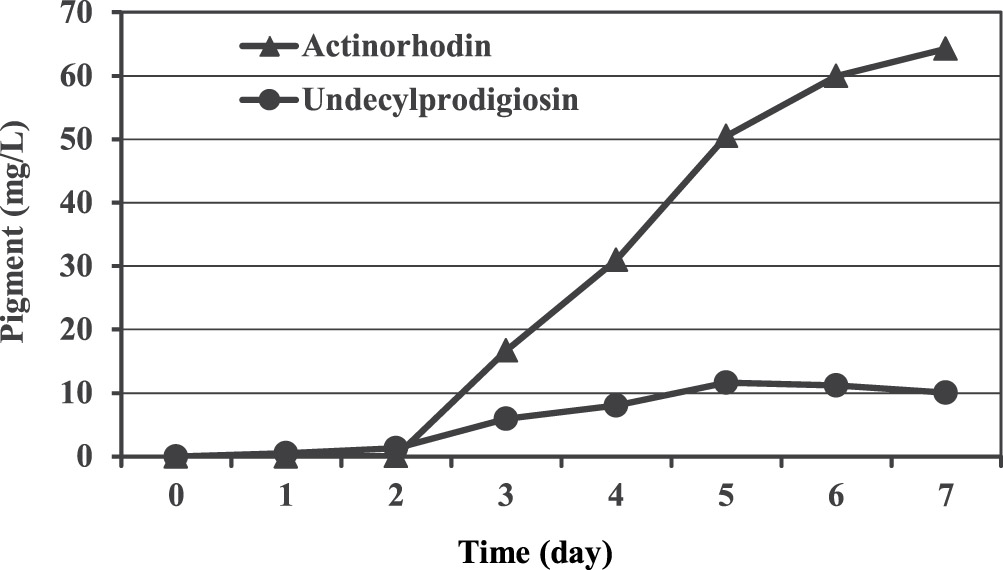
Fig. 1. Production of undecylprodigiosin and actinorhodin by Streptomyces coelicolor in Hobbs’s medium.
In this work a mixture design was used to evaluate the influence of ten different carbon sources, separately or as a mixture, on the production of both actinorhodin and undecylprodigiosin from Streptomyces coelicolor. In the experimental design, each carbon source was used in two limits: zero (lower limits) and 10 g/L (upper limit). We imposed the constraints to be exactly nine factors omitted in vertex point, eight factors omitted in center edge and no component omitted in the axial CB and center point. 67 runs were generated and randomized by the software program (DESIGN EXPERT 7) based on simplex lattice method as shown in Table (1). This table illustrates both the actual and predicted values of the two responses: undecylprodigiosin and actinorhodin which approximately were closed to each other. As can be seen from the table, production of undecylprodigiosin was significantly increased in cultures contain glycerol, mannose, mannitol and sucrose. Undecylprodigiosin is belongs to a group of polypyrrole bioactive compounds called prodiginines which also involved prodigiosin produced by Serratia spp12. Most prodiginines compounds are chemically similar and almost have similar biosynthetic pathways. In reviewing the literature, we can find that sucrose13,14 glycerol15, mannose and mannitol16 were appropriate carbon sources that can support maximum production of prodigiosin. Moreover, many studies mentioned that prodigiosin production was decreased or even inhibited in the presence of glucose as a sole carbon source however, the basis for this phenomenon is incompletely understood so far17,18. The present findings seem to be consistent with previous research as production of undecylprodigiosin was poor in the presence of glucose.
Table (1):
Experimental design for actinorhodin and undecylprodigiosin production along with actual and predicted response for ten carbon sources.
| STD | A | B | C | D | E | F | G | H | I | J | Und. (mg/L) | Act. (mg/L) | ||
|---|---|---|---|---|---|---|---|---|---|---|---|---|---|---|
| Actual | Predict | Actual Predict | ||||||||||||
| 1 | 10 | 0 | 0 | 0 | 0 | 0 | 0 | 0 | 0 | 0 | 10 | 27.1 | 67 | 68.9 |
| 2 | 5 | 5 | 0 | 0 | 0 | 0 | 0 | 0 | 0 | 0 | 44 | 39.5 | 41 | 40.3 |
| 3 | 5 | 0 | 5 | 0 | 0 | 0 | 0 | 0 | 0 | 0 | 36 | 31.9 | 38 | 36.7 |
| 4 | 5 | 0 | 0 | 5 | 0 | 0 | 0 | 0 | 0 | 0 | 41 | 38.6 | 27 | 35.4 |
| 5 | 5 | 0 | 0 | 0 | 5 | 0 | 0 | 0 | 0 | 0 | 22 | 44.2 | 53 | 38.6 |
| 6 | 5 | 0 | 0 | 0 | 0 | 5 | 0 | 0 | 0 | 0 | 40 | 37.5 | 42 | 39.3 |
| 7 | 5 | 0 | 0 | 0 | 0 | 0 | 5 | 0 | 0 | 0 | 26 | 26.2 | 45 | 40.7 |
| 8 | 5 | 0 | 0 | 0 | 0 | 0 | 0 | 5 | 0 | 0 | 46 | 23.3 | 64 | 38.6 |
| 9 | 5 | 0 | 0 | 0 | 0 | 0 | 0 | 0 | 5 | 0 | 34 | 31.8 | 35 | 38.3 |
| 10 | 5 | 0 | 0 | 0 | 0 | 0 | 0 | 0 | 0 | 5 | 15 | 13.1 | 37 | 33.8 |
| 11 | 0 | 10 | 0 | 0 | 0 | 0 | 0 | 0 | 0 | 0 | 54 | 52 | 22 | 11.6 |
| 12 | 0 | 5 | 5 | 0 | 0 | 0 | 0 | 0 | 0 | 0 | 47 | 44.4 | 5.9 | 8.1 |
| 13 | 0 | 5 | 0 | 5 | 0 | 0 | 0 | 0 | 0 | 0 | 56 | 51.1 | 9 | 6.8 |
| 14 | 0 | 5 | 0 | 0 | 5 | 0 | 0 | 0 | 0 | 0 | 53 | 56.6 | 5 | 9.9 |
| 15 | 0 | 5 | 0 | 0 | 0 | 5 | 0 | 0 | 0 | 0 | 46 | 50 | 21 | 10.7 |
| 16 | 0 | 5 | 0 | 0 | 0 | 0 | 5 | 0 | 0 | 0 | 44 | 38.7 | 7 | 12.1 |
| 17 | 0 | 5 | 0 | 0 | 0 | 0 | 0 | 5 | 0 | 0 | 38 | 35.8 | 2 | 9.9 |
| 18 | 0 | 5 | 0 | 0 | 0 | 0 | 0 | 0 | 5 | 0 | 43 | 44.3 | 6 | 9.7 |
| 19 | 0 | 5 | 0 | 0 | 0 | 0 | 0 | 0 | 0 | 5 | 28 | 25.6 | 1 | 5.2 |
| 20 | 0 | 0 | 10 | 0 | 0 | 0 | 0 | 0 | 0 | 0 | 42 | 36.8 | 15 | 4.5 |
| 21 | 0 | 0 | 5 | 5 | 0 | 0 | 0 | 0 | 0 | 0 | 39 | 43.5 | 5 | 3.2 |
| 22 | 0 | 0 | 5 | 0 | 5 | 0 | 0 | 0 | 0 | 0 | 47 | 49 | 1 | 6.4 |
| 23 | 0 | 0 | 5 | 0 | 0 | 5 | 0 | 0 | 0 | 0 | 40 | 42.4 | 3 | 7.2 |
| 24 | 0 | 0 | 5 | 0 | 0 | 0 | 5 | 0 | 0 | 0 | 39 | 31.1 | 3 | 8.5 |
| 25 | 0 | 0 | 5 | 0 | 0 | 0 | 0 | 5 | 0 | 0 | 28 | 28.2 | 2 | 6.4 |
| 26 | 0 | 0 | 5 | 0 | 0 | 0 | 0 | 0 | 5 | 0 | 41 | 36.6 | 8 | 6.2 |
| 27 | 0 | 0 | 5 | 0 | 0 | 0 | 0 | 0 | 0 | 5 | 16 | 17.9 | 4 | 1.6 |
| 28 | 0 | 0 | 0 | 10 | 0 | 0 | 0 | 0 | 0 | 0 | 56 | 50.2 | 10 | 1.9 |
| 29 | 0 | 0 | 0 | 5 | 5 | 0 | 0 | 0 | 0 | 0 | 56 | 55.7 | 7 | 5.1 |
| 30 | 0 | 0 | 0 | 5 | 0 | 5 | 0 | 0 | 0 | 0 | 49 | 49.1 | 3 | 5.9 |
| 31 | 0 | 0 | 0 | 5 | 0 | 0 | 5 | 0 | 0 | 0 | 38 | 37.8 | 3 | 7.2 |
| 32 | 0 | 0 | 0 | 5 | 0 | 0 | 0 | 5 | 0 | 0 | 38 | 34.9 | 3 | 5.1 |
| 33 | 0 | 0 | 0 | 5 | 0 | 0 | 0 | 0 | 5 | 0 | 44 | 43.3 | 5 | 4.9 |
| 34 | 0 | 0 | 0 | 5 | 0 | 0 | 0 | 0 | 0 | 5 | 27 | 24.6 | 1 | 0.3 |
| 35 | 0 | 0 | 0 | 0 | 10 | 0 | 0 | 0 | 0 | 0 | 67 | 61.3 | 5 | 8.2 |
| 36 | 0 | 0 | 0 | 0 | 5 | 5 | 0 | 0 | 0 | 0 | 43 | 54.6 | 1 | 9 |
| 37 | 0 | 0 | 0 | 0 | 5 | 0 | 5 | 0 | 0 | 0 | 41 | 43.3 | 8 | 10.4 |
| 38 | 0 | 0 | 0 | 0 | 5 | 0 | 0 | 5 | 0 | 0 | 35 | 40.4 | 3 | 8.2 |
| 39 | 0 | 0 | 0 | 0 | 5 | 0 | 0 | 0 | 5 | 0 | 49 | 48.9 | 4 | 8 |
| 40 | 0 | 0 | 0 | 0 | 5 | 0 | 0 | 0 | 0 | 5 | 27 | 30.2 | 6 | 3.5 |
| 41 | 0 | 0 | 0 | 0 | 0 | 10 | 0 | 0 | 0 | 0 | 64 | 48 | 14 | 9.8 |
| 42 | 0 | 0 | 0 | 0 | 0 | 5 | 5 | 0 | 0 | 0 | 36 | 36.7 | 4 | 11.2 |
| 43 | 0 | 0 | 0 | 0 | 0 | 5 | 0 | 5 | 0 | 0 | 34 | 33.8 | 1 | 9 |
| 44 | 0 | 0 | 0 | 0 | 0 | 5 | 0 | 0 | 5 | 0 | 42 | 42.3 | 19 | 8.8 |
| 45 | 0 | 0 | 0 | 0 | 0 | 5 | 0 | 0 | 0 | 5 | 27 | 23.6 | 8 | 4.2 |
| 46 | 0 | 0 | 0 | 0 | 0 | 0 | 10 | 0 | 0 | 0 | 24 | 25.4 | 30 | 12.6 |
| 47 | 0 | 0 | 0 | 0 | 0 | 0 | 5 | 5 | 0 | 0 | 23 | 22.5 | 2 | 10.4 |
| 48 | 0 | 0 | 0 | 0 | 0 | 0 | 5 | 0 | 5 | 0 | 36 | 30.9 | 12 | 10.2 |
| 49 | 0 | 0 | 0 | 0 | 0 | 0 | 5 | 0 | 0 | 5 | 19 | 12.3 | 4 | 5.6 |
| 50 | 0 | 0 | 0 | 0 | 0 | 0 | 0 | 10 | 0 | 0 | 15 | 19.6 | 23 | 8.2 |
| 51 | 0 | 0 | 0 | 0 | 0 | 0 | 0 | 5 | 5 | 0 | 31 | 28 | 0.9 | 8 |
| 52 | 0 | 0 | 0 | 0 | 0 | 0 | 0 | 5 | 0 | 5 | 9 | 9.3 | 1 | 3.5 |
| 53 | 0 | 0 | 0 | 0 | 0 | 0 | 0 | 0 | 10 | 0 | 45 | 36.5 | 14 | 7.8 |
| 54 | 0 | 0 | 0 | 0 | 0 | 0 | 0 | 0 | 5 | 5 | 13 | 17.8 | 2 | 3.2 |
| 55 | 0 | 0 | 0 | 0 | 0 | 0 | 0 | 0 | 0 | 10 | 0 | 0.9 | 0 | 1.3 |
| 56 | 5.5 | 0.5 | 0.5 | 0.5 | 0.5 | 0.5 | 0.5 | 0.5 | 0.5 | 0.5 | 19 | 31.3 | 49 | 41.1 |
| 57 | 0.5 | 5.5 | 0.5 | 0.5 | 0.5 | 0.5 | 0.5 | 0.5 | 0.5 | 0.5 | 38 | 43.8 | 9 | 12.4 |
| 58 | 0.5 | 0.5 | 5.5 | 0.5 | 0.5 | 0.5 | 0.5 | 0.5 | 0.5 | 0.5 | 29 | 36.2 | 5 | 8.9 |
| 59 | 0.5 | 0.5 | 0.5 | 5.5 | 0.5 | 0.5 | 0.5 | 0.5 | 0.5 | 0.5 | 33 | 42.9 | 5 | 7.6 |
| 60 | 0.5 | 0.5 | 0.5 | 0.5 | 5.5 | 0.5 | 0.5 | 0.5 | 0.5 | 0.5 | 58 | 48.4 | 31 | 10.7 |
| 61 | 0.5 | 0.5 | 0.5 | 0.5 | 0.5 | 5.5 | 0.5 | 0.5 | 0.5 | 0.5 | 34 | 41.8 | 9 | 11.5 |
| 62 | 0.5 | 0.5 | 0.5 | 0.5 | 0.5 | 0.5 | 5.5 | 0.5 | 0.5 | 0.5 | 22 | 30.5 | 9 | 12.9 |
| 63 | 0.5 | 0.5 | 0.5 | 0.5 | 0.5 | 0.5 | 0.5 | 5.5 | 0.5 | 0.5 | 22 | 27.6 | 4 | 10.7 |
| 64 | 0.5 | 0.5 | 0.5 | 0.5 | 0.5 | 0.5 | 0.5 | 0.5 | 5.5 | 0.5 | 21 | 36 | 6 | 10.5 |
| 65 | 0.5 | 0.5 | 0.5 | 0.5 | 0.5 | 0.5 | 0.5 | 0.5 | 0.5 | 5.5 | 20 | 17.3 | 3 | 6 |
| 66 | 1 | 1 | 1 | 1 | 1 | 1 | 1 | 1 | 1 | 1 | 10 | 35.6 | 1 | 13.2 |
| 67 | 10 | 0 | 0 | 0 | 0 | 0 | 0 | 0 | 0 | 0 | 12 | 11.1 | 48 | 68.9 |
Where:
A: glucose, B: sucrose, C: fructose, D: mannose, E: glycerol, F: mannitol G: lactose,
H: starch, I: maltose, J: methylcellulose concentrations in g/L.
The analysis of variance, ANOVA, of mixture design for undecylprodigiosin production is presented in Table (2) which shows that the lack of fit of the regression model is significant and fisher F test demonstrate high significant (P< 0.05) for the regression. The fineness of the model is evaluated using determination coefficient R2. In this case the determination coefficient (R2 =0.737) indicate that 26.4% of the total variation is not explained by the model. The adequate precision used to measure signal to noise, is supposed to be required greater than 4. In this case, the value of 20.3 revealed that the empirical model is of an adequate signal and can be used to navigate the design space. The adjusted and predicted coefficients of this model are 0.695 and 0.647, respectively.
Table (2):
Analysis of variance (ANOVA) of undecylprodigiosin production based on mixture design.
Source |
SS |
df |
MS |
F-value |
P-value>F |
|
|---|---|---|---|---|---|---|
model |
10025.74 |
9 |
1113.97 |
17.75 |
* |
|
Linear mixture |
10025.74 |
9 |
1113.97 |
17.75 |
* |
|
Residual |
3576.92 |
57 |
62.75 |
|||
Lack of fit |
3492.42 |
56 |
62.36 |
0.74 |
0.7506 |
** |
Pure error |
84.5 |
1 |
84.5 |
|||
Cor total |
13602.66 |
66 |
The experimental design from simplex lattic was fitted and can be explained in first order polynomial equation (1). The correlation is described by the ‘correlation coefficient’, a dimensionless descriptor, in which mixture design model is explained by L-pseudo component for undecylprodigiosin production19.
undecylprodigiosin =+27.08* A+52.02* B+36.79 * C+50.18 *D+61.25*E+48.02* F+25.41 * G+19.56* H+36.48 * J-0.90 * K … (1)
where A: glucose, B: sucrose, C: fructose, D: mannose, E: glycerol, F: mannitol G: lactose, H: starch, I: maltose, J: methylcellulose concentrations in g/L
On the other hand, the analysis of variance, ANOVA, of mixture design for actinorhodin production revealed that the lack of fit of the regression model is also significant and fisher F test shows high significant (P< 0.05) for regression (Table 3). In addition, evaluation of fineness of the model revealed that 21.1% of the total variation is not explained by the model based on the value of determination coefficient R2 (0.789). Furthermore, the adequate precision used to measure signal to noise, is greater than 4 and the value of 21.8 revealed that the empirical model is of an adequate signal and can be used to navigate the design space. The adjusted and predicted coefficients of the model are 0.7566 and 0.6891, respectively. Moreover, the experimental design from simplex lattic is fitted and can be explained in first order polynomial equation (2).
Table (3):
Analysis of variance (ANOVA) for actinorhodin production by Streptomyces coelicolorA(3)2.
Source |
SS |
df |
MS |
F-value |
P-value>F |
|
|---|---|---|---|---|---|---|
model |
14775.51 |
9 |
1641.72 |
23.8 |
* |
|
Linear mixture |
14775.51 |
9 |
1641.72 |
23.8 |
* |
|
Residual |
3932.49 |
57 |
68.99 |
|||
Lack of fit |
3751.99 |
56 |
67 |
0.37 |
0.8937 |
** |
Pure error |
180.50 |
1 |
180.50 |
|||
Cor total |
18708 |
66 |
Actinorhodin=+68.89* A+11.6* B+4.54* C+1.94* D+8.24 * E+9.78* F +12.55* G+8.23 * H+7.77 * J-1.29* K …(2)
Where: A: glucose, B: sucrose, C: fructose, D: mannose, E: glycerol, F: mannitol G: lactose, H: starch, I: maltose, J: methylcellulose concentrations in g/L
In addition to correlation, regression analysis can be used to assess the best fit of a line using the equation y = b0 + b1x. The ideal line of best fit would have the sum of the squares of the distances from x to the line of fit as small as possible. The diagnostic of normal residual demonstrated in Figure (2) for the production of both undecylprodigiosin and actinorhodin indicated that the residual behavior has followed normal distribution and was quadratic, which is the more important assumption for checking statistical modeling.
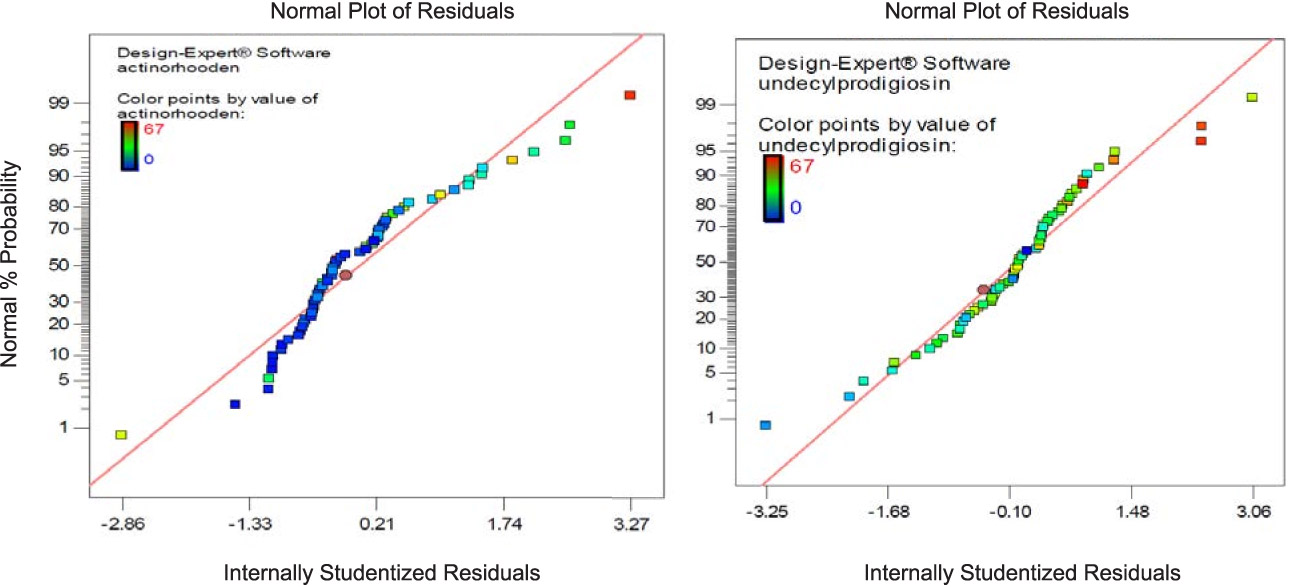
Fig. 2. Normal probability plot of standarized residual of linear L-pseudo model based on mixture simplex latic model for undecylprodigiosin and actinorhodin production by Streptomyces coelicolor A3(2).
Optimization of undecylprodigiosin and actinorhodin
Based on the regression model, an optimization plot of maximum production of both undecylprodigiosin and actinorhodin can be generated using the Design expert 7 software via determination the type and optimum concentration of carbon sources. Based on results presented in Figure (3), maximum concentration of undecylprodigiosin (58.07 mg/L) can be obtained in the medium contains 3.297 g/L of fructose and 6.665 g/L of sucrose as carbon sources. Whereas, production of actinorhodin can be reach to the maximum (67.94 mg/L) when 10 g/L of glucose is used as carbon source (Figure 4). However, if the target is to produce both pigments in the same medium, 7.17 g/L of fructose and 2.82 g/L of sucrose can be used as carbon sources and in this case concentration of undecylprodigiosin and actinorhodin could be 36.71 and 51.78 respectively (Figure 5).

Fig. 3. Ramp chart for statistically optimize carbone source for undecylprodigiosin production by Streptomyces coelicolor A(3)2
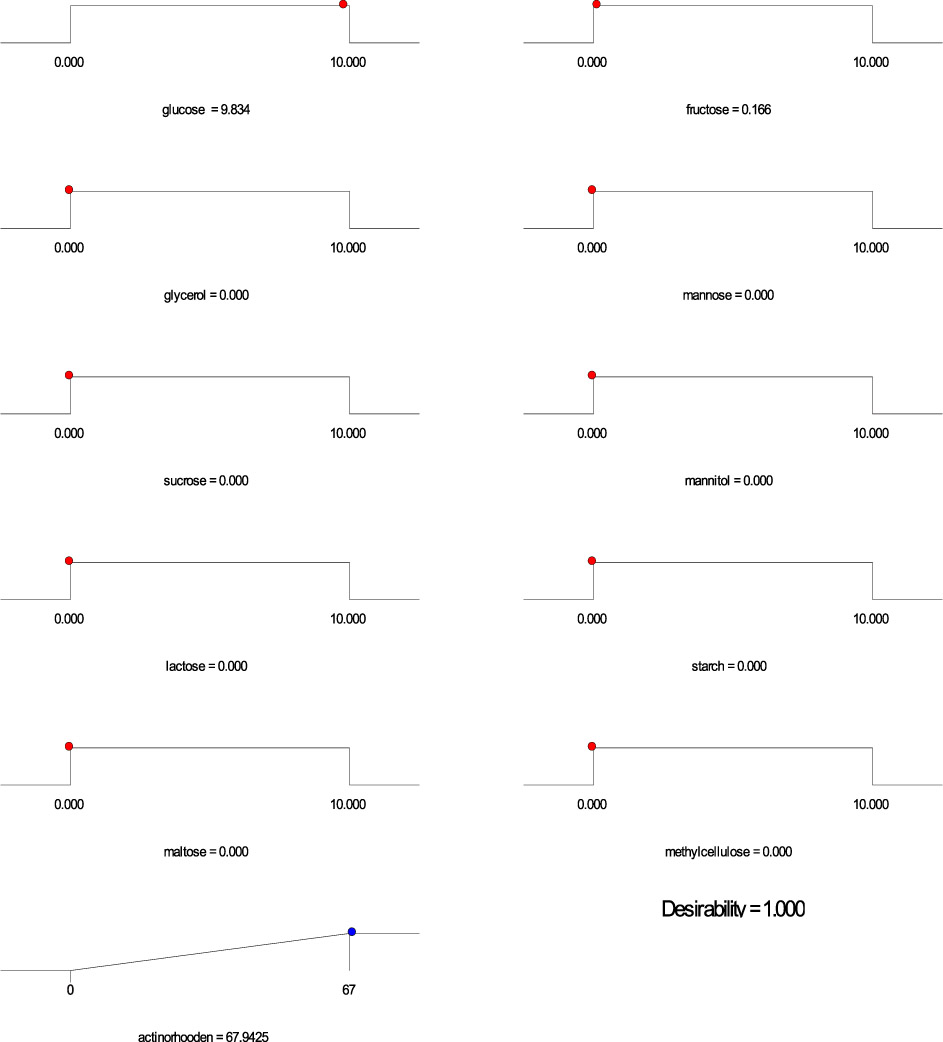
Fig. 4. Ramp chart for statistically optimize carbone source for actinorhodin production by Streptomyces coelicolor A(3)2

Fig. 5. Ramp chart for statistically optimize carbone source for both undecylprodigiosin and actinorhodin production by Streptomyces coelicolor A(3)2
The next step was to verify the optimization and predicted results of pigments production suggested by the mixture design. For this purpose, several experiments were performed using carbon sources suggested by mixture design for the maximum production of each pigment. Figure (6) shows that production of undecylprodigiosin in the culture contained fructose and sucrose was 52.8 mg/L which was approximately closed to the predicted value of 56.07 mg/L. Furthermore, production of actinorhodin in the culture supplemented with glucose as the best suggested carbon source for maximum actinorhodin was 64.1 mg/L compared with 67.94 mg/L predicted by the mixture design. Moreover, in culture contained carbon sources designed for obtaining maximum concentration of both pigments, the results were approximately closed to the predicted values. In this culture, production of undecylprodigiosin and actinorhodin were 33.8 and 47.9 mg/L respectively compared with 36.71 and 51.78 mg/L predicted by the mixture design for undecylprodigiosin and actinorhodin (Figure 7).
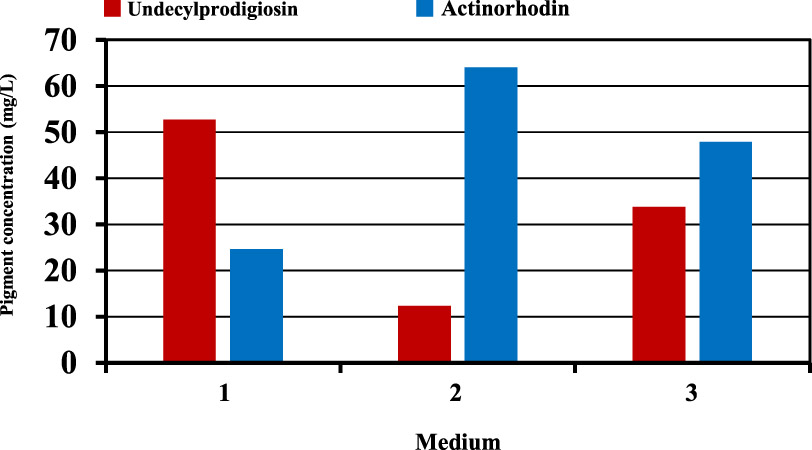
Fig. 6. Production of undecylprodigiosin and actinorhodin in cultures supplemented with different carbon sources based on mixture design (medium 1: 3.29 g/L fructose and 6.66 g/L sucrose; medium 2: 10 g/L glucose; medium 3: 7.17 g/L fructose and 2.82 g/L sucrose)
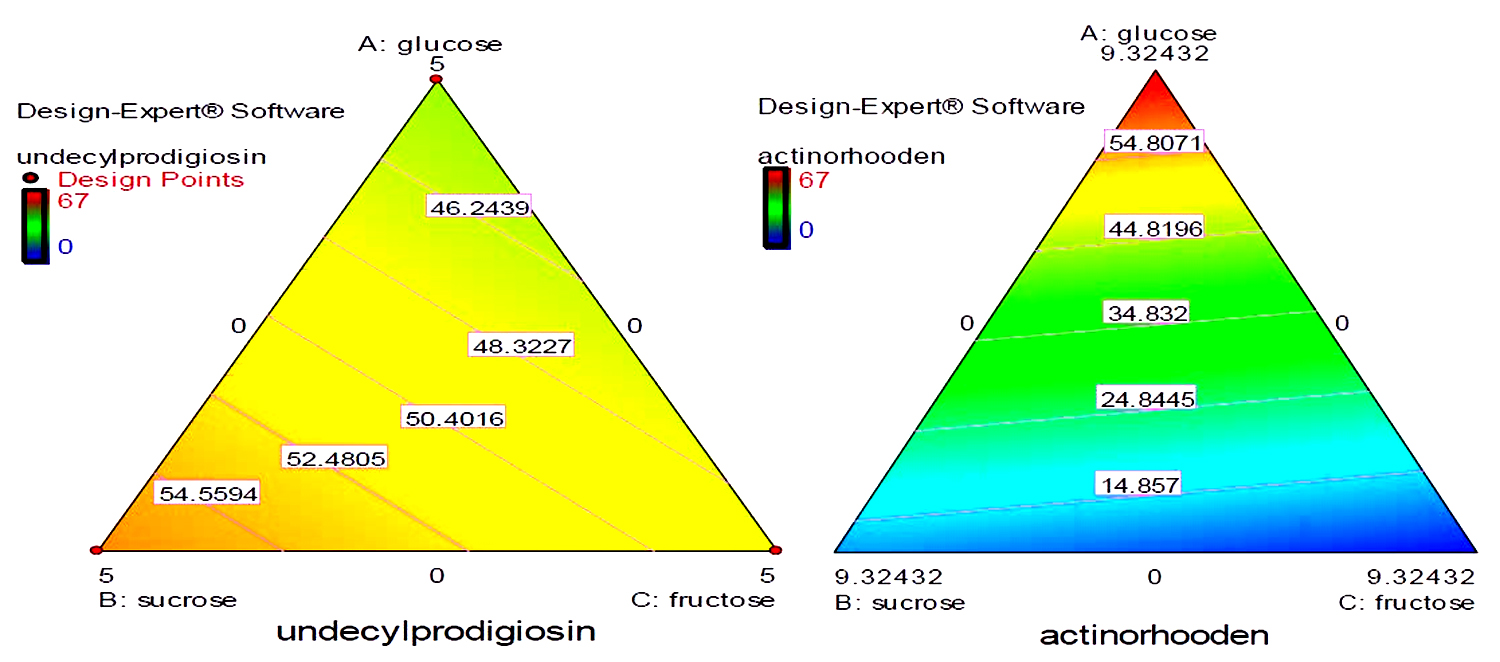
Fig. 7. Quadratic contour area ternary plots of three carbon sources and their effect on the production of actinorhodin and undecylprodigiosin by Streptomyces coelicolor.
The most striking result to emerge from the data comparison is that: there is a significant correlation between the production of undecylprodigiosin and actinorhodin as when one of the them increased the other one is already decreased. However, in all cases, the total production of both pigments is almost similar ranging from 70 to 80 mg/L. In reviewing the literature, it can be found that the biosynthesis of undecylprodigiosin and actinorhodin shows an interesting example of the regulation of more than one metabolite. Production of both pigments occurs during the transition period from the exponential to stationary phase20. However, biosynthesis of undecylprodigiosin is generally found to precede actinorhodin production though, its production rate declines significantly when actinorhodin starts to produce in the medium21. In their study, Kang and co-workers11 confirmed that actinorhodin production rate increased when undecylprodigiosin production decreased. As it is well known, microbial metabolites are usually synthesized through dedicated biosynthetic pathways that involve utilization of several precursors obtained from the catabolism of carbon source during the primary metabolism. In fact, a strong relationship between undecylprodigiosin and actinorhodin in terms of their precursors has been reported in the literature as they are ‘synthesized at least in part from the same precursors such as the intermediate precursor acetyl-Co A22.
On the other hand, mixture design also concluded that glucose, fructose and sucrose were the most carbon sources that may influence production of undecylprodigiosin and actinorhodin. Contour plots presented in figure (7) provide an interesting interaction results between these three carbon sources and their effect on the production of the two pigments. It can be seen that when glucose and fructose concentrations were increased from zero, actinorhodin production was consequently increased until the center of the triangle. Moreover, when glucose concentration was further increased, a sharp increase in actinorhodin production was predicted. It should be noted that at the vertices where a maximum concentration of glucose was present, there was a complete absence of sucrose and fructose. This was strongly supporting our earlier experimental observation that glucose was a key factor in actinorhodin production. In addition, the contour plots in figure (7) supports the conclusion that increasing sucrose concentration in the medium lead to increase undecylprodigiosin production. Moreover, maximum undecylprodigiosin production was predicted when high concentrations of sucrose and fructose were presented in the medium as carbon sources.
In conclusion, this work has explained that glucose, fructose and sucrose are the most carbon sources among the carbon sources used in this work that affect production of undecylprodigiosin and actinorhodin from Streptomyces coelicolor. Our result showed that using sucrose and fructose can increase undecylprodigiosin instead of actinorhodin which can be increased to the maximum when glucose is used as a carbon source. The results from this study make several contributions to the current literature on using mixture design as a first step for detecting the most suitable nutritional component to enhance a particular metabolite. In addition, our findings have gone some way towards enhancing our understanding of the role that a carbon source may play in the production of two metabolites produce simultaneously. Furthermore, the finding of this study supports previous research into use mixture of two carbon sources to stimulate the production of secondary metabolites as was observed in undecylprodigiosin production.
Conflict Of Interest
The author declare that there is no conflict of interest.
- Singh V, Haque S, Niwas R, Srivastava A, Pasupuleti M. Tripathi CKM. Strategies for Fermentation Medium Optimization: An In-Depth Review. Front Microbiol, 2017; 7: 2087.
- Kennedy M, Krous D. Strategies for improving fermentation medium performance: a review. J. Ind. Microbiol. Biotechnol, 1999; 23: 456-475.
- Ruiz B, Chávez A, Forero A, García-Huante Y, Romero A, Sánchez M, Rocha D. Production of microbial secondary metabolites: Regulation by the carbon source, Crit. Rev. Microbiol, 2010; 36(2): 146–167.
- Sanchez S, Chavez A, Forero A, Gaecia-Huante Y, Romero A, Sanchez M. Carbon source regulation of antibiotic production, J. Antibiot. 2010; 63: 442-459.
- Sanchez S, Demain AL. Metabolic regulation of fermentation processes, Enzyme Microb. Technol. 2002; 31: 895–906.
- Xiaobo Z, Linyu H, Yongcheng L, Zhongto L. Medium optimization of carbon and nitrogen sources for the production of eucalyptene A and xyloketal A from Xylaria sp.2508usingresponsesurface methodology, Process Biochem, 2006; 41: 293-298.
- Keskin T Gundo, Deniz ÿI, Çali G Skan, , Sahin ES, dAzbar N. Experimental design methods for bioengineering applications. Crit. Rev. Biotechnol, 2016;36(2):368-88.
- Shih I, Van Y., Chang Y. Application of statistical experimental methods to optimize production of poly (g-glutamicacid) by Bacillus licheniformis CCRC12826. Enzyme Microb. Technol. 2002; 31: 213–220.
- Hobbs G, Frazer CM, Gardner DCJ, Cullum JA, Oliver SG. Dispersal growth of Streptomyces coelicolor in liquid culture, Appl Microbiol Biotechnol. 1989; 31(3):272-277. J.L. Doull, L.C.
- Vining, Nutritional control of actinorhodin production by Streptomyces coelicolor A3(2) suppressive effects of nitrogen and phosphate. Appl Microbiol Biotechnol, 1990; 32(4): 449-54.
- Kang SG, Jin W, Bibb M, Lee KJ. Actinorhodin and undecylprodigiosin production in wild-type and relA mutant strains of Streptomyces coelicolor A3(2) grown in continuous culture. FEMS Microbiol Lett, 1998; 168(2):221-6.
- Stankovic N, Senerocic L, Ilic-Tomic T, Vasljevic B, Nikodinovic-Runic J. Properties and applications of undecylprodigiosin and other bacterial prodigiosins. Appl Microbiol Biotechnol, 2014; 98: 3841-3858.
- Su WT, Tsou TY, Liu HL. Response surface optimization of microbial prodigiosin production from Serratia marcescens. J the Taiwan Institute of Chemical Engineers, 2011; 42(2): 217-222.
- Zang CZ, Yeh CW, Change WF, Lin CC, Kan SC, Shieh CJ. Identification and enhanced production of prodigiosin isoform pigment from Serratia marcescens N10612. Journal of the Taiwan Institute of Chemical Engineers, 2014; 45(4): 1133-1139.
- Taoy J, Wangy X, Shen Y, Wei D. Strategy for the improvement of prodigiosin production by a Serratia marcescens mutant through fed-batch fermentation. World J Microbiol Biotechnol, 2005; 21: 969.
- Chen WC, Yu WJ, Chang CC, Chang JS, Huang SH, CHANG CH. Enhancing production of prodigiosin from Serratia marcescens C3 by statistical experimental design and porous carrier addition strategy. Biochemical Engineering Journal, 2013; 78: 93-100.
- Kalivoda EJ, Stella NA, Aston MA, Fender JE, Thompson PP, Kowalski RP. Cyclic AMP negatively regulates prodigiosin production by Serratia marcescens. Res Microbiol, 2010; 161(2): 158-167.
- Sole M, Francia A, Rius N, Loren JG. The role of pH in the ‘glucose effect on prodigiosin production by non-proliferating cells of Serratia marcescens. Let Appl Microbiol, 1997; 25(2): 81-84.
- Rispoli FJ, Shah V. Mixture design as a first step for optimization of fermentation medium for cutinase production from Colletotrichum lindemuthianum. J Ind Microbiol Biotechnol, 2007; 34: 349-355.
- Takano E, Gramaio HC, Strauch E, Aandres N, White J, Bibb MJ. transcriptional regulation of the redd transcriptional activator gene accounts for growth –phase dependent production of the antibiotic undecylprodigiosin in Streptomyces coelicolor A3 (2). Mol Microbiol, 1992; 6(19): 2797-2804.
- Strauch E, Takano E, Bylis HA, Bibb MJ. The stringent response in Streptomyces coelicolor A3(2). Mol Microbiol, 1991; 5(2): 289-298.
- Ryu YG, Butler MJ, Chater KF, Lee KJ. Engineering of primary carbohydrate metabolism for increased production of actinorhodin in Streptomyces coelicolor. Appl Environ Microbiol, 2006; 72(11): 7132-7139.
© The Author(s) 2018. Open Access. This article is distributed under the terms of the Creative Commons Attribution 4.0 International License which permits unrestricted use, sharing, distribution, and reproduction in any medium, provided you give appropriate credit to the original author(s) and the source, provide a link to the Creative Commons license, and indicate if changes were made.