

ISSN: 0973-7510
E-ISSN: 2581-690X
A total 20 Pseudomonas species were isolated from BT cotton rhizosphere of 3 different regions of Nanded city. All these isolates were evaluated for plant growth promoting functional traits like plant hormones production, Phosphate solubilisation, Siderophore production and Silver nanoparticles production. The experimental results were analyzed using MINITAB (ver. 17) for paired t test (p < 0.05) indicate positive co-relationship between produced metabolites, microorganism and silver nano particles in plant growth promotion activity.
Cotton rhizospheric Pseudomonas species, antagonism, metabolic diversity
Cotton belongs to the family Malvaceae and produces a natural type of fibre that grows around the seeds of the cotton plant. World wide India and China are largest producers of the cotton and the economy of many farmers of these countries were depends on production of cotton. The cotton dependent textile industry of the India is one of the leading industries in the world and the Indian government earns a lot of foreign exchange through this. Economic Survey of India shows that 16% of total world production of cotton was supplied by India1.
In 1904 Hiltner first time coined a term rhizosphere which later modified by Hartmann et al. (2008) as the area around a plant root that is inhabited by microorganisms and have 3 zones as endorhizosphere, rhizoplane and ectorhizosphere. Roots released secretory and diffusive substances plays an important role in propagation of roots, soil adhering and different rhizospheric interactions respectively2. Some microorganisms are capable to colonize rhizosphere and shows different types of interactions as pathogenic and beneficial interaction. The beneficial interaction of bacteria involves plant growth promoting rhizobacteria (PGPR) which can colonize roots in competitive environment and shows beneficial effect on plant growth3.In pathogens attacks plants will recruits the protective microorganisms and enhance the activity of metabolites for suppression of plant pathogens in rhizosphere4. There are various ways like production of antibiotics, induction of systematic resistance, production of various enzymes and peptides through which some bacterial species can show bio control activity. The high microbial diversity, density, metabolic activity, way of introduction of inoculums, some abiotic factors and competition occurring in the rhizosphere environment represents biological buffering that generally limits the establishment of new microorganism into the rhizosphere for root colonization6,7,8. Pseudomonas is a highly diverse species among all the available bacterial species. It is not that it has much special molecular machinery adopt in given niche but it is that just simple mutation in regulatory pathways that affect the expression of surface polymer and it may be spatial or temporal9. The current work is just an attempt to look inside the metabolic diversity of isolates and its application over plant growth promotion.
Sampling, isolation and identification of bacteria
Roots were collected from cotton plants growing in the mono cultivated 3 fields of Maharashtra (77.319717- 19.169815) India. The soil adhering with roots were collected, packed and transported up to laboratory in UV sterilized plastic bag. The root adhered soil sample was used for physicochemical analysis and bacterial isolation purpose. (Table 1)
Table (1):
Physico chemical analysis of soil samples.
Sr.No. |
Parameter Sample |
pH |
Electric conductivity MS/cm |
Organic carbon % |
Phosphor us kg/h |
Potassi um kg/h |
Ferrous ppm |
Magnes e ppm |
Zinc ppm |
Copper ppm |
|---|---|---|---|---|---|---|---|---|---|---|
1 |
Agricultural college Nanded |
7.27 |
0.22 |
0.57 |
17.5 |
454.15 |
4.42 |
2.20 |
0.80 |
0.40 |
2 |
Cotton research center Nanded |
7.38 |
0.27 |
0.43 |
10.21 |
422.46 |
4.22 |
2.10 |
0.64 |
0.36 |
3 |
Dharmabad |
7.26 |
0.57 |
0.59 |
52.01 |
443.59 |
4.76 |
2.40 |
0.83 |
0.38 |
Serial dilutions of soil samples were carried in sterile saline and (10-3) dilution was streaked on the edge of PDA plates and incubated at 30°C for 24 hours. A 9 mm plug of Fusarium oxysporium and Aspergillus niger was taken from the 72 hours grown PDA plate and placed at the centre of previous plate. Plates were incubated at 30°C for 6 days. The bacterial culture that inhibits the fungal growth was isolated10.The morphologically similar colonies were selected and purified by repeated streaking 11,12.
The selected isolates were turn into metabolically active by maintaining its optical density 0.5 at 620 nm, and then screened for biochemical tests, production of hydrolytic enzymes and plant growth promotion activities. The characterizations of isolates were carried out.
Plant growth promoting metabolites
Detection of siderophore
The screening and confirmation of siderophore was carried out over universal CAS medium. The isolates shows holo orange colour zone surrounding them was used for production and siderophore concentration was determined13.
Detection of Silver nanoparticles
The screening of silver nanoparticles producers were carried out according to the method of Jo Young-ki et al., (2009) with slight modification. The isolates were inoculated in king’s B medium and incubated at 150 rpm, 37°C for 48 hours followed by centrifugation at 8000 rpm for 10 minutes. The 1 ml supernatant was added in 1 ml (1mM) Silver nitrate (AgNO3) solution and incubated at 30°C for 24 hours for change in color from yellow to brown. The lambda max was observed at 420 nm. The vacuum dried sample was analyzed for SEM analysis14.
Determination of IAA Production
Isolates were screened for Indole Acetic Acid production, grown on Tryptic soy broth (1% Extra supplemented Tryptophan) incubated at 30°C for 72 Hrs15.After incubation, medium (5 ml) was centrifuged at 7000 rpm for 5 min and supernatant was used for IAA detection16. The isolates which give cherry red color after addition of Salkowaski reagent were used for IAA production.
For IAA production 1% extra Tryptophan supplemented tryptic soya broth was used. The inoculums were prepared and inoculated flasks were incubated at 30°C for 72 Hrs. followed by its estimation as per the method suggested by Gordon and Weber (1950). The confirmation of Indole Acetic acid was carried out by HPLC method17. (Fig. 1)
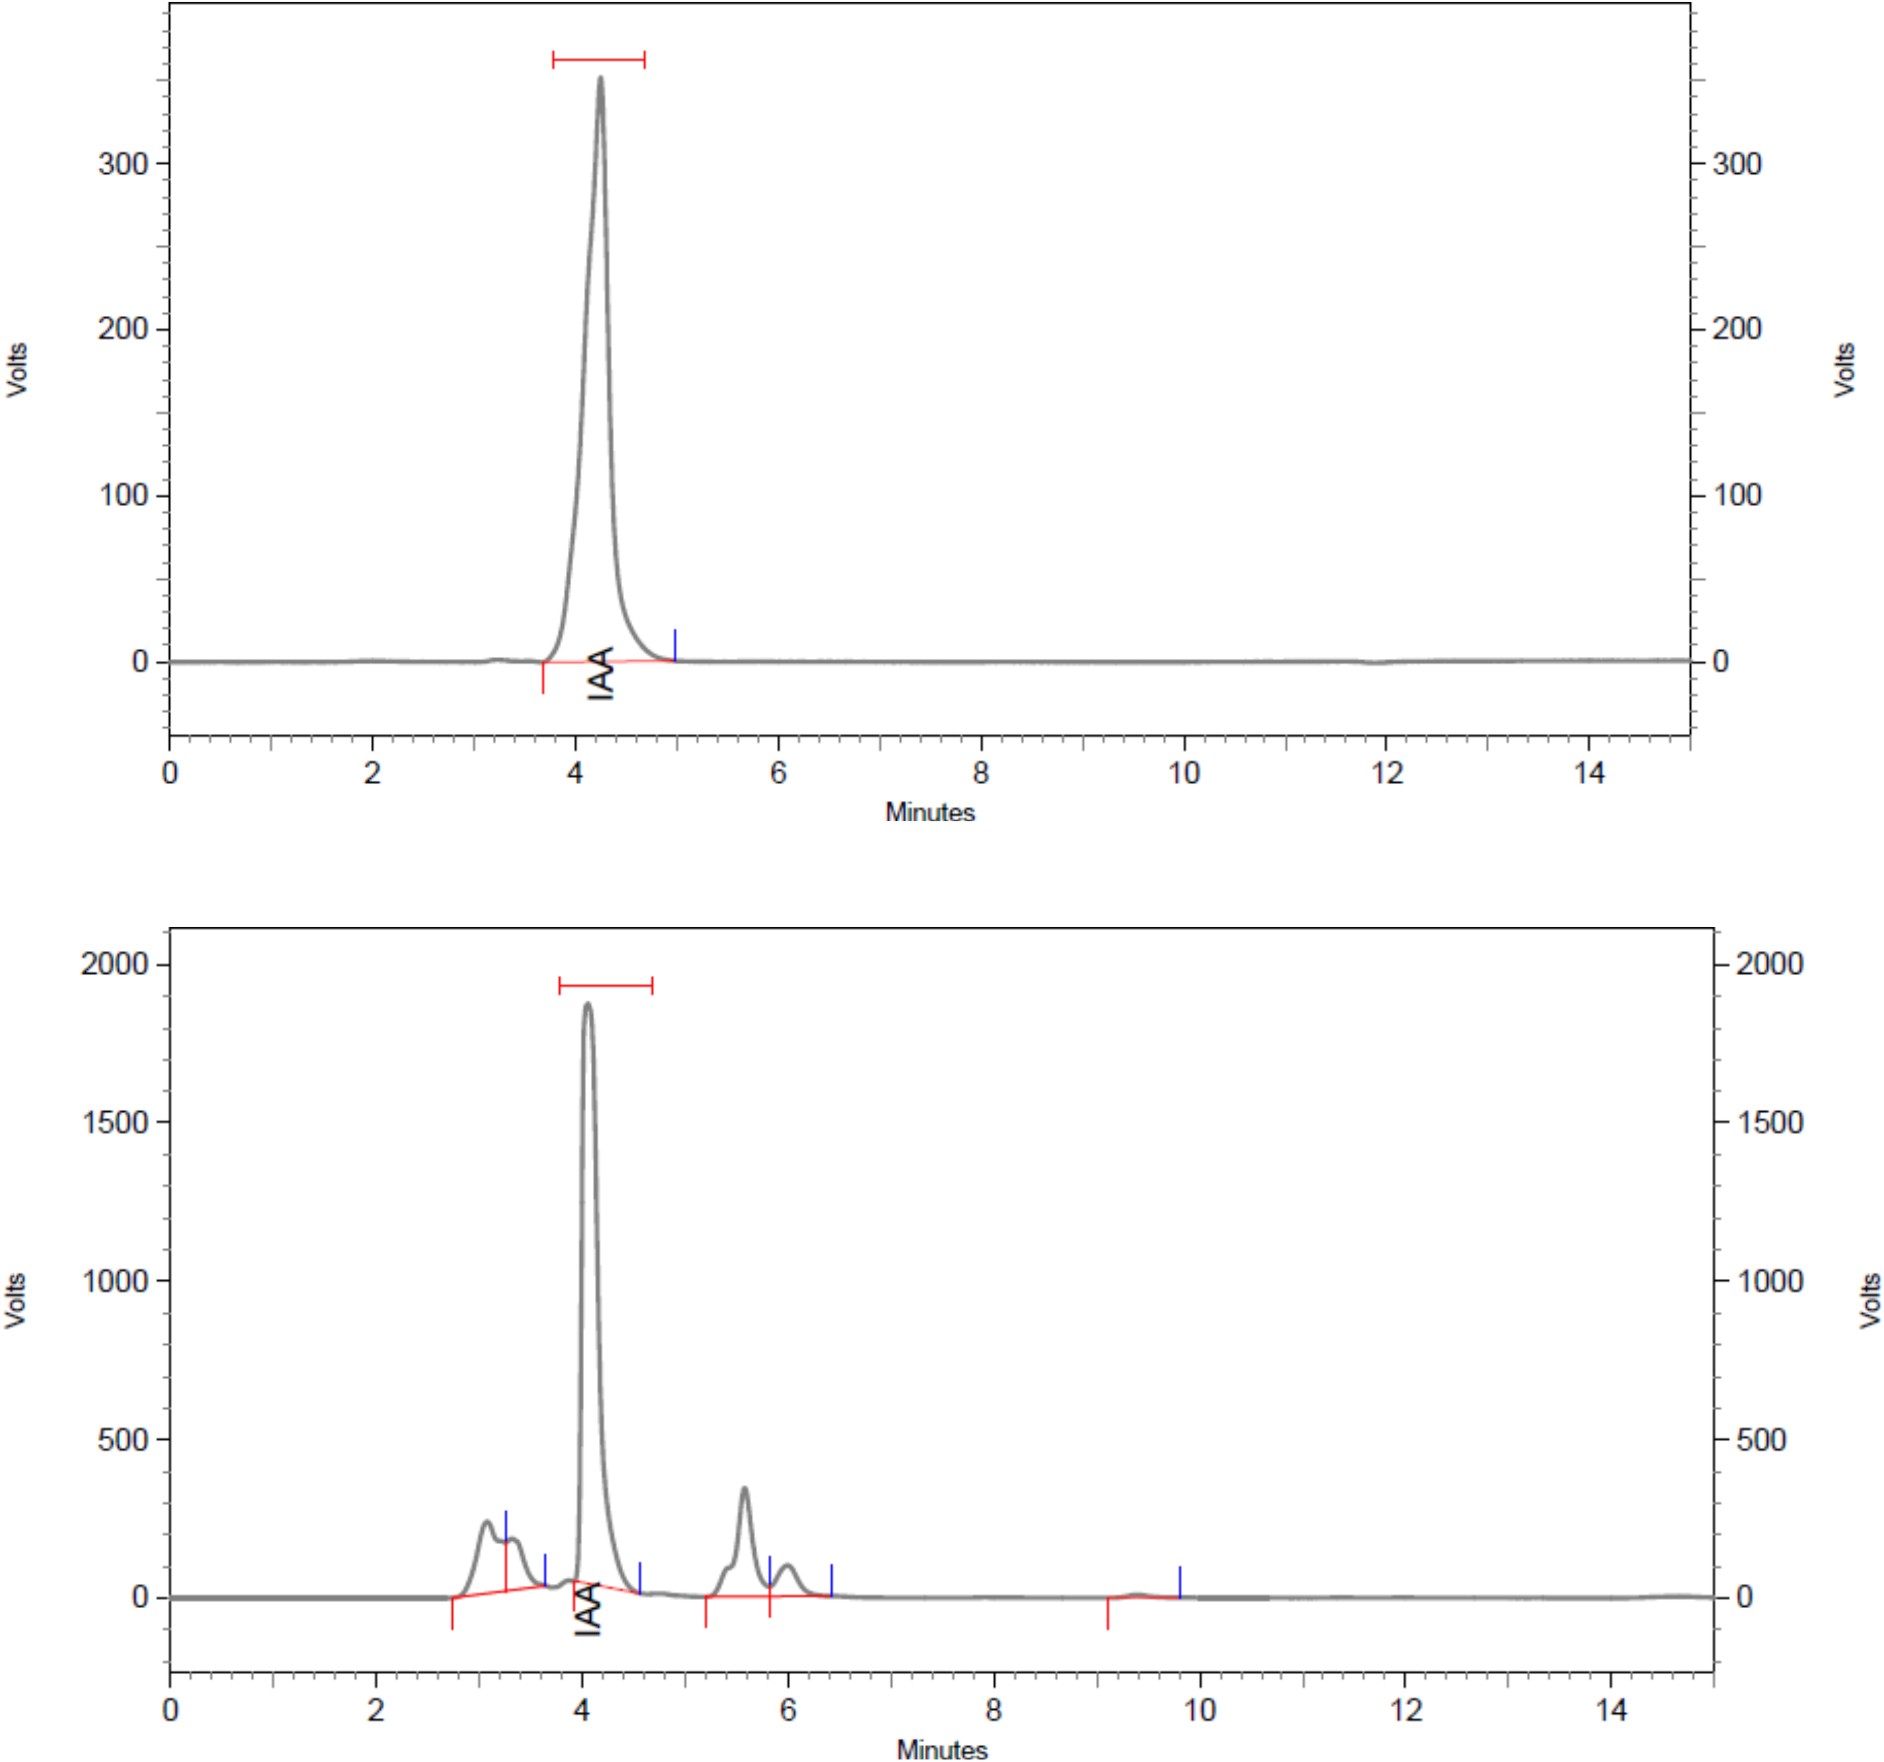
Fig. 1. HPLC analysis of Indole Acetic acid
Test for Phosphate Solubilization
Isolates were screened for their Phosphate solubilising activity. The isolates were grown on Pikovaskaya’s agar, incubated at 30°C for 120 hrs. The isolate which shows clear zone around them were further used for quantitative assay18.
For production Pikovaskaya’s medium was prepared with 5% Tri-calcium phosphate addition, incubate at 30°C, 120 rpm for 336 hrs. After incubation the medium was filtered through Whatmann’s filter paper no.1. and the supernatant was used for the assay purpose. Phosphate solubilization assay was carried out as per King method (1932).
Antifungal activity
The effect of isolate on fungi was carried out by dual culture method.
Percentage of Inhibition Radial Growth (PIRG) = [1- (length of fungal growth near to bacterial isolate/length of fungal growth other side at the same plate as control)] x 100% (20)
Microcosm assay
The potential isolate combinations for microcosm assay were prepared. In microcosm the surface sterilized Bt cotton seeds were used19 and assay was carried out by two methods.
Effect of metabolites on germination of cotton seeds
The metabolites produced by isolates were partially purified by centrifugation process. After the centrifugation the supernatant with estimated concentrations were used for pot assay purpose. Approximately 2 ml of metabolite was added in every pot with different combinations.
Effect of metabolite producer
The metabolites producing isolates were enriched in King’s B broth at 30°C for 24 hours for 0.5 OD at 600 nm. The tested fungi enriched in Potato Dextrose broth at 30°C for 48 hours for 108 spores/ml concentration. The 10 ml of fungal spore suspension and 10 ml of bacterial suspension was mixed in sterilized flask with various combinations and 3 seeds were allowed to soak within it for 10-12 hrs. After the incubation the seeds were air dried and sown in 250 gm of soil. The seeds were observed initially for germination and after 20 days analyzed for root, shoot length and dry mass of plant.
In control non-inoculated seeds were used.
Statistical Analysis
The correlation analysis of data was carried out by using MINITAB software (ver.17) Pennysylvania State University, USA.
PCR reaction for 16S rRNA sequencing
The isolation of genomic material of potential isolates was carried out and the amplification of 16S rRNA gene was performed by using the universal bacterial primers 27F and 1492R. The genes were sequenced on ABI Prism and BLAST was performed for construction of phylogeny using MEGA 6 software.
The major characteristics of rhizosphere like physical, biochemical and ecologic characteristics are dependent on the balance between different compounds released, with timing of release and production of any unique substances. The characteristics of soil and plant species exudates play a major role in selection of rhizospheric bacteria21. This study is focused on the role of rhizospheric pseudomonas and its metabolic diversity on cotton plant.
Isolation and identification of bacteria
A primary selection for the antagonism test plates helps for detection of bacteria. Pure bacterial cultures isolated for those isolates were screened for production of different metabolites as mentioned in material and methods. The 40 isolates were rescreened for morphological characterization and only 5 Gram –ve, rod shaped; motile bacteria were selected and studied for 16S rRNA sequencing. A morphological, biochemical and molecular characterization of isolates allow the identification as Pseudomonas group. (Table 2 & 3).
Table (2):
Morphological characteristics of primary isolates.
Sr. No. |
Isolate |
Colony Colour |
Cell shape |
Gram’s nature |
Motility |
|---|---|---|---|---|---|
1 |
AJ A 1 |
White |
Rod |
Gram -ve |
+ |
2 |
AJ A 2 |
Pink |
Rod |
Gram -ve |
+ |
3 |
AJ A 3 |
White |
Rod |
Gram -ve |
+ |
4 |
AJ A 4 |
White |
Rod |
Gram -ve |
+ |
5 |
AJ B 1 |
Light green |
Rod |
Gram -ve |
+ |
6 |
AJ B 2 |
Bright green |
Rod |
Gram -ve |
+ |
7 |
AJ B 3 |
White |
Rod |
Gram -ve |
+ |
8 |
AJ B 4 |
Light green |
Rod |
Gram -ve |
+ |
9 |
AJ C 1 |
Pink |
Rod |
Gram -ve |
+ |
10 |
AJ C 2 |
Light green |
Rod |
Gram -ve |
+ |
11 |
AJ C 3 |
Light green |
Rod |
Gram -ve |
+ |
12 |
AJ C 4 |
Pink |
Rod |
Gram -ve |
+ |
13 |
AJ D 1 |
White |
Rod |
Gram -ve |
+ |
14 |
AJ D 2 |
Pink |
Rod |
Gram -ve |
+ |
15 |
AJ D 3 |
Bright green |
Rod |
Gram -ve |
+ |
15 |
AJ D 4 |
white |
Rod |
Gram -ve |
+ |
17 |
AJ E 1 |
white |
Rod |
Gram -ve |
+ |
18 |
AJ E 2 |
Light green |
Rod |
Gram -ve |
+ |
19 |
AJ E 3 |
Pink |
Rod |
Gram -ve |
+ |
20 |
AJ E 4 |
white |
Rod |
Gram -ve |
+ |
Table (3):
Biochemical characterization of primary isolates.
| Sr No. |
Isolate | Biochemical Characterization | |||||||||||||
|---|---|---|---|---|---|---|---|---|---|---|---|---|---|---|---|
| 1 | 2 | 3 | 4 | 5 | 6 | 7 | 8 | 9 | 10 | 11 | 12 | 13 | 14 | ||
|
1 |
AJ A 1 |
+ |
+ |
_ |
_ |
+ |
+ |
+ |
+ |
_ |
_ |
+ |
_ |
_ |
+ |
| 2 | AJ A 2 | + | + | _ | _ | + | + | + | + | _ | _ | + | _ | _ | + |
| 3 | AJ A 3 | + | + | _ | _ | + | + | + | + | _ | _ | + | _ | _ | + |
| 4 | AJ A 4 | + | + | _ | _ | + | + | + | + | _ | _ | _ | _ | _ | + |
| 5 | AJ B 1 | + | + | _ | _ | + | + | + | + | _ | _ | + | _ | _ | + |
| 6 | AJ B 2 | + | + | _ | _ | + | + | + | + | _ | _ | + | _ | _ | + |
| 7 | AJ B 3 | + | + | _ | _ | + | + | + | + | _ | _ | + | _ | _ | + |
| 8 | AJ B 4 | + | + | _ | _ | + | + | + | + | _ | _ | + | _ | _ | + |
| 9 | AJ C 1 | + | + | _ | _ | + | + | + | + | _ | _ | + | _ | _ | + |
| 10 | AJ C 2 | + | + | _ | _ | + | + | + | + | _ | _ | + | _ | _ | + |
| 11 | AJ C 3 | + | + | _ | _ | + | + | + | + | _ | _ | + | _ | _ | + |
| 12 | AJ C 4 | + | + | _ | _ | + | + | + | + | _ | _ | + | _ | _ | + |
| 13 | AJ D 1 | + | + | _ | _ | + | + | + | + | _ | _ | + | _ | _ | + |
| 14 | AJ D 2 | + | + | _ | _ | + | + | + | + | _ | _ | + | _ | _ | + |
| 15 | AJ D 3 | + | + | _ | _ | + | + | + | + | _ | _ | + | _ | _ | + |
| 15 | AJ D 4 | + | + | _ | _ | + | + | + | + | _ | _ | + | _ | _ | + |
| 17 | AJ E 1 | + | + | _ | _ | + | + | + | + | _ | _ | + | _ | _ | + |
| 18 | AJ E 2 | + | + | _ | _ | + | + | + | + | _ | _ | + | _ | _ | + |
| 19 | AJ E 3 | + | + | _ | _ | + | + | + | + | _ | _ | + | _ | _ | + |
| 20 | AJ E 4 | + | + | _ | _ | + | + | + | + | _ | _ | + | _ | _ | + |
| 1 : catalase test 2 : Oxidase 3 : Acid & gas production 4 : Starch hydrolysis 5 : Gelatin liquefaction 6 : Arginine hydrolysis 7 : Levan production 8 : casein hydrolysis 9 : Lipid hydrolysis 10 : Urease test. 11 : Indole production 12 : Methyl Red test 13 : Vogus Proskour test 14 : citrate utilization test | |||||||||||||||
A nanoparticles synthesis ability of isolates was evaluated for enhancing antimicrobial activity. Only two isolates AJ B 2 and AJ D 3 were able to produce silver nanoparticles and production is characterized by UV Visible spectrophotometer and SEM (Fig. 2). Pseudomonas species was also able to synthesise silver nanoparticles22,23.
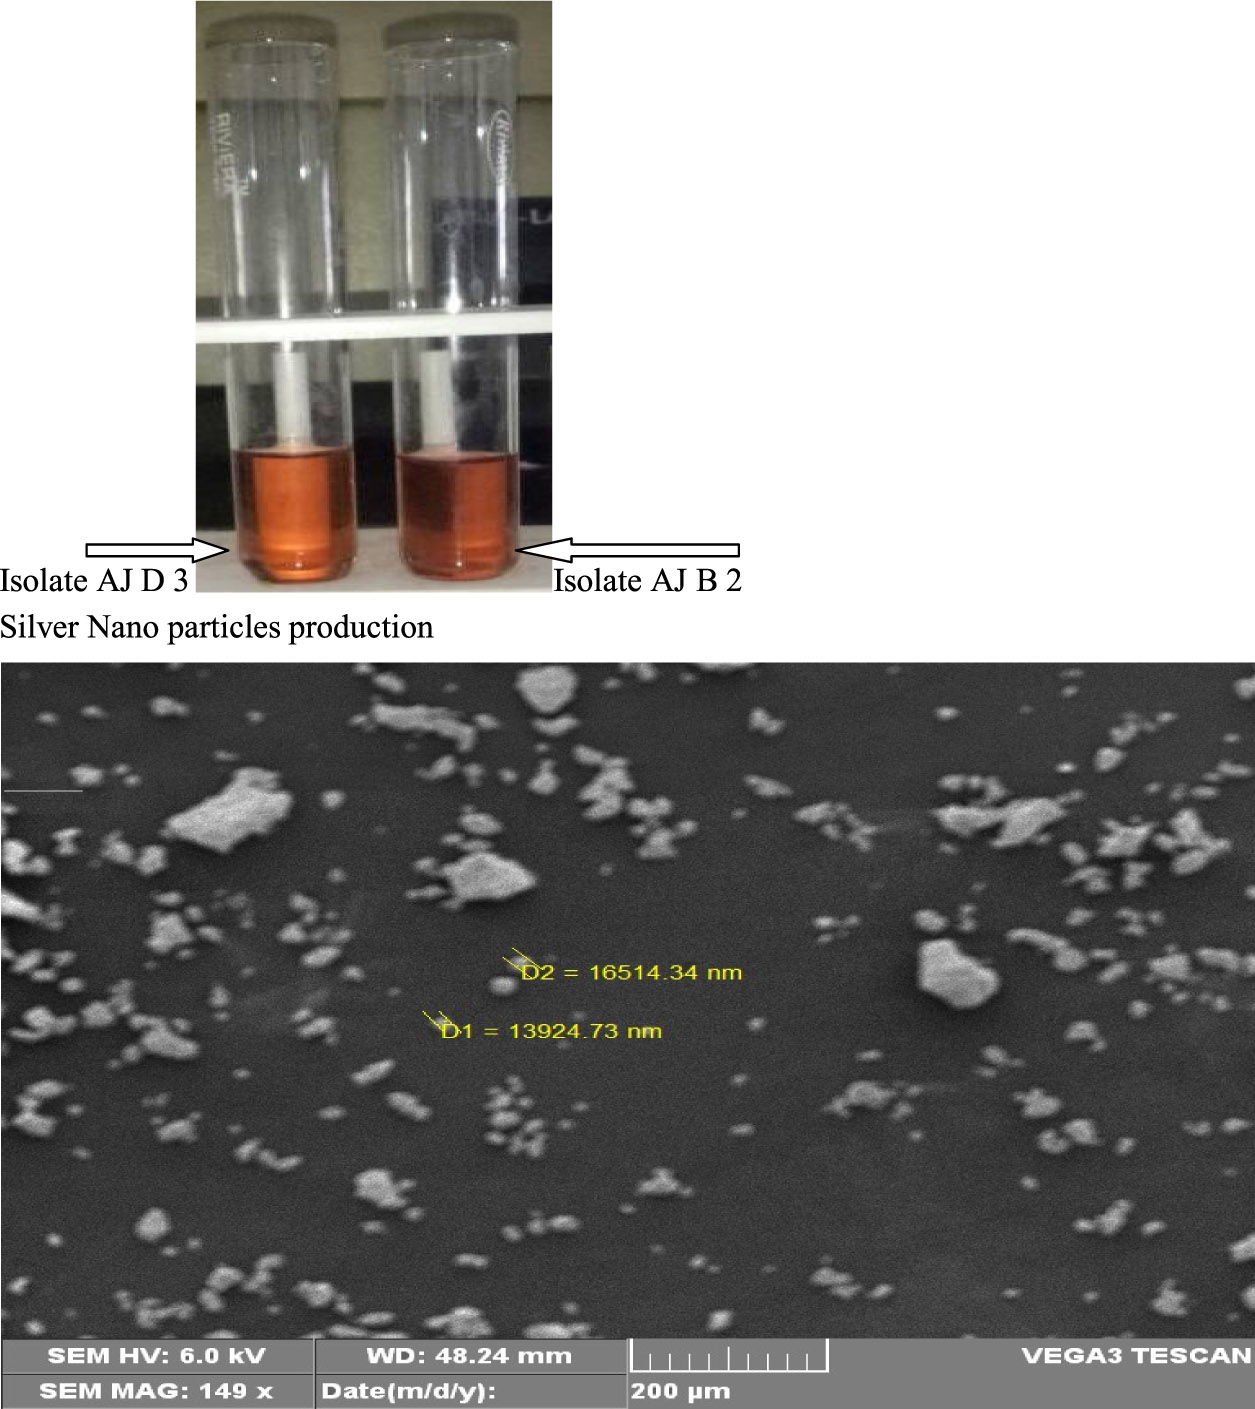
Fig. 2. Electron micrograph of silver nanoparticles
Plant growth promoting activity
95% of isolates were capable to produce IAA within a range of 13 – 70 µg/ml. The isolates AJ D 2 and AJ D 3 were highest (70 µg/ml) producers. Produced IAA was initially identified by TLC and confirmed by HPLC. 90% isolates were capable to solubilised phosphorus, among them an isolate AJ A 2 shows highest (13.35 mg/lit) solubilisation activity. Phosphate solubilisation efficiency of isolated pseudomonas was found to be higher as compared to Bacillus species23.
Antifungal activity
Haas and Defago (2005) reported that by various mechanisms pseudomonas control soil borne pathogens. The cotton rhizospheric microorganisms dominantly Pseudomonas species suppress the attack of root rot causing pathogen Fusarium oxysporum in monocropped soil24 (Table 4). The effect of metabolite producers were separately evaluated and analyzed by paired t test (p<0.05). A significant positive co relationship was found. An isolates AJ D 3 and AJ B 2 shows highest antifungal activity against Fusarium oxysporium and Aspergillus niger respectively (Table 5).
Table (4):
Main characteristics of selected isolates.
| Metabolite/ Isolate code |
AJ B 2 | AJ D 1 | AJ D 2 | AJ D 3 | AJ E 3 | AJ A 2 | |
|---|---|---|---|---|---|---|---|
| Indole Acetic Acid (µg/ml) |
44 | 62 | 70 | 70 | 25 | 38 | |
| Phosphate Solubilisation (mg/lit) |
ND | ND | ND | ND | ND | 13.25 | |
| Siderophore production (in %) |
ND | 69.33 | ND | ND | 68.83 | ND | |
| Silver nanoparticles | Y | ND | ND | Y | ND | ND | |
| ND = Not detect | NS = Not significant | Y = Able to produce | |||||
Table (5):
Effect of metabolite, isolates and fungi on germination of cotton seeds.
Sr. No. |
Combination |
Root length in cm |
Shoot length in cm |
Root dry mass in gm |
Shoot dry mass in gm |
Number of leaves |
Number of seed germinates |
|---|---|---|---|---|---|---|---|
1 |
Control |
1.86 ±0.90 |
8.06 ±1.76 |
0.44±0.14 |
0.75±0.16 |
1.33±0.57 |
1.00±0.00 |
2 |
Effect of Metabolites |
2.48 ±1.59 |
3.32 ±2.14 |
0.15±0.09 |
0.31±0.19 |
0.40±0.24 |
0.40±0.24 |
3 |
Effect of metabolites with AgNP’s |
2.60 ±1.11 |
3.33 ±1.42 |
0.11±0.05 |
0.27±0.11 |
0.50±0.23 |
0.33±0.14 |
8 |
Effect of isolates |
9.74 ±0.41 |
10.74±1.45 |
0.79±0.04 |
0.70±0.03 |
1.20±0.49 |
1.00±0.00 |
9 |
Effect of isolates and A. niger |
4.24 ±2.60 |
4.52 ±2.77 |
0.33±0.20 |
0.28±0.17 |
0.40±0.24 |
0.50±0.07 |
10 |
Effect of isolates, AgNP’s producer and A. niger |
6.99 ±1.10 |
7.41 ±1.17 |
0.51±0.08 |
0.53±0.08 |
1.12±0.22 |
0.87±0.12 |
11 |
Effect of isolates and F. oxysporium |
5.45 ±1.25 |
5.79 ±1.37 |
0.39±0.08 |
0.42±0.09 |
1.25±0.31 |
0.75±0.16 |
12 |
Effect of isolates AgNP’s producer and F. oxysporium |
7.10 ±0.80 |
7.60±0.86 |
0.49±0.05 |
0.53±0.05 |
1.50±0.28 |
1.00±0.00 |
± = Mean + SE mean
Microcosm assay
When cotton seeds were challenged with pathogenic fungi, the isolate AJ D 3 was found to be most prominent organism. The plant growth promoting metabolites like IAA and phosphate solubilisers were found to be stable with silver nanoparticles and it exhibits good plant growth promoting activity in presences of fungi also. As compared to IAA, solubilised phosphate shows more plant growth promotion activity. (Fig. 3 & 4)
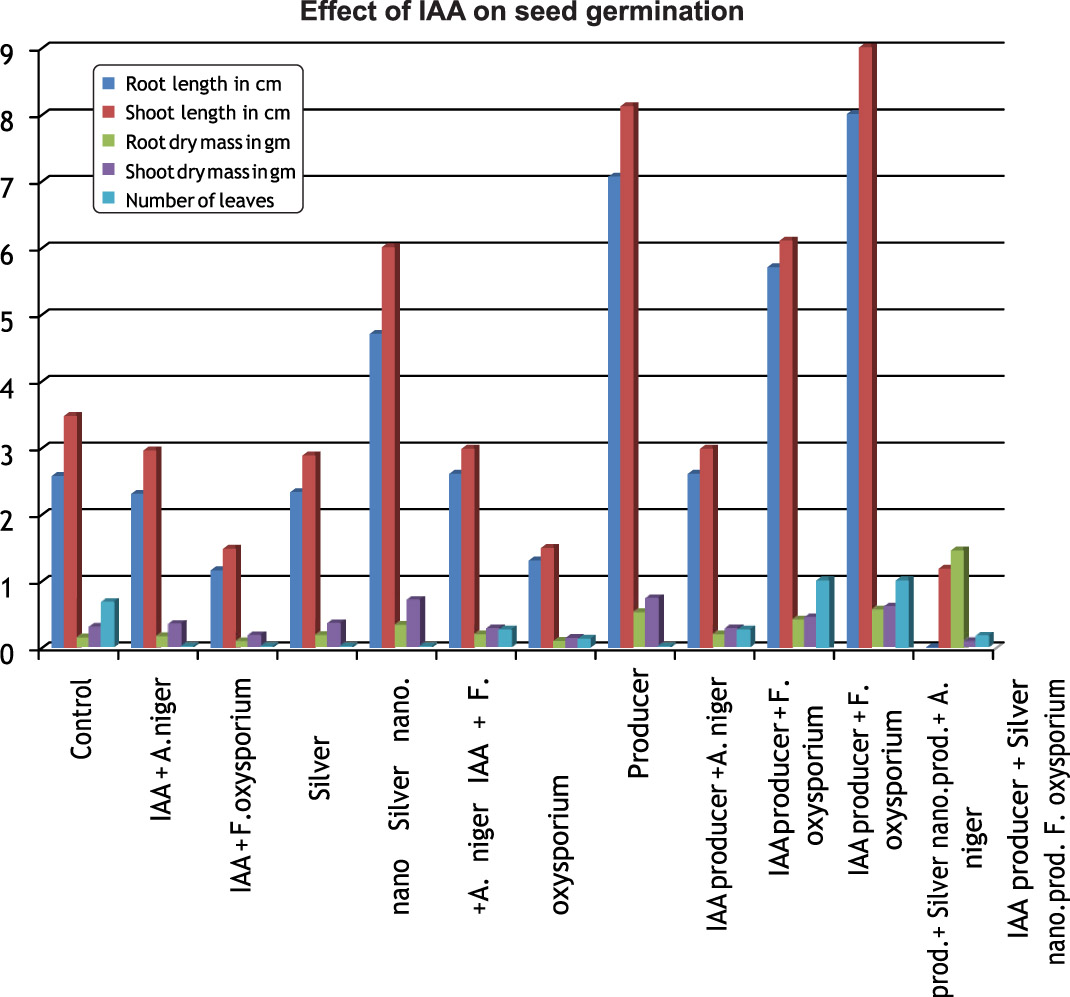
Fig. 3. Effect of Indole Acetic Acid on seed germination
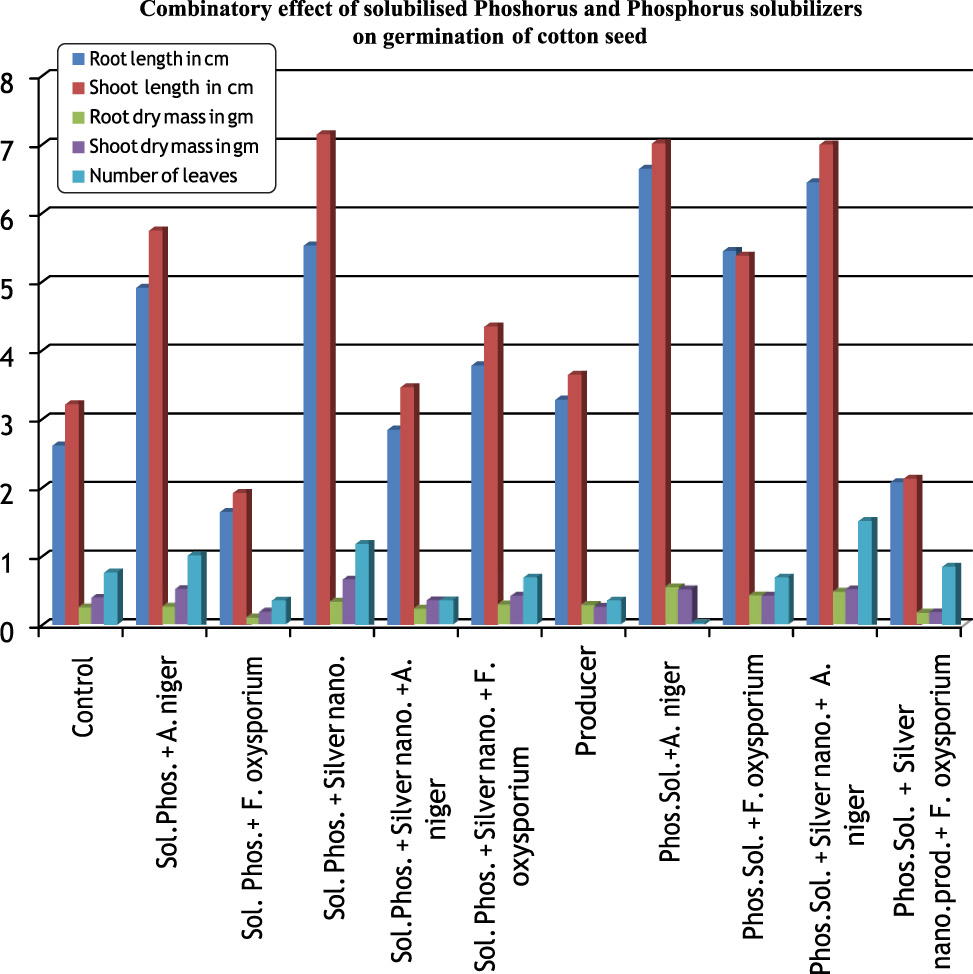
Fig. 4. Effect of phosphate solubilization on seed germination
The every combinatory activity was evaluated in triplicates and correlated for correlation coefficient(r) analysis. The r value comes positive and near to 1, fortify the data. The goal of this study is just to find out the direct plant growth promoting diversity of culturable Pseudomonas species and find out role of silver nano particle as a tool in plant growth promotion.
- Saharan, B.S., & Nehra, V. Plant Growth Promoting Rhizobacteria : A Critical Review, 2011, 1–30.
- McNear Jr., D. H. The Rhizosphere – Roots, Soil and Everything In Between. Nature Education Knowledge, 2013, 4(3):1
- Bouizgarne Brahim. Bacteria for Plant Growth Promotion and Disease Management. 2013; pp no. 15-47. In: Maheshwari D. (eds) Bacteria in Agrobiology: Disease Management. Springer, Berlin, Heidelberg
- Berendsen, R. L. The rhizosphere microbiome and plant health, Trends Plant Sci. 2012, 17(8):478-86 doi:10.1016/j.tplants.2012.04.001
- Haas Dieter and Defago Genevieve, Biological control of soil borne pathogens by fluorescent pseudomonad, Nat. Rev. Micro., 2005, 10:01-13.
- Waller David M. Pseudomonas biocontrol agents of soil borne pathogens: looking back over 30 years, Phyopathology, 2007, 97:250-256.
- Janczarek, M. Environmental Signals and Regulatory Pathways That Influence Exopolysaccharide Production in Rhizobia. International Journal of Molecular Sciences, 2011, 12(11), 7898–7933.
- Spiers, A. J., Buckling, A., & Rainey, P. B. MINI REVIEW: The causes of Pseudomonas diversity, Microbiology. 2000, 146:2345-50
- Montelegrae J.R., Reyes R., Perez L.M., Herrera R., Silva P. and Besoain X., Selection of bio antagonistic bacteria used in biological control of Rhizoctonia solani in tomato, Ele. J. Biotech., 2003, 6(2):115-127.
- Sharma Sapana and Mohinder Kour, Antimicrobials activities of rhizobacterial strains of Pseudomonas and Bacillus strains isolated from rhizosphere soil of carnation” Indian J. Micro., 2010,50: 229 – 232.
- Hu Hai-Yan, Liu Xiao-Xia, Zhao Zhang-Wu, Sun Jian-Guang, Zhang Qing-Wen, Liu Xing-Zhong, Yu Yong, Effects of repeated cultivation of transgenic Bt cotton on functional bacterial populations in rhizosphere soil, Wor. J. Micro. and Biotech., 2009, 25, 357-366.
- Tailor A. J. and Joshi A. H., Characterization of optimization of siderophore production from Pseudomonas fluorescence strain isolated from sugarcane rhizosphere, J Environ Res Dev,2012, 6 (3):688-694.
- Patel Nikunj, Desai Purvi, Patel Niti, Jha Anamika and Gautam Hemant K, Agronanotechnology for Plant Fungal Disease Management: A Review, Int. J. Curr. Micro. and App. Sci., 2014, 3(10), 71-84.
- Malik, D. K., & Sindhu, S. S. Production of indole acetic acid by Pseudomonas sp.: effect of coinoculation with Mesorhizobium sp. Cicer on nodulation and plant growth of chickpea (Cicer arietinum), 2011, 17: 25–32.
- Umesh Prasad shrivastava and Ashok Kumar, A simple and rapid plate assay for the screening of indole-3-acetic acid (IAA) producing microorganisms, International Journal of Applied Biology and Pharmaceutical Technology, 2011, 2(1),120-123.
- Lebuhn, M., Heilmann, B. & Hartmann, A. Biol Fert Soils, 1994, 18: 302.
- Maheswar, N. U., & Sathiyavani, G. Solubilization of phosphate by Bacillus Sps, from groundnut rhizosphere (Arachishypogaea L), Journal of Chemical and Pharmaceutical Research 2012, 4(8): 4007–4011.
- Rathore Keerti S., Sunilkumar Ganesan, and Campbell LeAnne M. Chapter 22 – Cotton, p. 267 – 280. In Kan Wang (Ed.) Methods in Molecular Biology. 2006. 343, Agrobacterium Protocols Second Edition, volume 1. Humana Press Totowa, New Jersey.
- Dikin, A., Sijam, K., Kadir, J., & Seman, I. A. B. U., Antagonistic bacteria against schizophyllum commune Fr. In peninsular Malaysia, 2006, 13(2):111–121.
- Randy Ortíz-Castro, Hexon Angel Contreras-Cornejo, Lourdes Macías-Rodríguez and José López-Bucio, The role of microbial signals in plant growth and development”, Plant Sig. & Beha., 2009,4(8):701-712.
- Abdallah Mohamed Elgorban, Abd Wl- Eahim Mohamed El-mSamawaty, Mohamed Abdallah Yassin, Shaban Rushdy Sayed, Syed Farooq Adil,Khaled Mohamed Elhindi, Marwa Bakri and Mujeeb Khan, Antifungal silver nanoparticles:synthesis, characterization and biological evaluation, Biotech. & Biotech. Eva., 2016, 30(1):56-62.https//doi.org/10.1080/13102818.2015.1106339
- Quinteros, M. A., Martínez, I. M. A., Dalmasso, P. R., & Páez, P. L. Silver nanoparticles : biosynthesis using an ATCC reference strain of pseudomonas aeruginosa and activity as broad spectrum clinical antibacterial agents, Int. J. Biomat, 2016,.http//dx.doi.org/10.1155/2016/5971047
- Bilolikar M N, Raut R S, Malewar G U,Rachewad S N and Lawand B T,”Occurence of phosphate solubilizing bacteria in soil of Marathwada region”, PKV Res. J., 1996, 20(1):18-20
- Faure, D., & Vereecke, D., Molecular communication in the rhizosphere, Plant and Soil 2009, 321(1–2):279–303. Doi: 10.1007/s11104-008-9839-2.
© The Author(s) 2018. Open Access. This article is distributed under the terms of the Creative Commons Attribution 4.0 International License which permits unrestricted use, sharing, distribution, and reproduction in any medium, provided you give appropriate credit to the original author(s) and the source, provide a link to the Creative Commons license, and indicate if changes were made.