

ISSN: 0973-7510
E-ISSN: 2581-690X
This research was done to overcome the bacterial resistance towards antibiotics by produced new antibiotics. Some microorganisms can be used as a source of antibiotics, including microalgae. This study was conducted by using microalgae Scenedesmus dimorphus to produced a new antibiotic. The study began by looking for a suitable growth medium to obtain maximum biomass to produces antibiotics. The results showed that the suitable growth medium was Bolt Basalt Medium (BBM) with dry biomass of 0.602 g/L, whereas from grow more G32% medium was obtained 0.302 g/L and commercial fertilizer P5 was obtained 0.479 g/L. The antibacterial activity of Scenedesmus dimorphus extract was tested using the disc diffusion method (Kirby & Bauer test). The extraction process using methanol, ethyl acetate and hexane solvents was carried out by the maceration method with the help of the sonication process. Antibacterial activity testing showed the inhibition zone on methanol extract using Bacillus subtilis ATCC 6633, Salmonella thypimurium ATCC 14028, Eschericia coli ATCC 25922, Methicilin Resistent-Staphylococus aureus ATCC 25175 respectively 13 mm, 10 mm, 10 mm, 20 mm while on ethyl acetate extracts the inhibition zone size were 9 mm, 8 mm, 11 mm, 12 mm and n-hexane extracts were 8 mm, 7 mm, 8 mm and 8 mm.
Isolation, Selection, Medium, Antibacterial.
Infectious disease is one of the serious diseases because it can lead to the death of an individual. Prevention of infectious diseases is usually done by using antibiotics, but irregular uses of antibiotics can make the bacteria became resistant. Antibiotic resistance problems generally occur in groups of Gram-positive bacteria such as Methicilin Resistance Staphylococcus aureus (MRSA), Bacillus subtilis, and Gram-negative group bacteria such as Escherichia coli and Salmonella thyposa which are some serious threat to public health1,2,3.
Bacteria multi-resistance towards antibiotics caused a serious problem in the treatment of infectious diseases, making it difficult to find antibiotics that able to inhibits the growth of these bacteria. Therefore, the search for more active compounds with antibacterial properties needs to be explored. One of the sources of antibiotics that can be utilized is microalgae.
Microalgae is able to live in all territorial waters such as; fresh water, salt water and brackish water. Microalgae contain several primary metabolites that can be utilized such as carbohydrates as ingredients for bioethanol, lipids for biodiesel, proteins for making single-cell proteins as supplements4,5,6,7. In addition, microalgae also produce secondary metabolites such as b-carotene, minerals and vitamins such as thiamine (B1), riboflavin (B2), pyridoxine (B6), cyanocobalamin (B12), biotin, ascorbic acid, nicotinic acid carotene, pantothenic acid, choline, inositol and tocopherol8.
One of the problems encountered in the study of microalgae was the lack of biomass obtained from the culture, therefore this research was carried out by optimizing microalgae growth medium to obtain maximum biomass and the search for active compounds that could inhibit the bacterial activity.
Equipments
The equipment used in this study were cultivation equipment (aquarium pump, aquarium hose, 500 mL glass bottle, rubber, plastic), 500 mL Erlenmeyer (Pyrex®), 100 mL measuring cup (Pyrex®), measuring flask (Pyrex®), stirring rods, test tubes (Pyrex®), dropper pipettes, vials, Petri dishes (Normax®), 1000 mL volumetric flasks (Pyrex®), trophy cups (Pyrex®), incubator, autoclave, forceps, aluminum foil, plastic wrap, ose needle, hot plate, spatula, micropipette, microtips, UV-Vis spectrophotometer (Thermo Scientific GENESYS 10S Series UV-Visible Spectrophotometers USA), analytic scale (Kern ABJ 320-4NM) and low temperature refrigerator, Laminar Air Flow (LAF).
Materials
The materials used in this study were samples of microalgae Scenedesmus dimorphus isolated from Lake Biru Sawahlunto West Sumatra, the test bacteria used were from Biota Sumatra Laboratory which were Bacillus subtilis bacteria ATCC 6633, Salmonella thypimurium ATCC 14028, Escherichia coli ATCC 25922, Methicilin Resistance Staphylococcus Aureus (MRSA) ATCC 25175, Nutrient Agar medium, Mueller-Hilton Agar medium (MHA), Bolt Basalt Medium, growmore medium, commercial fertilizer medium (Urea, ZA, TSP), methanol (Brataco®), ethyl acetate, n-hexane, positive control amoxicillin and negative control DMSO.
Research procedure
Isolation of Microalgae
Isolation of microalgae was carried out referred to Parvin (2007) using the micropipette washing technique method. Single microalgae obtained was observed under the microscope with 1000x magnification. Microalgae species were identified according to the Algae Resource Database.
BBM Medium
A total of 17 mL of microlalgae were inoculated into BBM medium as much as 153 mL and given aeration at room temperature. Microalgae growth was determined by measuring the optical density of the culture every day using a UV-Vis spectrophotometer at a wavelength of 410 nm10.
Grow more Medium
Growmore medium was made with 4 concentration which was growmore 6-30-30, growmore 10-55-10, growmore 20-20-20, growmore 32-10-10. In each concentration, as much as 17 mL microalgae were added. The ratio of medium: microalgae was 1 : 9 mL. The daily growth curve with a UV-Vis spectrophotometer was calculated daily at a wavelength of 410 nm.
Commercial Fertilizer Medium
Selection of fertilizer dosage referred to Afriza (2014) which had been modified by varying the concentration of Urea, ZA and TSP fertilizers (Table 1). Growth was observed by measuring the value of Optical Density (OD) using a UV-Vis spectrophotometer at a wavelength of 410 nm.
Table (1):
Variations in commercial fertilizers used in research
Treatment |
Urea [CO(NH2)2] (mg/L) |
ZA [(NH4)2SO4] (mg/L) |
TSP [45% P2O5] (mg/L) |
|---|---|---|---|
P1 |
0 |
50 |
40 |
P2 |
10 |
40 |
40 |
P3 |
20 |
30 |
40 |
P4 |
30 |
20 |
40 |
P5 |
40 |
10 |
40 |
Biomass Harvesting of Microalgae Scenedesmus dimorphus
Harvesting of microalgae liquid cultures was carried out at the stationary phase by using the flocculation method. The precipitate was transferred into petridish and dried using the wind drying method. The dry biomass obtained was put into a vial bottle12.
Extraction of Microalgae Scenedesmus dimorphus
The extraction method used was based on the modified Goh, Su-Hua (2010) method. The solvents used in the extraction process were methanol, ethyl acetate and hexane. As much as 1 gram of dry biomass was extracted each using methanol, ethyl acetate and hexane solvents. The extraction process was carried out by the sonication method using a sonicator at 480 Hz for 1 hour and continued to maceration for 24 hours. The extraction process was done repeatedly until the solution was colorless. Extracts were collected and separated between the solution and the sediment with centrifuges then dried to obtained the crude extract of the microalgae.
Phytochemical Profile Test
Phytochemical tests were carried out on each extract (methanol, ethyl acetate, hexane) of microalgae Scenedesmus dimorphus. Phytochemical tests included the tests of flavonoids, phenolics, alkaloids, triterpenoids and steroids14.
Production of Nutrient Agar Medium
Nutrient Agar (NA) Medium as much as 14 grams was dissolved in 500 mL of aquades and then heated while stirring the solution until it boiled. NA medium as much as 10 ml was poured into a test tube covered with gauze and cotton, then sterilized at a pressure of 1 atm and temperature of 121°C for 15 minutes. Sterile NA media was tilted and waited until it solidifies.
Bacterial Inoculation
The test bacteria were inoculated into the tilted medium using an ose needle and inoculated by scratching the ose needle on the tilted NA medium. Then the medium was incubated for 24 hours at 37°C until bacterial growth occurs15.
Production of Mueller-Hinton Medium
Mueller-Hinton Agar Medium (MHA) as much as 19 grams was dissolved in 500 ml aquades then heated while stirring the solution until it boiled. The MHA medium was sterilized using autoclave at a pressure of 1 atm and temperature of 121°C for 15 minutes. The MHA medium was cooled and then put in a petri dishes of 20 ml each and allowed to solidify at room temperature.
Antibacterial Activity Test
MHA medium was suspended by test bacteria as much as 200לL and flattened with L stem, then allowed to dry for 15 minutes at room temperature. Sterile disc paper was dropped on each extract with a volume of 20µl and concentration of 10µg / mL, 100µg / mL and 500µg / mL, then incubated at room temperature for 24 hours.
The positive control used was 10µg amoxycillin and negative control used was 0.1% DMSO. The clear zone around the disc showed the presence of a bacterial barrier area. The diameter of the inhibitory zone was measured horizontally and vertically using the calipers16.
Identification of Microalgae Isolates Based on Morphology
A single isolate of microalgae was obtained using a micropipette washing technique. MA1 microalgae isolates were identified morphologically and compared for their morphological similarities to microalgae found in Algae Base Resource. The following photo showed the morphology of MA1 microalgae isolates obtained from Lake Biru Sawahlunto, West Sumatra and microalgae found on algaebase.org, shown in the following Fig. 1.
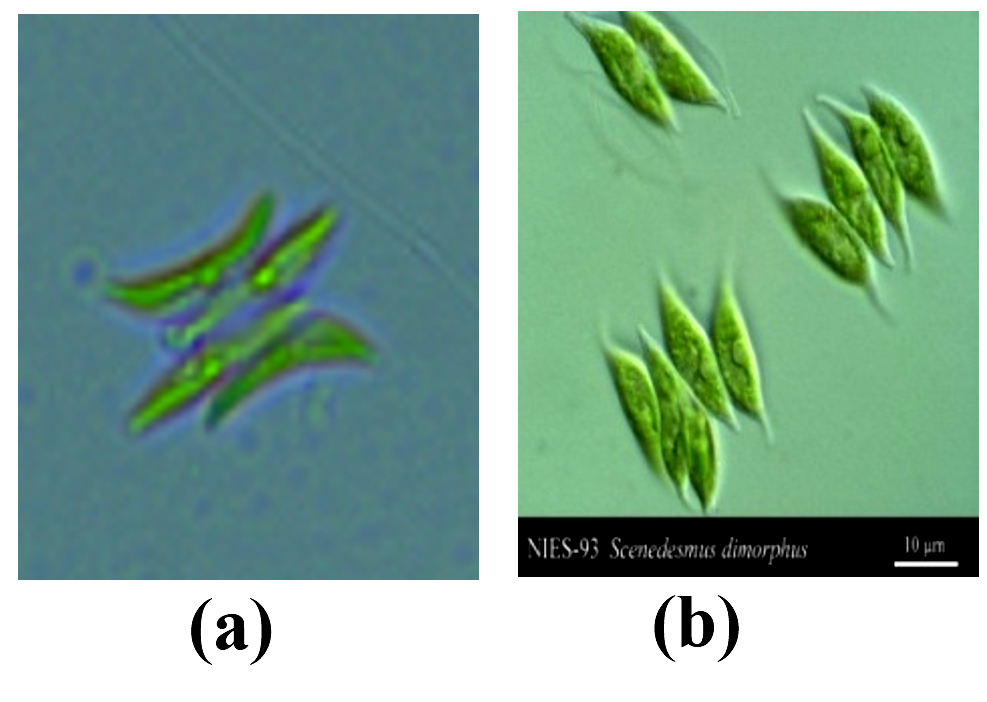 Fig. 1.Microalgae morphology (a) MA1 Isolate, (b) Scenedesmus dimorphus photo from algabase.org
Fig. 1 provided species morphology information about the phenotypic character of a species, including the shape, color, size and weight of the cells. MA1 microalgae species had long and pointed form and live in groups. Based on these characters, MA1 microalgae isolates has long, pointed cells and have a green color like the general character of other eukaryotic microalgae. This characteristic showed that MA1 microalgae isolates from Lake Biru Sawahlunto West Sumatra have similarities morphologically with the microalgae Scenedesmus dimorphus found on the website algabase.org. This MA1 microalgae was classified into the division of green microalgae (Chlorophyta). Characteristics of Chlorophyta in general are contains chlorophyll, has green coloration, cell nucleus is eukaryotic, autotrophic, and has fresh water as its largest habitat.
Selection of Growth Medium
Commercial Fertilizer Medium
Selection of microalgae medium was seen from the growth rate of microalgae by measuring absorptive value (Optical Density) using a UV-VIS spectrophotometer at a wavelength of 410 nm. The higher the absorptive value, the more the number of cells in the growth medium, and vice versa the lower absorptive value indicates the small number of cells in the growth medium17.
Fig. 2 showed the highest cell abundance of growth of MA1 microalgae using commercial fertilizers in treatment P5 and the lowest cell abundance at P1. This is because P5 has a large source of nitrogen compared to P1, P2, P3 and P4. In addition, the smallest ZA levels were also present in P5 treatment where small ZA levels could balancing the nutrient conditions and pH in microalgae culture media.
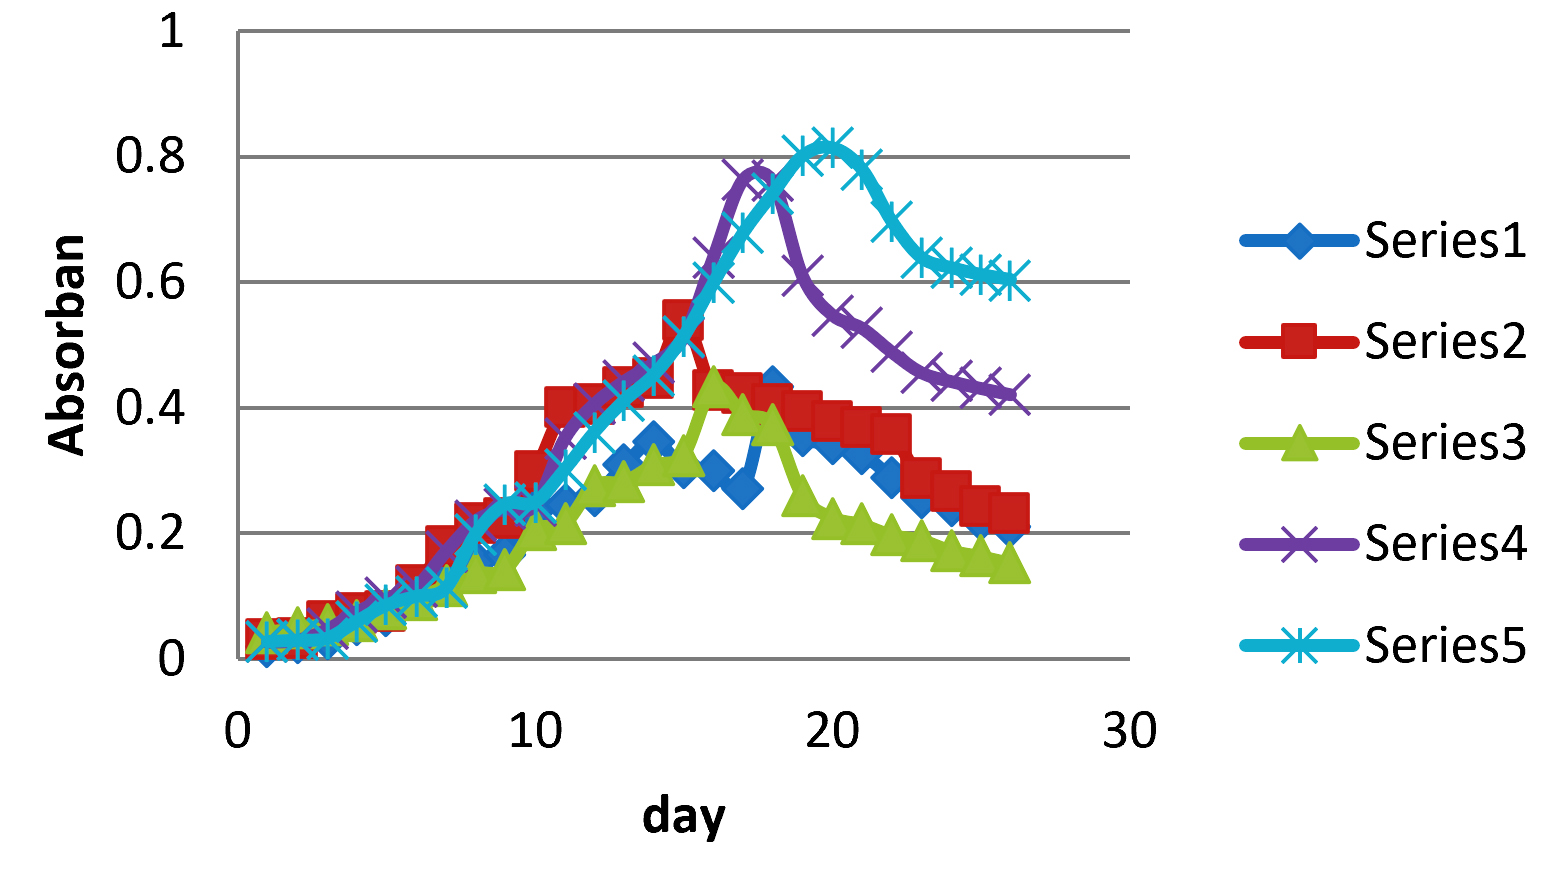 Fig. 2.The graphic of the MA1 microalgae growth curve using commercial fertilizers with concentrations of P1, P2, P3, P4 and P5.
The N element in Urea and ZA fertilizers comes from ammonium which acts as a major contributor in culture media. Urea fertilizer has N content of 46% while ZA fertilizer has a total N of 20.8%. Nitrogen in urea and ZA can be found in the form of ammonium ions. Urea can act as the largest ammonium ion contributor in the growth medium compared to ZA fertilizer.
According to Oh-hama and Miyachi (1998) the form of nitrogen compounds favored by microalgae is ammonium (NH4+), because the transport and assimilation of ammonium ions by microalgae cells into various types of organic macromolecules such as proteins and nucleic acids required less energy than transportation and assimilation of nitrate ions (NO3–).
P1 treatment has the lowest cell abundance that causes increasingly short growth because of the nitrogen source only comes from ZA fertilizer. This fertilizer can reduce the pH of culture medium to acid while microalgae growth is better in the alkaline pH range than neutral or acidic. Comparation between P2, P3, P4, and P5 which both use urea and ZA as sources of nitrogen showed that P5 has the highest cell abundance. This is because at P5 the nitrogen content was quite large from urea fertilizer and small ZA fertilizer so that it can balance nutrient and pH conditions in microalgae culture media.
TSP fertilizer acted as a contributor to P elements in the growth of microalgae, which functioned as a constituent of carbohydrates in culture media and important in the process of photosynthesis. If the concentration of P is high then the energy needed will tend to use nitrate for growth compared to ammonium. The usage of nitrates by microalgae can actually produce CO2 fixation in photosynthesis because nitrates and CO2 are competing to bind hydrogen.
Growmore Medium
Growmore fertilizer is a complete leaf fertilizer in the form of blue crystals, which is very easy to dissolve in water. In agriculture, this fertilizer is used because it is easily absorbed by plants and contains complete nutrients with different concentrations according to the needs. Growmore fertilizer has 4 variants made based on the number of elements N, P and K. These following images showed the growth of MA1 microalgae using 4 growmore fertilizer variants:
Fig. 3 showed that the best growth was found in growmore G32% (32-10-10) fertilizer medium. This can be seen from the high absorptive value and longer life time in the culture in growmore G32% (32-10-10) medium. The concentration of the four growmore mediums was distinguished by variations in the content of N, P, and K and the highest N content was growmore G32%. The most commonly used N sources are NaNO3, (NH4)2HPO4 and urea. N source is very influential on the process of microalgae growth where different nitrogen sources will have different effects on growth to produce different metabolites in each microalgae.
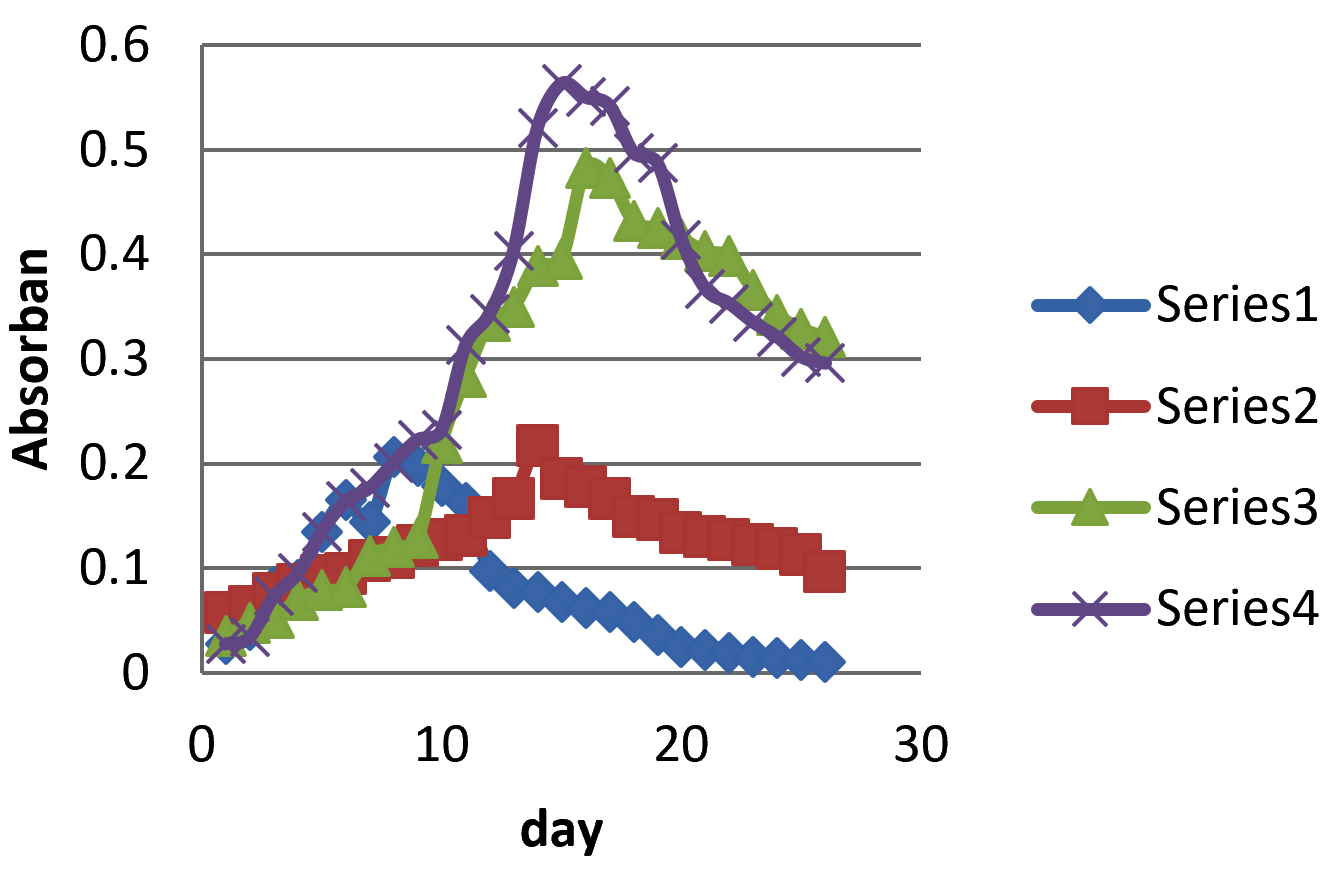 Fig. 3.Graphic of the MA1 microalgae growth curve by using Growmore fertilizer with concentration of G6% (6-30-30), G10% (10-55-10), G20% (20-20-20) dan G32% (32-10-10)
Excess and lack of N elements can cause cell division to be disrupted, resulting in reduced biomass production. This can be seen in microalgae cultures found in growmore fertilizer medium 6-30-30, growmore 10-55-10, and growmore 20-20-20 which have different nitrogen levels which affect growth.
In addition to the N element, P and K elements also affects the growth of microalgae, where the concentration of P and K elements that are appropriate will accelerate microalgae growth as seen in Fig. 3. Growmore (32-10-10) has a content of P and K as much as 10% which the highest compared to Growmore 6-30-30, 10-55-10 and 20-20-20. The different concentrations of N, P, K source will greatly affect growth, metabolism, and products by these microalgae.
Comparation of Commercial Fertilizer, Growmore Fertilizer and BBM
On Fig. 4 it can be seen the growth curve of MA1 microalgae on BBM medium has the highest cell abundance compared to growmore fertilizer (32-10-10) and commercial fertilizer P5. This is because the BBM medium contains macronutrient elements (NaNO3, CaCl2.H2O, MgSO4.7H2O, K2HPO4, KH2PO4, NaCl) and micronutrients (trace metals (ZnSO4, MnCl2, CuSO4, CO(NO3)2.6H2O), EDTA solution ( EDTA-KOH), Fe Solution (FeSO4.7H2O, H2SO4) dan H3BO3). Whereas growmore medium (32-10-10) and commercial fertilizer P5 only contains macronutrient elements.
 Fig. 4.Graphic of the MA1 microalgae growth curve by using Growmore fertilizer G32% (32-10-10), commercial fertilizer P5 (40 mg/L Urea; 10 mg/L ZA; 40 mg/L TSP) and BBM (Bold’s Basal Medium)
In addition to the rapid growth, the BBM medium also has higher biomass than growmore fertilizer (32-10-10) and commercial fertilizer P5. The abundance of biomass in the three mediums in the microalgae MA1 can be seen in Table 2.
Table (2):
Dry Biomass of MA1 Microalgae in 3 types of Medium
No. |
Medium |
Dry Biomass |
|---|---|---|
1. |
BBM |
0,602 g/L |
2. |
Growmore G32% |
0,302 g/L |
3. |
Commercial fertilizer P5 |
0,479 g/L |
Phytochemical Test
Phytochemical test of microalgae MA1 extracts (methanol, ethyl acetate and hexane) can be seen in Table 3.
Table (3):
Phytochemical test results from crude extracts of MA1 microalgae
| Phytochemical Test | Extract | ||
|---|---|---|---|
| Methanol | Ethyl Acetate | Hexane | |
| Phenolic | + | – | – |
| Flavonoid | – | – | – |
| Alkaloid | – | – | – |
| Triterpenoid | – | – | – |
| Steroid | – | + | + |
Annotation: ( – ) = Absent ( + ) = Present
Methanol is a universal solvent that able to dissolve both polar and nonpolar analytes. With its ability to dissolve polar and nonpolar compounds, methanol can attract more quantities of secondary metabolites from MA1 microalgae extracts, which are polar (phenolic) compounds.
Ethyl acetate is a semi-polar solvent and can dissolve semi-polar compounds on the cell wall14. The extraction of MA1 microalgae by using ethyl acetate solvents produced a positive test for the steroid compound class.
N-hexane is a type of nonpolar solvent that can dissolve nonpolar compounds. Table 3 showed that MA1 microalgae extracted by n-hexane solvent was positive on steroid compounds. This group of compounds is nonpolar so it can dissolve in n-hexane solvents.
Antibacterial Activity Test on MA1 Microalgae Extract
The results of the antibacterial activity test were seen by observing the zone of inhibition formed around the disc paper. The clear zone formed was measured using calipers and the results were presented in Table 4. The measurement of the clear zone formed was done by measuring the diameter of the zone formed by entering the size of the disc. Observations were made after 24 hours incubation.
Table (4):
Results of Measurement of Inhibition Zone Against 4 Test Bacteria
| Extract | Test Bacteria | |||
|---|---|---|---|---|
| Bacillus subtilis ATCC 6633 | Salmonella thypimurium ATCC 14028 | Escherichia coli ATCC 25922 | MRSA ATCC 25175 | |
| Methanol (500 μg/mL) | 13 mm | 10 mm | 10 mm | 20 mm |
|
Ethyl Acetate (500 μg/mL) |
9 mm | 8 mm | 11 mm | 12 mm |
| n-Hexane (500 μg/mL) | 8 mm | 7 mm | 8 mm | 8 mm |
| Positive control | 8 mm | 8 mm | 9 mm | 10 mm |
The best antibacterial activity test results from MA1 microalgae were showed on methanol extract (500µg / mL) against the Methicilin Resistance Staphylococcus aureus (MRSA) ATCC 25175 test bacteria with a zone of inhibition of 20 mm. The difference in the increase and decrease in the inhibition zone of each extract was caused by the components of substances contained in medicinal plants can weaken, strengthen, correct or change each other completely. In addition, the quality and quantity of substances in medicinal plants were determined by environmental factors such as climate, soil, sunlight and growth conditions until harvest. Factors that influenced antibacterial activity includes environmental pH, seeding component, active substance stability, size of the inoculum, a period of incubation and bacterial metabolic activity19.
Table 4 showed that MA1 microalgae extract can provide antibacterial activity. This is caused by the presence of secondary metabolites (phenolics and steroids) produced by the extract. Phenolic compounds have hydroxyl groups which acted as poisons for microorganisms. The attachment of side and the number of hydroxyl groups in phenolic compounds were related to their toxicity to microorganisms. The addition of hydroxyl groups will increase the toxicity. Besides that, stronger oxidized phenols will be more inhibiting. The mechanism of the reaction was responsible for the toxicity of phenolic compounds in microbes through reactions with sulfhydryl groups or more nonspecific interactions with proteins. Steroids were also reported to have antibacterial activity because steroids bind specifically to lipid membranes, causing leaks from liposomes.
The positive control used was 10µg amoxicillin. Amoxycillin was chosen as a positive control because it had broad-spectrum as an antibiotic so it can inhibit the growth of Gram-positive and Gram-negative bacteria. The negative control used was DMSO (0.1%). Dimethyl sulfoxide (DMSO) is an organic sulfur compound with the formula (CH3)2SO. This colorless liquid is an aprotic solvent that able to dissolves both polar and non-polar compounds. The DMSO concentration of 1% was able to kill 2-10% of bacteria, therefore it is recommended that the use of concentrations of DMSO should be in low concentrations when dissolving the antibacterial test extract so it would not have any inhibitory effect on the test bacteria. The recommended concentration was 0.01% – 0.5% DMSO20.
Based on the research which had been done, it can be concluded that the microalgae that were isolated from Lake Biru Sawahlunto West Sumatra were Scenedesmus dimorphus. Suitable growth medium to produce maximum biomass from microalgae Scenedesmus dimorphus was BBM medium (Bolt Bassal Medium) with dry biomass obtained 0.602 g/L. Methanol, ethyl acetate and n-hexane extract of microalgae Scenedesmus dimorphus contain secondary phenolic and steroid metabolites which have potential as antibacterial.
Acknowledgments
None.
Conflicts of Interest
The authors declare that there is no conflict of interest.
Authors’ Contribution
All authors have made substantial, direct and intellectual contribution to the work and approved it for publication.
Funding
None.
Data Availability
All datasets generated or analyzed during this study are included in the manuscript.
Ethics Statement
This article does not contain any studies with human participants or animals performed by any of the authors.
- Petersen P.J., Bradford P.A., Weiss W.J., Murphy T.M., Sum P.E., Projan S.J. In vitro and in vivo activities of Tigecycline (GAR-936), Daptomycin, and comparative antimicrobial agents against glycopeptide-intermediate Staphylococcus aureus and other resistant Gram-positive pathogens, Antimicrob. Agents & Chemotherap. Int., 2002; 46: 2595-2601.
Crossref - Tsuji M., Takema M., Miwa H., Shimada J., Kuwahara S. In vivo antibacterial activity of S-3578, a new broad-spectrum cephalosporin: Mehicillin-Resistant Staphylococcus aureus and Pseudomonas aeruginosa experimental infection models, Antimicrob. Agents & Chemotherap. 2003; 47: 2507-2512.
Crossref - Griffith D.C., L. Harford, R. Williams, V.J. Lee, M.N. Dudley. In vivo antibacterial activity of RWJ-54428, a new cephalosporin with activity against Gram-positive bacteria. J. Antimicrob. Agents & Chemotherap., 2003; 47: 43-47.
Crossref - Zhou W., Bing H., Yecong L., Min Min, Michael Mohr, Zhenyi Du, Paul Chen, Roger Ruan. Mass Cultivation of Microalgae on Animal Wastewater: A Sequential Two-Stage Cultivation Process for Energy Crop and Omega-3-Rich Animal Feed Production. Applied Biochemistry and Biotechnology, 2012; 168(2): 348–63.
Crossref - Maisashvili, Aleksandre, Hendry B., James R., David A., Tryon W., Merritt D. The Values of Whole Algae and Lipid Extracted Algae Meal for Aquaculture. Algal Research, 2015; 9: 133–42. (http://www.sciencedirect.com/science/article/pii/S2211926415000697).
Crossref - Wiley P.E., J. Elliott Campbell, Brandi M. Production of Biodiesel and Biogas from Algae/ : A Review of Process Train Options. 2011.
Crossref - Guan Q, Chaohai W, Ping N, Senlin T, Junjie G. Catalytic Gasification of Algae Nannochloropsis Sp. in Sub/Supercritical Water. Procedia Environmental Sciences 18. Elsevier B.V. 2013; 844–48.
Crossref - Barsanti, Laura, Paolo, Gualtieri. Algae: Anatomy, Biochemistry, and Biotechnology. Boca Raton: CRC Press. Taylor & Francis Group. 2006.
- M. Parvin M.N., Zannat, M.A.B. Habib. Two Important Techniques for Isolation of Microalgae. Asian Fisheries Science, 2007; 20(2007): 117-124.
- Ilavarasi A., Mubarakali D., Praveenkumar R., Baldev E., Thajuddin N. Optimation Of Various Growth Medium To Fresh water Microalgae For Biomass Production. Biotechnology, 2011; 10(6): Hal. 540-545.
Crossref - Afriza Zafira, Gusti D., Anna I.S.P. Effect of different doses of Urea (CH4N2O) fertilizer on cell density and growth rate of Porpyridium sp. in laboratory-scale phytoplankton. Marine Science Study Program, FMIPA, Sriwijaya University, Indonesia, 2014; 7(2): 33-40.
- Praharyawan S. and Putri S.A. Optimization of Flocculation Efficiency in the Harvesting Process of Potential Biodiesel Producing Microalgae by using Magnesium Ions. Biopropal Industry. 2017; 8(2): 89-98
- Goh Su-Hua. A Comparison of the Antioxidant Properties and Total Phenolic Content in a Diatom, Chaetoceros sp. and a Green Microalga, Nannochloropsis sp. Journal of Agricultural Science. 2010; 2(3).
Crossref - Harborne J.B. Phytochemical Methods: Guide to Modern Methods of Analyzing Plants, Translated by Kosasih Padmawinata and Iwang Soediro, Bandung Institute of Technology, Bandung. 1987.
- Djamaan, A, Marjoni M R, and Ismed F, The Influence of Pretreatment Time,Type and the Concentration of Yeast on Ethanol Production from Rice Straw. Research Journal of Pharmaceutical, Biological and Chemical Sciences, 2015, 6(3): 583-591.
- Djamaan, A, Agustien, A, Gemeidiya, R, Jannah, M, Asiska, PD, Wangi QA, Isolation and Identification of Bioplastic Producing Bacteria from Soil at the Top of Marapi Volcano Mountain, West Sumatra, Indonesia. Der Pharma Chemica. 2016, 8(11), 160-166.
- Vishnu N., Sumathi R. Isolation Of Fresh Water Microalgae Chlorella sp. And Its Antimicrobial Activity On Selected Pathogens. International Journal of Advanced Research in Biological Sciences. 2014; 1(3): 36-43.
- Oh Hama T, Miyachi S. Chlorella. Ln : M. A. Borowitzka & L. J. Borowitzka (Eds.) Microalga Biotechnology Cambridge Univ. Press. London. P:4. 1998.
- Rivai, H, Asia A, Rina W, AlenY Handayani D, Aldi Y, Marlina, and Djamaan A, Isolationof Endophytic Bacteria from Bark, Leaf, andPericarp of Mangosteen (Garcinia mangostana L.) and Testing of The Antimicrobial Activity, Research Journal of Pharmaceutical, Biological and Chemical Sciences, 2016, 7(1): 1910-1920
- Wadhwani T., Desai K., Patel D., Lawani D., Bahaley P., Joshi P., Kothari V. Effect of various solvents on bacterial growth incontext of determining MIC of various antimicrobials. The Internet Journal of Microbiology, 2008; 7(1): Hal 1-6.
© The Author(s) 2019. Open Access. This article is distributed under the terms of the Creative Commons Attribution 4.0 International License which permits unrestricted use, sharing, distribution, and reproduction in any medium, provided you give appropriate credit to the original author(s) and the source, provide a link to the Creative Commons license, and indicate if changes were made.