

ISSN: 0973-7510
E-ISSN: 2581-690X
Staphylococcus aureus is a pathogen that can cause both minor and life-threatening infection to human. Recently, the emergence of antibiotic-resistant Staphylococcus aureus (MRSA) has become a global public health concern. As an alternative to antibiotics, bacteriophage therapy is receiving increasing attention. Isolation and characterization of more Staphylococcus aureus phages is an important pre-requisite for building a large repository of phages that can be used in the future for phage therapy. Here we report the isolation of bacteriophages against S. aureus ATCC 6538, the first of its kind in Malaysia. Twenty phages were isolated and two were examined in detail. These two phages, TJSb3 and TJSb6, were found to be highly lytic and belong to the order Caudovirales and the family Siphoviridae. TJSb3 and TJSb6 have high efficiency of plating (EOP value) of 0.907 ± 0.085 and 0.665 ± 0.114, respectively. These two phages exhibited a broad lytic effect against the 4 different S. aureus strains tested (one of which, S. aureus ATCC 43300, is a MRSA strain). TJSb3 and TJSb6 also have small genome size of 20-30k base pairs, making them smaller than 90% of the S. aureus phages recorded in the NCBI viral genome database. These traits make TJSb3 and TJSb6 very attractive as potential candidates for phage therapy.
Staphylococcus aureus, Bacteriophage, Isolation, Characterization, Lytic
Staphylococcus aureus (S. aureus) is a Gram-positive, anaerobic bacteria commonly found in the human body. An estimated 50% of the adults and almost 15% of the entire population are carrying S. aureus persistently in their nostrils.1 S. aureus can cause a wide range of infections, ranging from skin and soft tissue infections to serious conditions like pneumonia and bloodstream infections. It is becoming a major concern in recent years due to the emergence of Methicillin-resistant S. aureus (MRSA).2 MRSA is resistant to a wide range of beta-lactam antibiotics, including vancomycin and methicillin, making infections difficult to treat with standard antibiotics. As a result, in 2017, the World Health Organization (WHO) listed S. aureus as a high priority pathogen.3,4 Identification of alternative treatment methods for MRSA has become a global public health priority.
A highly promising solution to MRSA infection is bacteriophage therapy. Bacteriophages (phages) are viruses that infect bacteria, whilst being harmless to human and animal cells. Phages are abundant in soil, water, ocean, human bodies, with an estimated total number as high as 1031, making them the most abundant organism on Earth, out-numbering their bacteria prey by 10-fold. Phages can be categorized into lytic and lysogenic types based on their replication strategy. Lytic phages absorb to a host bacterium, inject their genome, rapidly replicate within the host, and eventually cause complete lysis and death of the host cell, releasing new progeny phage particles. In contrast, lysogenic phages incorporate their DNA into the host bacterium, and replicate their genome alongside the host bacteria, until certain conditions cause them to become lytic.4,5 The abundance of phages and the ability of lytic phages to cause bacterial death make them attractive agents for tackling antibiotic-resistant pathogens, especially MRSA. In addition, phages have the benefit of being specific to their hosts, often infecting only a narrow range of bacteria, in contrast to antibiotics.6 Phages are also lower in toxicity compared to antibiotics,6,7 and exhibit the ability to co-evolve with their bacteria host, in case the host develops resistance against them.7,8
In recent years, the concept of using bacteriophages to treat bacterial infections is gradually becoming a reality, with several high-profile reports of phage use in severe cases of infections caused by antibiotic-resistant Acinetobacter baumannii, Pseudomonas aeruginosa, Mycobacterium abscessus, Klebsiella pneumoniae, and Staphylococcus aureus.7,9-12 Despite the attractive characteristics of phages as an anti-infective and the above-mentioned success example, research into phages is still inadequate to enable wider clinical application. Particularly, isolation of novel phages targeting key pathogens is needed to build a powerful phage repository as candidates for phage therapy. Furthermore, research into the basic features of these phages, such as efficiency of lysis and host specificity, are also essential. Under such context, this study reports the successful isolation and characterization of several S. aureus ATCC 6538 phages in Pahang region of Malaysia.
Sample collection
Ten samples were collected from the environment and sewage water in the area of Skudai, Johor and Kuantan, Pahang, between 2019 and 2020. As detailed in Table S1, 10 distinct locations were chosen that included a variety of sources: lake water, river water, sewage water, waterfall etc. One sample was taken from each location with distinct coordinate. For each sample approximately 500 mL of water samples were collected in screw-capped bottles. These water samples were collected using a wide-necked plastic jar nailed to a long pole. Samples were stored overnight in a cold 4°C cold room for 12-24 hours before being used for further analysis.
Bacterial strain and growth media
Staphylococcus aureus ATCC 6538 was cultured and grown on the Luria-Bertani (LB) broth as host bacteria of bacteriophage at 37°C for 24 hours. Besides S. aureus ATCC 6538, seven other bacterial strains were also cultured in the lab to be used for testing phase host range: S. aureus ATCC 25923, S. aureus ATCC 29123, S. aureus ATCC 43300 (MRSA strain), Escherichia coli ATCC 10536, Serratia marcescens ATCC 13880, Acinetobacter baumannii ATCC 19606 and Bacillus cereus ATCC 11778 (Table S2) were cultured and grown on the LB broth which would be used in phage host range determination.
Isolation and enrichment of bacteriophage from liquid sample
According to the bacteriophage enrichment technique by Van Twest and Kropinski,13 the sewage suspension was centrifuged at 10,000 × g for 10 minutes. After centrifugation, the supernatant was filtered through 0.22 µm of nylon membrane filter. For the aerobic culture, 10 mL of sterile double strength LB broth that contain 2 mM of calcium chloride was pipetted into a 125 mL of conical flask, followed by adding 10 mL of filtered sewage. After that, 0.1 mL of an overnight S. aureus broth culture was inoculated into the conical flask. Then, the culture was incubated at 37°C with 200 rpm of agitation speed. After 24 h of incubation time, the content in the conical flask was transferred into a new centrifuge tube followed by centrifugation at 10,000 × g for 10 minutes. The supernatant was filtered by 0.22 µm of nylon membrane filter. The filtrate was filled into a 20 mL of borosilicate vials for storage. Then, 0.2 mL of chloroform was mixed to the clarified crude lysate. The mixture was shaken for good mixing and stored at 4°C. After phage enrichment was done, spot test analysis was performed to test whether there was any active phage present which can infect S. aureus ATCC 6538 in the enrichment culture.
Phage purification
Phage purification technique was performed as per protocol of Gencay, Birk14 with slight modification. Firstly, the plaques on the plate was picked using different sterile 200 µl pipette tips. The centre of an isolated plaque was gently dipped by the end of the pipette tips. Then, the harvested plaque was transferred and resuspended in the microcentrifuge tube containing 500 µl of sterilized saline magnesium buffer (100 mM sodium chloride, 10 mM magnesium sulphate, 50 mM Tris-HCl, pH 7.5 and 0.01% (w/v) gelatine.). The liquid was mixed well by vortex for 3 min. The harvested plaque was diluted tenfold in SM buffer in which 100 µl of plaques suspension was dissolved in 900 µl of SM buffer. Thereafter, 100 µl of diluted plaques was mixed with 300 µl of the host bacteria in the microcentrifuge tube. The phage-host mixture was incubated for 10 min to allow proper adsorption of phage with host bacteria. After that, double agar overlay was done followed by incubation at 37°C for 18 to 24 hours. The purification step was repeated three times to obtain pure plaque.
Phage amplification
Amplification of phage via plate lysate was conducted based on the protocol of Jothikumar, Reddy15 with some modifications. Firstly, 100 µl of the phage lysate was mixed with 300 µl of overnight culture of host bacteria, S. aureus ATCC 6538, in a microcentrifuge tube. The phage-host mixture was incubated for 10 min to allow the proper adsorption of phage with host bacteria. Then, the mixture was mixed with 4 mL of top agar and poured onto the base plates. Thereafter, the plate was incubated for 18 to 24 hours at 37°C. After incubation, the lysed plate with near confluent lysis were selected and the top agar was scrapped into a 50 mL falcon tube containing 5 mL of SM buffer and 50 µl of chloroform by using a sterile 1000 µl pipette tip. After that, the mixture was vortexed vigorously for 3 minutes and the mixture was centrifuged at 5000 × g for 10 minutes at 4°C. The supernatant was collected and filtered through 0.22 µm of nylon syringe filter. The filtrate was used as lysate and stored in 20 mL of borosilicate glass vial.
Titration of phage lysate
Ten-fold serial dilution (10-1 to 10-9) of the phage lysate were prepared in SM buffer. Thereafter, double agar overlay method was performed by adding 300 µl of the overnight host bacteria culture into top agar and poured onto the base agar. After the top agar had solidified, 10 µl diluted phage was spotted on the top agar according to the respective dilution value. After that, the plate was left for 15 minutes to allow the spotted liquid to dry and absorb into the top agar followed by incubation of the plates at 37°C for 18 to 24 hours.
Phage host range determination
Different strains of bacteria were tested as a host in this experiment. S. aureus ATCC 25923, S. aureus ATCC 29123, S. aureus ATCC 43300 (MRSA strain), Escherichia coli ATCC 10536, Serratia marcescens ATCC 13880, Acinetobacter baumannii ATCC 19606 and Bacillus cereus ATCC 11778 were used. Approximately 10 µl of the phage lysate was spotted on the top agar of lawn with bacteria culture. The plate was incubated with phage lysate and test culture for 18 to 24 hours at 37°C.
Efficiency of plating (EOP) determination
The phages that showed positive result in phage host range assay were subsequently used for EOP test. Approximately 100 µl of diluted phage lysate and 300 µl of these cultures were cultured in double layer technique. Phages were serially diluted. Then, 10 µl diluted phage was spotted onto the top agar containing host bacteria or test bacteria. After that, the plate was left for 15 minutes to allow the spotted liquid to dry and absorb into the top agar. Thereafter, the plates were incubated at 37°C for 24 hours. The number of plaques on the plate were observed and calculated.
One step growth curve
Approximately 1 mL overnight host bacterial culture was inoculated into 100 mL of conical flask containing 20 mL of the LB broth. The culture was incubated until the optical density reached the range of 0.4 to 0.6 which the bacterial concentration was around 108 cfu/mL. Then, 10 mL of log phase host bacteria were centrifuged at 6000 × g for 10 minutes. The pellet was resuspended into 2.5 mL of the fresh LB broth. Thereafter, 900 µl of the host bacterial culture was mixed with 100 µl of 107pfu/ mL of phage lysate to achieve multiplicity of infection of ~0.01. The phage-host mixture was incubated for 10 minutes to allow proper adsorption of phage with host bacteria. After that, the mixture was centrifuged at 10,000 × g for 10 minutes at 4°C to remove free phages which were not adsorbed to the host bacteria. The pellet was resuspended with 10 mL of LB broth and the culture was incubated at 37°C. The samples were collected at every 10 minutes for 2 hours.16 Once the sample was collected, the sample was centrifuged at 10,000 × g for 10 minutes at 4°C. Then, the supernatant was serially diluted and 10 µl of the diluted phage was spotted onto the top agar containing host bacteria. After that, the plate was left for 15 minutes to allow the spotted liquid to dry and absorb into the top agar. The plates were then incubated for 18 to 24 hours at 37°C. Lastly, graph with the concentration of phage lysate against the time was plotted, so that the latent period and the burst size of phage could be determined.
Phage DNA extraction
Phage DNA was extracted according to a previously described protocol17 using phenol-chloroform method. Firstly, 1.8 mL of the phage lysate was transferred into a 15 mL the falcon tube. Then, 18 µL of the 1 mg/mL of DNAse I and 12.5 mg/mL of RNAse A were added into the tube. After that, the mixture was mixed well and incubate at 37°C for 30 minutes. Thereafter, 46 µl of 20% (w/v) of SDS and 18 µl of 10 mg/mL of proteinase K were transferred into the tube. The mixture was mixed well and incubated at
37°C for 30 minutes. Next, the mixture was aliquoted 500 µL into 4 different 1.5 mL of the Phase-lock gel. The phase lock gel could be prepared by adding 50 µl to 100 µl of the vacuum grease into a 1.5 mL of microcentrifuge tube, followed by centrifuging the tube at 10,000 × g for 10 minutes
Then, 0.5 mL of the phenol: chloroform: isoamyl alcohol with the ratio of 25:24:1 were added into the aliquoted sample, followed by centrifugation at 1500 × g for 5 minutes. Next, the top aqueous phase was transferred into a new Phase-lock gel tube. The extraction step by phenol: chloroform: isoamyl alcohol was repeated as previously described. The mixture was centrifuged at 6000 × g for 5 minutes. The top aqueous phase was transferred into a new 1.5 mL of microcentrifuge tube. Thereafter, 45 µl of 3M sodium acetate and 500 µl of 100% (v/v) of isopropanol were added into the tube. The DNA was precipitated by leaving the tubes with mixture for 20 minutes at room temperature. The mixture was then centrifuged at 14,000 × g, 4°C for 20 minutes. After the supernatant was discarded, the DNA pellet was resuspended with 200 µl of 70% (v/v) ethanol. Again, the mixture was then centrifuged at 14000 × g, 4°C for 20 minutes. The washing steps the DNA pellet with 70% (v/v) ethanol was repeated twice. After that, the DNA pellet was dried in the lamina flow for 15 to 20 minutes. Each of the DNA pellet was then dissolved in 50 µl of TE buffer. The DNA was stored at 4°C for further use.
After DNA extraction, agarose gel electrophoresis was conducted to analyze the DNA fragments.
Restriction enzyme digestion
The extracted phages DNA were digested using restriction enzymes which included SacII, HindIII and NaeI (NEB) as per the manufacturer’s instructions. A typical reaction setup is shown in Table S3.
After digestion, agarose gel electrophoresis was conducted to analyze the DNA fragments. Firstly, 1% (w/v) of the agarose gel was prepared using 1X TAE buffer. Then, the agarose solution was poured into the electrophoresis cast and allowed the agarose to solidify. The solidified agarose was placed into the electrophoresis tank and 1X TAE buffer was added into the cast until the level that covered the whole gel. Next, 5 µl of DNA marker was loaded into the first lane of the agarose gel followed by all samples. Approximately 5 µl of each phage DNA samples were mixed with 1 µl of 6X DNA loading dye and 1 µl of diamond nucleic stain by using pipette tips on the parafilm before loading into the lane. The electrophoresis system was then operated at 80 Volts for 90 minutes. The phage DNA bands could be visualised by using UV-gel documentation system.
Observation of phage under transmission electron microscope
A small drop of pure phage lysate was deposited onto a carbon coated copper grid. Wait for 10 minutes to allow the phages to adsorb on the grid. Then, a drop of stain, 2% (w/v) of uranyl acetate was added onto the grid that containing the phage suspension. After 5 minutes, filter paper was used to drain off the liquid. The grid was then ready for examination under transmission electron microscope once the grid was dried. The detection limit for the phage was at the concentration of 105 particles per millilitre. If the phage concentration was high, then the procedure must change opposite to the original procedure which was stain first, phage later.
The grid could be examined at 60 kV using Tecnai G2 transmission electron microscope. The dimension and the morphology of the bacteriophage were observed and recorded.
Isolation of S. aureus ATCC 6538 bacteriophages
Of the 10 water samples collected, only 2 contained S. aureus ATCC 6538 phages (samples G and H), as evidenced by the clear lytic zone in the spot test (Figure 1 a/b). The other 8 water samples did not contain S. aureus ATCC 6538 infective phages, even though the enrichment process was repeated twice (Table 1). Both sample G and H were collected from sewage water, whereas the other samples not yielding S. aureus ATCC 6538 phages were from open freshwater body (except sample I -which was from sewage water but did not yield S. aureus ATCC 6538 phages). This is consistent with previous reports showing the richness of phages in sewage water versus other sources.18 The absence of S. aureus 6538 phages in open water is likely due to the low concentration of phages and their hosts.
Table (1):
Plaque formation in the collected samples
Sample Code |
Location |
Types of sample |
Plaque formation |
|---|---|---|---|
A |
Universiti Teknologi Malaysia T02 building |
Lake water |
– |
B |
Universiti Teknologi Malaysia recreation park |
Lake water |
– |
C |
Mutiara Rini recreation park |
Lake water |
– |
D |
Crossroad junction of Gambang |
Lake water |
– |
E |
Gambang Resort City |
Lake water |
– |
F |
Kuantan River |
River water |
– |
G |
Sewage treatment plant at Universiti Malaysia Pahang |
Sewage water |
+ |
H |
Sewage treatment plant at Residential college 4, Universiti Malaysia Pahang |
Sewage water |
+ |
I |
Indah water sewage treatment plant Housing area of Makmur Fajar Jaya |
Sewage water |
– |
J |
Berkelah waterfall |
Waterfall sample |
– |
“+” represents visible isolated plaques; “-” represents no visible isolated plaque
Since sample G and sample H gave S. aureus infective phage in the spot test, these samples were used to perform double layer assay which resulted in individual plaques. Phages from sample G and sample H formed a high number of plagues with differing morphologies, some with clear edges and some with fuzzy edges, indicating that different types of phages exist in these samples, requiring further isolation and purification (Figure 1 c/d).

Figure 1. Plating of phages from water samples
(a) Spot test of sample A, B, C, D, E, F, G and H; (b) Spot test of sample I, J, K, L, M, N and control; (c) Sample G; (d) Sample H
Morphology of plaques
Twenty individual phages plagues from the above double layer assay of sample G and H were isolated and further purified. The purified phages were then serially diluted and plated on top-layer agar containing S. aureus ATCC 6538 to further analyze their morphology. As shown in Table 2 and Figure 2, 18 plaque isolates were clear plaques while 2 plaque isolates were turbid plaques. Clear plaques are indicative of lytic phages whilst turbid plaques are indicative of temperate phages. All the plaques were regular in shape. Among 20 plaques isolates, Staphylococcus phage TJSb5 had the largest plaque diameter which was 18 mM while Staphylococcus phage TJSa7 had the smallest plaque diameter which was only 5 mM (Figure 2). Differences in plague size indicate differences in phage burst size and latent period, further proving that the samples isolated contain many distinct phages.
Table (2):
Morphology of plaque isolates
Phage |
Appearance |
Shape |
Diameter (mm) |
|---|---|---|---|
Staphylococcus phage TJSa1 |
Clear |
Regular |
9 |
Staphylococcus phage TJSa2 |
Clear |
Regular |
7 |
Staphylococcus phage TJSa3 |
Clear |
Regular |
6 |
Staphylococcus phage TJSa4 |
Clear |
Regular |
8 |
Staphylococcus phage TJSa5 |
Clear |
Regular |
11 |
Staphylococcus phage TJSa6 |
Clear |
Regular |
8 |
Staphylococcus phage TJSa7 |
Clear |
Regular |
5 |
Staphylococcus phage TJSa8 |
Clear |
Regular |
11 |
Staphylococcus phage TJSa9 |
Clear |
Regular |
7 |
Staphylococcus phage TJSa10 |
Clear |
Regular |
10 |
Staphylococcus phage TJSb1 |
Clear |
Regular |
10 |
Staphylococcus phage TJSb2 |
Turbid |
Regular |
13 |
Staphylococcus phage TJSb3 |
Clear |
Regular |
6 |
Staphylococcus phage TJSb4 |
Clear |
Regular |
9 |
Staphylococcus phage TJSb5 |
Turbid |
Regular |
18 |
Staphylococcus phage TJSb6 |
Clear |
Regular |
7 |
Staphylococcus phage TJSb7 |
Clear |
Regular |
6 |
Staphylococcus phage TJSb8 |
Clear |
Regular |
6 |
Staphylococcus phage TJSb9 |
Clear |
Regular |
6 |
Staphylococcus phage TJSb10 |
Clear |
Regular |
6 |
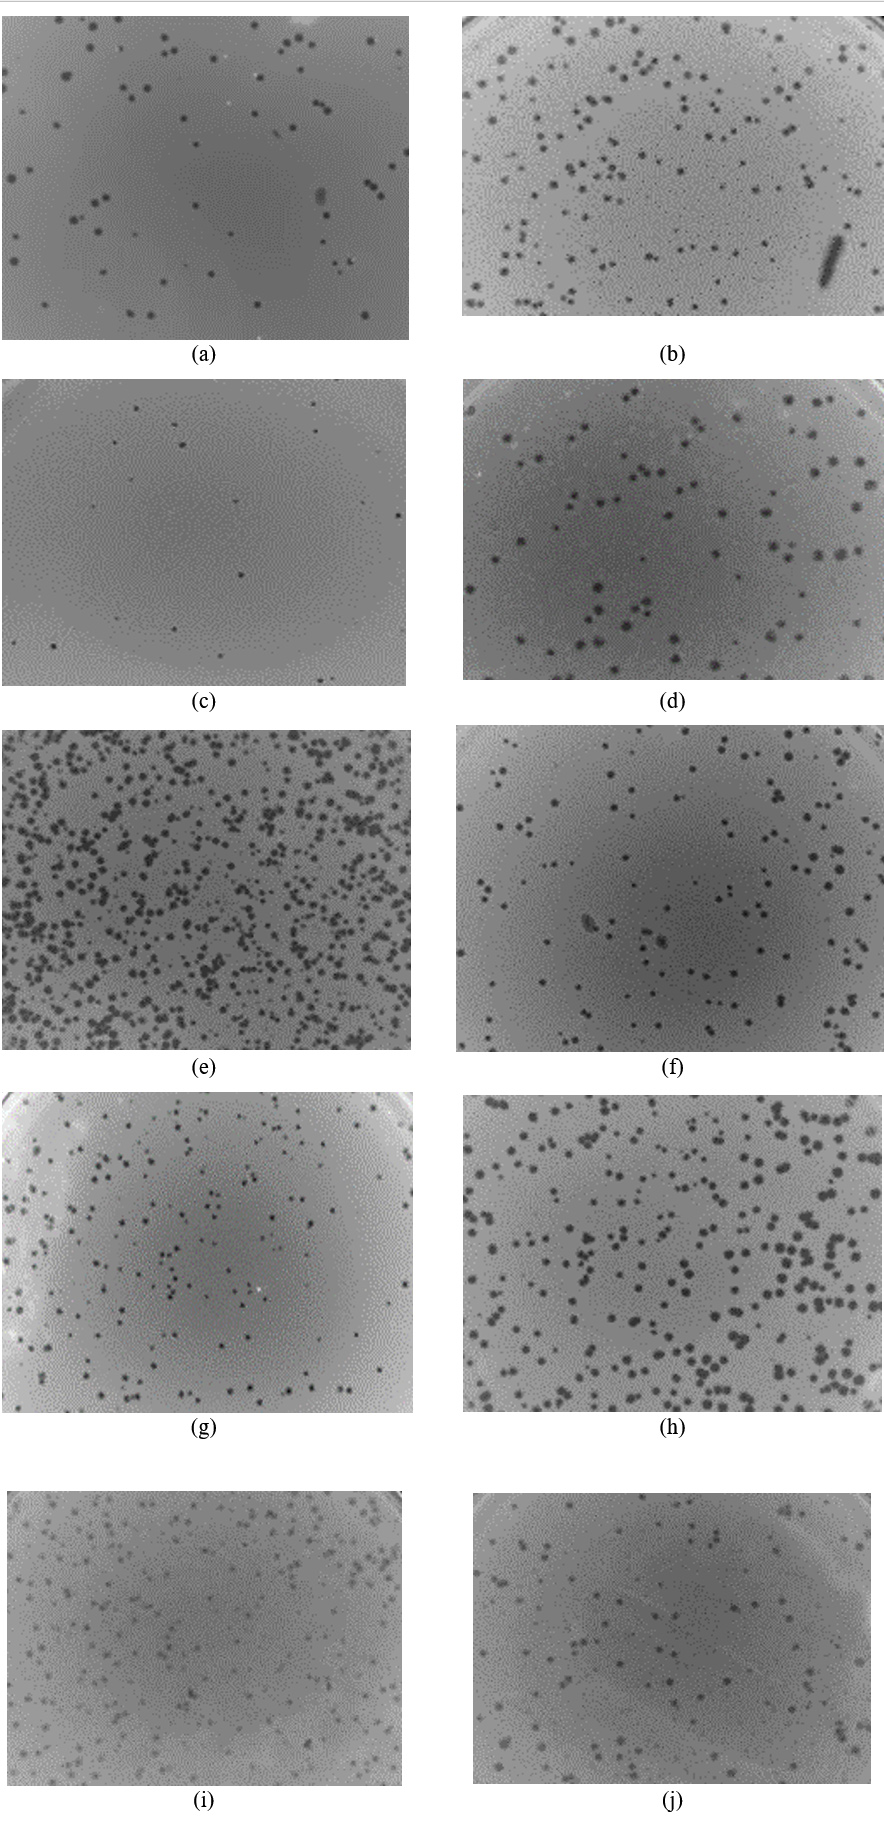
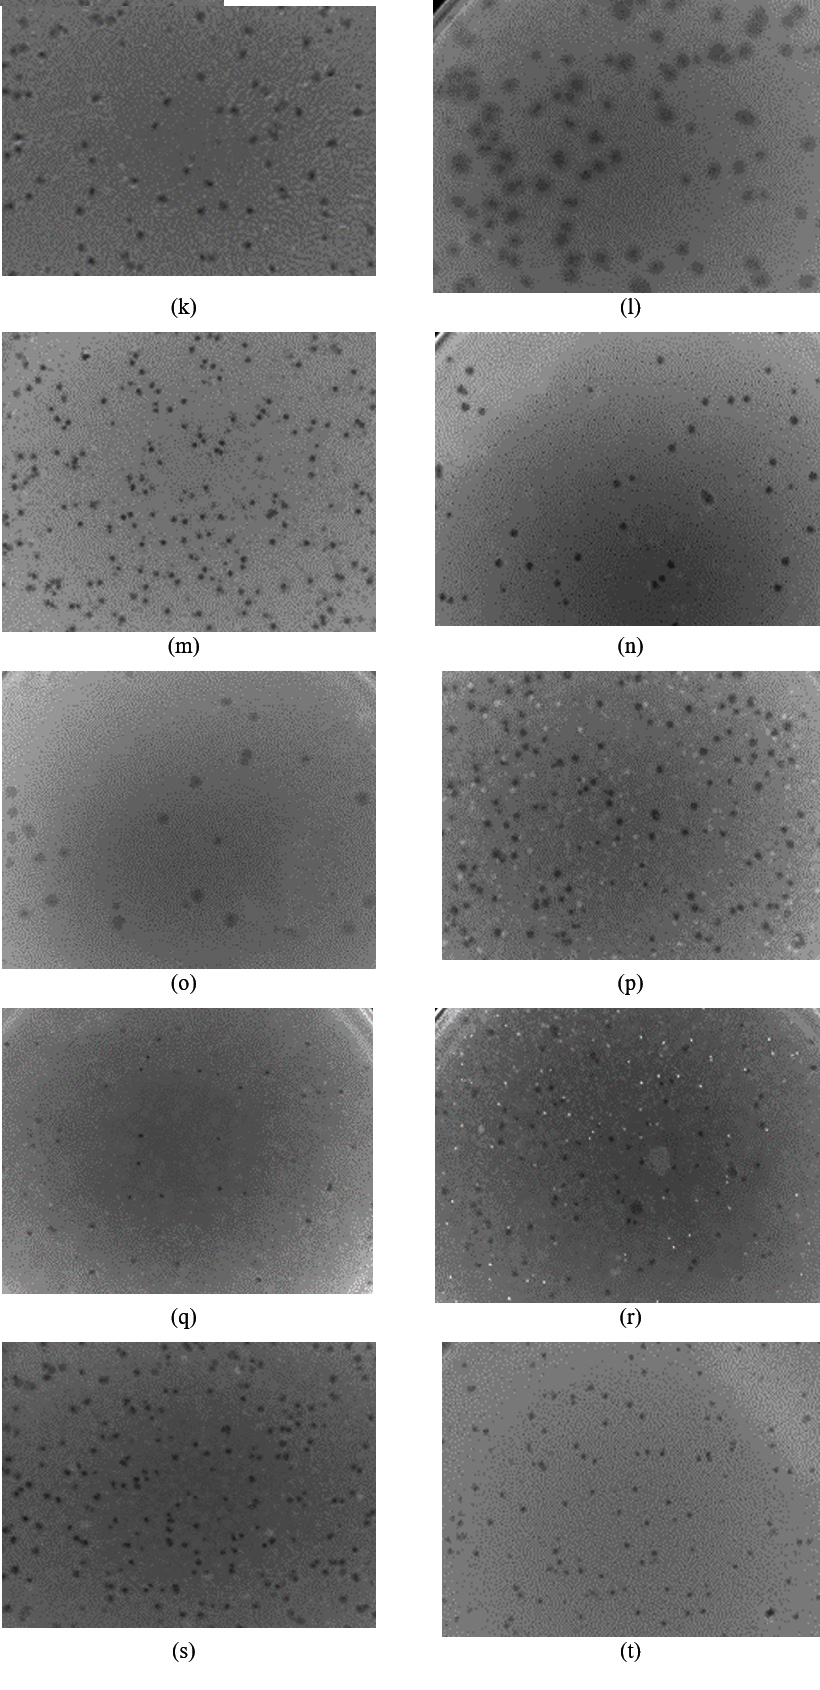
Figure 2. Plaques formed by phage isolates in this study
(a) Staphylococcus phage TJSa1, (b) Staphylococcus phage JSa2, (c) Sample Staphylococcus phage TJSa3, (d) Staphylococcus phage TJSa4, (e) Staphylococcus phage TJSa5, (f) Staphylococcus phage TJSa6, (g) Staphylococcus phage TJSa7, (h) Staphylococcus phage TJSa8, (i) Staphylococcus phage TJSa9, (j) Staphylococcus phage TJSa10, (k) Staphylococcus phage TJSb1, (l) Staphylococcus phage TJSb2, (m) Staphylococcus phage TJSb3, (n) Staphylococcus phage TJSb4, (o) Staphylococcus phage TJSb5, (p) Staphylococcus phage TJSb6, (q) Staphylococcus phage TJSb7, (r) Staphylococcus phage TJSb8, (s) Staphylococcus phage TJSb9, (t) Staphylococcus phage TJSb10
Phage host range determination
To investigate the host range of the isolated Staphylococcus phages, 7 bacterial strains were tested using the method detailed in Section 2.7. As shown in Table 3, none of the isolated phages could infect B. cereus ATCC 11778, E. coli ATCC 10536, S. marcescens ATCC 13880 and A. baumannii ATCC 19606. However, some of the phages could infect different strains of S. aureus, which are ATCC 25923, ATCC 29123 and ATCC 43300. In particular, S. aureus ATCC 4330 is a MRSA strain. This implies that all the isolated S. aureus phages are restricted to infecting S. aureus, among the strains tested. Furthermore, among these phages, some are even more specific and only infect one sub-strain of S. aureus, whereas some could infect different sub-strains of S. aureus. This result is supported by the study of Kasman and Porter19 that bacteriophages are highly specific to the species and usually infect only a single bacterial species or even a specific sub-strain of bacterial species.
Table (3):
Host range of Staphylococcus phages
| Phage | Host bacteria strains | Test bacteria strains | ||||||
|---|---|---|---|---|---|---|---|---|
| S. aureus ATCC 6538 | S. aureus ATCC 25923 | S. aureus ATCC 29123 | S. aureus ATCC 43300 (MRSA) | B. cereus ATCC 11778 | E. coli ATCC 10536 | S. marcescens ATCC 13880 | A. baumannii ATCC 19606 | |
| Staphylococcus phage TJSa1 | + | – | – | – | – | – | – | – |
| Staphylococcus phage TJSa2 | + | – | – | – | – | – | – | – |
| Staphylococcus phage TJSa3 | + | – | – | – | – | – | – | – |
| Staphylococcus phage TJSa4 | + | – | – | – | – | – | – | – |
| Staphylococcus phage TJSa5 | + | – | – | – | – | – | – | – |
| Staphylococcus phage TJSa6 | + | – | – | – | – | – | – | – |
| Staphylococcus phage TJSa7 | + | – | – | – | – | – | – | – |
| Staphylococcus phage TJSa8 | + | – | – | – | – | – | – | – |
| Staphylococcus phage TJSa9 | + | – | – | – | – | – | – | – |
| Staphylococcus phage TJSa10 | + | – | – | – | – | – | – | – |
| Staphylococcus phage TJSb1 | + | + | + | + | – | – | – | – |
| Staphylococcus phage TJSb2 | + | + | + | + | – | – | – | – |
| Staphylococcus phage TJSb3 | + | + | + | + | – | – | – | – |
| Staphylococcus phage TJSb4 | + | + | + | + | – | – | – | – |
| Staphylococcus phage TJSb5 | + | – | – | – | – | – | – | – |
| Staphylococcus phage TJSb6 | + | + | + | + | – | – | – | – |
| Staphylococcus phage TJSb7 | + | + | – | – | – | – | – | – |
| Staphylococcus phage TJSb8 | + | + | + | + | – | – | – | – |
| Staphylococcus phage TJSb9 | + | + | + | + | – | – | – | – |
| Staphylococcus phage TJSb10 | + | + | – | + | – | – | – | – |
“+” represents visible isolated plaques; “-” represents no visible isolated plaques.
Efficiency of plating determination (EOP)
Phages that were able to infect both S. aureus ATCC 25923 and S. aureus ATCC 6538 were further characterized as they are more interesting candidates for S. aureus phage therapy due to their specificity to S. aureus but versatility among different sub-strains. These phages were tested in an EOP assay, which is an important indicator for how efficient a phage is at infecting bacteria. As shown in Table 4, of the 8 phages tested, all phages had an EOP value above 0.001, which is the minimum requirement for a phage to be considered “efficient” at infecting bacteria. In fact, some of the phages isolated, such as TJSb2, TJSb3, TJSb6 and TJSb10, had EOP > 0.5, meeting the bar for being “highly efficient”.20 Such high efficiency is crucial for application in phage therapy, therefore TJSb3 and TJSb6 were selected for further characterization, being the top 2 EOP phages (TJSb2 was not chosen due to its turbid morphology and possibility to be a temperate phage, not ideal for phage therapy).
Table (4):
EOP of the Staphylococcus phages
Phage |
EOP |
|---|---|
Staphylococcus phage TJSb1 |
0.073 ± 0.033 |
Staphylococcus phage TJSb2 |
0.730 ± 0.157 |
Staphylococcus phage TJSb3 |
0.907 ± 0.085 |
Staphylococcus phage TJSb4 |
0.059 ± 0.003 |
Staphylococcus phage TJSb6 |
0.665 ± 0.114 |
Staphylococcus phage TJSb7 |
0.045 ± 0.038 |
Staphylococcus phage TJSb8 |
0.364 ± 0.042 |
Staphylococcus phage TJSb9 |
0.040 ± 0.021 |
Staphylococcus phage TJSb10 |
0.584 ± 0.278 |
EOP = PFU on test strain / PFU on control strain. Test strain, S. aureus ATCC 25923
Control strain, S. aureus ATCC 6538
EOP: efficiency of plating; PFU: plaque forming unit
One step growth curve
One step growth curve of TJSb3 and TJSb6 were conducted to further quantify their efficiency of infecting S. aureus. As shown in Figure 3a and 3b, the latent period of TJSb3 and TJSb6 was estimated to be about 60 and 80 minutes, respectively, and the burst size of these phages were 315 and 487 PFU (plague performing unit) per infected cell, respectively. Both phages had a long latent period which indicates that they needed more time for releasing the phage progenies after successful adsorption of phage to the host bacteria. However, both phages had high burst size. These results suggested that both phages could produce many infective phages after the latent period which in turn increased the chance for the phage to interact with host bacteria and resulting the lysis of host bacteria. This makes them ideal candidates for phage therapy.
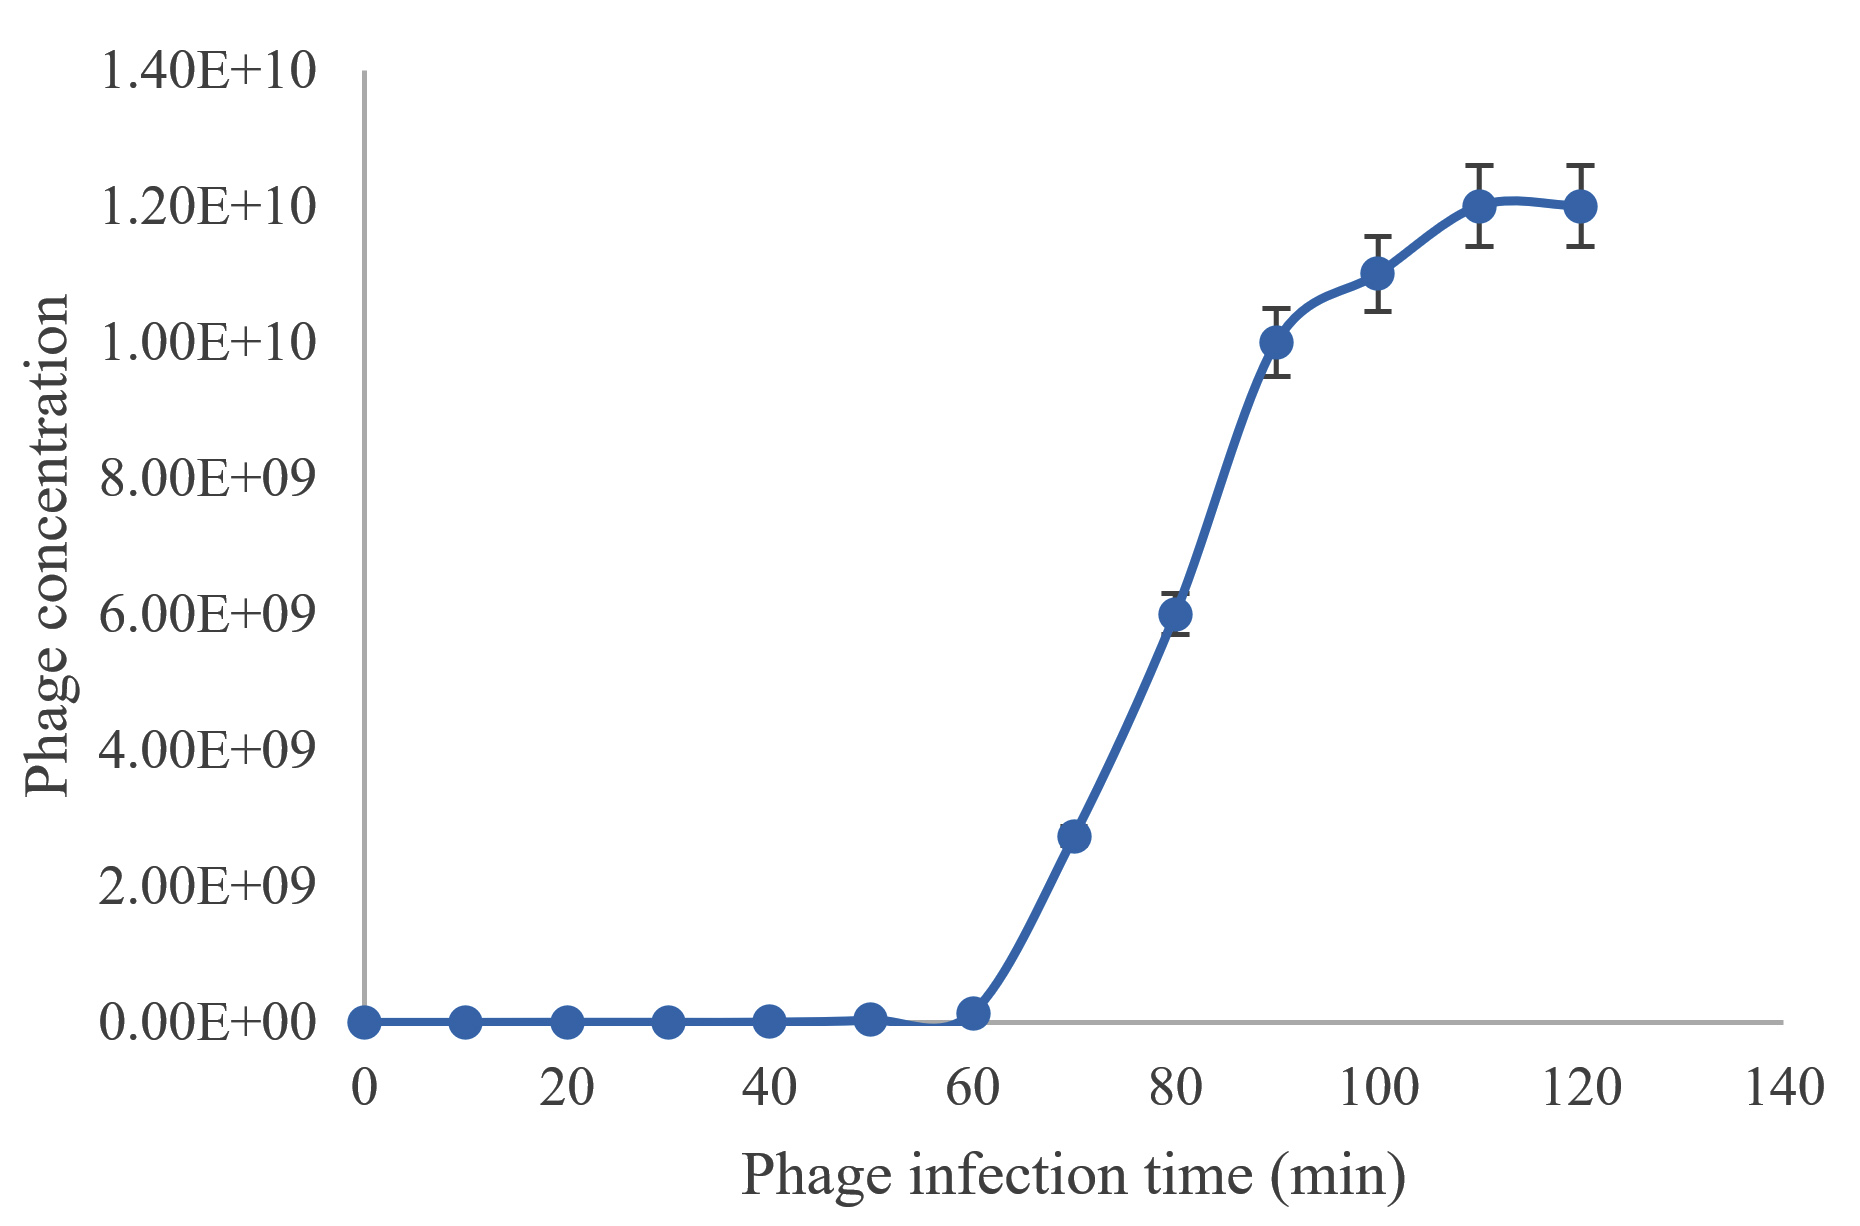
Figure 3a. Average of Staphylococcus phage TJSb3 concentration, PFU/mL with different phage infection time (min)
PFU: plaque forming unit
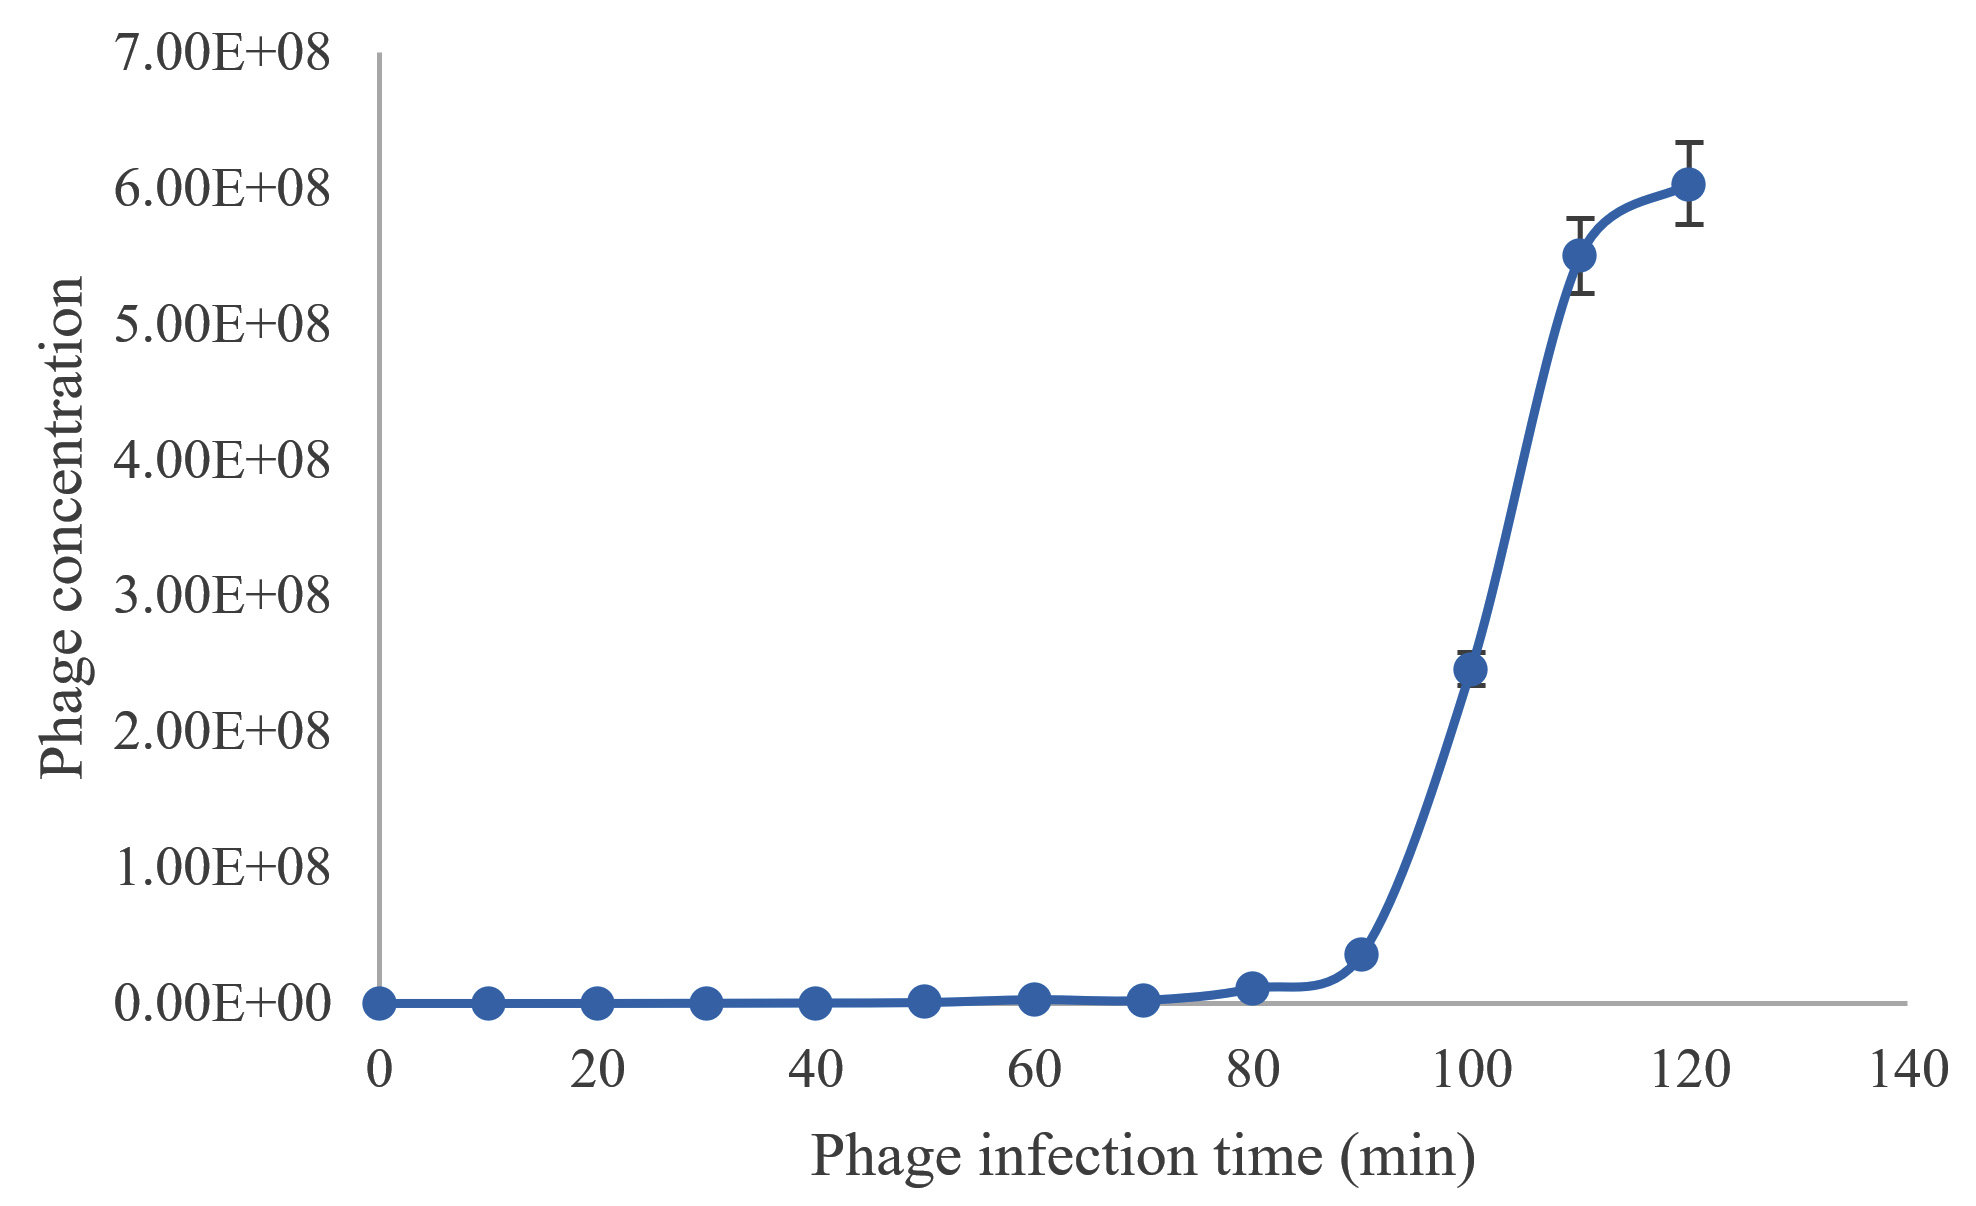
Figure 3b. Average of Staphylococcus phage TJSb6 concentration, PFU/mL with different phage infection time (min)
PFU: plaque forming unit
Phage DNA extraction
High purity genomic DNA of TJSb3 and TJSb6 were extracted next to perform restriction digestion on them to obtain information on their approximate genome size and genotypic similarities or differences between each other. In agarose gel electrophoresis shown in Figure 4a, the total genome size of TJSb3 and TJSb6 are both >10k base pairs, and also differ from each other. The digestion pattern of TJSb3 and TJSb6 both had three bands (Figure 4b). The first 2 bands had genome size between 8000 to 10000 bases, while the estimated genome size of third band was 5000 bases. This puts the genome size of both phages to be around 20-30k bases. The size of genome is uncommon in for Staphylococcus phages already reported in NCBI database, where most of them are >40 k bases (Viral Genomes (nih.gov). Similar restriction pattern suggest that TJSb3 and TJSb6 have similar genotypic characteristics. However, these 2 phages had different phenotypic characteristics such as latent period and burst size. This implies that the phages are genetically related but not identical. Whole genome sequencing of phage DNA is needed in future studies to confirm the exact percentage of genome similarity between these phages and other S. aureus phages reported in the literature.
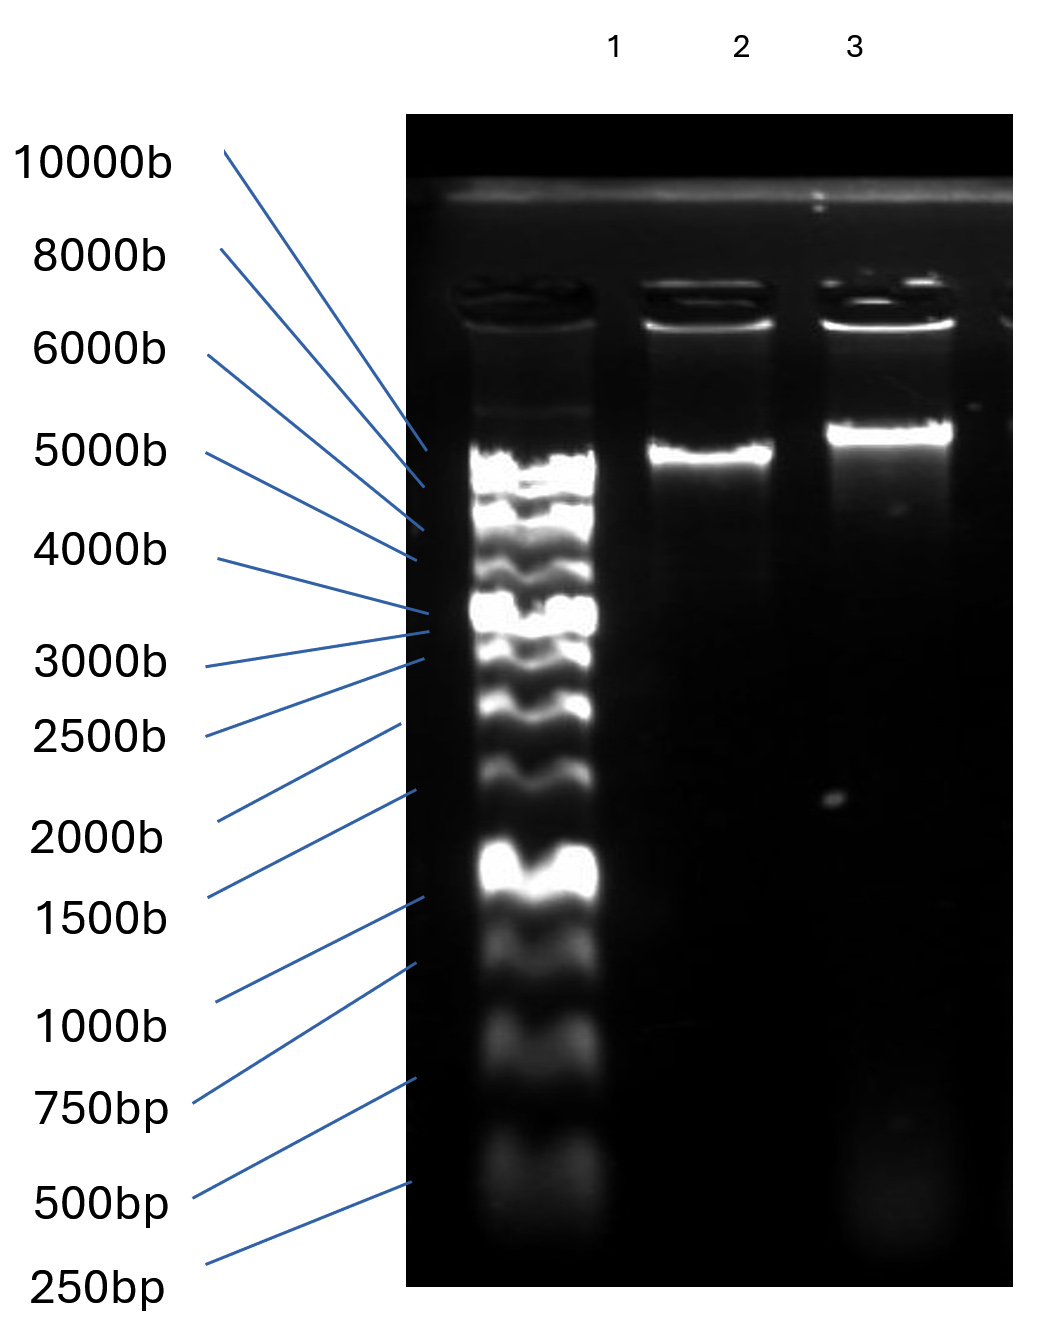
Figure 4a. Phage DNA extracted by phenol-chloroform method. Lane 1: 10 kb DNA ladder; Lane 2: Staphylococcus phage TJSb3; Lane 3: Staphylococcus phage TJSb6
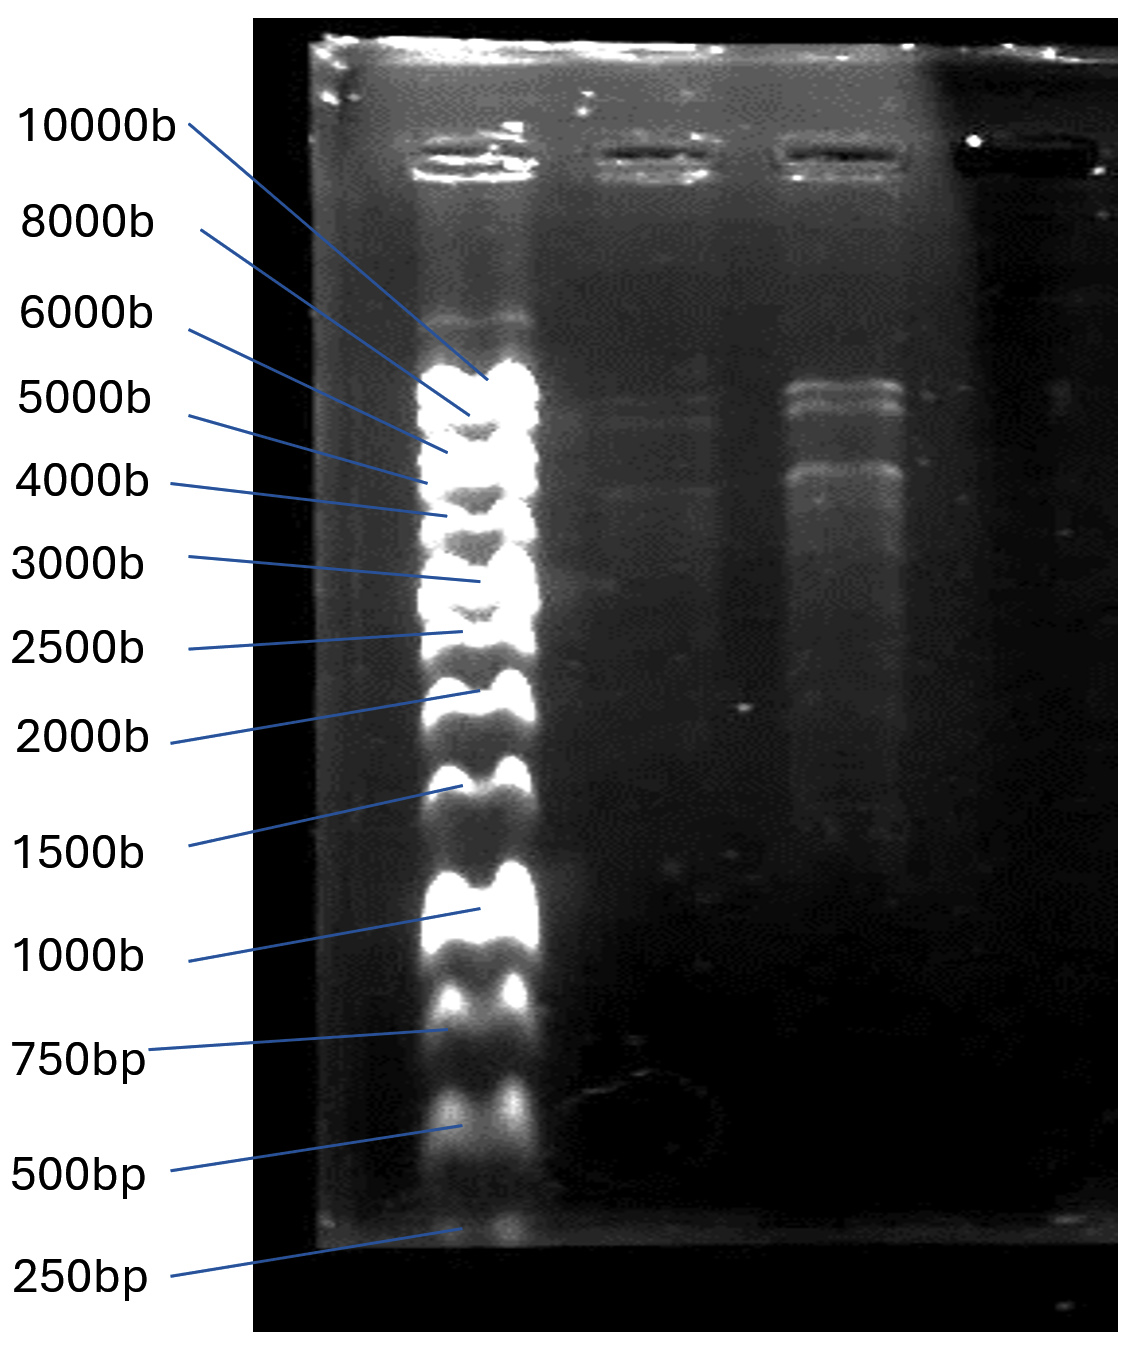
Figure 4b. Restriction digestion profile of Staphylococcus phages DNA with SacII, HindIII and NaeI. Lane 1: 10000 bp DNA ladder; Lane 2: Staphylococcus phage TJSb3; Lane 3: Staphylococcus phage TJSb6
Morphology of phage under transmission electron microscope
High quality transmission electron microscopy images were obtained for TJSb3 and TJSb6. As shown in Figures 5a and 5b, both phages were tailed bacteriophage with icosahedral head. According to ICTV classification, all tailed phages belong to the order Caudovirales.21 Hence, both phages obtained were recognised as order Caudovirales. This order of phages can be further be classified into 3 families which included Myoviridae, Siphoviridae and Podoviridae based on the length of phage tail. TJSb3 and TJSb6 were classified to be Siphoviridae due to their long tail and likely to be a l phage because they consisted of a long, flexible and non-contractile tail. The tail length of TJSb3 and TJSb6 is also observed to be different, further indicating they are related by distinct phages.
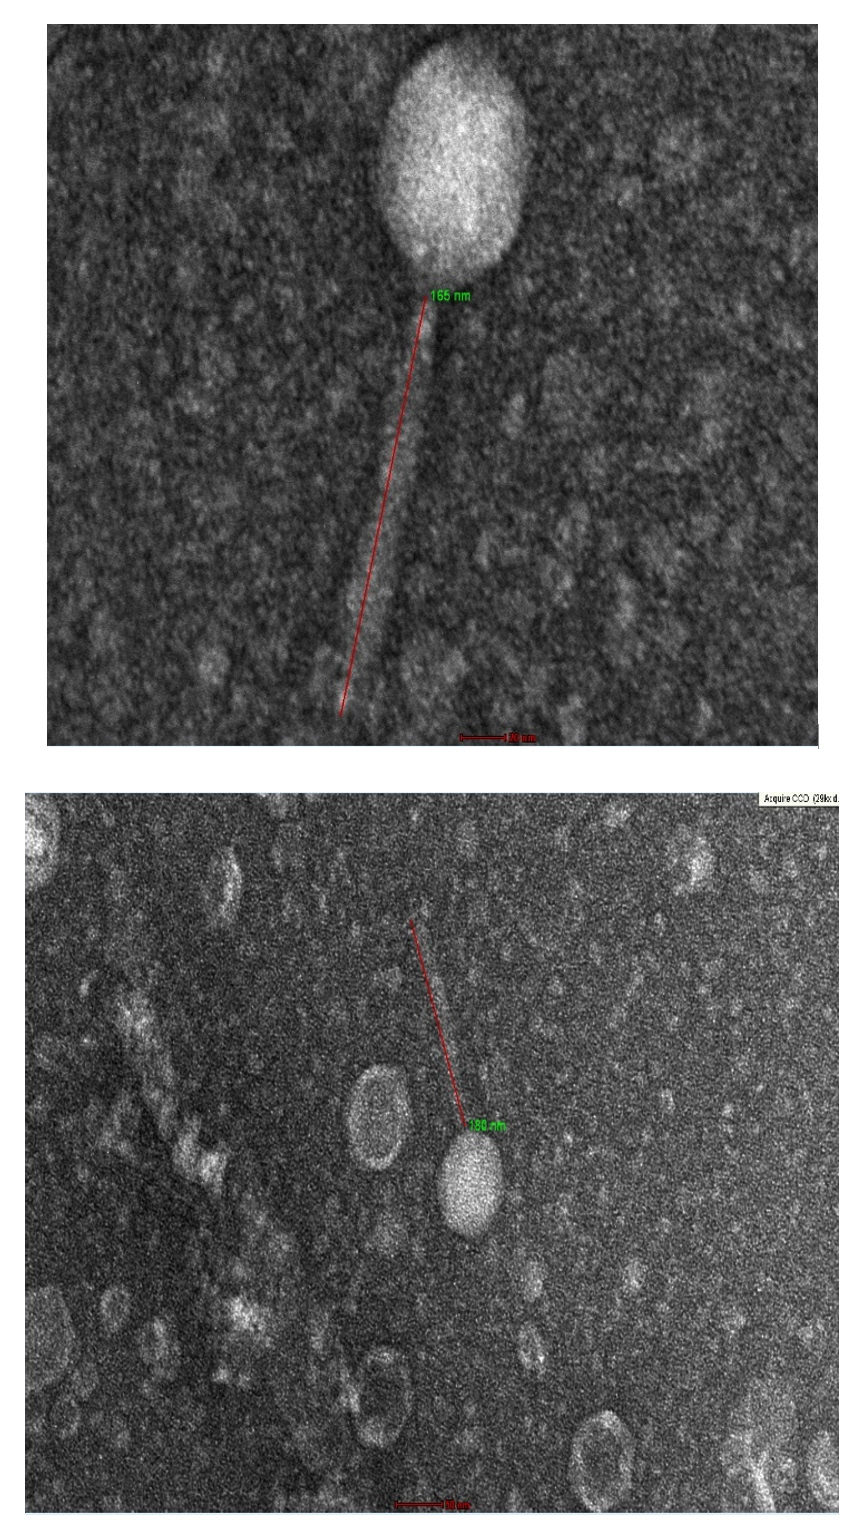
Figure 5a. Morphology of TJSb3 under transmission electron microscope
Upper: Phage virions with magnification of ׳62k
Lower: Phage virions with magnification of ׳29k
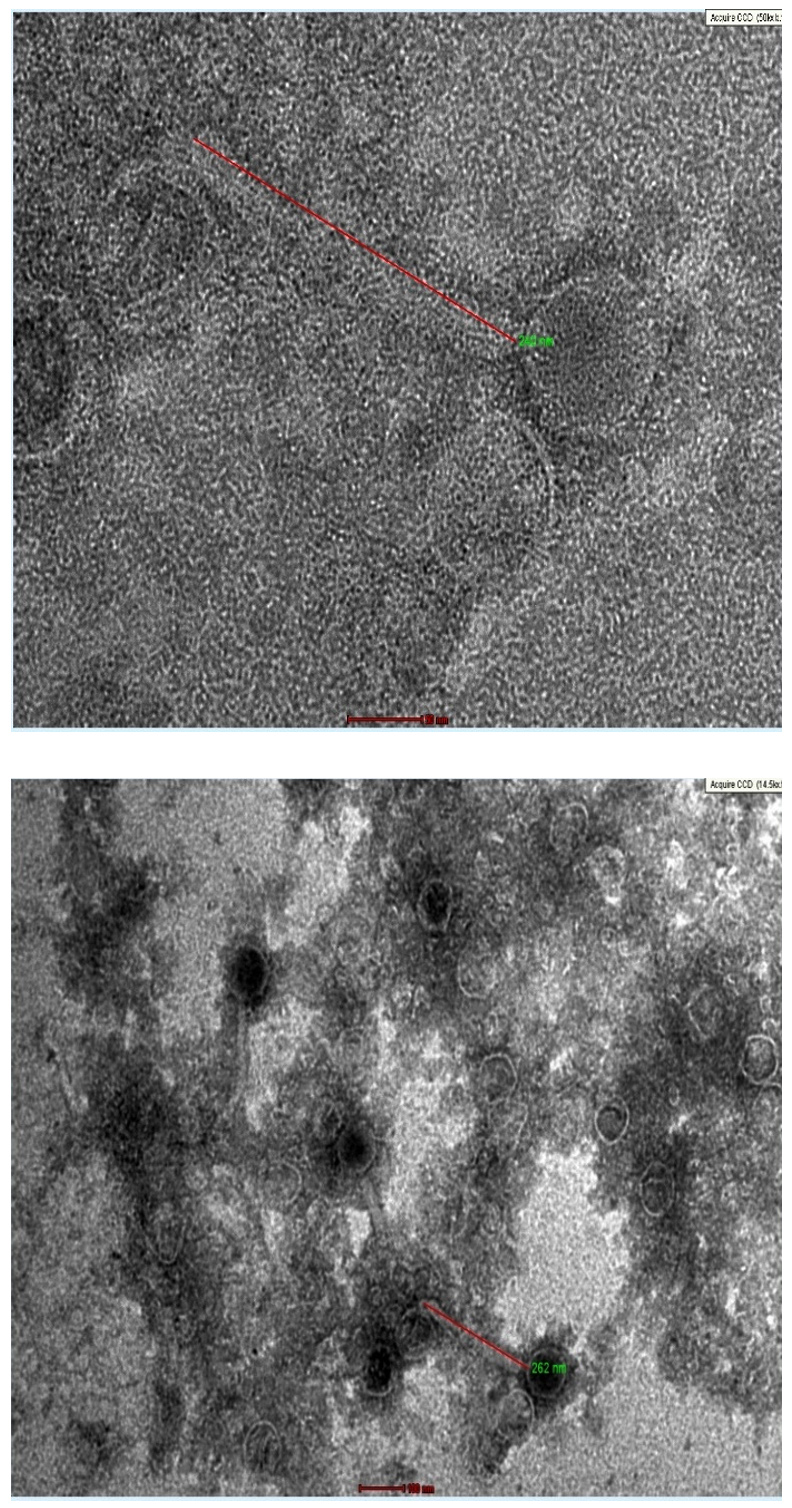
Figure 5b. Morphology TJSb6 under transmission electron microscope
Upper: Phage virions with magnification of ׳50k
Lower: Phage virions with magnification of ׳14.5k
Based on the above, TJSb3 and TJSb6 are renamed as vB_SauS_TJSb3 and vB_SauS_TJSb6 in accordance with the nomenclature system proposed by Kropinski, Prangishvili.22
S. aureus and its antibiotic resistance is a highly priority public health concern globally and isolation of bacteriophages against S. aureus is becoming increasingly valuable to build a repository of future therapeutic tools, especially to be used as candidate in ongoing animal model and clinical phage. So far, approximately 180 phages have been officially recorded in NCBI virus database, a high but not high enough number. Therefore, isolation of new bacteriophages across the world is needed imminently. Here we report the first isolation of phages against S. aureus ATCC 6538 in Malaysia.
vB_SauS_TJSb3 and vB_SauS_TJSb6 are lytic phages with high infection efficiency against at least 2 sub-strains of S. aureus but not infecting other common environmental pathogens tested, making them ideal candidates for phage therapy. Based on the study, a narrow host range of phage are desirable in phage therapy because it prevents the phage from infecting other species of bacteria in the microbiota. In addition, the phage will be more desirable if it can infect many or all strains of bacteria within the same species since identification of the specific sub-strain of bacteria will not be needed prior to phage therapy treatment. As a result, vB_SauS_TJSb3 and vB_SauS_TJSb6 are ideal candidates for therapy as they could lead to less treatment failure caused by mismatching of host and phage combination.
B_SauS_TJSb3 and vB_SauS_TJSb6 are estimated to have smaller genome than >90% of known S. aureus phages, making them potentially
interesting candidates for DNA modification and manipulation. In future studies, the whole genome of vB_SauS_TJSb3 and vB_SauS_TJSb6 will be sequenced and reported in order to identify novel viral genes, genetically modify the phages to improve host specificity and efficiency of infection and assess the evolutionary relationship between them and other S. aureus phages isolated across the globe.
Additional file: Additional Table S1-S3.
ACKNOWLEDGMENTS
The authors would like to thank the Universiti Malaysia Pahang Al-Sultan Abdullah for laboratory facilities as well as financial support under the Fundamental Research Grant RDU210338.
CONFLICT OF INTEREST
The authors declare that there is no conflict of interest.
AUTHORS’ CONTRIBUTION
All authors listed have made a substantial, direct and intellectual contribution to the work, and approved it for publication.
FUNDING
This study was supported by Universiti Malaysia Pahang Al-Sultan Abdullah under the Fundamental Research Grant RDU210338.
DATA AVAILABILITY
All datasets generated or analyzed during this study are included in the manuscript.
ETHICS STATEMENT
Not applicable.
- Taylor TA, Unakal CG. Staphylococcus aureus Infection. In: StatPearls. Treasure Island (FL): StatPearls Publishing; July 17, 2023. https://www.ncbi.nlm.nih.gov/books/NBK441868/. Accessed date 28th June 2024
- Munita JM, Arias CA. Mechanisms of antibiotic resistance. Microbiol Spectr. 2016;4(2).
Crossref - WHO bacterial priority pathogens list, 2024: Bacterial pathogens of public health importance to guide research, development and strategies to prevent and control antimicrobial resistance. World Health Organization. www.who.int. https:// www.who.int/publications/i/item/9789240093461. Accessed date 28th June 2024
- Antibacterial agents in clinical and preclinical development: an overview and analysis. (n.d.). 2023. World Health Organization www.who.int. https://www.who.int/publications/i/item/9789240094000. Accessed date 28th June 2024
- Hanlon GW. Bacteriophages: an appraisal of their role in the treatment of bacterial infections. Int J Antimicrob Agents. 2007;30(2):118-128.
Crossref - Nilsson AS. Phage therapy-constraints and possibilities. Ups J Med Sci. 2014;119(2):192-198.
Crossref - Loc-Carrillo C, Abedon ST. Pros and cons of phage therapy. Bacteriophage. 2011;1(2):111-114.
Crossref - Koskella B, Brockhurst MA. Bacteria-phage coevolution as a driver of ecological and evolutionary processes in microbial communities. FEMS Microbiol Rev. 2014;38(5):916-931.
Crossref - Schooley RT, Biswas B, Gill JJ, et al. Development and Use of Personalized Bacteriophage-Based Therapeutic Cocktails To Treat a Patient with a Disseminated Resistant Acinetobacter baumannii Infection. Antimicrob Agents Chemother. 2017;61(10):e00954-17.
Crossref - Chan BK, Turner PE, Kim S, Mojibian HR, Elefteriades JA, Narayan D. Phage treatment of an aortic graft infected with Pseudomonas aeruginosa. Evol Med Public Health. 2018;2018(1):60-66.
Crossref - Eskenazi A, Lood C, Wubbolts J, et al. Combination of pre-adapted bacteriophage therapy and antibiotics for treatment of fracture-related infection due to pandrug-resistant Klebsiella pneumoniae. Nat Commun. 2022;13(1):302.
Crossref - Petrovic FA, Lin RCY, Ho J, et al. Safety of bacteriophage therapy in severe Staphylococcus aureus infection. Nat Microbiol. 2020;5(3):465-472.
Crossref - Van TR, Kropinski AM. Bacteriophage enrichment from water and soil. Bacteriophages. 2009;501:15-21.
Crossref - Gencay YE, Birk T, Sorensen MCH, Brondsted L. Methods for isolation, purification, and propagation of bacteriophages of Campylobacter jejuni. Methods Mol Biol. 2017:1512:19-28.
Crossref - Jothikumar N, Reddy CG, Sundari, RB, et al. Isolation of coliphages specific to enterotoxigenic E. coli (ETEC). J Environ Monit. 2000;2(4):372-374.
Crossref - Yu Y-P, Gong T, Jost G, Liu W-H, Ye D-Z, Luo Z-H. Isolation and characterization of five lytic bacteriophages infecting a Vibrio strain closely related to Vibrio owensii. FEMS Microbiol Lett. 2013;348(2):112-119.
Crossref - Pickard DJJ. Preparation of bacteriophage lysates and pure DNA. Methods Mol Biol. 2009;502:3-9.
Crossref - Aghaee BL, Mirzaei MK, Alikhani MY, Mojtahedi A. Sewage and sewage-contaminated environments are the most prominent sources to isolate phages against Pseudomonas aeruginosa. BMC Microbiol. 2021;21(1):132.
Crossref - Kasman LM, Porter LD. Bacteriophages. National Library of Medicine. 2022. https://www.ncbi.nlm.nih.gov/books/NBK493185/
- Viazis S, Akhtar M, Feirtag J, Brabban AD, Diez-Gonzalez F. Isolation and characterization of lytic bacteriophages against enterohaemorrhagic Escherichia coli. J Appl Microbiol. 2011;110(5):1323-1331.
Crossref - Ackermann HW. Phage classification and characterization. Methods Mol Biol. 2009;501:127-140.
Crossref - Kropinski AM, Prangishvili D, Lavigne R. Position paper: the creation of a rational scheme for the nomenclature of viruses of Bacteria and Archaea. Environ Microbiol. 2009;11(11):2775-2777.
Crossref
© The Author(s) 2024. Open Access. This article is distributed under the terms of the Creative Commons Attribution 4.0 International License which permits unrestricted use, sharing, distribution, and reproduction in any medium, provided you give appropriate credit to the original author(s) and the source, provide a link to the Creative Commons license, and indicate if changes were made.