


ISSN: 0973-7510
E-ISSN: 2581-690X
A rise in methicillin-resistant S. aureus (MRSA) infections in hospitals and the population has led to an increase in Macrolide–Lincosamide–Streptogramin type B (MLSB) antibiotic resistance. This has led to increased treatment costs, length of hospital stay and morbidity, as therapy has grown increasingly challenging. As a result, it is imperative that S. aureus isolates and their susceptibility patterns especially to clindamycin and erythromycin, be accurately identified and reported. Of the 341 (100%) S. aureus strains that were recovered from various clinical samples, such as blood, pus, urine, and sputum, 267 (78.6%) were MSSA (methicillin-sensitive S. aureus) and 74 (21.4%) were MRSA. iMLSB (inducible MLSB) resistance detected by D-test was present in 42 (12.3%) isolates, out of which 23 (15.6%) were MSSA and 19 (33.9%) were MRSA. Real-time PCR was done for gene detection on all iMLSB positive isolates. The majority of the isolates – 22 (52.4%) showed both ermA and ermC genes; out of which 13 (56.5%) were MSSA, whereas 9 (47.4%) were MRSA. To correctly identify the true phenotypes sensitive to clindamycin and those showing iMLSB resistance, a reasonably priced, D-test (double disc diffusion test) can be included in routine antibiotic susceptibility testing in clinical settings for all erythromycin-resistant staphylococcal isolates. By following this technique, clinicians treating patients with infections brought on by inducible clindamycin-resistant strains will be guided to forego clindamycin from their treatment regimens, helping to prevent therapeutic failures.
D-test, Staphylococcus aureus, Inducible Clindamycin Resistance, erm Genes, iMLSB, ermA, ermC, PCR
Since the emergence of MRSA, there have been few therapeutic options for treating staphylococcal infections. Among the antibiotics in the macrolide-lincosamide-streptogramin B (MLSB) family is one such substitute, clindamycin which is most commonly used, because of its superior pharmacokinetic properties.1 It can be used as a substitute antibiotic for those allergic to penicillin and as a follow-up treatment following intravenous therapy because of its potent oral absorption,2 and to treat outpatients. It also accumulates in abscesses and does not require dosage modifications even in cases of renal impairment.3
The acquirement of erythromycin resistance methylase (erm) genes, encoding enzymes that methylate the 23S rRNA, is the most common cause of resistance to MLSB antibiotics.4,5 Three methylase genes are present in staphylococci: ermA, ermB, and ermC. ermA gene expression is induced by erythromycin, whereas ermB and ermC are either constitutive or inducible.6 Antibiotic-resistant S. aureus strains with erm genes exhibit cross-resistance to MLSB antibiotics. The msrA gene codes for the efflux mechanism, which is the other mechanism that causes the MS phenotype.
A decline in the drug’s efficacy could be caused by inducible clindamycin resistance. The modern necessity for directing treatment is the in vitro identification of macrolide resistance and accurate susceptibility test interpretation.7 In this study, the D-test was performed to asses the resistance patterns of erythromycin and clindamycin. The erm gene that induced inducible clindamycin resistance was found using polymerase chain reaction (PCR). Understanding a pathogen’s precise antibiotic susceptibility pattern is essential for making informed therapeutic decisions. Therefore, while using clindamycin to treat staphylococcal infections, figuring out the fundamental processes that result in MLSB antibiotic resistance is crucial.
Aims and objectives
To identify using the D-test, the proportion of S. aureus isolates with inducible clindamycin resistance and identify the resistant genes among them by molecular methods.
A descriptive study was conducted in the Microbiology department of a tertiary care centre in South Kerala. Over the course of a year, 341 non-duplicate isolates of S. aureus were obtained from a variety of clinical samples obtained from IPD and OPD patients. Excluded from the study were clinical isolates from individuals receiving clindamycin treatment already. The organism was identified using colony characteristics, golden yellow β-hemolytic colonies on blood agar (Figure 1), Gram staining, catalase test, coagulase test (Figure 2), standard biochemical reactions, and the VITEK 2 automated system. The Kirby Bauer disc diffusion method was utilized to perform and evaluate the antibiotic susceptibility testing, adhering to the CLSI guidelines 2020. Isolates of MRSA were identified using the cefoxitin disc diffusion method on Mueller-Hinton agar.

Figure 1. Blood agar with β-hemolytic colonies of S. aureus
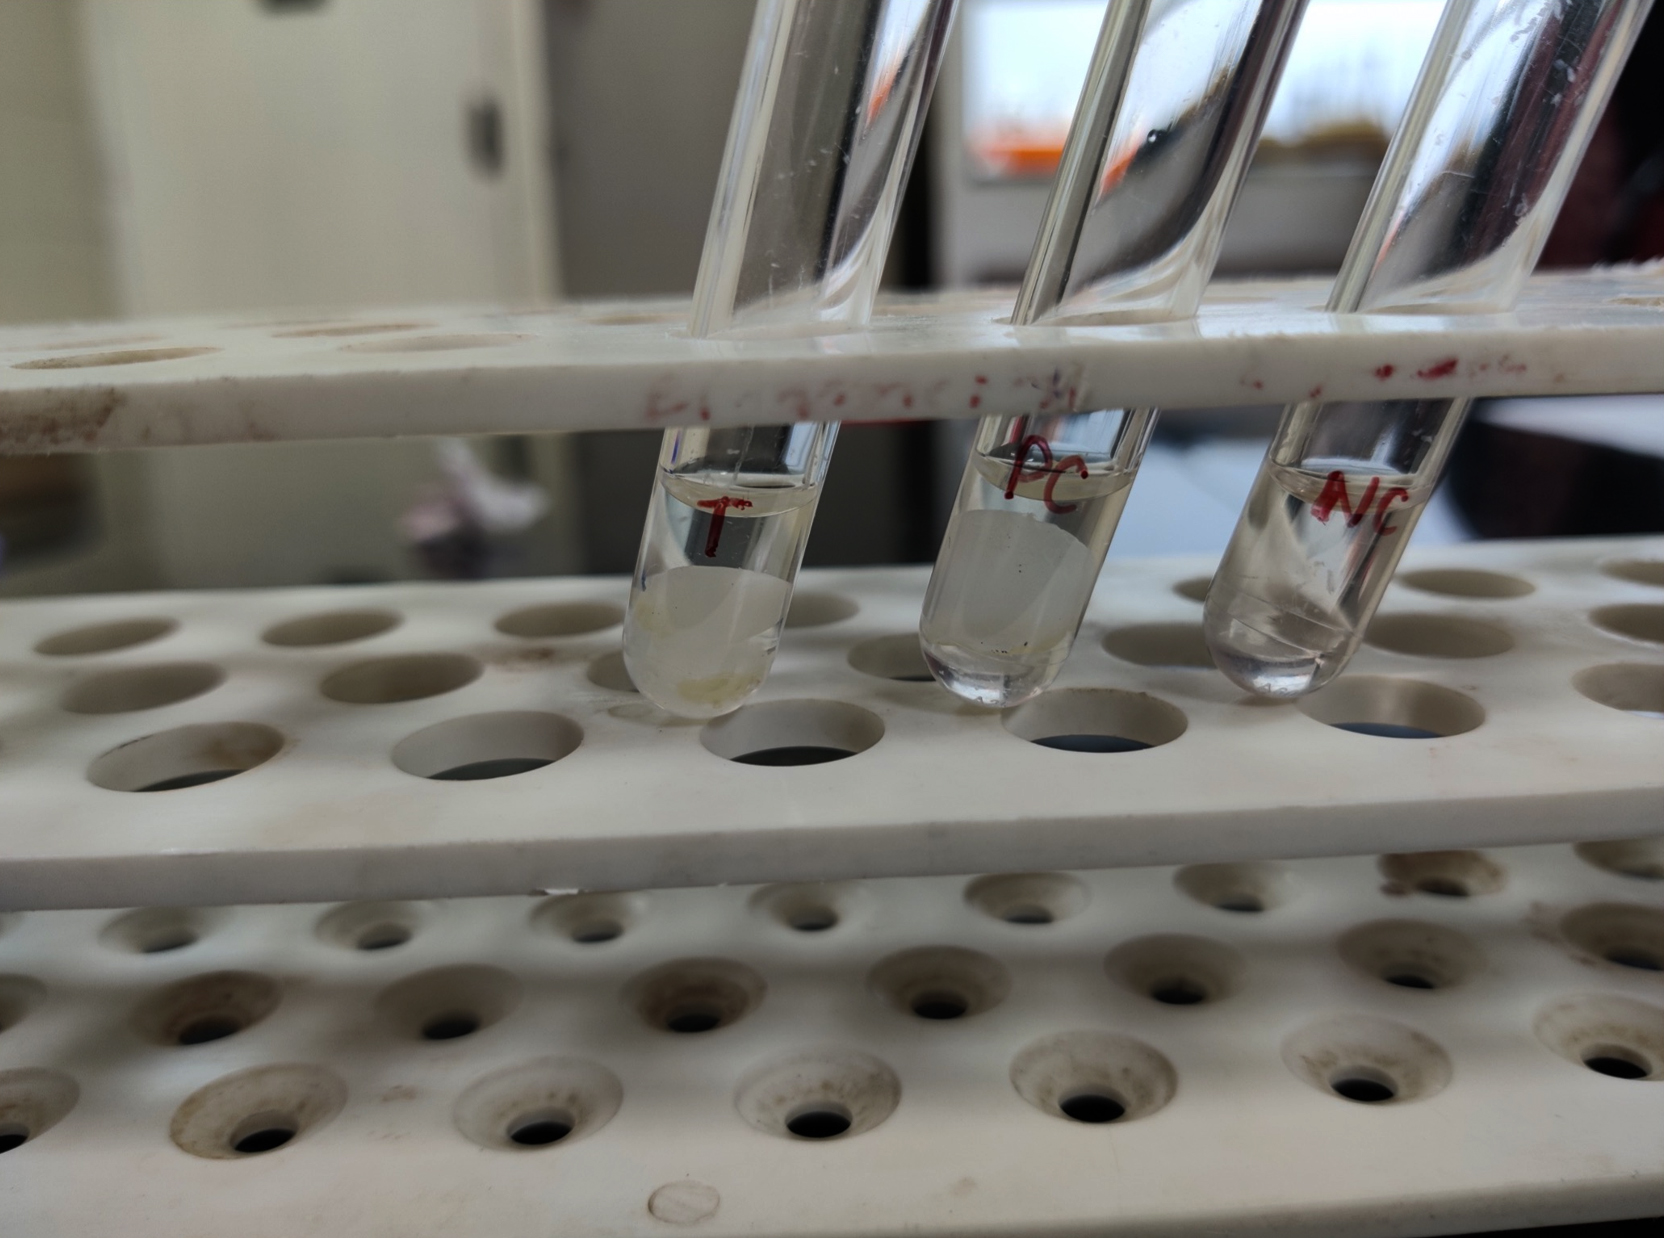
Figure 2. Tube coagulase test
Disc diffusion test (D-zone test) for the detection of inducible clindamycin resistance
In addition to routine antibiotic susceptibility testing, on a Mueller-Hinton Agar plate, bacterial suspension of S. aureus with a turbidity of 0.5 McFarland was inoculated. Erythromycin (15 µg) disc was kept 15-26 mm apart from clindamycin (2 µg) disk and incubated for 16-18 hours at 35 °C+/-2 °C (ambient air), along with quality control strain S. aureus ATCC 25923. Flattening of the zone of inhibition near the erythromycin disc (D-zone), indicated the presence of inducible clindamycin resistance (iMLSB) (Figure 3). Clindamycin resistance was also indicated by hazy growth within the zone of inhibition around the antibiotic, even in the absence of a distinct D-zone.8
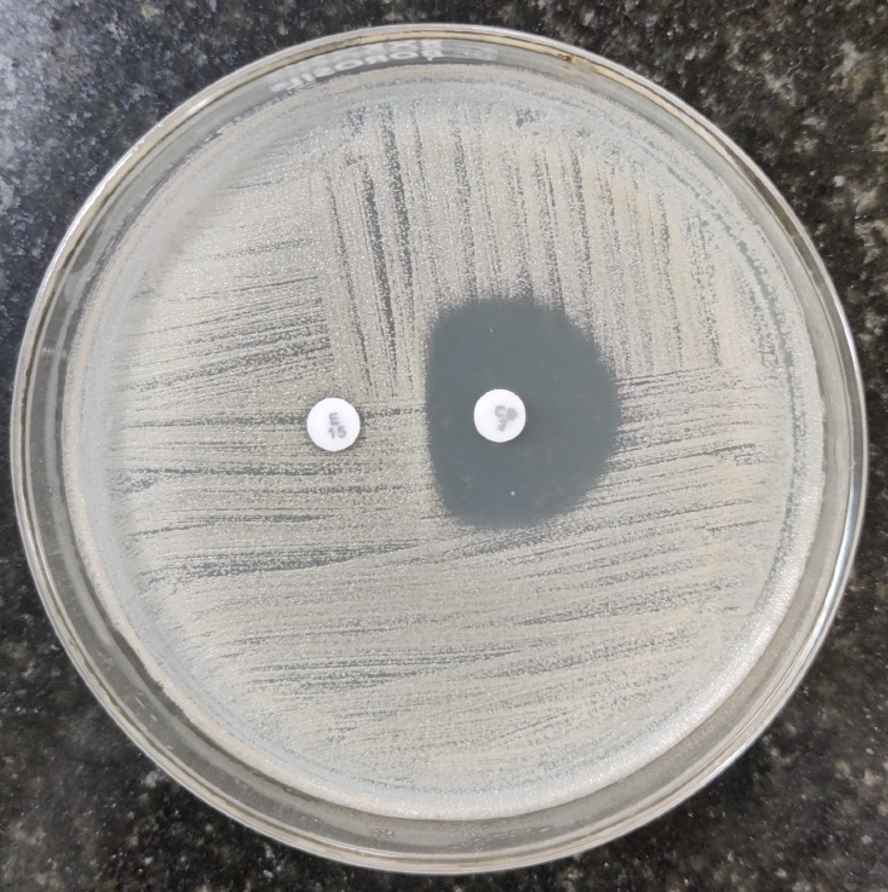
Figure 3. D zone (Inducible Clindamycin resistance)
Interpretation of Erythromycin resistant phenotypes
Isolates classified as MS phenotypes were those that were clindamycin sensitive (≥21 mm) and erythromycin resistant (≤13 mm). Both erythromycin (≤13 mm) and clindamycin (≤14 mm) resistant isolates were interpreted as constitutive MLSB (cMLSB) phenotypes. Inducible MLSB (iMLSB) phenotypes were identified in erythromycin-resistant and clindamycin-sensitive isolates (exhibiting a D-shaped inhibitory zone surrounding clindamycin that flattened towards erythromycin disc).8
Real-time PCR
Next, using the HELINI Antibiotic Resistance gene Real-time PCR kit, the ermA/ermC genes of S. aureus isolates showing iMLSB resistance were analysed. All procedures were performed in accordance with universal safety precautions in a biosafety cabinet (level 2). Using the HELINI Purefast® Bacterial DNA mini spin prep kit, genomic DNA was recovered from S. aureus isolates. Until it was utilized for PCR, the isolated DNA was kept at -20 °C. Helini Biomolecules designed the primer sequences that were used for the amplification of the ermA and ermC genes for identification (Table 1). The ermA/C primer and probe mix consisted of forward and reverse primers and the TaqMan probe which was fluorescently labelled with fluorescein amidite (FAM) (Table 2).
Table (1):
ermA and ermC primers and probes
Primer |
Probe |
|
|---|---|---|
ermA |
5‘-TCAGGAAAAGGACATTTTACC-3‘ |
5‘-GAGCTTTGGGTTTACTATTAATGG-3‘ |
ermC |
5‘-CTTGTTGATCACGATAATTTCC-3‘ |
5‘-CATAAGTACGGATATAATACGCA-3‘ |
Table (2):
erm gene detection mix for samples
Components |
ermA |
ermC |
|---|---|---|
Probe PCR Master mix |
10 µl |
10 µl |
ermA primer probe mix |
2.5 µl |
– |
IC primer probe mix |
2.5 µl |
– |
ermC primer probe mix |
– |
2.5 µl |
PCR grade water |
– |
2.5 µl |
Purified DNA |
10 µl |
10 µl |
Final reaction volume |
25 µl |
25 µl |
After addition of all the reagents, the PCR tubes were centrifuged to remove any air bubbles that could interfere with fluorescence detection, following which they were placed in the thermocycler (QuantStudio™ 5 Real-Time PCR System) and the PCR run was started. The procedure comprised an initial activation of the Taq enzyme at 95°C for 15 minutes, followed by 40 cycles of denaturation, annealing, and extension (20 seconds at 95 °C, 20 seconds at 60 °C, and 20 seconds at 72 °C, respectively). The qualitative interpretation of results were done as per manufacturer’s instructions (Table 3 and Figures 4, 5 and 6).
Table (3):
Qualitative interpretation of results
Test sample |
Negative control |
Internal control |
Positive control |
Interpretation |
|---|---|---|---|---|
Positive |
Negative |
Positive |
Positive |
Positive (ermA/C specific DNA detected) |
Negative |
Negative |
Positive |
Positive |
Negative (No ermA/C specific DNA detected). Undetectable amounts of ermA/C specific DNA in a sample |
Negative |
Negative |
Negative |
Negative |
Repeat (Experiment fail) |
Positive |
Positive |
Positive |
Positive |
Repeat (Experiment fail) |
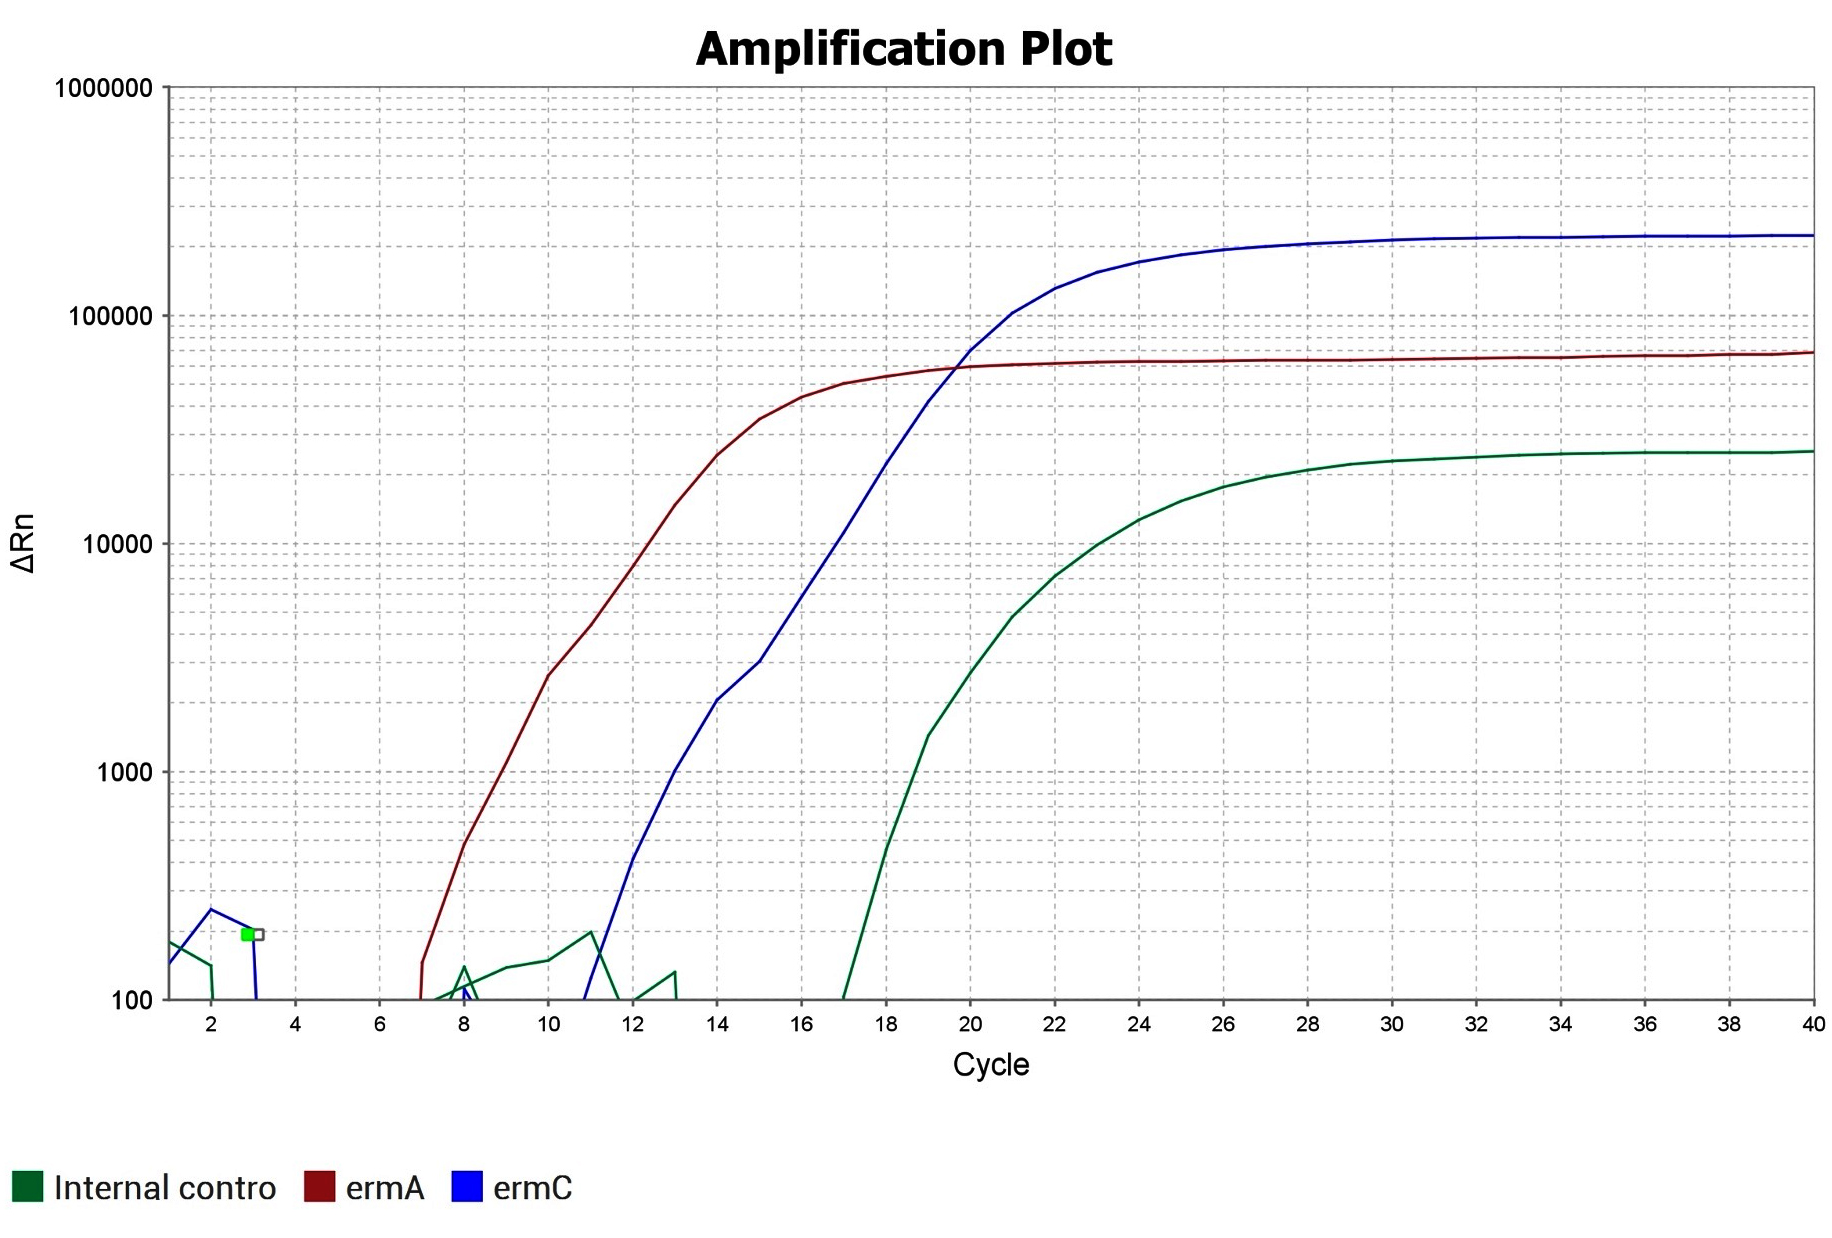
Figure 4. Amplification plots ermA and ermC
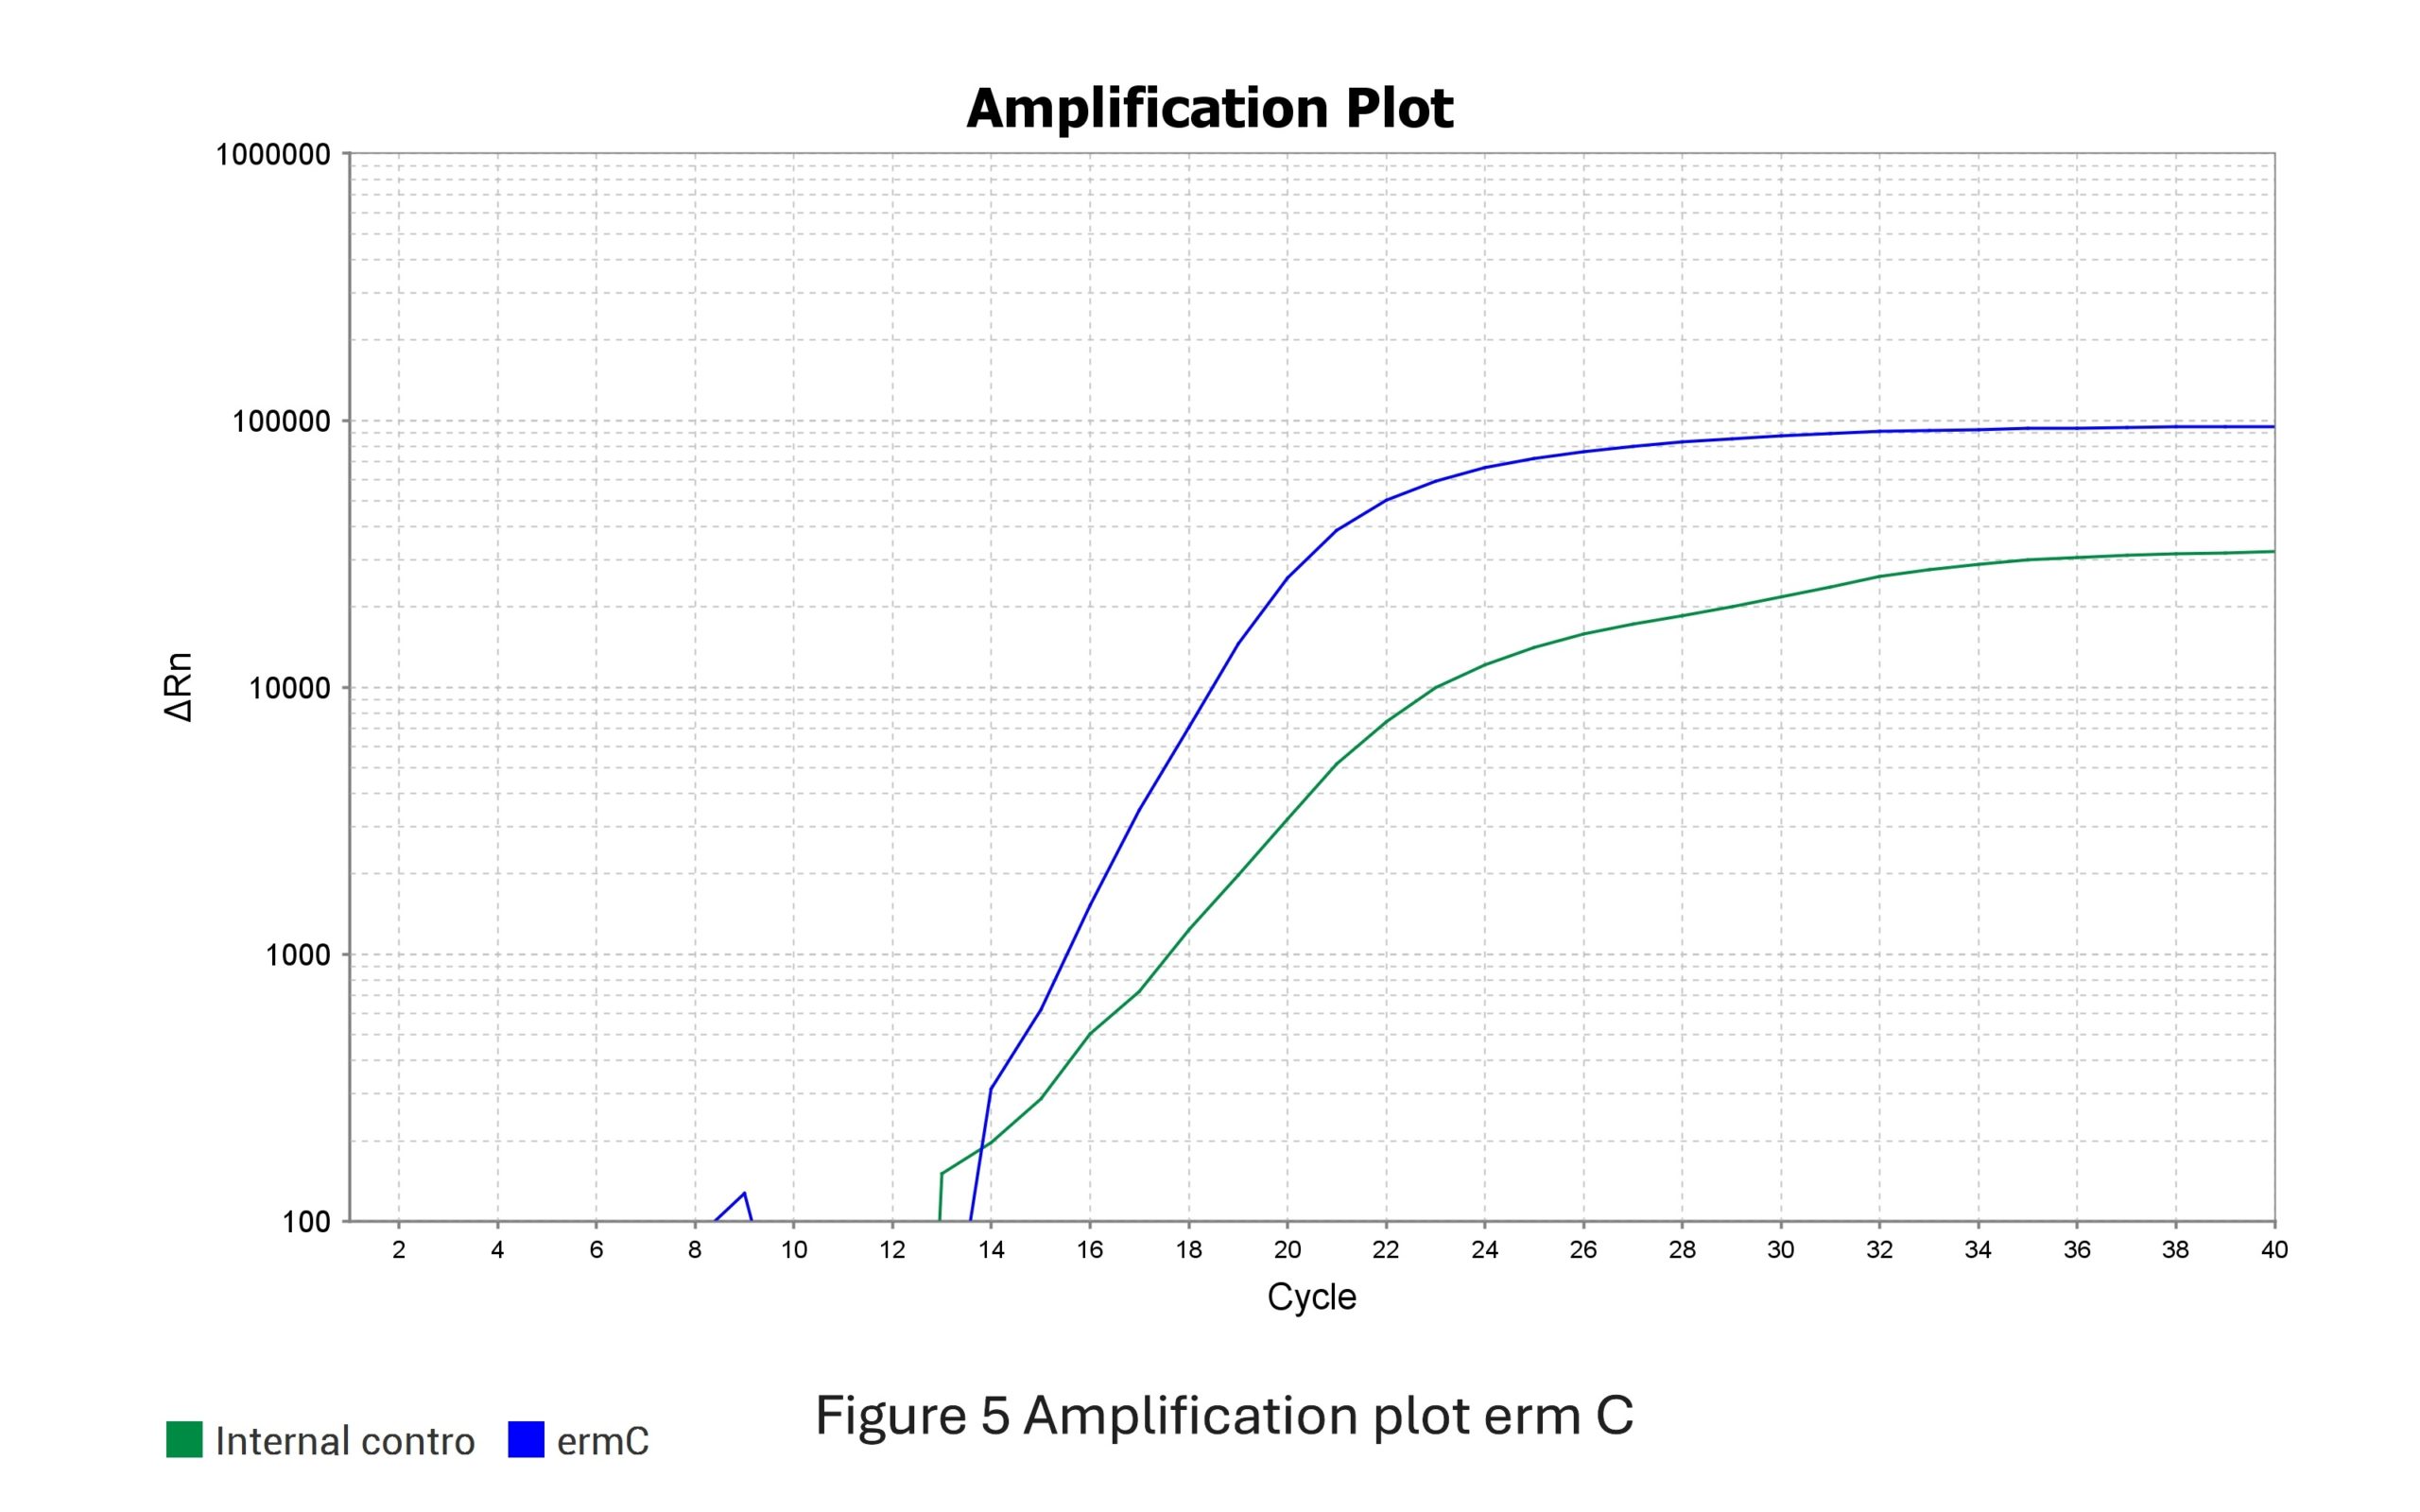
Figure 5. Amplification plot ermC
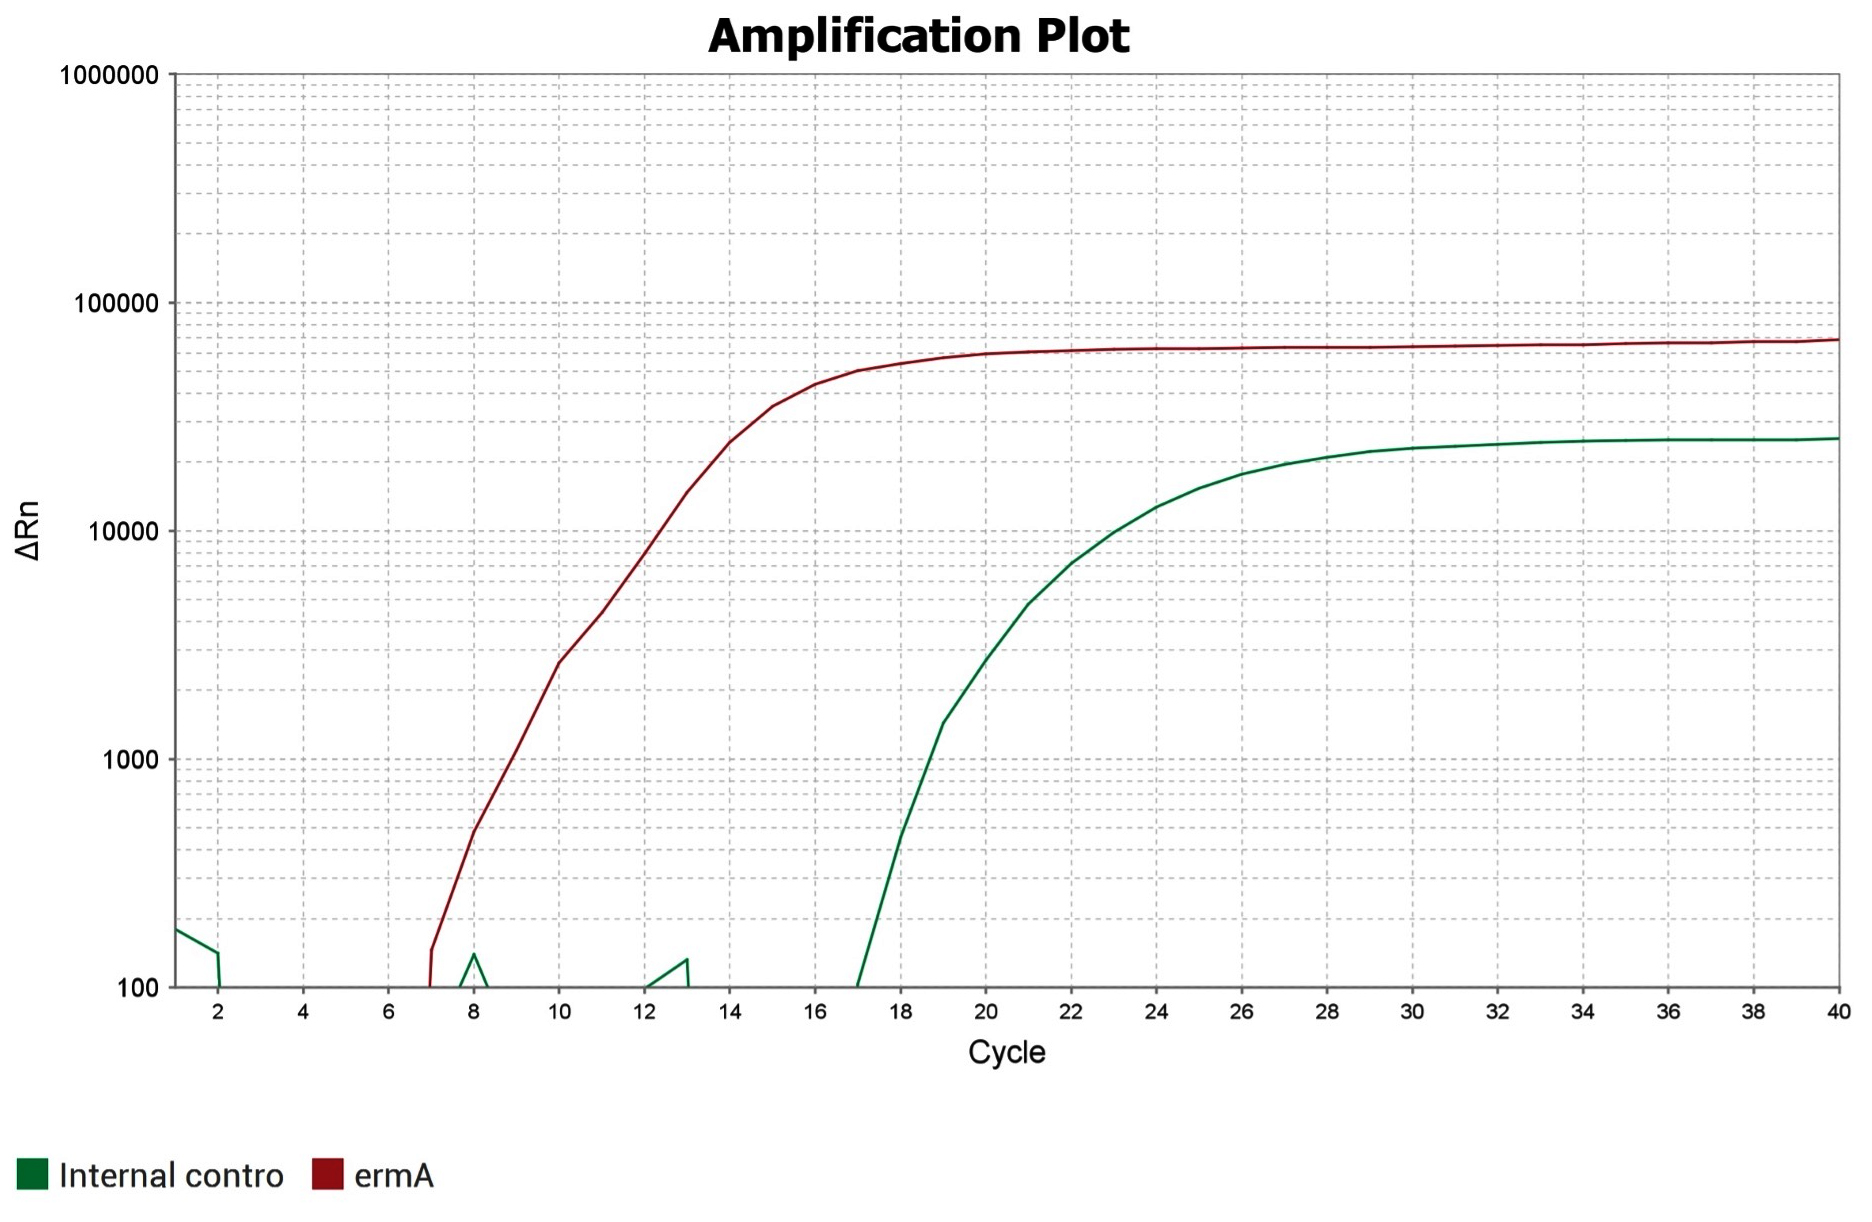
Figure 6. Amplification plot ermA
In a total of 341 (100%) S. aureus strains isolated from various clinical samples, 267 (78.6%)were MSSA and 74 (21.4%) were MRSA (Figure 7).
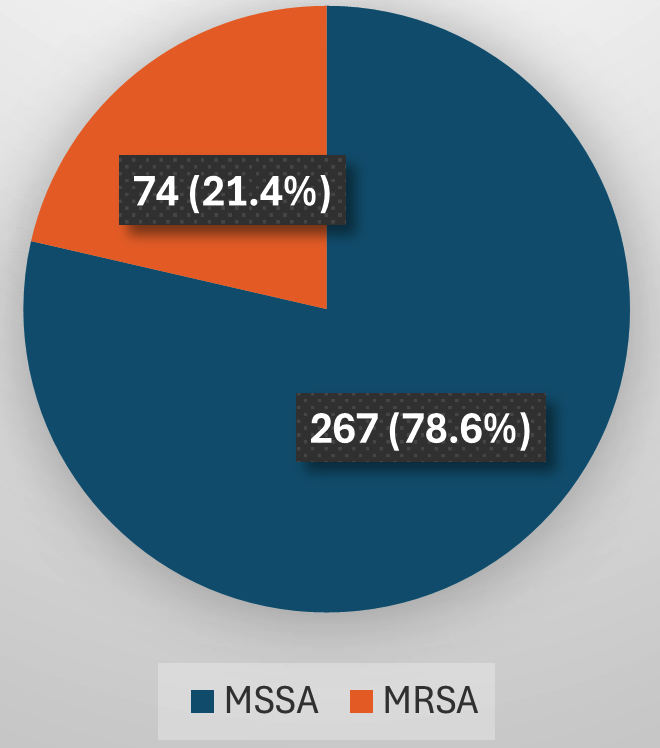
Figure 7. Distribution of S. aureus based on methicillin sensitivity
Of the 341 total S. aureus isolates, 203 (59.5%) were erythromycin-resistant. The D-test was performed for erythromycin-resistant and clindamycin-sensitive isolates. A total of 42 (12.3%) isolates tested positive for iMLSB resistance by D-test (Table 4). Out of the 42 inducible clindamycin resistant strains (D-test positive), 23 (15.6%) were MSSA, and 19 (33.9%) were MRSA. P-value was calculated by chi-square test with df -1, the p-value was 0.004 and therefore considered statistically significant (Table 5).
Table (4):
iMLSB, cMLSB and MS phenotypes in isolates of S. aureus resistant to erythromycin
Pattern of resistance |
Frequency |
Percentage |
|---|---|---|
Inducible clindamycin Resistance (D-test positive) |
42 |
12.3 |
Constitutive clindamycin resistance |
73 |
21.4 |
MS Phenotype |
88 |
25.8 |
Table (5):
Distribution of iMLSB among MRSA and MSSA resistant to erythromycin
| Inducible Clindamycin Resistance (D-test positive) | Methicillin sensitivity | Total | Chi-square value | p-value | |
|---|---|---|---|---|---|
| MSSA | MRSA | ||||
| Present | 23 (15.6%) | 19 (33.9%) | 42 (20.7%) | 8.260 | 0.004 |
| Absent | 124 (84.4%) | 37 (65.1%) | 161 (79.3%) | ||
| Total | 147 (100%) | 56 (100%) | 203 (100%) | ||
Real-time PCR was used to detect the erm gene in all staphylococcal D-test positive iMLSB phenotypes, and majority of the isolates [22 (52.4%)], had both ermA and ermC genes (Table 6).
Table (6):
Distribution of erm genes among MSSA and MRSA strains showing iMLSB phenotype
| PCR gene | Methicillin sensitivity | Total | Chi-square value | p-value | |
|---|---|---|---|---|---|
| MSSA | MRSA | ||||
| ermA gene | 3 (13.0%) | 2 (10.5%) | 5 (11.9%) | 3.268 | 0.352 |
| ermC gene | 5 (21.7%) | 8 (42.1%) | 13 (31.0%) | ||
| Both ermA and ermC gene | 13 (56.5%) | 9 (47.4%) | 22 (52.4%) | ||
| Others | 2 (8.7%) | 0 (0.0%) | 2 (4.8%) | ||
| Total | 23 (100%) | 19 (100%) | 42 (100%) | ||
Despite the availability of multiple potent anti-staphylococcal drugs, S. aureus, has proved its adaptability by being a major cause of illness and death. In hospitals as well as communities, this pluripotent pathogen induces disease by toxin- and non-toxin-mediated routes, ranging from catastrophic systemic infections to comparatively mild infections of the skin and soft tissues.9 MRSA prevalence has become progressively global,7 due to which therapy has become problematic due to their multidrug-resistant nature. As a result, prevention of infection by staphylococci is more vital than ever.10 Thus, specialized surveillance systems are required to track and stop the spread of MRSA infections within the community.11
Clindamycin has strong in vitro and in vivo activity, which makes it an excellent alternative for treating MRSA infections,12 however, because of an inducible mechanism of resistance, it becomes resistant in the presence of erythromycin due to cross-resistance among members of the MLSB families. Inducible resistance to clindamycin hampers its effectiveness. To demonstrate such inducible resistance (iMLSB phenotype), the D-test or double disc diffusion agar inhibitory assay is employed.13
In the present study, a total of 42 (12.3%) isolates were tested positive for iMLSB resistance by D-test. Our observation regarding iMLSB was in concordance with the report by Pal et al. and Mokta et al. Some investigators reported a higher incidence of iMLSB resistance, compared to our study (Table 7). The incidence of iMLSB was higher among MRSA [19(33.9%)] in our study, which was in concordance with all the other studies. Sasirekha et al. reported a lower incidence of iMLSB among MRSA strains (Table 8).
Table (7):
S. aureus MLSB phenotypes compared with those from other studies
Phenotypes |
Fiebelkorn K.R. et al.2 Texas, 2003 (n = 114) |
Gadepalli R. et al.14 India, 2006 (n = 200) |
Yilmaz G. et al.1 Turkey, 2007 (n = 883) |
Gupta V. et al.16 Chandigarh, India, 2009 (n = 200) |
N. Pal et al.17 Jaipur, India, 2010 (n = 851) |
Mokta et al.18 Shimla, India 2015, (n = 350) |
Present study (n = 341) |
|---|---|---|---|---|---|---|---|
iMLSB |
34 (29.8%) |
42 (21%) |
175 (19.81%) |
36 (18%) |
101 (11.8%) |
48 (13.71%) |
42 (12.3%) |
cMLSB |
39 (34.2%) |
53 (26.5%) |
224 (25.36%) |
38 (19%) |
202 (23.7%) |
60 (17.14%) |
73 (21.4%) |
MS phenotype |
41 (35.9%) |
24 (12%) |
39 (4.41%) |
64 (32%) |
127 (14.9%) |
29 (8.28%) |
88 (25.8%) |
Table (8):
Comparing the MLSB phenotypes of MRSA and MSSA with those from other studies
| Author’s name | MSSA | MRSA | ||||
|---|---|---|---|---|---|---|
| iMLSB | cMLSB | MS Phenotype | iMLSB | cMLSB | MS Phenotype | |
| Yilmaz et al.15 Turkey, 2007 (n = 883) | 62 (14.8%) | 19 (4.5%) | 15 (3.6%) | 113 (24.4%) | 205 (44.2%) | 24 (5.2%) |
| Gupta et al.16 Chandigarh, India, 2009 (n = 200) | 26 (17.3%) | 15 (10%) | 56 (37.3%) | 10 (20%) | 23 (46%) | 8 (16%) |
| Deotale et al.1 Wardha, India, 2010 (n = 247) | 2 (1.6%) | 0 (0%) | 5 (4.0%) | 34 (27.6%) | 9 (7.3%) | 30 (24.3%) |
| Debdas et al.19 Assam,India, 2011 (n = 379) | 5 (2%) | 8 (3%) | 45 (16%) | 18 (18%) | 23 (23%) | 47 (48%) |
| Mittal et al.20 Lucknow, India, 2012 (n = 260) | 13 (8.4%) | 7 (4.5%) | 25 (16.1%) | 47 (44.8%) | 9 (8.6%) | 14 (13.3%) |
| Sasirekha et al.21 Bangalore, India, 2013 (n = 153) | 13 (8.49%) | 12 (7.84%) | 20 (13.07%) | 1 (0.65%) | 8 (5.22%) | 9 (5.88%) |
| Lall et al.22 Delhi, India, 2014 (n = 305) | 10 (6%) | 8 (4.8%) | 52 (31.5%) | 52 (37.1%) | 23 (16.6%) | 32 (22.8%) |
| Mokta et al.18 Shimla,India, 2015 (n = 350) | 25 (9.32%) | 36 (13.43%) | 18 (6.71%) | 23 (28.04%) | 24 (29.26%) | 11 (13.41%) |
| Chatterjee et al.23 India, 2018 (n = 197) | 16 (12%) | 7 (6%) | 0 | 18 (22.5%) | 36 (45%) | 2 (2.5%) |
| Present study (n = 341) | 23 (15.6%) | 55 (37.4%) | 69 (46.9%) | 19 (33.9%) | 18 (32.1%) | 19 (33.9%) |
In this study, real-time PCR was done on 42 iMLSB positive isolates and majority-22 isolates (52.4%), had both ermA and ermC genes, followed by 13 (31%) isolates that showed only the ermC gene and 5 (11.9%) isolates that showed only the ermA gene. Among 22 isolates that showed both ermA and ermC genes, 13 (56.5%) were MSSA, and 9 (47.4%) were MRSA. Out of the 13 isolates that showed only the ermC gene, 5 (21.7%) were MSSA, and 8 (42.1%) were MRSA. Out of the 5 isolates that showed only the ermA gene, 3 (13%) were MSSA, and 2 (10.5%) were MRSA. In 2 MSSA isolates, neither the ermA nor the ermC genes could be detected, and these isolates could posses the ermB or msrA gene.
In a study done by Fiebelkorn et al., in Texas, genetic analysis of 19 samples of S. aureus with iMLSB revealed the ermA gene in 18 samples, while the remaining one contained the ermC gene.3 Another study by Matthew et al., in Australia reported that among 28 iMLSB isolates genotyped, 8 had ermA and the rest had ermC.6 Both these studies showed that the predominant genes were ermA and ermC and this was in concordance with our study.
Because of the evolution of antimicrobial resistance, precise drug susceptibility data is the need of the hour for appropriate therapeutic decisions. The results of this study indicate that all clinical laboratories should routinely subject staphylococcal isolates displaying both clindamycin-susceptible and erythromycin-resistant patterns to the D-test, which measures inducible clindamycin resistance.
In our study, we concluded that the D-test can be employed as an alternate method to PCR in laboratories with resource-limited settings. This test may aid in avoiding therapeutic failure by providing confident laboratory reports leading to the omission of clindamycin in patients infected with inducible clindamycin-resistant staphylococci. The D-test is essential for accurate discrimination between iMLSB resistance and true susceptibility. As long as inducible MLSB resistance is regularly and consistently identified, clindamycin can be utilized to treat individuals infected with true clindamycin-sensitive bacteria in a safe and effective manner.17
Periodic surveys are essential and must be performed to track changes in the prevalence of iMLSB strains and the evolution of strains with diverse patterns of susceptibility. This will help us to restrict the spread of these strains and formulate an efficient policy for antimicrobial usage control.
In a total of 341 (100%) S. aureus strains isolated from various clinical samples like pus, urine, blood, and sputum, majority [267 (78.6%)] were MSSA. iMLSB resistance was detected by disc diffusion induction test or “D-test” in 42 (12.3%) isolates, out of which 23 (15.6%) were MSSA and 19 (33.9%) were MRSA. Inducible resistance was found to be significantly higher among MRSA when compared to MSSA.
Real-time PCR was done for gene detection in all iMLSB positive isolates and the majority of the isolates – 22 (52.4%) showed both ermA and ermC genes, out of which 13 (56.5%) were MSSA and 9 (47.4%) were MRSA.
In this study, we describe a simple and inexpensive double-disc diffusion test (D-test) that can be incorporated into routine antibiotic susceptibility testing in clinical laboratories for all erythromycin-resistant staphylococcal isolates. This test enables accurate differentiation between inducible MLSB resistance and true clindamycin susceptibility, thereby guiding clinicians in avoiding clindamycin use in cases with inducible resistance and preventing potential therapeutic failures. While the D-test remains a practical and cost-effective tool for routine use, real-time PCR offers significant advantages for the detection of erm genes, including higher sensitivity, specificity, and the ability to provide rapid, precise molecular identification of resistance mechanisms. The integration of both phenotypic and genotypic methods can enhance diagnostic accuracy and support more informed antimicrobial stewardship.
ACKNOWLEDGMENTS
None.
CONFLICT OF INTEREST
The authors declare that there is no conflict of interest.
AUTHORS’ CONTRIBUTION
All authors listed have made a substantial, direct and intellectual contribution to the work, and approved it for publication.
FUNDING
None.
DATA AVAILABILITY
All datasets generated or analyzed during this study are included in the manuscript.
ETHICS STATEMENT
This study was approved by the Institutional Ethics Committee, Sree Gokulam Medical College & Research Foundation, Kerala, India, vide reference number SGMC-IEC-No.: 34/463/09/2019.
INFORMED CONSENT
Written informed consent was obtained from the participants before enrolling in the study.
- Deotale V, Mendiratta DK, Raut U, Narang P. Inducible clindamycin resistance in Staphylococcus aureus isolated from clinical samples. Indian J Med Microbiol. 2010;28(2):124-126.
Crossref - Fiebelkorn KR, Crawford SA, McElmeel ML, Jorgensen JH. Practical disk diffusion method for detection of inducible clindamycin resistance in Staphylococcus aureus and coagulase-negative staphylococci. J Clin Microbiol. 2003;41(10):4740-4744.
Crossref - Angel MR, Balaji V, Prakash J, Brahmadathan KN, Mathews MS. Prevalence of inducible clindamycin resistance in Gram-positive organisms in a tertiary care center. Indian J Med Microbiol. 2008;26(3):262-264.
Crossref - Drinkovic D, Fuller ER, Shore KP, Holland DJ, Ellis-Pegler R. Clindamycin treatment of Staphylococcus aureus expressing inducible clindamycin resistance. J Antimicrob Chemother. 2001;48(2):315-316.
Crossref - Mane M, Kadu A, Gangurde N. Inducible Clindamycin Resistance among Staphylococcal Isolates from Different Clinical Samples. Int J Health Sci Res. 2012;2(2):1-5.
- O’Sullivan MVN, Cai Y, Kong F, Zeng X, Gilbert GL. Influence of disk separation distance on accuracy of the disk approximation test for detection of inducible clindamycin resistance in Staphylococcus spp. J Clin Microbiol. 2006;44(11):4072-4076.
Crossref - Leclercq R. Mechanisms of resistance to macrolides and lincosamides: nature of the resistance elements and their clinical implications. Clin infect dis: 2002;34(4):482-92.
Crossref - CLSI. Performance Standards for Antimicrobial Susceptibility Testing. 30th ed. CLSI supplement M100. Wayne, PA: Clinical and Laboratory Standards Institute; 2020.
- Lowy FD. Staphylococcal Infections. In: Fauci AS, Jameson JL, Harrison TR, eds. Harrison’s Principles of Internal Medicine. 20. ed. McGraw-Hill Education; 2020.
- Sharp SE, Searcy C. Comparison of mannitol salt agar and blood agar plates for identification and susceptibility testing of Staphylococcus aureus in specimens from cystic fibrosis patients. J Clin Microbiol. 2006;44(12):4545-4546.
Crossref - Dufour P, Gillet Y, Bes M, et al. Community-acquired methicillin-resistant Staphylococcus aureus infections in France: emergence of a single clone that produces Panton-Valentine leukocidin. Clin Infect Di. 2002;35(7):819-24.
Crossref - Tille PM. Staphylococcus, Micrococcus, and Similar Organisms. In: Tille PM. Bailey & Scott’s Diagnostic Microbiology. 15th edition. Elsevier; 2022:251-267.
- Vivek JS, Rajesh GN, Sharma M, et al. Prevalence of inducible Clindamycin resistance among community-and hospital-associated Staphylococcus aureus isolates in a tertiary care hospital in India. Biomed Res. 2011;22(4):465-469
- Gadepalli R, Dhawan B, Mohanty S, Kapil A, Das BK, Chaudhary R. Inducible clindamycin resistance in clinical isolates of Staphylococcus aureus. Indian J Med Res. 2006;123(4):571.
- Yilmaz G, Aydin K, Iskender S, Caylan R, Koksal I. Detection and prevalence of inducible clindamycin resistance in staphylococci. J Med Microbiol. 2007;56(3):342-345.
Crossref - Gupta V, Datta P, Rani H, Chander J. Inducible clindamycin resistance in Staphylococcus aureus: a study from North India. J Postgrad Med. 2009;55(3):176-179.
Crossref - Pal N, Sharma B, Sharma R, Vyas L. Detection of inducible clindamycin resistance among Staphylococcal isolates from different clinical specimens in western India. J Postgrad Med. 2010;56(3):182.
Crossref - Mokta KK, Verma S, Chauhan D, et al. Inducible clindamycin resistance among clinical isolates of Staphylococcus aureus from Sub Himalayan Region of India. J Clin Diagn Res. 2015;9(8):DC20.
Crossref - Debdas D, Joshi S. Incidence of clindamycin resistance in clinical isolates of Staphylococcus aureus. J Infect Dev Cntries. 2011;5(4):316-317.
Crossref - Mittal V, Kishore S, Siddique ME. Prevalence of inducible clindamycin resistance among clinical isolates of Staphylococcus aureus detected by phenotypic method: A preliminary report. J Infect Dis Immun. 2013;5(1):10-12.
Crossref - Sasirekha B, Usha MS, Amruta JA, Ankit S, Brinda N, Divya R. Incidence of constitutive and inducible clindamycin resistance among hospital-associated Staphylococcus aureus. 3 Biotech. 2014;4(1):85-89.
Crossref - Lall M, Sahni AK. Prevalence of inducible clindamycin resistance in Staphylococcus aureus isolated from clinical samples. Med J Armed Forces India. 2014;70(1):43-47.
Crossref - Chatterjee SS, Karmachrya R, Kumar MS, Gautam V, Ray P. Vancomycin heteroresistance, and inducible and Constitutive Clindamycin resistance in staphylococci. Int J Sci Res. 2018;7(8):48-51
© The Author(s) 2025. Open Access. This article is distributed under the terms of the Creative Commons Attribution 4.0 International License which permits unrestricted use, sharing, distribution, and reproduction in any medium, provided you give appropriate credit to the original author(s) and the source, provide a link to the Creative Commons license, and indicate if changes were made.