


ISSN: 0973-7510
E-ISSN: 2581-690X
Binsar Wildlife Sanctuary is an ecological confined area having high diversity of plants and animals. Oak and pine are the dominant species in this sanctuary. Since soil biological indicators are highly sensitive, which reflect the impact of land use systems in short time, soils under oak (Quercusleucotrichophora) and pine (Pinusroxburghii) canopy cover were investigated for enzyme activities such as dehydrogenase, acid phosphatase, alkaline phosphatase, nitrate reductase, MBC, OC and abundance of bacteria, fungi and actinomycetes during 2008-2010. The mean DHA, acid phosphatase, alkaline phosphatase, nitrate reductase activities recorded highest values in oak 9.3 µg TPF g-1 soil h-1, 452µg PNP g-1 soil h-1, 234.3µg PNP g-1 soil h-1, 1.3 mg kg-1 respectively as compared to the pine canopy cover soil 5.3µg TPF g-1 soil h-1, 186µg PNP g-1 soil h-1, 118 µg PNP g-1 soil h-1, 0.6mg kg-1respectively. The MBC values were from 460.2mg kg-1 in pine canopy to 596.7 mg kg-1 in oak forest. Similarly the values of OC were also recorded significantly high in oak forest. From this study it is concluded that the canopy of oak forest is much more effective to improve the biological indicators in soil.
Oak Canopy, Pine Canopy, Indian Himalayas, Soil Enzymes, Microbial Biomass Carbon, Organic Carbon.
Binsar Wildlife Sanctuary (BWS) is the conserved and protected hill area spread over 45.59km² and situated at an altitude varying 900 to 2500mts with an average height of 2412mts. Because of minimum anthropogenic intervention, the natural vegetation and wild life are in harmony and self sustained natural ecosystem. Forest soils receive litter fall continuously and consequently constant litter decomposition. Recycling of nutrients is mediated by organic matter decomposition by soil microorganisms (Couteaux et al., 1995). Constant process of litter decomposition is regulated by litter composition and associated with climatic factors as temperature and rainfall. Soil enzymes are sensitive indicators of microbial activity and soil quality which respond quickly to environmental changes (Gianfreda et al., 2005; Salgado et al., 2010; Mijangos et al., 2006; Bandick and Dick, 1999;Sinsabaugh et al., 2009; Acosta-Mart1nez and Tabatabai, 2000).The microbial activities reflect the sum of all physical chemical and biological factors regulating the decomposition and transformation of nutrients. Tree species have significant impact on the microbial properties of the soil (Phillips & Fahe, 2006; Meng et al., 2012; Ushio et al., 2009; Chodak & Niklinska, 2010) and this plant soil association regulates biogeochemical process (Kulmatiski et al., 2008). BWS hill forest on is an ideal site to examine the effects of plant species on soil microbial enzymes and microbial biomass as the BWS forest of Indian Himalayan is undisturbed ecosystem and thus organic matter specific to a tree species (e.g., in terms of nutrient concentration and litter composition) accumulates beneath the tree, and it can influence the soil microbial enzymes. Forest biogeochemical cycles are shaped by effects of dominant tree species on soils, but the underlying mechanisms and the extent of impacts are important area of ecosystem research (Mueller et al., 2011).Oak (Quercusincana) and Pine (Pinusroxburghii) are the most important plantation tree species in Binsar wild life tiger reserve hill in terms of area, yield and other forest resources uses.
The objective of the present study was to assess various enzyme activities, microbial biomass carbon and population of bacteria, fungi and actinomycetes in soils beneath the litter of oak and pine canopy in the BWShill forest and also to find out the temporal variations. The information generated is expected to be useful to understand the soil-microbes interaction of mountain forest ecosystems with dominant species such in pine and oak.
Study site
The selected hill forests for the study are located in the Binsar region (29.63° N, 79.33° E) of Uttarakhand, India. Oak (Quercusleucotrichophora) and Pine (Pinusroxburghii) canopy are the prime tree species in this region and were selected for the study. Of this, pine canopy are located at the 1800 amsl while the oak canopy were located at 2300m above mean sea level. The climate is sub temperate, characterized by moderate summer (May–June), extreme winter (Dec–Jan) and general dryness, except during the southwest monsoon season (June–Sept).
Soil and weather characteristics
The parent material of these soils consists of mica, schist, slates, sand stone, calcium deficient granite and seynite rocks (Singh et al., 2000). Some of the soil properties at the time of first sampling (July 2008) are presented in Table 1. Genetically these soils come under climate ogenicpodsolized grey-brown forest soils. Soil under oak and pine were having acidic soil reaction. The pH values were 5.7(Oak forest) and 6.1 (Pine forest). The EC values were oak forest (0.11dS m-1) and pine forest (0.18dS m-1). During the two sampling periods (summer and winter), the temperature and rainfall conditions varied. During July, the temperature 30.1°C (max) 20.9°C (min), and in January, 20.3°C (max) and -0.3°C (min). Rainfall also varied much between the two sampling months: 137.5 mm in July (summer) and 16.5mm in January (winter).
Table (1):
Some soil properties of oak and pine soil. Each value is an average of three analyses.
Land use and cropping systems |
Location |
Description |
pH |
EC (dS m-1) |
Sand (%) |
Silt (%) |
Clay (%) |
N (%) |
Avail. K (mg kg-1) |
Respiration (O2 g-1 h-1) |
|---|---|---|---|---|---|---|---|---|---|---|
Oak (Quercusincana) forest |
Corbet national park, Binsar 29°39’N 79°07’E. Altitude 2400 m amsl |
Natural vegetation predominantly under oak trees. |
5.7 |
0.11 |
55 |
29 |
16 |
0.24 |
377.8 |
12.1 |
Pine (Pinusroxburghii) forest |
Corbet national park, Binsar 29°39’N 79°07’E. Altitude 2000 m amsl |
Natural vegetation predominantly under Pine trees. |
5.8 |
0.18 |
46 |
18 |
36 |
0.15 |
298.4 |
8.3 |
Soil sampling
The soil samples of two different depths (0-15cm, 15-30cm) were collected from the oak and pine canopy after removing the litter in July 2008, 2009 and 2010. Eight to tencompo site soil samples were collected from each site for each depth. For making one composite sample, soil cores of these samples were pooled. Pseudo-replicated approach of sampling was followed in this study. Such sampling technique has also been adopted by other workers (Patra et al. 2005, Patra et al. 2006). The field moist soil samples were stored in refrigerator at temperature less than 4°C for preserving the biological activities till the analysis were over in 7-10 days. All chemical results are mean of triplicate analysis and expressed on the oven dry weight basis. Soil moisture was determined after drying at 105°C for 24 h.
Soil analyses
Soil dehydrogenase activity was determined using the method of Klein et al., (1971). Acid and alkaline phosphatase activities were determined by the method of Tabatabai and Bremner (1969). Nitrate reductase activity was determined by the method of Fu and Tabatabai1989, Patra et al. 2006). MBC was determined by fumigation extraction method given by Horwath and Paul (1994). The organic carbon was estimated following the procedure of Walkley and Black. (1934). Enumeration of bacteria, fungi and actinomycetes was done following the procedure as described by Chhonkar et al. (2007).
Statistical analysis
Three-way analysis of variance (ANOVA) and Duncan’s multiple range test (DMRT) for comparison of means were performed using software SAS 9.1.3. PAST3.x software is used for PCA analysis. Unless otherwise stated, the level of significance referred to in the results is P < 0.05.
Soil Enzymes
Soil Dehydrogenase Activity
Highest value of dehydrogenase activity was observed in case of undisturbed natural oak canopy cover soil while pine canopy cover showed significantly lowest value (Table 2). During the years (2008-2010) the DHA activity of oak forest soil were 10.7, 12.7 and 9.9 µg TPF g-1 soil h-1 and Pine forest soil were 6.4, 7.2 and 6 µg TPF g-1 soil h-1respectively. However in lower depth the DHA activity of oak canopy soil were 7.7, 8.1 and 7.1µg TPF g-1 soil h-1 and for pine canopy soil the values are 4, 4, and 3.9 µg TPF g-1 soil h-1for subsequent three years (2008-2010). The DHA activity was 40 % and 47 % lesser at 0-15 and 15-30 cm in pine canopy soil as compared to oak forest mean values respectively. In all the years the DHA activity was higher in oak canopy covered soil. The yearly fluctuation in DHA activity is least in both oak and pine soils. After considering the depth and year factor, the oak canopy soil found to maintain highest dehydrogenase activity irrespective of the year and depth differences.
Table (2):
Impact of Canopy cover on Dehydrogenase (DHA-µg TPF g-1 soil h-1), Acid phosphatase (AcP- µg PNP g-1 soil h-1), Alkaline Phosphatase (AlkP- µg PNP g-1 soil h-1), Nitrate reductase (NR-mg kg-1), Microbial Biomass Carbon (MBC- mg kg-1), Organic Carbon (OC-Percentage)at different depths under different land use systems in central Himalayan region. MSE –Mean Standard Error.
| At Depth 0-15cm. | ||||||||||
|---|---|---|---|---|---|---|---|---|---|---|
| Oak Canopy | Pine Canopy | |||||||||
| Year | 2008 | 2009 | 2010 | Mean | MSE | 2008 | 2009 | 2010 | Mean | MSE |
| DHA | 10.7 | 12.7 | 9.9 | 11.1 | 0.33 | 6.8 | 7.2 | 6.04 | 6.7 | 0.12 |
| Acid P | 563.6 | 725 | 637.3 | 642.0 | 20.48 | 238.3 | 286.8 | 292.7 | 272.6 | 10.20 |
| Alk P | 232.4 | 334.8 | 314 | 293.7 | 5.39 | 171 | 210.1 | 112.5 | 164.5 | 7.90 |
| Nit R | 1.5 | 2 | 1.7 | 1.7 | 0.13 | 0.7 | 0.9 | 0.7 | 0.8 | 0.06 |
| MBC | 732 | 834 | 731.5 | 765.8 | 22.67 | 633 | 630.6 | 587.3 | 617.0 | 11.38 |
| OC | 3.4 | 3.5 | 3.1 | 3.3 | 0.14 | 1.3 | 1.4 | 1.1 | 1.3 | 0.05 |
| At Depth 15-30. | ||||||||||
|---|---|---|---|---|---|---|---|---|---|---|
| Oak Canopy | Pine Canopy | |||||||||
| Year | 2008 | 2009 | 2010 | Mean | MSE | 2008 | 2009 | 2010 | Mean | MSE |
| DHA | 7.7 | 8.1 | 7.1 | 7.6 | 0.15 | 4 | 4 | 3.91 | 4.0 | 0.07 |
| Acid P | 212 | 304.2 | 270.1 | 262.1 | 9.42 | 89 | 115.1 | 95.7 | 99.9 | 5.20 |
| Alk P | 181.3 | 198.7 | 147.8 | 175.9 | 4.56 | 84.6 | 73 | 56.8 | 71.5 | 2.47 |
| Nit R | 1.1 | 1 | 0.9 | 1.0 | 0.05 | 0.4 | 0.5 | 0.3 | 0.4 | 0.05 |
| MBC | 437.7 | 425.5 | 419.7 | 427.6 | 18.31 | 225.2 | 344.5 | 341.1 | 303.6 | 11.48 |
| OC | 2.1 | 1.6 | 1.1 | 1.6 | 0.16 | 0.5 | 0.4 | 0.3 | 0.4 | 0.03 |
Dehydrogenase activity reflects the total range of oxidative activity of soil microflora and is a good indicator of microbial activity (Defrieri et al., 2011; Dick et al., 1996; Sebiomo et al., 2011; Quilchano & Marañón 2002). Generally the forest ecosystem holds high substrate availability due to the continuous organic matter decomposition and may cause higher DHA activity by soil microbes. Litter composition seems to be the important factor affecting the microbial population as well as diversity. This reflects the greater biological activity in the system and stabilization of extracellular enzymes through complexion with humic substances (Colvan et al., 2001). Result recorded shows significance of moisture in soil as higher DHA activity were recorded (12.7 for oak and 7.2 TPF g-1 soil-1 for pine) in year 2009 just after few days of rainfall, also suggest us the ideal soil conditions. At surface soil the litters are under different stages of decomposition with higher DHA activity where as in depth may be due to lack of nutrient and aerobic conditions the DHA activity decreases. Faster rates of litter and roots decomposition is mediated by the microorganisms, in turn microbial population and community structure is determined by the quality of the litter and the root of the tree species. Our study revel higher DHA activity in oak forest soil than pine forest soil suggest the quality of the litter produced by each tree species and also higher availability the organic matter increases higher decomposition as reported in studies by Pandey et al., (2005) and Arunachalam et al., (1998).
Acid Phosphatase
Highest acid phosphatase activity was observed in case of oak canopy cover soil than the pine cover soil (Table 2). The three subsequent year average acid phosphatase activity in oak canopy cover surface soil was 642 µg PNP g-1 soil h-1 and 272.6 µg PNP g-1 soil h-1 for pine canopy cover surface soil. In comparing all the years the surface mean acid phosphatase activity was 57% more in oak canopy cover soil than pine canopy cover soil. Similarly at lower depth (15-30cm) 61% more acid phosphatase values were observed in oak soil than pine soil
Phosphorus (P) is often a limiting nutrient for plant growth in tropical and subtropical forests.(Huang et al., 2011). Acid phosphatase can be affected by changes of different related factors such as plant species (Ushio et al., 2010)and litter quality (Conn and Dighton, 2000) as plant roots are the major producer of acid phosphatase (Speir and Cowling, 1991). Higher acid phosphatase activity in the oak and pine were observed and is influenced by the effect of soil pH. Acidic nature of the soil influences and increases the acid phosphatase as reported by several workers (Wang et al., 2006, Sarapatka et al., 2004 and Dick et al., 2000).
Alkaline Phosphatase
Alkaline phosphatase activity was also found to vary significantly among oak and pine canopy cover soils. During 2008-2010the Alkaline phosphatase activity of oak forest surface soil were 232.4, 334.8 and 314 µg PNP g-1 soil h-1 and Pine forest soil were 171, 210 and 112.5 µg PNP g-1 soil h-1,respectively. However in lower depth the alkaline phosphatase activity of oak canopy soil were 181.3, 198.7 and 147.8µg PNP g-1 soil h-1 and for pine canopy soil the values are 84.6, 73, and 56.8 µg PNP g-1 soil h-1for subsequent three years (2008-2010). Over all alkaline phosphatase activity found was 50% lesser in pine canopy soil as compared to oak system mean value (0-15 and 15-30).
Nitrate reductase
Nitrate reductase activity follows the same trend as mean values of oak canopy cover surface soil NRA activity recorded is higher (1.7mg kg-1) than pine canopy cover (0.8mg kg-1) and similarly at lower depth (15-30cm) oak soil exhibited higher value (1mg kg-1) than pine soils (0.4mg kg-1). Plant litter quality have significant impact on nitrate reductase activity (Barford and Lajtha 1992) and thus can be used as indicator to access the litter quality impact on the soil. The ecology process of dissimilatory nitrogen reduction is not well understood Tiedje et al., (1982). Nitrate reductase activity is generally altered by nutrient status of the soil as reported by Ramana et al., (2008) and Poobathiraj et al., (2012).The rate of nitrate reduction and soil organic carbon are closely related as revealed by many studies (Rashid and Schaefer 1987).
Microbial Biomass
Microbial Biomass Carbon
Higher MBC was observed in case of undisturbed natural oak canopy cover soil while pine canopy cover showed significantly lower MBC (Table 2). During the years (2008-2010) the mean surface microbial biomass carbon status of oak forest soil was 765.8 mg kg-1and pine forest soil was 617 mg kg-1respectively. However in lower depth the DHA activity of oak canopy soil were 419.7mg kg-1soil h-1 and for pine canopy soil the value is 341.1mg kg-1. MBC status was found to be 45 % and 27% lesser at lower depth (0-15cm) in comparison with surface soil (0-15cm) of oak and pine canopy cover soil respectively.
In the present study, oak and pine canopy cover greatly affected soil MBC (Table 2). Our results suggest the increase in organic matter enhances the proliferation of microbes in soil in agreement with earlier studies (Haynes, 1999, 2000, Wu et al., 2004). The higher MBC values observed in the undisturbed oak forest similar as in conformity with Omay (1997), however the MBC values are lower in pine soil can be attributed to the relatively continuous and more organic matter deposition via leaf litter(Omay1997).Dead root cells tend to increase nutrient availability are higher in oak forest soil than in pine forest soil which in turns increase the microbial activity in oak forest (Srivastava2009; Kang et al., 2009)
Bacteria, Fungi and Actinomycetes
Enumeration of bacteria population revel higher bacterial inhabitants in oak canopy soil than the pine canopy soil (Table 3). The mean bacterial, fungal and actinomycetes density of three years in oak forest surface soil is recorded as 21.9 CFU x 107, 4.6 CFU x 105and 10.1 CFU x 106, however in pine surface soil the values are 11.1 CFU x 107, 3.4 CFU x 105, 5.2 CFU x 106 respectively. At depth 15-30 of oak forest soil the mean bacterial, fungal and actinomycetes population was reduced by 41 % (12.8CFU x 107), 37% (2.9CFU x 105) and 34% (6.7CFU x 106) respectively. Bacterial fungal and actinomycetes population were 40%, 51%, 55% lesser at 15-30cm depth respectively
Table (3):
Impact of Canopy cover on Bacteria (CFU x 107), fungi (CFU x 105) and Actinomycetes(CFU x 106) population at different depths under different land use systems in central Himalayan region, MSE –Mean Standard Error.
| At Depth 0-15 | ||||||||
|---|---|---|---|---|---|---|---|---|
| Microbial Enumeration | Oak canopy soil | Pine canopy soil | ||||||
| Year | 2008 | 2009 | 2010 | MSE | 2008 | 2009 | 2010 | MSE |
| Bacteria | 26.2 | 21.5 | 18 | 1.24 | 8.4 | 14.6 | 10.3 | 0.86 |
| Fungi | 5.3 | 4.5 | 4.1 | 0.36 | 3.8 | 4.1 | 2.3 | 0.14 |
| Actinomycetes | 8.6 | 9.9 | 11.9 | 0.84 | 2.8 | 4.9 | 7.8 | 0.6 |
| At Depth 15-30 | ||||||||
| Microbial Enumeration | Oak canopy soil | Pine canopy soil | ||||||
| Year | 2008 | 2009 | 2010 | MSE | 2008 | 2009 | 2010 | MSE |
| Bacteria | 12.5 | 14.6 | 11.3 | 0.5 | 4.4 | 8 | 7 | 0.3 |
| Fungi | 3.7 | 2.8 | 2.1 | 0.3 | 2.1 | 1.3 | 1.3 | 0.36 |
| Actinomycetes | 5.6 | 7.8 | 6.6 | 0.54 | 2.2 | 2.2 | 2.6 | 0.32 |
Correlation and Principal Component Analysis
In general, Pearson correlation values between soil enzymes, microbial biomass carbon and organic carbon variables of oak and pine canopy soil were high (Table 4). The DHA activity was highly and positively correlated with Ac-P (0.94**), Alk-P (0.94**), NR (0.97**), MBC (0.85**), and OC (0.96**). Soil organic carbon was highly correlated with DHA (0.966**) Ac-P (0.939**), Alk-P (0.925**), NR (0.970**), and MBC (0.835**). Our results are in agreement with Nannipieri et al., (2002) and Ginanfreda et al., (2005) that high correlation of soil enzymes, MBC and OC may give an indication of better soil quality and fertility status of a soil with reference to soil microbe interactions. The PCA revealed differences between the systems and variation in the distribution of the indicators representing sampling time (Figure 1). Multivariate analysis of the components is explained by PC1 (94%) and PC2 (4%). PCA was done and obtained an individual correlation between the microbial and biochemical indicators in soil. Soil enzymes (dehydrogenase, acid phosphatase, alkaline phosphatase, nitrate reductase), microbial biomass carbon and organic carbon indicators were used in PCA for comparative analysis between oak and pine canopy soil and sampling periods (2008, 2009 and 2010) as indicated in the legend of Figure 1.
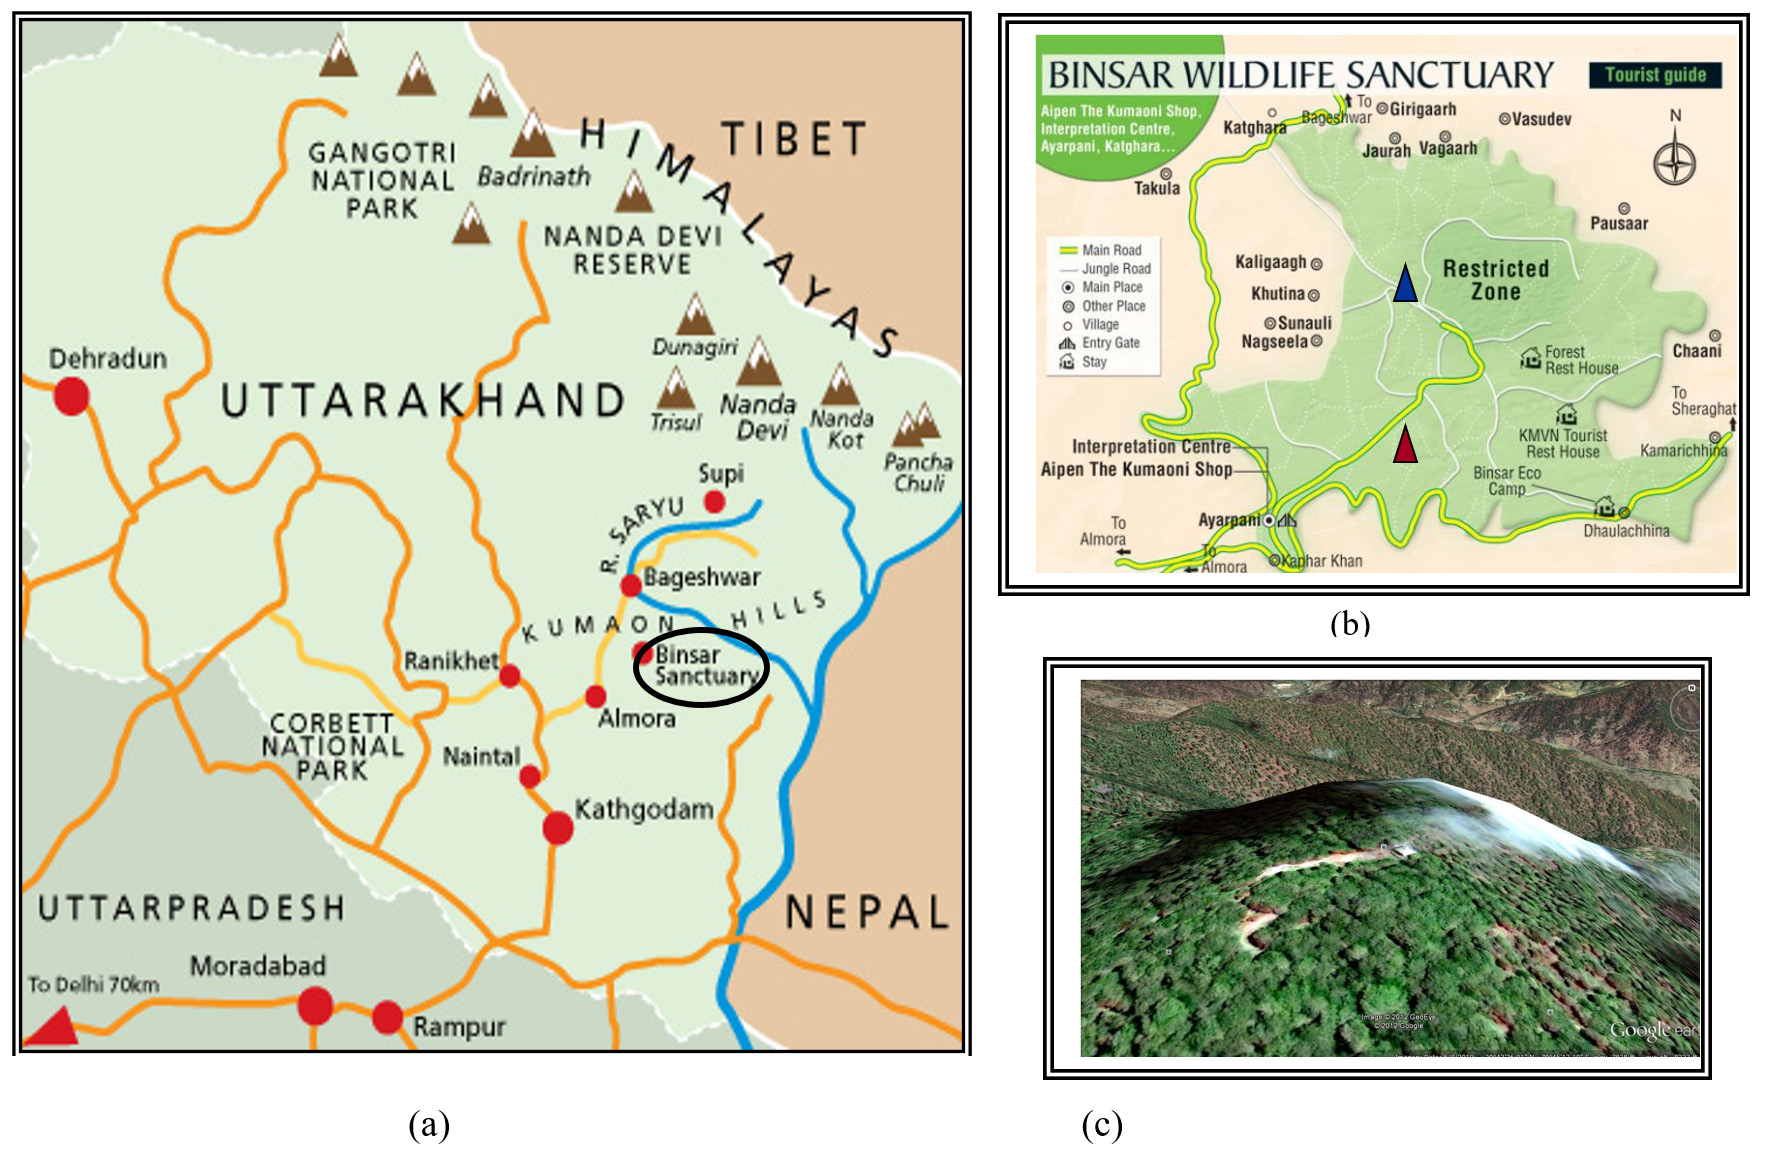 Fig. 1. (a) Location of the study area 29.63° N, 79.33° E- Binsar wildlife sanctuary (b) Sampling site of pine (indicated as red triangle) and oak (indicated in blue triangle). (c) 3D view of Binsar Zero Point (8000ft) – Dense Oak canopy site.
PC1 values shows that microbial indicators were not much affected substantially by sampling period which may be due to the similar climatic condition mediated biological process (as indicated by similar values in all the years) but two distinguish pattern one for oak and other for pine canopy were observed and shows that the soil enzymes, microbial biomass carbon and organic carbon indicators were distinct to specific plant of canopy which determine the litter quality and decomposition impact on soil. The soil microbial indicators of two soils behaved differently when compared to each other. Our finding also supports the results of Wick et al. (1998) suggesting the use of MBC and OC as indicators to evaluate land use impacts.
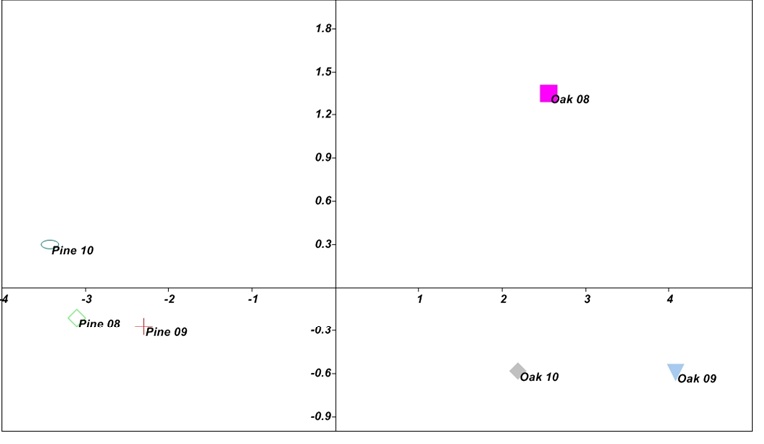 Fig. 2. Ordination of Oak and Pine forest soils sites in function of sampling periods (July-2008,2009 and 2010), in the space defined by the PC1 and PC2 axis of the PCA analysis carried out with Soil enzymes (Dehydrogenase, Acid Phosphatase, Alkaline Phosphatase and Nitrate Reductase, Microbial biomass carbon and Organic carbon). Dashed circles indicate the groups formed in the ordination of the soil biological properties and soil sampling areas in function of sampling periods.
Table (4):
Pearson’s correlation coefficients among soil Dehydrogenase, Acid phosphatase, Alkaline phosphatase, Nitrate reductase, Microbial biomass carbon and organic carbon from oak and pine canopy soils of Binsar Jim Corbett Tiger Reserve .
DHA |
Ac-P |
Alk-P |
NR |
MBC |
|
|---|---|---|---|---|---|
Ac-P |
0.947** |
||||
Alk-P |
0.949** |
0.928** |
|||
NR |
0.975** |
0.961** |
0.959** |
||
MBC |
0.853** |
0.889** |
0.846** |
0.821** |
|
OC |
0.966** |
0.939** |
0.925** |
0.970** |
0.835** |
**. Correlation is significant at the 0.01 level (2-tailed).
The oak and pine canopy cover have significant and distinct effects with the type of vegetation on the soil microorganisms under oak and pine canopy. Our study revealed that soil enzyme activities varied significantly and decreased with increasing depth in both the ecosystem. The microbial status of oak forest soil is better than the pine forest suggesting the hard to decompose quality of the litter in the pine forest.
ACKNOWLEDGMENTS
We thank the Director and Dean and Joint Director (Education), Indian Agricultural Research Institute, New Delhi, and Department of Science and Technology (DST), Government of India, for providing necessary financial support for carrying out this work.
- Halpern, S.D., Ubel, P.A., Caplan, A.L. Solid-organ transplantation in HIV-infected patients. N. Engl. J. Med., 2002; 347(4): 284-7.
- Acosta, M.V., Tabatabai, M.A.. Enzyme activities in a limited agricultural soil. Biol. Fertil. Soils., 2000; 31:85-91
- Arunachalam, A., Arunachalam, K., Pandey, H.N., Tripathi R.S. Fine litterfall and nutrient dynamics during forest regrowth in the humid subtropics of north-eastern India. For. Ecol. Manage.,1998, 110: 209–219.
- Bandick, A.K., Dick R.P. Field management effects on enzyme activities. Soil. Biol. Biochem.1999, 31: 1471-1479.
- Barford, C., Lajtha. K. Nitrification and nitrate reductase activity along a secondary succession gradient. Plant Soil., 1992, 145: 1-10.
- Boøivojarapatka, LenkaDudová, Milena Kr¹ková. Effect of pH and phosphate supply on acid phosphatase activity in cereal roots. Biol. Bratislava, 2004, 59(1):127-131.
- Klein, D.A, Loh, T. C., Goulding, R. L. A rapid procedure to evaluate the dehydrogenase activity of soils low in organic matter”. Soil. Biol. Biochem., 1971, 3: 385-387.
- Chhonkar, P.K., Bhadraray, S., Patra, A.K. and Purakayastha, T.J. Experiments in soil biology and biochemistry. Westville Publishing House, New Delhi, 2007, 110 p.063.
- Chodak, M., Nikliñska, M. Effect of texture and tree species on microbial properties of mine soils. Appl. Soil Ecol.,2010, 46: 268-275.
- Conn, C., Dighton, J.Litter quality influences on decomposition, ectomycorrhizal community structure and mycorrhizal root surface acid phosphatase activity.Soil. Biol. Biochem., 2000; 32: 489-496.
- Colvan, S.R., Syers, J.K.., Donnel, A.G. Effect of long-term fertiliser use on acid and alkaline phosphomonoesterase and phosphodiesterase activities in managed grassland. Biol. Fertil. Soils, 2001, 34: 258–263.
- Couteaux, M.M., Bottner, P., Berg, B. Litter decomposition, climate and litter quality. Tree, 1995, 10: 63-66.
- Defrieri, R.L., Sarti, G., Tortarolo, M.F., Escobar–Ortega, García de Salamone, F. D´Auria,. Effron, D. Biochemical and microbiological properties of Argentinean Patagonia soil with implanted forest species.J. Soil Sci. Plant Nutr., 2011, 11(3):111-124.
- Dick, R,P., Breakwell, D.P., Turco, R.F.: Soil enzyme activities and biodiversity measurements as integrative microbiological indicators. In: Methods of assessing soil quality (Doran JW, Jones AJ eds). Madison, WI : Soil Science Society of America, 1996, pp 247–271.
- Dick, W.A., Cheng, L., Wang, P. Soil acid and alkaline phosphatase activity as pH adjustment indicators. Soil. Biol. Biochem., 2000, 32: 1915-1919.
- Fu, M.H., Tabatabai, M.A. Nitrate reductase activity in soils: effects of trace elements. Soil. Biol. Biochem., 1989, 21: 943-946.
- Gianfreda, L., Rao, M.A., Piotrowska, A., Palumbob, G., Colombob, C. Soil enzyme activities as affected by anthropogenic alterations: intensive agricultural practices and organic pollution. Sci. Total Environ., 2005, 341:265–279.
- Haynes, R.J. Size and activity of the soil microbial biomass under grass and arable management. Biol. Fertil. Soils., 1999, 30:210–216.
- Horwath, W.R. and Paul, E.A., 1994. Microbial biomass. In : Methods of soil analysis. Part 2. Microbiological and biochemical properties (Weaver RW ed.). Madison, WI : Soil Science Society of America, 1994, pp. 753–773.
- Huang, W., Liu, J., Zhou, G., Zhang, D., Deng, Q. Effect of precipitation on soil acid phosphatase activity in three successional forests in southern China. Biogeosciences, 2011, 8: 1901-1910.
- Hu Y.L., Wang S.L., Zeng D.H. Effects of single Chinese fir and mixed leaf litters on soil chemical, microbial properties and soil enzyme activities. Plant. Soil., 2006, 282: 379–386.
- James, M., Tiedje, Sexstone, A.J., David, D. Myrold and Joseph A. Robinson Denitrification: ecological niches, competition and survival. Antonie van Leeuwenhoek 48, 569-583.
- Tiedje, J.M., Sexstone, A.J., Myrold, D.D. and Robinson, J.A. Denitrification: ecological niches, competition and survival. Antonie van Leeuwenhoek, 1983, 48(6):569-583.
- Kang, H., Kang, S., Lee, D. Variations of soil enzyme activities in a temperate forest soil. Ecol. Res.,2009, 24(5):1137-1143.
- Kulmatiski, A., Beard, K.H., Stevens, J.R., Cobbold, S.M. Plant–soil feedbacks: a meta-analytical review.Ecology Lett.,2008, 11: 980–992.
- Martinez-Salgado, M.M., Gutiérrez-Romero, V., Jannsens, M., Ortega-Blu, R. Biological soil quality indicators: a review. Current Research, Technology and Education Topics in Applied Microbiology and Microbial Biotechnology, 2010, 1:.319-328.
- Meng, F.J., Huang F.L., Wang, Q. The effects of exotic and native poplars on rhizosphere soil microbe and enzyme activity. Afr J Biotechnol., 2012, 11(6):1412-1418.
- Mueller, K.E., Eissenstat, D.M., Hobbie, S.E., Oleksyn, J., Jagodzinski, A.M., Reich, P.B., Chadwick, O.A. and Chorover, J. Tree species effects on coupled cycles of carbon, nitrogen, and acidity in mineral soils at a common garden experiment. Biogeochemistry, 2011, 11: 9695-9697.
- Mijangos, I., Perez, R., Albizu, I., and Garbisu, C. Effects of fertilization and tillage on soil biological parameters. Enzyme Microb. Technol., 2006, 40: 100- 106.
- Nannipieri, P., Kandeler, E. and Ruggiero, P., 2002. Enzyme Activities and Microbiological and Biochemcial Processes in Soil. In Enzymes in the environment: Activity, ecology, and applications. 2002, CRC Press, p 1-33.
- Omay, A.B. Soil microbial and chemical property under long crop rotation and fertilization. Soil Sci Am J., 1997: 61:1672-1678.
- Pandey, H.N., Ralte, V., Barik, S.K. , Tripathi R.S., Prabhu S.D. Changes in microbial biomass and activity in relation to shifting cultivation and horticultural practices in subtropical evergreen forest ecosystem of north-east India. Acta Oecologica, 2005, 28:163–172.
- Patra, A.K., Abbadie, L., Clays-Josserand, A., Degrange, V., Grayston, S.J., Loiseau, P., Louault, F., Mahmood, S., Nazaret, S., Philippot, L., Poly, F., Prosser, J.I., Richaume, A., Le Roux, X. Effect of grazing on microbial functional groups involved in soil N dynamics. Ecol Monogr., 2005, 75:65–80.
- Patra, A.K., Chhonkar, P.K., Khan, M.A. Effect of green manure Sesbaniasesban and nitrification inhibitor encapsulated calcium carbide (ECC) on soil mineral-N, enzyme activity and nitrifying organisms in a rice–wheat cropping system. Eur J Soil Biol., 2006, 42:173-180.
- Phillips, R.P., Fahey, T.J. Tree species and mycorrhizal associations inûuence the magnitude of rhizosphere effects. Ecology, 2006, 87: 1302–1313.
- Poobathiraj, K., Palani, N., Ramesh, A.C. Influence of combining application of NPK and organic manures on soil nutrients, soil enzyme activities and plantgrowth of young Tea. J Biol Sci., 2012, 3(1): 106-111.
- Quilchano, Teodoro, M. Dehydrogenase activity in Mediterranean forest soils Biol. Fertil. Soils.,2002, 35: 102–107.
- Ramana, S., Ramesh, P., Panwar, N.R., Singh, A.B. Physiological and biochemical changes in soyabean as affected by organic, chemical and INM practices. Ind J Plant Physiol.,2008, 13: 2-4.
- Rashid, G.H., Schaefer R. Seasonal rate of nitrate reduction in two temperate forest soils” Plant Soil., 1987, 97: 291-294.
- Sebiomo, A., Ogundero, V.W. and Bankole, S.A. Effect of four herbicides on microbial population, soil organic matter and dehydrogenase activity. African J Biotechnol., 201110(5):770-778.
- Singh, R..D., Ghosh, B.N., Prakash, V., Bisht, J.K. and Gupta, H.S. Soil Management for Agricultural Production in N-W Himalayas. VPKAS, Indian Council of Agricultural Research,2000, 11
- Sinsabaugh, R.L., Hill, B.H. and Shah, J.J.F. Ecoenzymatic stoichiometry of microbial organic nutrient acquisition in soil and sediment. Nature, 2009. 462(7274):795-798
- Speir, T.W, Cowling, J.C. Phosphatase activities of pasture plants and soils: Relationship with plant productivity an soil P fertility indices. Biol. Fertil. Soils., 1991. 12: 189-194.
- Srivastava, P.K. Microbial Activity and Nutrient Status in Oak and Pine Oriented Forest Soil of Mid Altitude Central Himalaya. Geneconserve, 2010, 9: 1-11
- Ushio, B.M., KanehiroKitayama, Balser, T.C. Tree species effects on soil enzyme activities through effects on soil physicochemical and microbial properties in a tropical montane forest on Mt.Kinabalu. Pedobiologia, 2010, 53: 227–233.
- Wang, A.S., Angle, J.S., Chaney, R.L. Changes in soil biological activities under reduced soil pH during Thlaspicaerulescens phytoextraction.Soil. Biol. Biochem.,2006, 38:1451–1461.
- Wick, B., Kühne, R.F. and Vlek, P.L. Soil microbiological parameters as indicators of soil quality under improved fallow management systems in south-western Nigeria. Plant Soil, 1998, 202: 97-107.
© The Author(s) 2017. Open Access. This article is distributed under the terms of the Creative Commons Attribution 4.0 International License which permits unrestricted use, sharing, distribution, and reproduction in any medium, provided you give appropriate credit to the original author(s) and the source, provide a link to the Creative Commons license, and indicate if changes were made.