

ISSN: 0973-7510
E-ISSN: 2581-690X
Understanding the concept of symbiosis in a more localized natural selective way and optimizing for the yielding advantages of confined geography is the objective of the present study. To be more precise the aim of the study is the isolation and identification of crop specific Rhizobium strains for Arachis hypogaea from Bhadrachalam forest lands using physical, biochemical and in silico analysis. Soil samples were collected randomly from 45 different locations of Bhadrachalam forest and sown with groundnut seeds in triplets. The NPK and micronutrient levels of all the soil samples were found to be comparable. Five out of 45 samples which supported the best plant growth were taken for further investigations. Rhizobial strains from the root nodules of these five samples were isolated and maintained in pure cultures. Broths of each pure culture were inoculated on the seeds sown in sterile soil and controls were maintained. The results showed that the inoculated Rhizobia tremendously improved the plant growth when compared with control. Further phylogenetic analysis revealed that the contributing organisms were Rhizobium leguminosarum, Rhizobium trifolii, Rhizobium meliloti, Rhizobium phaseoli and Bradyrhizobium japonicum. These Rhizobial species in the pure form exhibited high rate of plant growth at lab conditions followed by improved growth in low vegetative agriculture soils of the same geography. The 16S rRNA gene sequencing revealed the fact that soil sample S3 contains abundant R. leguminosarum sp., with 99% similarity. The sample 1, 2, 4 and 5 contain abundant levels of R. trifolii, R. meliloti, R. phaseoli and B. japonicum respectively. Furthermore in silico analysis of Nif A protein revealed the underlining precursors of IAA production and nitrogenase activity. Therefore this method could be adopted for easy identification of species specific rhizobium in targeted geographies.
Rhizobacteria; Nif A; Nitrogen fixation; Indole acetic acid; Geogrphy; Arachis hypogaea.
Plant microbial association perhaps is one of the earliest relationships in the universe. Microbes irrespective of their phylogenic identity have been influencing the plant growth directly or consequentially throughout the process of evolution (Kammak FD, et al. 2015). A typically broad range of certain organisms at the vicinity of plant root, spatially inhabit the peripheral region of soil namely Rhizosphere are called Plant Growth Promoting Rhizobacteria (PGPR). Scientific history reported a numerous advantages of PGPR over plant despite of a few considerable negative impacts on plant growth and survival. One of the important and well articulated plant microbial interactions that occur exclusively in legume plants is called symbiosis. An investigation has been carried out to identify the suitable Rhizobial strains that promote plant growth specifically in Arachis hypogaea through a strategy which is not in traditional practice.
Nitrogen essentially is an important element for the survival; growth and yielding of any plant in general (Kuan KB, et al. 2016). Soil, water and sunlight are the basic requirements of any plant for survival, of which soil contributes the major proportion. Micro & macro nutrients, organic matter, trace elements are said to be the components contributing for plant growth besides microorganisms. Though a variety of organisms surrounds the plant root system the capability of promoting plant growth is limited to certain genera which are often called plant growth promoting rhizobacteria (PGPR). Microorganisms are highly specific with respect to their interaction, association and metabolism of secondary metabolites. So, the basic contribution of microorganisms for the plant growth by means of mobilizing micro, macro nutrients and secondary metabolites is precisely determined by the abundance of organisms at species level. Therefore, species specific bioinoculants are essential for the better yield of the crops. The present study involved an innovative strategy in sample selection that enabled the easy and quick identification of plant specific inoculants for Arachis hypogia.
Arachis hypogia is the legume which plays a key role in world’s agricultural economy and mainly cultivated for its vegetable oil, protein, minerals and vitamins (Krishna G, et al. 2015). Ground nut is one of the most important cash crops in India and many other parts of the world. Most of the literature reported nodulation by Rhizobia especially Bradyrhizobium sp (Chena JY, et al, 2014). On the other hand Rhizobial nodulation is highly specific at strain level sporting the fact that ranges of other Rhizobial sp. participate in nodulation based on the host plant and agro-climatic conditions.
Shelf life is one of the major limitations in the liquid bio-fertilizer application. The reasons attributed are microbial antagonism, dormancy and geographical acclimatization. A serious attempt has been made to minimize the limitations by observing and adapting the natural combination and selection method for the isolation of Rhizobium. Organisms of one geographical area are found to be positive growth promoters within its scope because of high adaptability. This raises a curtain to eco-friendly cost effective bioinoculants namely bio-geo-inoculants avoiding the greatest challenge of shelf life.
The objectives of the present study are to isolate efficient cultivable species specific rhizobacteria for Arachis hypogia within the range of Bhadrachalam forest. Evaluating the phylogenetic factors responsible by means of physical, biochemical and in silico analysis.
Sample Location
The geographical location of Bhadrachalam is 17.6688° N, 80.8936° E. Since the experiment involved in exploration of compatible strains, pure soil samples without chemical fertilizer intervention was preferred. Plants in this area are rich and healthy this might be because of high concentration of microbial biomass beside the organic content. All samples from 45 different locations of this forest have been taken for the present study.
Method of collection
Nine locations identified equidistant from single location were chosen for sample collection. Rhizosphere soils from these five spots were mixed thoroughly and made to single sample. Forty five samples were prepared in the similar fashion (Figure 1).
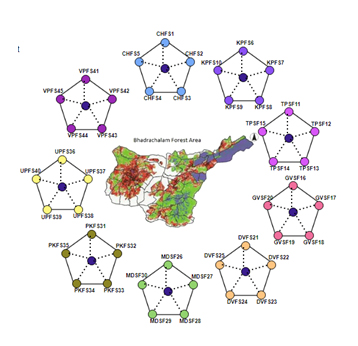
Fig. 1. Method of soil collection from Bhdrachalam forest area from 9 locations and 5 different soils with 1 km equidistance.
Soil Analysis
Total nitrogen content in the soil was estimated by alkaline potassium permanganate method (Subbaiah BV, et al. 1956). This method was used for total phosphorous content estimation Bray RH, et al. 1945. Potassium content was estimated as described in flame photo metric method (Jackson ML, et al. 1973) (Figure 2).
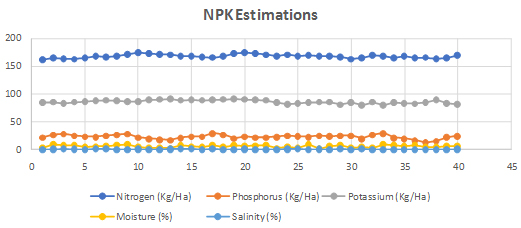
Fig. 2. Nitrogen, Phosphorous and Potassium (NPK) levels estimation in all 45 soil samples collected from Bhdrachalam forest area
Plant Physical Parameters
The groundnut plants were harvested after 21 days of seed sowing through separating of plants from soil. Shoot length, root length, root nodules, dry weight of shoots and roots were estimated. The data was analyzed statistically by MS-STATC statistical program (Figure 3). The significance of differences between mean values was evaluated by DMRT.
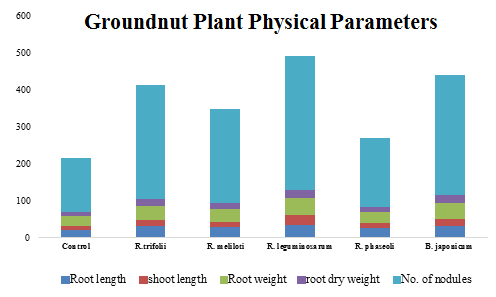
Fig. 3. Physical parameters like root length, shoot length, root weight, root dry weight and no. of nodules of the groundnut plant grown in 5 different soil samples
Rhizobial isolation
All the 45 soil samples were sown with ground nut seeds of same batch in triplets and the growth parameters were observed. To ensure the uniform germination all the seeds were soaked in water before sowing. Five soil samples out of 45 that support the best plant growth were selected for isolation of Rhizobium bacteria. The root nodules of respective plants were carefully cut and subjected to surface sterilization. The Rhizobium inside the root nodules were taken out by gentle crushing with a pestle and mortar. The crushed material was diluted serially in water up to 10-9 dilutions. One ml of diluted inoculums has been spread on YEMA medium for the isolation of Rhizobium bacteria. The prominent pink colored colonies with luxurious growth have been identified as Rhizobium and pure cultures are maintained accordingly.
Standard Inoculum Preparation
The log phase cultures of Rhizobium were taken for the preparation of standard inoculum. The seeds were treated with 1 ml of standard broth before sowing in the sterile soil for a period of 90 days.
Isolation of DNA from Root Nodules
Fresh root nodules were cut from the plant and nodules were re-hydrated in sterile distilled water and surface sterilized by immersion in 3.3% wD v Ca(OCl)2 for 3 min, rinsed in sterile water, then in absolute ethanol for 2–3 min, followed by rinsing in sterile water. And the nodules were crushed for DNA isolation as described by T. Krasova-Wade, et al. (2007). The purity and the quantity of DNA yield were estimated by spectrophotometry by using a Model Ultrospec 3000 UVD Visible Spectrophotometer (Pharmacia Biotech, Cambridge, UK) in the range 200 to 340 nm.
Gene Amplification by PCR Technique
Isolated DNA was subjected to polymerase chain reaction by using 16S rRNA primers. PCR master mix was prepared at 4oC by adding Taq buffer-5µl, 2 mM dNTP mix-5µl, forward primer and reverse primer (10 pM/µl) – 5µl each, Taq DNA polymerase 1µl, based on the concentration of DNA (spectrophotometer analysis), 4µl of DNA was added and made up the volume to 50µl by addition of DNAse free water. PCR tubes were vortex mixed gently for 5 seconds and the amplification reaction was performed in Bio-Rad thermal cycler. rRNA was amplified for 30 cycles with temperature conditions set as follows: Initial denaturation 94oC for 5 minutes, denaturation at 94oC for 20 sec, annealing at 48oC for 20 sec, extension at 72oC for 40 sec and final extension for 5 min at 72oC. Amplified PCR product was resolved in 1% agarose gel and 1542 bp amplicon was purified by Quiagen spin columns (Barlett, et al. 2003).
Gene Sequencing
To check the novelty in amplified and purified PCR product further molecular analysis of 1542 bp PCR amplicon was sequenced by using universal 16S rRNA primers. To find the regions of sequence similarity we used BLAST tool (https://blast.ncbi.nlm.nih.gov/Blast.cgi) and Ez Taxon to find the nearest taxa of Arachis hypogaea.
Soil Collection for Testing the Efficacy of Strains
Soil samples from nearby barren agriculture lands, coal and industrial effluent effected agriculture lands were collected to estimate the efficiency of standard Inoculum. Soil samples from Devanagaram, Mediceleru were categorized under barren agriculture lands while soil samples from Sarapaka, Reddypalem are considered as industrial effluent affected agriculture lands. Soils from Lakshmipuram and Kottagudem areas are coal effected samples.
Biochemical analysis
Analyses of biochemical parameters are very important to evaluate the contribution of various parameters on plant growth (Figure 4).
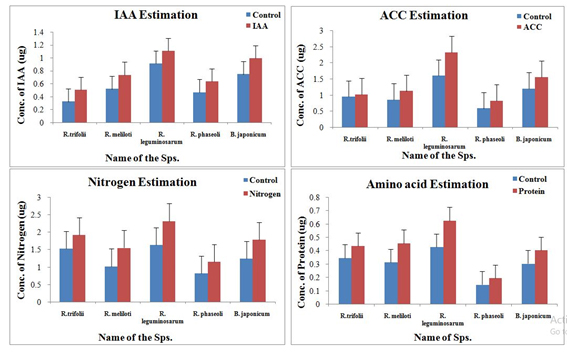
Fig. 4. Biochemical analysis of different parameters from all the five best plant growth promoting soil samples
Indole Acetic Acid (IAA) Estimation
Root nodules (weight of root nodules) were washed, surface sterilized with 70% ethyl alcohol and dried. Nodules were cut opened and incubated in 20ml of 10M EDTA for 2 hours and crushed with 70ml of cold 80% ethanol along with 80% of inhibitor. Crushed nodules were taken into a fresh tube and incubated at 4oC for 1 hour by intermittent mixing of the sample. Then the sample was filtered through a cloth, and centrifuged. For complete removal of ethanol supernatant was evaporated at 28oC until water alone remains in the sample. The left over sample is added with equal volumes of 1N NaHCo3 and acidified by addition of H2SO4 until pH reaches to 3. Acidified sample was extracted with equal volumes of peroxide free diethyl ether and this extraction was repeated for 4 times and pooled all the extracts. The sample was evaporated at 37oC and remnant was dissolved in 95% ethanol and immediately used for estimation using spectrophotometer at 540 nm. (Leveau JHJ, et al. 2005).
ACC Estimation by calorimeter/spectrophotometer
Root nodules were crushed and the collected Rhizobacteria was cultured in DF-ACC rich medium and fallowed growth in DF-ACC minimal medium (Donna M, et al. 2003). Bacterial cells were harvested by centrifugation at 8000 g for 10 minutes at 4oC. Supernatant was removed and the pellet was washed with 5ml of DF salt minimal media and centrifuged at 8000 g for 10min at 4oC. Supernatant was removed and pellet was dissolved in 7.5 ml of minimal media along with 3.0 mM ACC and incubated for 24hrs on shaking water bath at 25oC to induce ACC deaminase activity. After incubation cell samples were centrifuged at 8000g for 10min at 4oC, supernatant was discarded and the cell pellet was washed in 0.1M Tris HCl, pH-7.6 to remove the traces of media. The pellet was dissolved in 1ml of 0.1M Tris HCl, pH-7.6 and centrifuge at 16000g for 5min. Supernatant was removed and the pellet was dissolved in 600µl of 0.1M Tris-Hcl, pH-8.5 along with 30µl of toluene and vortex mixed for 30sec. some amount of the cells immediately were taken for ACC deaminase activity in duplicates by using calorimeter at 540 nm. (1st OD readings with bacterial extract, substrate). From the rest of the amount, 200µl of toulenized cells were taken in fresh tube and added with 20µl of 0.5M ACC, vortex mixed gently and incubated at 30oC for 15mins. Incubation fallows addition of 0.56M HCl, vortex mixed the sample and centrifuged at 16000rpm for 5min at RT. Collected supernatant was added with 800µl of 0.56M HCl, mixed gently, and added 300µl of 2,4-dinitrophenylhydrazine reagent, vortex mixed and incubated for 30 mins at 30oC. After incubation, the sample was added with 2N NaOH and readings were taken at 540nm in spectrophotometer. (2nd OD readings sample contains substrate, ACC, and bacterial extract) and calculated OD readings against a-ketobutyrate stock standard solution as described in the reference protocol. Stock prepared from 0.1µmol to 1µmol concentration.
Nitrogen Estimation
Root nodules extract was taken in digestion tube, which was added with 15 g of potassium sulfate, 16.7 g of potassium sulfate, 0.01 g of copper sulfate, 0.6 g of TiO2, 0.3 g of Pumice. To the same tube 20 ml of sulfuric acid was added and heated the flask at 390oC for 40 minutes to one hour. After heating cooled and diluted with 250 ml of distilled water. Distillated the flask with 75 ml of Hcl, and added with 2-3 drops of methyl red indicator. The collected distillation sample was titrated with 0.1 N NaoH until it changed color from red to yellow. Percentage of nitrogen was calculated by using the formula (Kjeldahl).
[(ml standard acid x N of acid) – (ml blank x N of base)] – (ml std base x N of base) x 1.4007
Weight of sample in grams
Amino acid Estimation (Tryptophan)
Root nodules were taken and ground in 5 ml papain solution, and then it was incubated at 65°C overnight. Cooled and centrifuged, the clear supernatant was collected and tryptophan was estimated at 545 nm according to Sadasivam S, et al. (1992).
In silico analysis Nif A protein
Primary, secondary and tertiary structure of Nif A protein analysis was done to check for structural variations. Nif A protein sequence was retrieved from Uniprot, to analyze the physical and chemical characteristics ProtParam tool was used. Secondary structural predictions of the Nif A protein was done by Chou-Fasman server (Available from: http://www.biogem.org/tool/chou-fasman/) and GOR (Garnier J, et al. 1996). The modeling of the three dimensional structure of the proteins were performed by three homology modeling programs, Phrye2 (Kelley A, et al. 2015) [24], Swissmodel (Arnold K, et al. 2006) and Modeller (Sali A, et al. 1993). Rampage server was used for the validation of 3d structure modeled by plotting Ramachandran plot (Ramachandran GN, et al. 1963), Solvent Accessible area etc
Physical, biochemical and molecular investigations revealed that the variations in the plant growth and nitrogen levels are due to diversity of Rhizobial species in soil samples. The physical parameters like root length, shoot length, root weight, root dry weight, and number of nodules shown to be highest in soil sample 3 revealing the fact that R. leguminosarum is efficient over all the other Rhizobial species isolated from respective soil samples (Figure 3).
The average production of IAA, ACC, Nitrogen, and amino acids was observed to be highest in sample 3 (Figure 4, Table 1). The sample 1, 2 and 5 were found to be containing more ACC and amino acid concentrations than the samples 4. While no significant contribution of sample 4 was observed when we estimated the concentrations of IAA, ACC, and Amino acids except for nitrogen.
Table (1):
Biochemical analysis of soil samples showing highest percentage of various growth parameters
| Soil Samples Showing Positive to Various Biochemical Tests | |||||
|---|---|---|---|---|---|
| Soil 1 | Soil 2 | Soil 3 | Soil 4 | Soil 5 | |
| IAA | ↑ | ||||
| ACC | ↑ | ↑ | ↑ | ↑ | |
| Nitrogen | ↑ | ↑ | |||
| Amino acids | ↑ | ↑ | ↑ | ↑ | |
The 16s rRNA sequence revealed that variety of Rhizobial species contributed for plant growth in each of the five selected samples with 99% similarity. Soil 3 exhibited high density of R. leguminosarum sp., while B. japonicum sp., is prominent in soil sample 5. A different species R. meliloti has been found to be in more concentration in soil sample 2. The soil sample 4 and 1 exhibited a dense population of R. phaseoli and R. trifolii respectively.
The application of the highest growth supporting and nitrogen fixing rhizobial sps., i.e. R. leguminosaram as broth inoculation has shown tremendous results in various unfertile soil samples. The highest growth has been found in industrial effluent soils when compared to barren and coal affected soil samples (Figure 5).
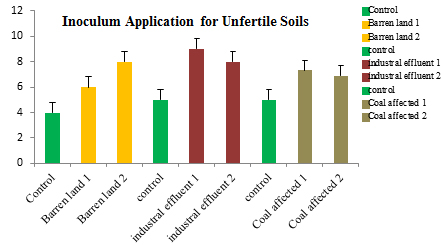
Fig. 5. Application of R. leguminosaram as broth inoculation for different unfertile soil samples
In silico analysis of primary, secondary and tertiary structures of Nif A protein revealed the structural composition. Primary structural characteristics like molecular weight, seq. length, extinction coefficient, pI value, half life, aliphatic index and gravy were tabulated in table 2. The secondary structure of Nif A protein like Alpha helix (Hh), Extended strand (Ee), and Random coil (Cc) were shown in table 3 with more coiled in nature. Nif A protein sequence retrieved from protoparm software showed the highest percentage of tryptophan amino acid when compared to the rest of amino acids (Table 4). Tertiary structures like no. of amino acid residues that were fallen in favoured region, allowed region and outlier region were plotted by a graph i.e, ramchandran plot by using rampage server (Figure 6). The comparative validation of structural design with Phyre2, Swiss and Modeller servers has been tabulated in tables 5 with 93% of allowed regions in modeller server. Out of three servers, our designed Nif A protein was proved to be more acceptable model with modellar server (Figure 7).
Table (2):
Physicochemical properties of Nif A protein.( M. wt.: Molecular weight; pI: Isoelectric point; –R: Number of negative residues; +R: Number of positive residues; EC: Extinction coefficient at 280 nm; II: Instability index; AI: Aliphatic index; GRAVY: Grand Average Hydropathy).
Name of the Organism |
M. Wt. |
Seq. Length |
pI |
EC |
EC |
Half Life (hrs) |
II |
GRAVY |
-R |
+R |
AI |
|---|---|---|---|---|---|---|---|---|---|---|---|
R. leguminosarum |
36926.3 |
343 |
8.96 |
10470 |
9970 |
20 |
30.65 |
-0.121 |
38 |
45 |
95.1 |
Table (3):
Prediction of secondary structure of Nif A by Chou-Fasman method
| R. leguminosarum | ||
|---|---|---|
| Length | Percentage (%) | |
| Alpha helix (Hh) | 165 | 48.10 |
| Extended strand (Ee) | 18 | 8.16 |
| Random coil (Cc) | 150 | 43.73 |
Table (4):
Percentage of amino acids present in Nif A protein estimated by UniProt software
S.no |
Amino acids |
R. leguminosarum |
|---|---|---|
1 |
A (Ala) |
10.1% |
2 |
R (Arg) |
7.9% |
3 |
N (Asn) |
4.7% |
4 |
D (Asp) |
5.2% |
5 |
C (Cys) |
2.6% |
6 |
Q (Gln) |
3.8% |
7 |
E (Glu) |
5.8% |
8 |
G (Gly) |
8.7% |
9 |
H (His) |
1.2% |
10 |
I (Ile) |
5.5% |
11 |
L (Lue) |
9.4% |
12 |
K (Lys) |
5.2% |
13 |
M (Met) |
0.9% |
14 |
F (Phe) |
3.8% |
15 |
P (Pro) |
10.2% |
16 |
S (Ser) |
5.8% |
17 |
T (Thr) |
5.5% |
18 |
W (Trp) |
13.5% |
19 |
Y (Tyr) |
0.9% |
20 |
V (Val) |
5.5% |
Table (5):
Ramachandran plot calculation using rampage server
| Server | Ramachandran Plot Calculation | R. leguminosarum |
|---|---|---|
| Phyre2 | No. of residues in favoured region | 92.1% |
| No. of residues in allowed region | 6.5% | |
| No. of residues in outlier region | 1.4% | |
| Swiss model | No. of residues in favoured region | 92.9% |
| No. of residues in allowed region | 6.3% | |
| No. of residues in outlier region | 0.8% | |
| Modeller | No. of residues in favoured region | 93% |
| No. of residues in allowed region | 3.7% | |
| No. of residues in outlier region | 3.4% |
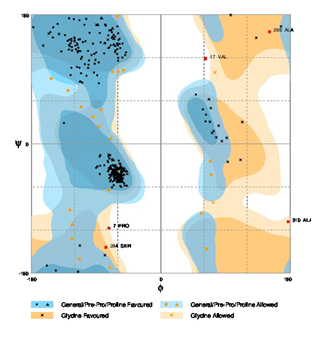
Fig. 6. Ramachandran plot for Rhizobium leguminosarum
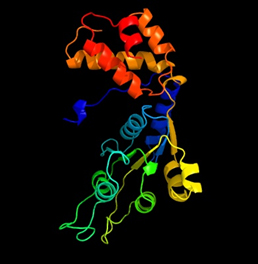
Fig. 7: In silico Nif A protein structure designed by Modeller server
Nitrogen is one of the essential components of plant for its growth and development. As nitrogen cannot be supplied to the plant directly as external source, a typical mechanism called nitrification helps plant to convert the ammonia to Nitrogen. Contribution of nitrogen to plant metabolism is considered to be more than 22-53% making it essential for survival, growth and development (University of Manoa. http://www.ctahr.hawaii.edu/mauisoil/c_nutrients01.aspx) [17]. A well established mechanism known as symbiosis in root nodule helps ammonia convert into nitrogen which is the consumable form. A variety of Rhizobium bacteria participate in root nodulation to fix the atmospheric nitrogen based on the cultivar, species and other factors like acclimatization. Nodulation is proved to be highly specific in bacterial association and precise by means of nitrogen fixing levels (MardanoVi A, et al. 1998). This indicates that, the organisms which contribute for nitrogen fixing has got tremendous importance in symbiosis.
The present investigation exposed a highly specific species of rhizobia that contributed plant growth via nitrogen fixation in 5 respective soil samples of same geographic region. Out of 45 soil samples of Bhadrachalam forest, top five plant growth promoting soils were taken for further investigation based on physical parameters. The physical characteristic feature like the type, texture, pH and humidity of these 45 soil samples were found to be similar. Micro and macro nutrient levels of all these samples are found to be almost comparable but not congruent.
Geographical acclimatization may be the reason for physical and compositional analogy of the soil samples. This infers that the growth in the top five plant growth supporting soils is due to the microbial biomass, especially nitrogen fixing bacteria which was proved by means of increased no. of root nodules and elevated levels of nitrogen content in the case of soil sample 3 by R. leguminosarum. Biochemical analysis revealed that the same sample contains highest levels of ACC, IAA, and amino acids tagging it potential growth promoting organism of all. All the five samples exhibited functional superiority in any one of the biochemical tests individually except sample 4.
To validate the efficacy of R. leguminosarum as potential inoculums log phase cultures in broth form has been applied on Arachis hypogia planted in different unfertile soil samples. Interestingly all the three unfertile soil samples namely barren lands, industrial effluent, and coal affected soils has recorded considerable plant growth when compared to their respective controls. However, the highest plant growth has been observed in the duplicates of industrial effluent soils (figure 8). Furthermore the biochemical analysis of the plants have shown increased levels of IAA, ACC, nitrogen and amino acids confirming the perpetual functional superiority of R. leguminosarum over the other strains.
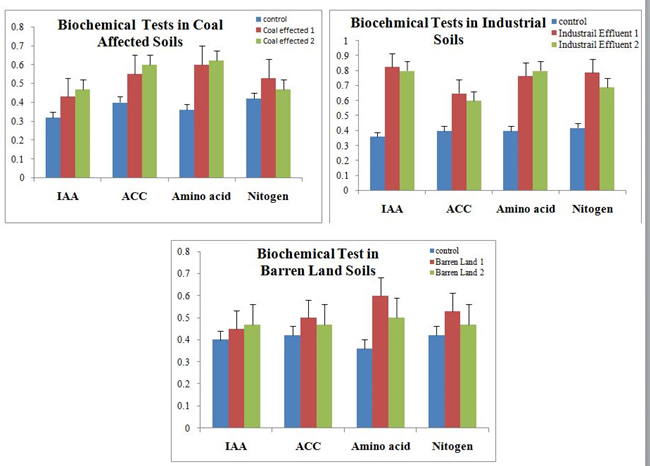
Fig. 8. Biochemical analysis for the unarrable soils
To explore the gene level facts that yielded the above results further investigation has been designed taking nitrogen concentrations and plant growth into consideration. It is known fact that nitrogenase enzyme catalyses the reduction of gaseous nitrogen to ammonia. Nitogenase enzyme sysnthesis is precursed by transcription of Nif genes which inturn synchronized by a positive regulatory protein encoded by Nif A gene. The in silico studies of Nif A revealed that the secondary structure contains elevated levels of tryptophan which correlated with the biochemical analytical results that strengthens the scientific fact behind increased plant growth.
Furthermore the production of IAA influences nif gene expression which regulates nitrogen fixation by nitrogenase enzyme (Defez et al, 2017). Literature reveals that IAA production is regulated by nodulating bacteria (R. leguminosarum in present case) (Ali B, et al. 2008). Several studies proved the effect of IAA over genes that control nitrogen fixation such as nifA, fixL and fixK2 (Bianco C, et al. 2010). Nevertheless, further in silico analysis of Nif A protein is suggested to understand the specific factors that are upregulating the nitrogenase enzyme production. Designing the quaternary structure of Nif A protein could help in achieving the further goals of the present study.
In contrast to the traditional soil selection for bio-fertilizer preparation, this method stands alone pertaining and exploring the natural combination. This method could be best employed for isolation of Novel Efficient, and Cultivable (NEC-PGPR) PGPR. Though molecular techniques like 16S rRNA gene sequence and Next Generation sequence allow to identify the total microbial population, it is not certain that all the isolated organisms are cultivable and growth promoting. This method allows identification and isolation of cultivable plant growth promoting organism very precisely in combination with the plant variety and geographical location. Though we could not obtain the novel isolates, we could identify and isolate geography (bhadrachalam forest range) specific organisms for Arachis hypogea which had highest growth potency in various unfertile soils. Furthermore we may conclude that the production of IAA influenced nif gene expression which regulated nitrogen fixation by inducing nitrogenase enzyme activity.
ACKNOWLEDGMENTS
Authors thank Dr. K. Srinivasulu, Head, Dept of Biotechnology, KL University for his support in research. Express gratitude to Dr. Vijaya Saradhi for his moral support and inspiration.
- Kammak FD, Dahmardeh M, Khammari I, Rahimian AR. The Effect of Application Type and Composition of Growth Stimulating Bacteria on Quantitative and Qualitative Characteristics of Medicinal Plant Calendula (Calendula officinallis L.). Indian journal of science and technology., 2015; 8(13). DOI: 10.17485/ijst/2015/v8i13/56934.
- Kuan KB, Othman R, Rahim KA, Shamsuddin ZH. Plant Growth-Promoting Rhizobacteria Inoculation to Enhance Vegetative Growth, Nitrogen Fixation and Nitrogen Remobilisation of Maize under Greenhouse Conditions. Plos one. 2016; 11(3): e0152478. DOI: https://doi.org/10.1371/journal.pone.0152478
- Krishna G, Singh BK, Kim E, Morya VK, Ramteke PW. Progress in genetic engineering of peanut (Arachis hypogaea L.)—A review. Plant Biotechnology Journal. 2015; 13(2):147-62. doi: 10.1111/pbi.12339
- Chena JY, Gua J, Wangb ET, Xing Xian Maa, Shi Tong Kanga, Ling Zi. Wild peanut Arachis duranensis are nodulated by diverse and novel Bradyrhizobium species in acid soils. Systematic and Applied Microbiology., 2014; 37(7):525-32. doi: 10.1016/j.syapm.2014.05.004
- Subbaiah BV, Asija GL. A rapid procedure for the estimation of available nitrogen in soil. Curr. Sci, 1956.
- Bray RH, Kurtz LT. Determination of total, organic, and available forms of phosphorus in soils. Soil Sci. 1945; 59: 39-46.
- Jackson ML. Soil Chemical Analysis, Prentice Hall of India Pvt. Ltd., New Delhi, 1973; p. 38-56.
- Krasova-Wade T, Neyra M. Optimization of DNA isolation from legume nodules. Letters in Applied Microbiology, 2007; 45:95–99.
- Barlett & Stirling. Methods in molecular biology; PCR Protocols. Humana Press. 2003.
- Leveau JHJ, Lindow SE. Utilization of the Plant Hormone Indole-3-Acetic Acid for Growth by Pseudomonas putida Strain 1290. Applied and Environmental Microbiology, 2005; 71(5): 2365-2371.
- Donna M. Penrose and Bernard R. Glick. Methods for isolating and characterizing ACC deaminase-containing plant growth-promoting rhizobacteria. Physiologia Plantarum. 2003; 118(1): 10-15. Doi: 10.1034/j.1399-3054.2003.00086.x
- Gupta V, Saharan K, Kumar L, Gupta R, Sahai V, Mittal A. Spectrophotometric Ferric Ion Biosensor From Pseudomonas fluorescens Culture. Biotechnology and Bioengineering. 2008; 100(2): 284-96.
- A guide to Kjeldahl nitrogen determination methods and apparatus. Labconco; An industry service publication.
- Sadasivam S, Manickam A. Biochemical methods for agricultural sciences. p.48 1992.
- Garnier J, Gibrat JF, Robson B. GOR method for predicting protein secondary structure from amino acid sequence. Methods Enzymol., 1996; 266: 540-53. Doi: 10.1016/S0076-6879(96)66034-0
- Kelley A, Mezulis S, Yates CM, Wass NM, Sternberg MJE. The Phyre2 web portal for protein modeling, prediction and analysis. Nature Protocols, 2015; 10: 845–858. doi:10.1038/nprot.2015.053.
- Arnold K, Bordoli L, Kopp J, Schwede T. The SWISS-MODEL workspace: a web-based environment for protein structure homology modelling. Bioinformatics. 2006; 22(2): 195-201.
- Sali A, Blundell TL. Comparative protein modelling by satisfaction of spatial restraints. J Mol Biol. 1993; 234(3):779-815.
- Ramachandran GN, Ramakrishnan C, Sasisekharan V. Stereochemistry of polypeptide chain configurations. J Mol Biol. 1963; 7: 95-9.
- University of Hawaii at Manoa. Soil nutrient management for Maui country. Available from http://www.ctahr.hawaii.edu/mauisoil/c_nutrients01.aspx.
- MardanoVi A, Samedovam A, Shirvany T. Root-shoot relationships in plant adaptation to nitrogen deficiency. Kluwer Academic Publishers, 1998; 147-154
- Pérez-Montaño F, Alías-Villegas C, Bellogín RA, del Cerro P, Espuny MR, Jiménez-Guerrero I, López-Baena FJ, OlleroT.Cubo FJ. Plant growth promotion in cereal and leguminous agricultural important plants: From microorganism capacities to crop production. Microbiological Research., 2013; 169: 325-336.
- Defez R & Andreozzi1 A, Bianco1 C. The Overproduction of Indole-3-Acetic Acid (IAA) in Endophytes Upregulates Nitrogen Fixation in Both Bacterial Cultures and Inoculated Rice Plants. Microb Ecol. 2017; 74(2):441-452. doi: 10.1007/s00248-017-0948-4.
- Ali B, Hayat S, Aiman Hasan S. A comparative effect of IAA and 4-Cl-IAA on growth, nodulation and nitrogen fixation in Vigna radiata (L.) Wilczek. Acta Physiol Plant. 2008; 30: 35–41. DOI 10.1007/s11738-007-0088-4.
- Bianco C, Defez R. Auxins upregulate nif and fix genes. Plant Signaling & Behavior. 2010; 5:10, 1290-1294.
© The Author(s) 2018. Open Access. This article is distributed under the terms of the Creative Commons Attribution 4.0 International License which permits unrestricted use, sharing, distribution, and reproduction in any medium, provided you give appropriate credit to the original author(s) and the source, provide a link to the Creative Commons license, and indicate if changes were made.