

ISSN: 0973-7510
E-ISSN: 2581-690X
Textile industries generate large volumes of dye-laden effluents that pose serious ecological and agricultural risks, particularly due to the persistence and toxicity of azo dyes. This study investigated the biodegradation potential of indigenous bacteria isolated from soils contaminated with textile effluents in the Sanganer region of Jaipur, India, and evaluated their role in mitigating dye-induced phytotoxicity. Eight bacterial isolates were morphologically and biochemically characterized, of which Pseudomonas spp. and Klebsiella spp. exhibited superior dye degradation efficiency. These isolates were assessed, both individually and as consortia, for their ability to decolorize four textile dyes: reactive red (RR), golden yellow (GY), brilliant blue (BB), and reactive orange (RO), under varying concentrations and incubation periods. Maximum degradation was achieved at a dye concentration of 10 mg L-1 and 29-30 hrs of incubation, with the 1:1 bacterial consortium showing pronounced synergistic effects. Fourier transform infrared spectroscopy confirmed the structural modification and breakdown of the dye functional groups, indicating true biodegradation rather than adsorption. Phytotoxicity assays using Zea mays demonstrated significant improvements in seed germination, seedling growth, seed vigor index, and primary metabolite content in soils treated with the bacterial consortia. Thus, this study highlights the dual potential of soil-derived bacterial consortia for efficiently bioremediating azo dyes and restoring plant growth, and supports applying them for sustainably managing dye-polluted agroecosystems.
Agricultural Risks, Biodegradation, Soil, Textile Effluents, Consortium, Plant Growth
While rapid industrialization has contributed significantly to economic growth and employment generation, it has also resulted in the release of large volumes of industrial effluents into the environment. The textile industry is a major source of environmental pollution, owing to the intensive use of synthetic dyes and auxiliary chemicals in dyeing, printing, and finishing.1 Approximately 80% of the dyes made in the world are used in the textile industry, with approximately 10%-20% of these released into the environment as effluents during their processing.2 As these dye-laden effluents are often untreated or inadequately treated before being released, particularly in developing countries, they significantly contaminate soil and water resources.3
Azo dyes represent the largest and most widely used class of textile dyes, accounting for approximately 80% of all dyes employed in the textile sector.4 They are characterized by the presence of one or more azo (–N=N–) bonds linked to aromatic rings, which impart high color intensity, stability, and resistance to light and washing.5,6 However, this structural complexity also makes azo dyes recalcitrant to natural degradation processes, and they persist in the environment longer.7 Under reductive conditions, azo dyes can be transformed into aromatic amines, which are known to be toxic, mutagenic, and carcinogenic in living organisms.8 The discharge of azo dye-contaminated effluents into agricultural soils adversely affects the physicochemical properties of the soil, including porosity, nutrient availability, and microbial diversity, ultimately reducing soil fertility and crop productivity.9 Furthermore, dye-induced oxidative stress disrupts essential physiological processes in plants, such as photosynthesis, respiration, and protein synthesis, resulting in poor seed germination, inhibited root and shoot growth, and reduced biomass accumulation.10,11 Additionally, the accumulation of dye residues and their metabolites in the soil plant system raises concerns about their entry into the food chain and the consequent risks to human health.12
Conventional physicochemical methods for dye removal, including coagulation flocculation, adsorption, oxidation, and membrane filtration, often involve high operational expenses, but offer incomplete dye removal, secondary sludge generation, and limited efficiency against complex dye structures.13 By contrast, biological treatment using microorganisms has gained attention as an eco-friendly and cost-effective alternative for the remediation of dye-contaminated environments.14 Such microbial degradation involves enzymatically transforming dye molecules into simpler and less toxic compounds through reduction, oxidation, and biosorption.15
Bacteria isolated from dye-contaminated soils are particularly promising for bioremediation applications, as the prolonged exposure to xenobiotic compounds enables them to develop adaptive metabolic pathways and inducible enzyme systems capable of dye degradation.16 Enzymes such as azoreductases, laccases, peroxidases, and oxygenases are crucial for cleaving azo bonds and subsequently breaking down aromatic intermediates.17 Several bacterial genera, including Pseudomonas, Bacillus, Klebsiella, Enterobacter, Acinetobacter, and Aeromonas, have been reported to degrade azo dyes efficiently under aerobic, anaerobic, or sequential conditions.18 In addition to dye degradation, many soil-derived bacteria exhibit plant growth–promoting characteristics, such as nutrient solubilization, enhancing soil microbial activity, and alleviating stress conditions in plants.19 These bacteria can indirectly promote seed germination, seedling establishment, and primary metabolic activities in plants cultivated under dye stress by detoxifying dye-contaminated soils and improving the rhizospheric environment.20 Thus, microbial remediation strategies offer the dual benefit of detoxifying the environment and supporting sustainable agriculture.
Considering the severe ecological and human health risks linked to azo dye pollution and the shortcomings of conventional physicochemical treatments, this study explored a comprehensive biological remediation strategy. Bacterial strains were isolated from textile dye-contaminated soil and wastewater, and characterized morphologically and biochemically. The dye degradation potential of individual bacterial isolates and selected bacterial consortia was systematically evaluated against four commonly used textile dyes, i.e., reactive red (RR), golden yellow (GY), brilliant blue (BB), and reactive orange (RO), for a wide range of concentrations and incubation periods. The influence of physicochemical parameters, such as dye concentration, pH, incubation time, and inoculum ratio, on decolorization efficiency was also assessed. The degradation products were characterized using Fourier Transform Infrared (FTIR) spectroscopy to confirm the structural modifications in the dye molecules. Phytotoxicity studies were conducted using Zea mays under controlled conditions to assess the environmental relevance of bacterial dye degradation. The effects of bacterial consortia on dye-treated soil were evaluated by comparing the seed germination percentage, root and shoot growth, and seed vigor index (SVI) with the values obtained under untreated control conditions. In addition, the impact of dye degradation on the metabolic status of plants was examined by estimating the primary metabolites, including proteins, total soluble sugars, and starch. This study thus demonstrated the potential of indigenous bacterial strains and their consortia as effective biocatalysts for bioremediating azo dyes and as eco-friendly tools for mitigating dye-induced phytotoxicity by integrating microbiological characterization, dye degradation efficiency, metabolite profiling, and plant growth responses, thereby supporting the sustainable management of dye-polluted agroecosystems.
Study area and sample collection
Soil samples were collected from four locations affected by textile effluents in the Sanganer region of Jaipur in Rajasthan, India: Govindpura, Gular ka Bandha, Baksawala, and Asawala. These sites are situated near textile dyeing and printing industries and were selected because of their continued exposure to untreated or partially treated textile effluents. The samples were aseptically collected in sterile containers and transported to the laboratory for microbiological and physicochemical analyses.
Isolation of bacteria
The bacteria were isolated using the serial dilution technique. A nutrient agar (NA) medium was prepared and sterilized by autoclaving at a pressure of 103.42 kPa for 15-20 min along with Petri dishes and glassware. Subsequently, it was poured into sterile plates and allowed to solidify. One gram of soil from each sampling site was suspended in 10 mL sterile distilled water and homogenized by vortexing. The resulting suspensions were serially diluted to 10-6, and 1 mL aliquots were aseptically spread onto NA plates using a sterile L-shaped glass rod. The plates were incubated at 37 °C for 24 hrs. After incubation, morphologically distinct bacterial colonies were selected, purified through repeated streaking, and preserved at 4 °C for subsequent biochemical identification and dye degradation studies.
Biochemical identification of bacterial isolates
The bacterial isolates were identified based on Gram staining and a series of biochemical tests, following standard microbiological protocols and Bergey’s Manual of Determinative Bacteriology. Gram staining was performed on freshly grown bacterial cultures. Smears were prepared, air-dried, heat-fixed, and sequentially stained with crystal violet, Gram’s iodine, 95% ethyl alcohol, and safranin. The slides were examined under a compound microscope at 10× to 40× magnification. Gram-positive bacteria appeared blue-violet, whereas Gram-negative bacteria appeared red or pink.
Catalase activity was determined by adding 3-4 drops of 3% hydrogen peroxide directly onto the bacterial growth on NA slants incubated at 37 °C for 24 hrs, with immediate bubble formation indicating a positive catalase reaction. Oxidase activity was assessed using Kovacs oxidase reagent; the development of a dark blue coloration within 5-10 sec indicated a positive reaction. Indole production was evaluated by inoculating bacterial isolates into a tryptone broth, incubating it at 37 °C for 48 hrs, and adding Kovacs reagent. The formation of a cherry-red ring indicated a positive indole test.
Citrate utilization was tested using Simmons citrate agar and indicated by a color change from green to blue in the inoculated slants, which were incubated at 37 °C for 48 hrs. We also tested for carbohydrate fermentation using a glucose fermentation broth containing a bromocresol purple indicator, whose color changed from purple to yellow after incubation at 37 °C for 48 hrs to indicate acid production. Methyl red (MR) and Voges–Proskauer (VP) tests were performed using MR–VP broth. The MR test is deemed positive if adding methyl red results in a stable red color, whereas acetoin production was detected through the VP test using Barritt’s Reagents A and B. Triple Sugar Iron (TSI) agar was used to determine the carbohydrate utilization patterns, gas production, and hydrogen sulfide formation based on slant/butt color changes, gas bubbles, or black precipitate formation after incubation at 35-37 °C for 18-24 hrs.
Dye degradation experiments
A nutrient broth medium without agar was prepared and used in all experiments. The bacterial isolates were inoculated separately into 30 mL of nutrient broth containing dyes at concentrations ranging from 10-1200 mg L-1 to facilitate the individual dye degradation studies. An uninoculated dye-containing broth served as the control. The cultures were incubated at 37 °C, and the dye decolorization was quantified spectrophotometrically. The two bacterial isolates displaying the highest dye degradation efficiency were combined in ratios of 1:1, 0.5:0.5, and 0.25:0.75 for consortium studies. The selected dye concentrations were added to the nutrient broth and inoculated into the bacterial consortia. The flasks were incubated at 37 °C for 24 hrs, and the absorbance was recorded at 600 nm at hourly intervals. The percentage decolorization was calculated using the formula:
Decolorization (%) = (B – A) / B × 100
where B represents the initial absorbance and A represents the absorbance after degradation.
Effect of physicochemical parameters and metabolite characterization
The influences of physicochemical parameters, including the dye concentration, pH, and incubation time, on dye decolorization were evaluated. The decolorization efficiency was monitored at hourly intervals after 24 hrs of incubation. The degradation products were characterized using FTIR and UV-Visible spectroscopy. The dried degradation products were mixed with KBr and analyzed using a Shimadzu IR Affinity-1 FTIR spectrometer at a resolution of 4 cm-1 for FTIR analysis. UV-visible spectra of the culture supernatants were recorded between 200 and 700 nm at fixed time intervals to monitor dye degradation.
Plant morphological analysis
The effects of the bacterial consortia on plant growth were evaluated using Z. mays (maize) and Vigna radiata (mung), whose seeds were surface sterilized by washing with 20% Extran® solution and then rinsing with distilled water. The seeds were further sterilized using 0.1% HgCl2 under a laminar airflow, and thoroughly rinsed thereafter with distilled water. Once sterilized, the seeds were soaked in distilled water for 18 hrs and then treated with the nutrient broth containing the most efficient bacterial consortium for 5 min. Meanwhile, the control seeds were treated with distilled water. Both treated and untreated seeds were sown in Styrofoam cups containing autoclaved soil and incubated in a growth chamber under controlled conditions (26 ± 1 °C, 16/8 hrs light/dark cycle) for 30 days. After 30 days, the seed germination percentage, shoot length, root length, fresh weight, dry weight, and SVI were recorded, with the SVI calculated as:
SVI = Seedling length (cm) × Germination percentage / 100.
Estimation of primary metabolites
The protein content was determined using the method proposed by Lowry et al. following the extraction described by Osborne.21,22 Briefly, 50 mg of each sample was homogenized in chilled 10% trichloroacetic acid (TCA) and incubated at 4 °C for 24 hrs. The pellet obtained after centrifugation was treated with 5% TCA, heated at 80 °C for 30 min, washed with deionized water, and dissolved in 1 N NaOH. Protein estimation was performed using the Folin–Ciocalteu reagent, and the absorbance was measured at 750 nm. Bovine serum albumin (0.1-0.8 mg mL-1) was used to generate a standard curve.
Total soluble sugars were estimated using the phenol–sulfuric acid method after extraction with 80% ethanol.23,24 Approximately 0.05 g of each sample was homogenized in ethanol and centrifuged, and the supernatant was used for analysis. One milliliter of the extract was made to react with 5% phenol and concentrated sulfuric acid, incubated at 26-30 °C for 20 min, and the absorbance was recorded at 490 nm. Glucose (0.1-0.8 mg mL-1) served as the standard.
The starch content was estimated from the ethanol-insoluble residue obtained after soluble sugar extraction using the DuBois method.23 The pellet remaining after extraction with 80% ethanol was hydrolyzed with 52% perchloric acid, and centrifuged to obtain the starch-containing supernatant. A 1 mL aliquot of the extract was made to react with 5% phenol and concentrated sulfuric acid, incubated at 26-30 °C for 20 min, and the absorbance was measured at 490 nm using a spectrophotometer. We calculated the starch concentration from a glucose standard curve and expressed it in mg g-1 fresh weight.
Statistical analysis
All experiments were conducted in triplicate, and the results were expressed as mean ± standard error (SE). The experimental data were subjected to statistical analysis to evaluate the significance of the differences between the treatments. One-way analysis of variance (ANOVA) was performed using SPSS statistical software (version 27; IBM Corp., Armonk, NY, USA) to determine the effects of different treatments, dye concentrations, incubation times, bacterial isolates, and bacterial consortia on dye degradation efficiency, plant growth parameters, and biochemical attributes. When ANOVA indicated statistically significant differences among treatment means (P £ 0.05), post hoc mean separation was conducted using Duncan’s multiple range test (DMRT) to identify the differences between individual treatments, with those sharing the same superscript letters not considered significantly different. By contrast, treatments with different superscript letters differed significantly at the 5% probability level. The data were graphically represented using the OriginPro software (version 8.5; OriginLab Corporation, Northampton, MA, USA). We plotted bar graphs using the mean values, with error bars representing the standard error, which facilitated clearly visualizing and comparing treatment effects across different experimental conditions.
Morphological, gram reaction, and identification of bacterial isolates
Eight bacterial isolates were obtained from the soil samples collected from the four sites (Figure 1). Preliminary characterization based on Gram staining and cell morphology revealed that all isolates were Gram-negative, indicating the dominance of Gram-negative bacterial populations in contaminated soil environments (Table 1). Morphological examination revealed that the isolates exhibited two major cell forms: rods and cocci. The rod-shaped bacteria were associated with isolates identified as Pseudomonas and Klebsiella, whereas the coccoid forms were related to Acinetobacter. Specifically, the isolates B-3 and B-4 obtained from the Asawala soil were Gram-negative rods and were identified as P. aeruginosa. Similarly, the isolate B-7 from the Baksawala soil exhibited a Gram-negative rod morphology and was identified as Pseudomonas. By contrast, the isolates B-8, B-11, B-12, and B-15, collected from Baksawala, Gular ka Bandha, and Govindpura, respectively, were Gram-negative cocci and were tentatively identified as Acinetobacter. The isolate B-16 from Govindpura was a Gram-negative rod identified as Klebsiella.
Table (1): Morphological, Gram reaction, and tentative identification of bacterial isolates obtained from different soil sampling sites
| Sample source | Bacterial isolate | Gram reaction | Cell morphology | Identification |
|---|---|---|---|---|
| Asawala soil | B-3 | Gram-negative | Rod | P. aeruginosa |
| B-4 | Gram-negative | Rod | P. aeruginosa | |
| Baksawala soil | B-7 | Gram-negative | Rod | Pseudomonas species |
| B-8 | Gram-negative | Cocci | Acinetobacter species | |
| Gular soil | B-11 | Gram-negative | Cocci | Acinetobacter species |
| B-12 | Gram-negative | Cocci | Acinetobacter species | |
| Govindpura soil | B-15 | Gram-negative | Cocci | Acinetobacter species |
| B-16 | Gram-negative | Rod | Klebsiella species |
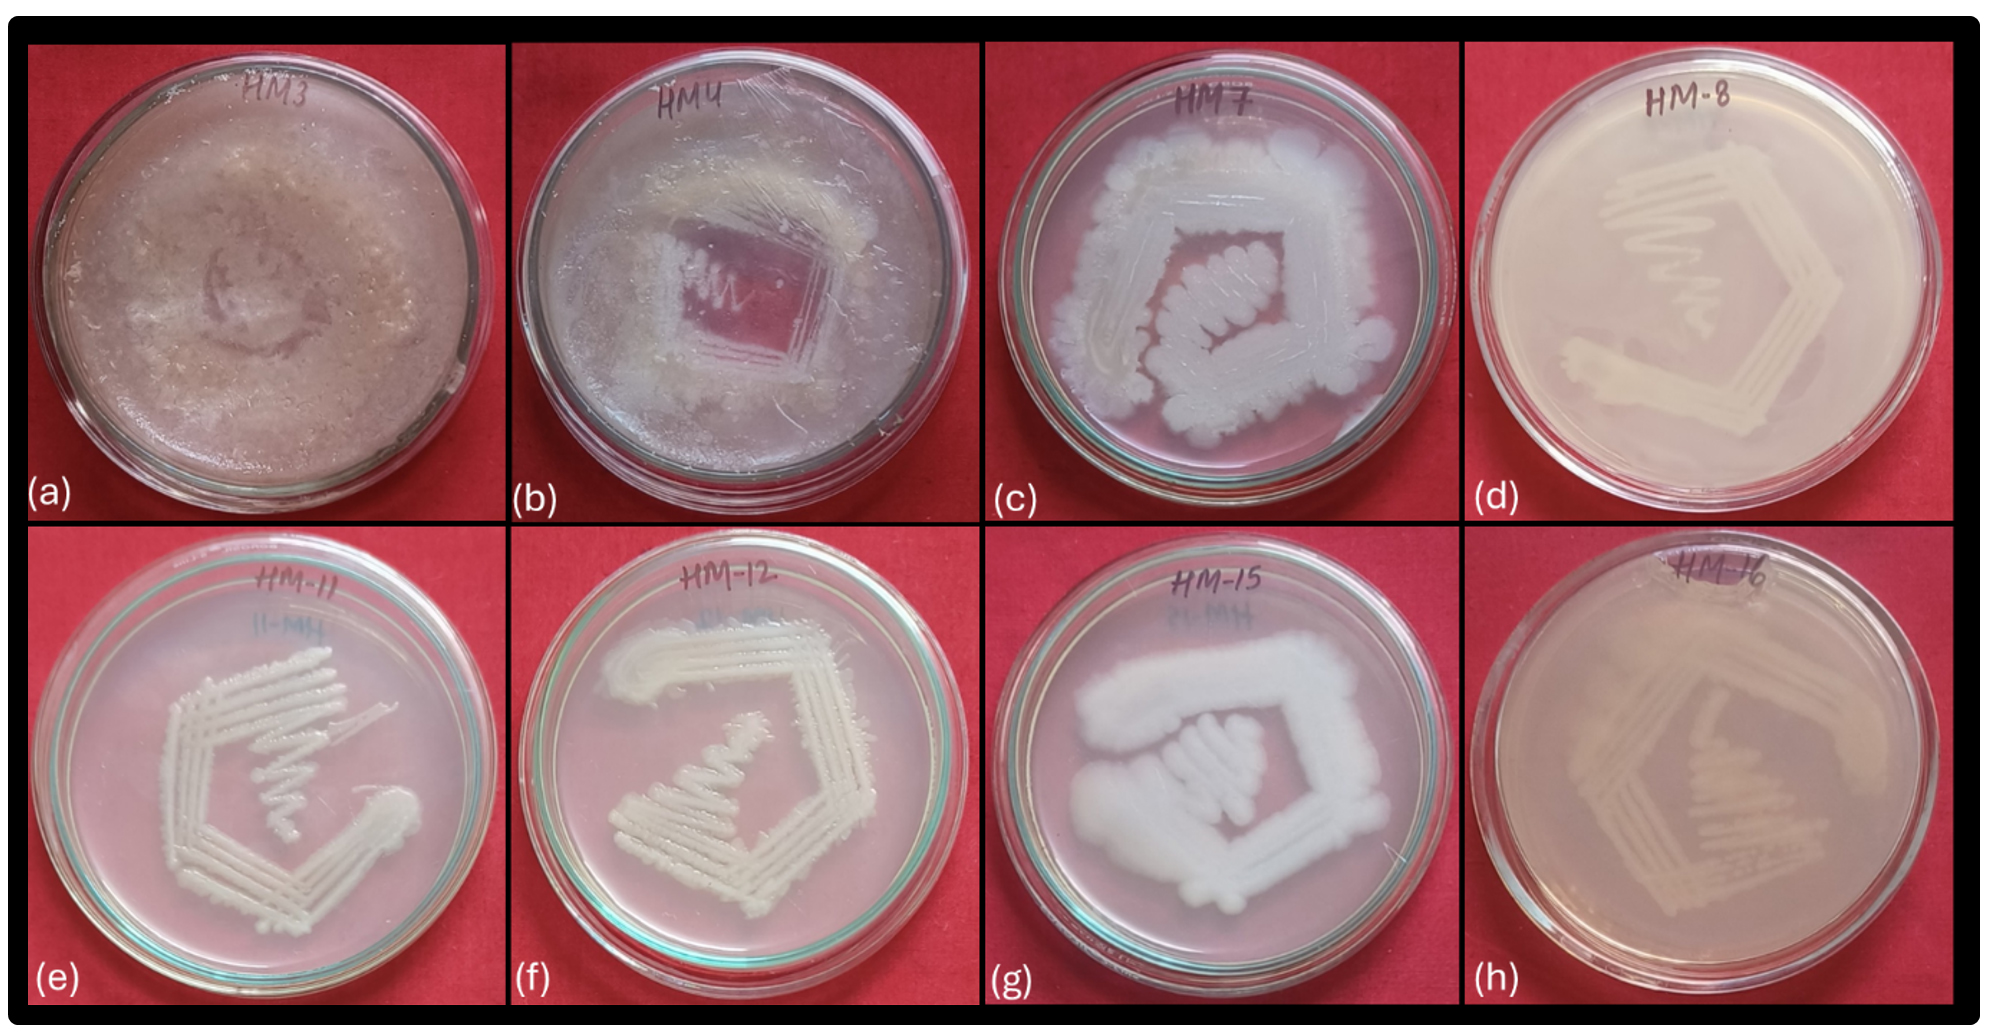
Figure 1. Morphological characteristics of bacterial isolates grown on nutrient agar plates. Panels (a-h) represent isolates B-3, B-4, B-7, B-8, B-11, B-12, B-15, and B-16
Biochemical characterization of bacterial isolates
All isolates showed a positive catalase reaction, indicating their ability to decompose hydrogen peroxide and suggesting an aerobic or facultative aerobic mode of metabolism. The oxidase test differentiated the isolates into two distinct groups. The isolates B-3, B-4, B-7, and B-16 were oxidase-positive, whereas B-8, B-11, B-12, and B-15 were oxidase-negative. This distinction is characteristic of Pseudomonas and Klebsiella, which are oxidase-positive, whereas Acinetobacter are typically oxidase-negative.
The indole test results were negative for all the isolates, indicating that tryptophan did not degrade to indole. Similarly, the methyl red test was negative for most isolates except B-3, B-4, and B-7, suggesting a variability in the acid production during glucose fermentation among the isolates. The VP test was positive only for B-16, indicating acetoin production and supporting its differentiation from the remaining isolates.
All isolates demonstrated citrate utilization, reflecting their ability to use citrate as the sole carbon source. By contrast, the nitrate reduction test was negative for all isolates, indicating no nitrate-reducing activity occurred under the experimental conditions. The carbohydrate fermentation test showed positive reactions for B-3, B-4, B-11, and B-16, whereas B-7, B-8, B-12, and B-15 were non-fermentative. Starch hydrolysis activity was observed in B-3, B-4, and B-7, indicating that they produced extracellular amylase enzymes, whereas the remaining isolates did not exhibit starch-degrading capability (Figure 2).
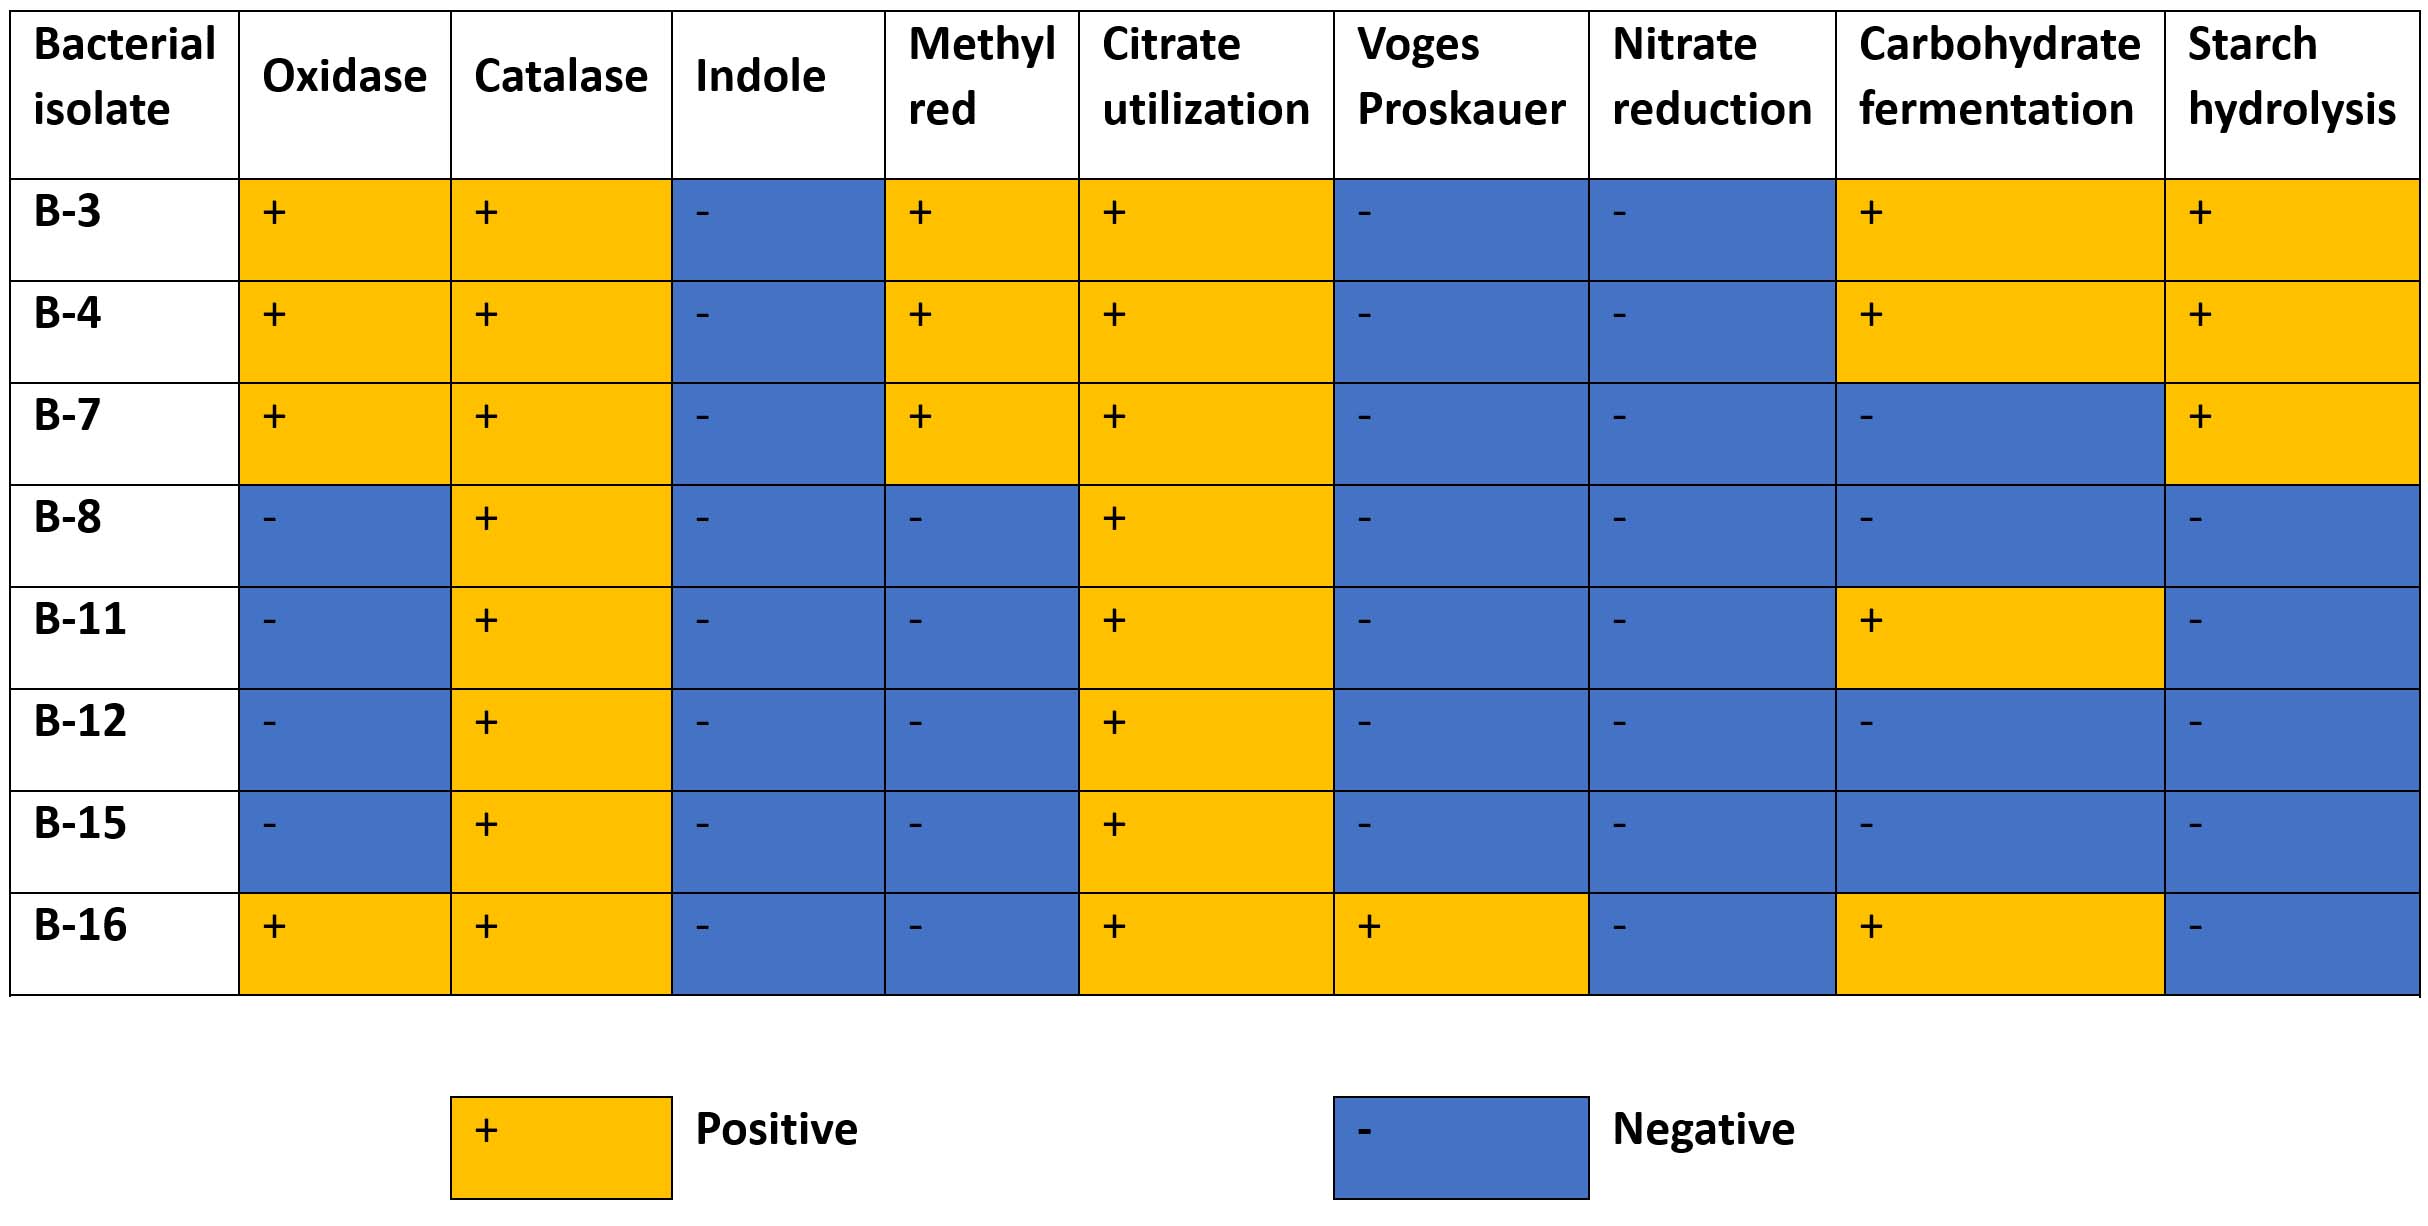
Figure 2. Biochemical characterization of bacterial isolates based on oxidase, catalase, indole, methyl red, citrate utilization, Voges–Proskauer, nitrate reduction, carbohydrate fermentation, and starch hydrolysis tests
Impact of dye concentration on degradation efficiency
The dye degradation potential of three selected bacterial isolates (B-7, B-8, and B-16) originally isolated from the dye-polluted soil was evaluated at varying dye concentrations (10–1200 mg) using the four synthetic dyes RR, GY, BB, and RO. The degradation efficiency was expressed as percentage decolorization (mean ± SE), as presented in Table 2.
Table (2): Percentage degradation of different dyes by bacterial isolates B7, B-8, and B16 at varying dye concentrations
| Concen. | Dye | Dye degradation by isolate (%) | ||
|---|---|---|---|---|
| B7 | B-8 | B16 | ||
| 10 mg | RR | 56.5 ± 0.6a | 55.7 ± 1.3ab | 60.8 ± 0.8ab |
| GY | 53.0 ± 0.5ab | 50.1 ± 0.6ab | 56.4 ± 0.9b | |
| BB | 46.0 ± 0.7b | 51.4 ± 1.4a | 48.6 ± 0.6c | |
| RO | 59.4 ± 0.5a | 40.0 ± 0.9b | 64.1 ± 1.1a | |
| 20 mg | RR | 30.6 ± 1.2b | 31.8 ± 0.8c | 52.3 ± 0.7b |
| GY | 33.2 ± 1.3b | 51.5 ± 1.1b | 60.8 ± 0.8a | |
| BB | 47.2 ± 0.6a | 48.6 ± 1.0a | 50.1 ± 0.7b | |
| RO | 11.1 ± 0.9c | 48.0 ± 1.1c | 63.1 ± 0.9a | |
| 40 mg | RR | 23.4 ± 0.4b | 30.7 ± 0.6ab | 32.7 ± 1.1b |
| GY | 50.8 ± 1.0a | 48.3 ± 0.8b | 55.8 ± 0.8a | |
| BB | 25.7 ± 0.7b | 28.1 ± 0.7b | 32.1 ± 0.4b | |
| RO | 22.1 ± 1.0b | 39.1 ± 0.9a | 41.6 ± 0.7b | |
| 100 mg | RR | 26.9 ± 0.7a | 21.7 ± 0.9b | 23.5 ± 0.5b |
| GY | 53.3 ± 0.6a | 47.6 ± 0.4b | 53.7 ± 1.1a | |
| BB | 10.4 ± 0.9b | 7.1 ± 0.6b | 11.6 ± 1.4c | |
| RO | 19.3 ± 0.6b | 12.3 ± 1.1b | 18.0 ± 0.6bc | |
| 200 mg | RR | 17.1 ± 0.7b | 19.3 ± 0.9a | 20.1 ± 1.1b |
| GY | 24.6 ± 0.6a | 8.9 ± 0.8c | 16.3 ± 0.9b | |
| BB | 6.4 ± 0.9c | 7.9 ± 0.6a | 5.0 ± 1.0c | |
| RO | 11.4 ± 0.7b | 21.1 ± 1.2a | 10.2 ± 0.8a | |
| 400 mg | RR | 11.8 ± 0.9b | 13.4 ± 0.6ab | 14.8 ± 0.8a |
| GY | 18.7 ± 0.7a | 16.9 ± 1.1a | 17.4 ± 0.9a | |
| BB | 2.9 ± 0.6c | 3.8 ± 0.9a | 3.3 ± 0.8c | |
| RO | 9.6 ± 0.7b | 10.7 ± 0.9b | 10.4 ± 0.9b | |
| 600 mg | RR | 10.6 ± 0.8a | 0.5 ± 0.5b | 11.2 ± 1.0b |
| GY | 1.8 ± 0.8c | 2.7 ± 1.0a | 1.1 ± 0.8c | |
| BB | 3.4 ± 0.7b | 1.8 ± 0.7a | 2.2 ± 1.2c | |
| RO | 18.1 ± 0.8a | 10.2 ± 1.1b | 12.4 ± 1.0a | |
| 800 mg | RR | 11.5 ± 0.6a | 10.6 ± 0.9a | 10.3 ± 0.9a |
| GY | 3.3 ± 0.7c | 4.4 ± 1.2a | 2.3 ± 0.8c | |
| BB | 2.3 ± 0.6c | 2.8 ± 0.9b | 3.1 ± 1.0c | |
| RO | 9.1 ± 1.2b | 7.9 ± 1.2c | 14.3 ± 0.8b | |
| 1200 mg | RR | 9.5 ± 0.9a | 10.1 ± 1.0a | 8.8 ± 0.7a |
| GY | 2.7 ± 0.9c | 2.2 ± 1.0a | 4.7 ± 0.9b | |
| BB | 2.0 ± 0.8c | 2.0 ± 0.9a | 1.7 ± 0.7c | |
| RO | 7.0 ± 1.2b | 12.8 ± 0.8a | 10.4 ± 1.3a | |
RR = Reactive Red, GY = Golden Yellow, BB = Brilliant Blue, RO = Reactive Orange; values are mean ± SE, and different superscript letters within a row indicate significant differences (P £ 0.05)
All three isolates exhibited substantial degradation activity for all dyes at the lowest dye concentration (10 mg). Among them, B-16 demonstrated the highest degradation efficiency, particularly for RO (64.08% ± 1.05%), followed by B-7 (59.42% ± 0.52%) and B-8 (40.00% ± 0.93%). Similar trends were observed for RR and GY, whereas BB exhibited comparatively lower degradation, indicating its more recalcitrant nature. As the dye concentration was increased to 20 and 40 mg, a noticeable decline in degradation efficiency was observed for all isolates. However, B-16 consistently demonstrated a higher degradation capability, especially for RO and GY, suggesting its superior metabolic adaptability and tolerance to increased dye stress. By contrast, the degradation efficiency of B-7 and B-8 declined more steeply, particularly for RR and BB. At moderate to high concentrations (100-200 mg), the degradation efficiency decreased sharply for all dyes and isolates. BB exhibited the greatest resistance to degradation, with efficiencies below 12% in most cases. Despite this decline, B-16 maintained a comparatively high RO and GY degradation percentages, highlighting its enhanced tolerance to dye toxicity.
Increasing the dye concentration further to 400-800 mg resulted in notably reduced degradation activity, with efficiencies generally below 20% for all dyes. At these concentrations, bacterial metabolic activity was strongly inhibited. However, B-16 continued to outperform B-7 and B-8, particularly in degrading RO. At the highest concentration tested (1200 mg), the degradation efficiency was minimal for all isolates and dyes, indicating the severe inhibitory effects of elevated dye levels. Even under these conditions, B-16 exhibited a relatively higher degradation of RO and GY than the other isolates (Figure 3).
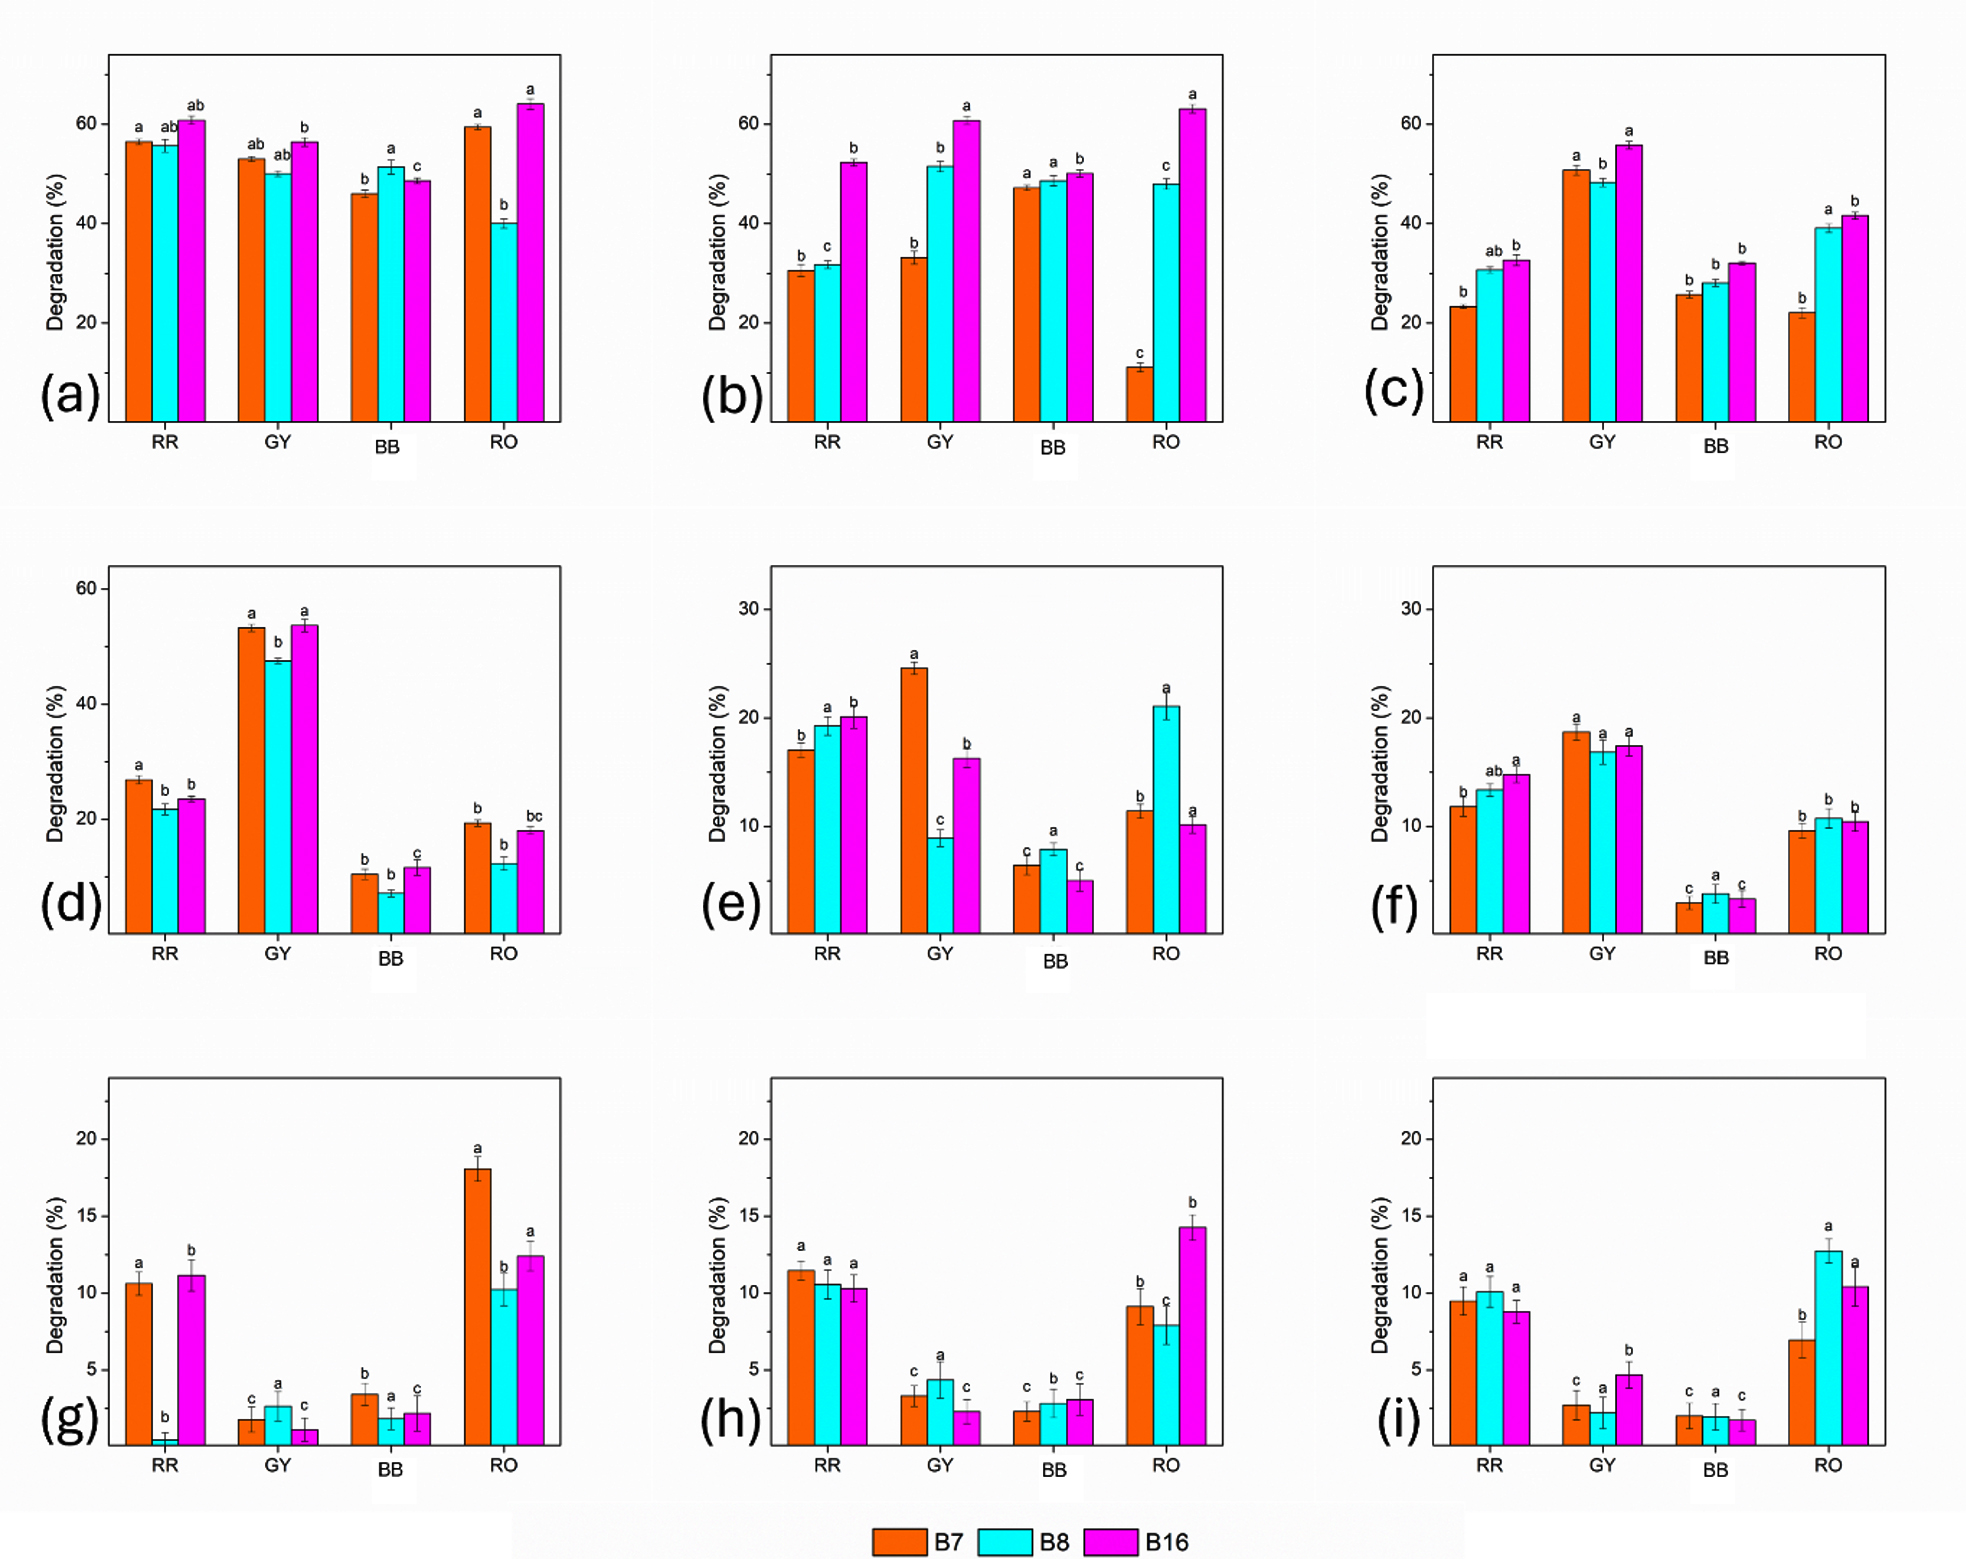
Figure 3. Comparative dye degradation efficiency of bacterial isolates B7, B-8, and B16 at different dye concentrations: (a) 10 mg, (b) 20 mg, (c) 40 mg, (d) 100 mg, (e) 200 mg, (f) 400 mg, (g) 600 mg, (h) 800 mg, and (i) 1200 mg. Bars represent mean values with standard error, and different letters indicate statistically significant differences among treatments (P < 0.05)
The results demonstrate that dye degradation efficiency decreased with increasing dye concentration, irrespective of the bacterial isolate. Among the isolates derived from polluted soil, B-16 (Klebsiella spp.) consistently showed the highest degradation potential across all dyes and concentrations, followed by B-7 (Pseudomonas spp.), whereas B-8 (Acinetobacter spp.) exhibited the lowest degradation efficiency. Across most concentrations, the order of dye degradation was RO > GY > RR > BB.
Impact of incubation time on dye degradation
The impact of incubation time on dye degradation efficiency was evaluated for three bacterial isolates (B-7, B-8, and B-16) over a period of 24-30 hrs. The degradation efficiency increased progressively with incubation time for all dyes and isolates (Table 3).
Table (3): Effect of incubation time on dye degradation efficiency of bacterial isolates
| Incubation Time (hrs) | Dye | Dye degradation by isolate (%) | ||
|---|---|---|---|---|
| B7 | B8 | B16 | ||
| 24 | RR | 56.5 ± 0.6e | 55.7 ± 0.3d | 60.8 ± 0.8f |
| GY | 53.0 ± 0.5f | 50.1 ± 0.6f | 56.4 ± 0.9f | |
| BB | 46.0 ± 0.7g | 51.4 ± 1.4d | 48.6 ± 0.6f | |
| RO | 59.4 ± 0.5f | 40.0 ± 0.9f | 64.1 ± 1.1f | |
| 25 | RR | 59.1 ± 0.5d | 58.1 ± 1.3cd | 63.7 ± 0.8e |
| GY | 55.6 ± 0.5e | 52.4 ± 0.5e | 59.0 ± 0.8e | |
| BB | 48.6 ± 0.7f | 54.1 ± 1.4cd | 51.5 ± 0.5e | |
| RO | 62.2 ± 0.5e | 43.2 ± 0.9e | 66.7 ± 1.0e | |
| 26 | RR | 61.5 ± 0.5c | 60.9 ± 1.2c | 66.4 ± 0.7d |
| GY | 58.4 ± 0.5d | 55.1 ± 0.5d | 61.7 ± 0.8d | |
| BB | 51.4 ± 0.7e | 57.3 ± 1.3c | 54.3 ± 0.5d | |
| RO | 65.0 ± 0.5d | 46.8 ± 0.9d | 69.5 ± 1.0d | |
| 27 | RR | 64.1 ± 0.5bc | 63.8 ± 1.2b | 69.5 ± 0.7c |
| GY | 61.5 ± 0.4c | 58.3 ± 0.5c | 64.4 ± 0.8c | |
| BB | 54.6 ± 0.7d | 60.8 ± 1.3b | 57.4 ± 0.5c | |
| RO | 68.2 ± 0.5c | 50.9 ± 0.9c | 72.4 ± 1.0c | |
| 28 | RR | 66.4 ± 0.5b | 66.7 ±1.2a | 72.9 ± 0.7b |
| GY | 64.8 ± 0.4b | 61.7 ± 0.5b | 67.1 ± 0.8a | |
| BB | 57.9 ± 0.7c | 64.2 ± 1.3ab | 60.6 ± 0.5b | |
| RO | 71.1 ± 0.5b | 55.3 ± 0.8b | 75.6 ± 0.9b | |
| 29 | RR | 69.2 ± 0.5a | 66.7 ± 1.2a | 76.1 ± 0.7ab |
| GY | 68.3 ± 0.4a | 64.9 ± 0.5ab | 67.1 ± 0.8a | |
| BB | 61.5 ± 0.6b | 67.6 ± 1.2a | 64.1 ± 0.5a | |
| RO | 74.3 ± 0.5a | 59.7 ± 0.8a | 78.9 ± 0.9ab | |
| 30 | RR | 69.2 ± 0.5a | 66.7 ± 1.2a | 79.2 ± 0.7a |
| GY | 68.3 ± 0.4a | 68.2 ± 0.5a | 67.0 ± 0.8a | |
| BB | 65.4 ± 0.6a | 67.6 ± 1.2a | 64.1 ± 0.5a | |
| RO | 74.3 ± 0.5a | 59.7 ± 0.8a | 82.4 ± 0.9a | |
RR = Reactive Red, GY = Golden Yellow, BB = Brilliant Blue, RO = Reactive Orange; values are mean ± SE, and different superscript letters within a row indicate significant differences (P £ 0.05)
After 24 hrs of incubation, moderate degradation was observed in all dyes. Among the isolates, B-16 showed the highest initial degradation efficiency, particularly for RO (64.08%) and RR (60.81%), whereas B-8 showed a comparatively lower degradation efficiency, especially for RO (40.00%). BB exhibited the lowest degradation values among all isolates at this early stage, indicating its relatively greater recalcitrance. When incubation time was increased from 25 to 27 hrs, a consistent and gradual increase in degradation efficiency was recorded for all dyes and isolates. RO displayed the most observable increase, followed by RR and GY, whereas BB exhibited a slower but steadier increase. Throughout this period, B-16 consistently outperformed B-7 and B-8, suggesting its superior metabolic activity and dye-transforming capability. At 28 and 29 hrs, the degradation efficiencies reached substantially higher levels. For RO, the degradation by B-16 increased to 75.6% and 78.9%, respectively, whereas B-7 and B-8 achieved lower and higher values, respectively. A similar trend was observed for RR and GY. BB degradation also improved during this phase, although it remained lower than that of the azo dyes. The highest degradation efficiencies were recorded for all dyes at a maximum incubation time of 30 hrs. RO exhibited the highest overall degradation, with B-16 achieving 82.4%, followed by B-7 (74.25%) and B-8 (59.7%). For RR, degradation reached 79.2% with B-16, whereas GY and BB showed comparatively lower but significant degradation levels. Across all incubation periods, B-8 consistently showed the lowest degradation efficiency among the three isolates (Figure 4).
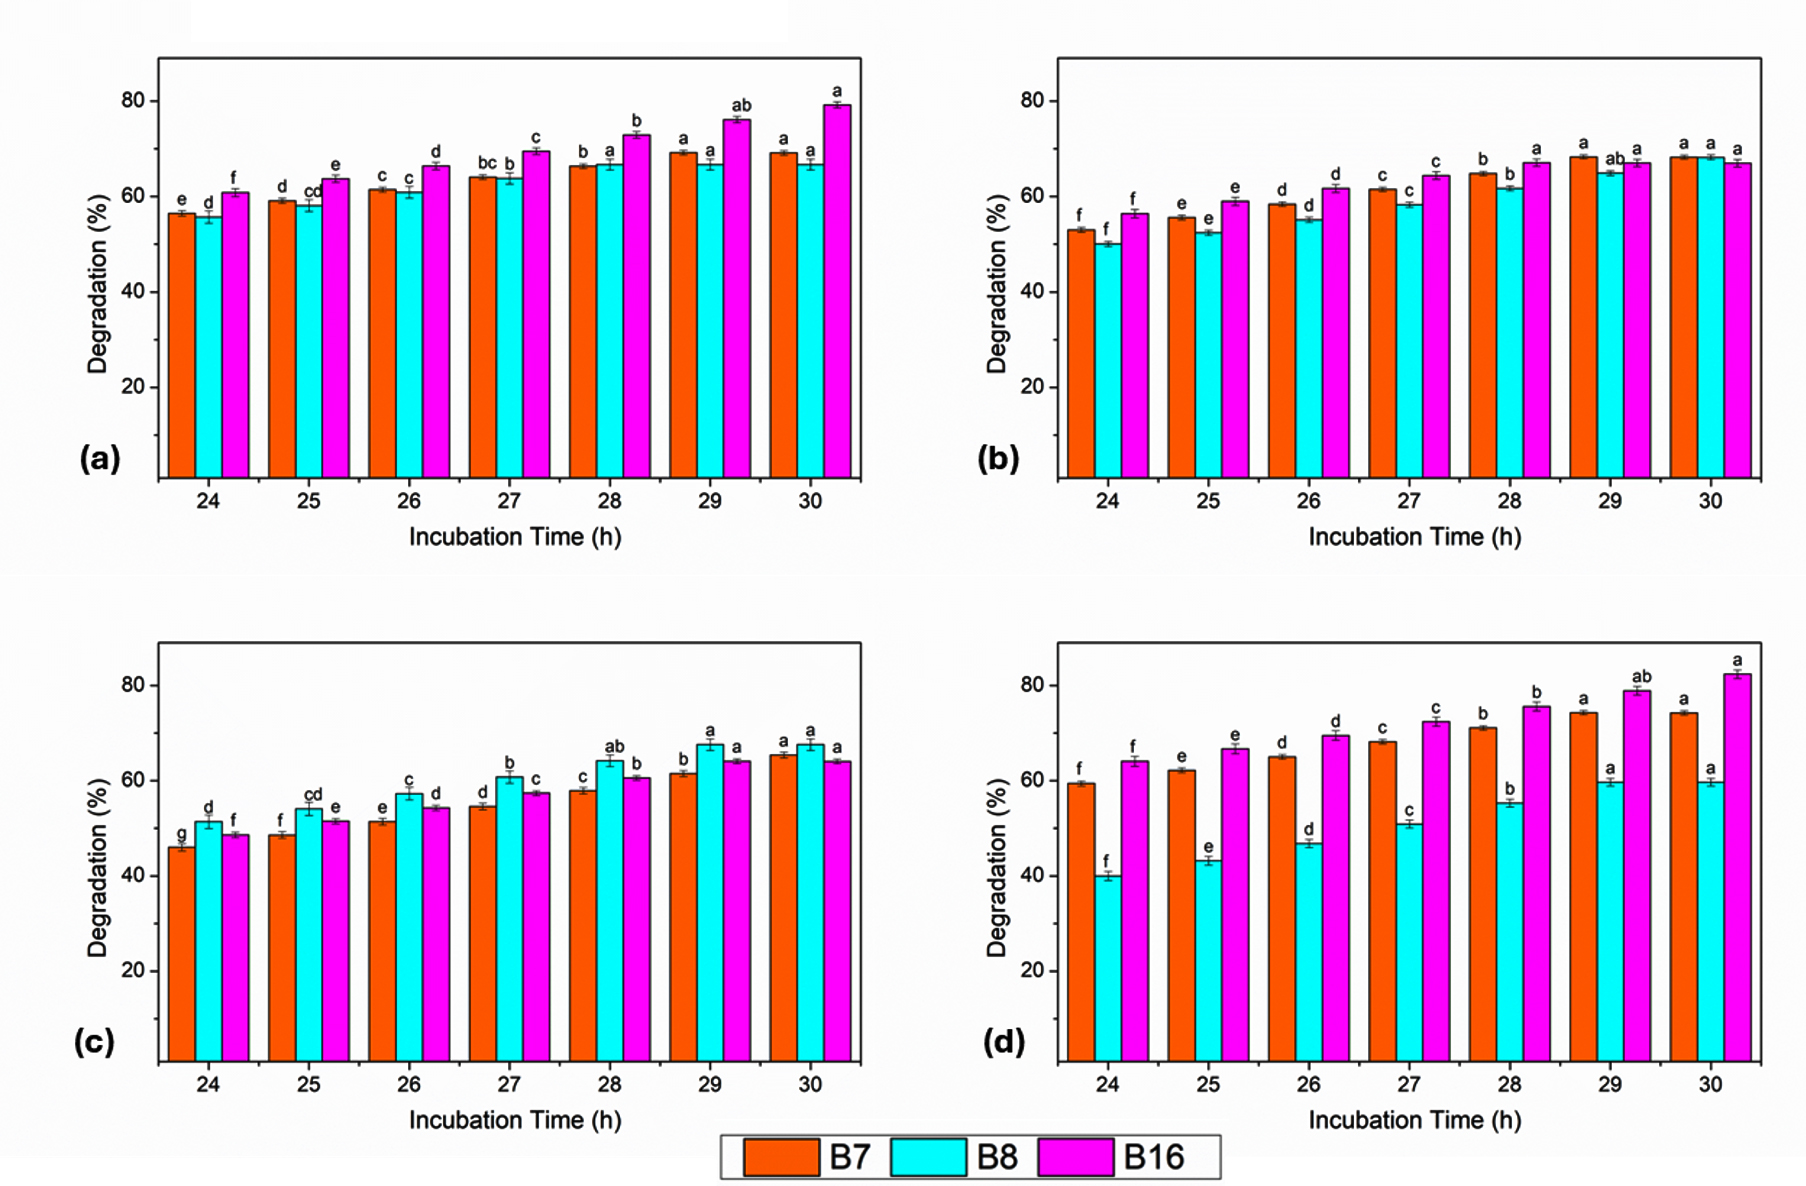
Figure 4. Effect of incubation time (24-30 hrs) on dye degradation efficiency of bacterial isolates B7, B8, and B16 against (a) RR, (b) GY, (c) BB, and (d) RO. Bars represent mean values with standard error, and different letters indicate significant differences at P < 0.05
The dye degradation efficiency increased with the incubation time, reaching optimal levels at 30 hrs. Among the bacterial isolates derived from the polluted soil, B-16 (Klebsiella spp.) demonstrated the highest degradation potential across all dyes and time intervals, followed by B-7 (Pseudomonas spp.), whereas B-8 (Acinetobacter spp.) exhibited comparatively lower efficiency. The overall order of dye degradation observed with respect to time was RO > RR > GY > BB.
Dye degradation by bacterial consortia
Based on the results obtained from individual bacterial isolates, a dye concentration of 10 mg was identified as the optimum level for maximum degradation efficiency. Therefore, the dye degradation potential of the bacterial consortia prepared using B-7 and B-16 was evaluated at this concentration using three different volumetric ratios (1:1, 0.5:0.5, and 0.25:0.75).
At a concentration of 10 mg, the 1:1 bacterial consortium (B-7:B-16) exhibited the highest degradation efficiency for all dyes, degrading RR by 66.48%, GY by 62.74%, BB by 60.22%, and RO by 70.41%. This degradation indicates a strongly synergistic interaction between the two isolates when combined in equal proportions, leading to greater dye degradation compared to the individual isolates. A marginal decline in the degradation efficiency was observed with the 0.5:0.5 consortia, using which the degradation achieved was 64.11% (RR), 60.55% (GY), 57.82% (BB), and 68.09% (RO). The 0.25:0.75 consortia showed the lowest degradation efficiencies among the tested ratios, with values of 61.32% for RR, 58.18% for GY, 56.28% for BB, and 65.81% for RO (Figure 5).
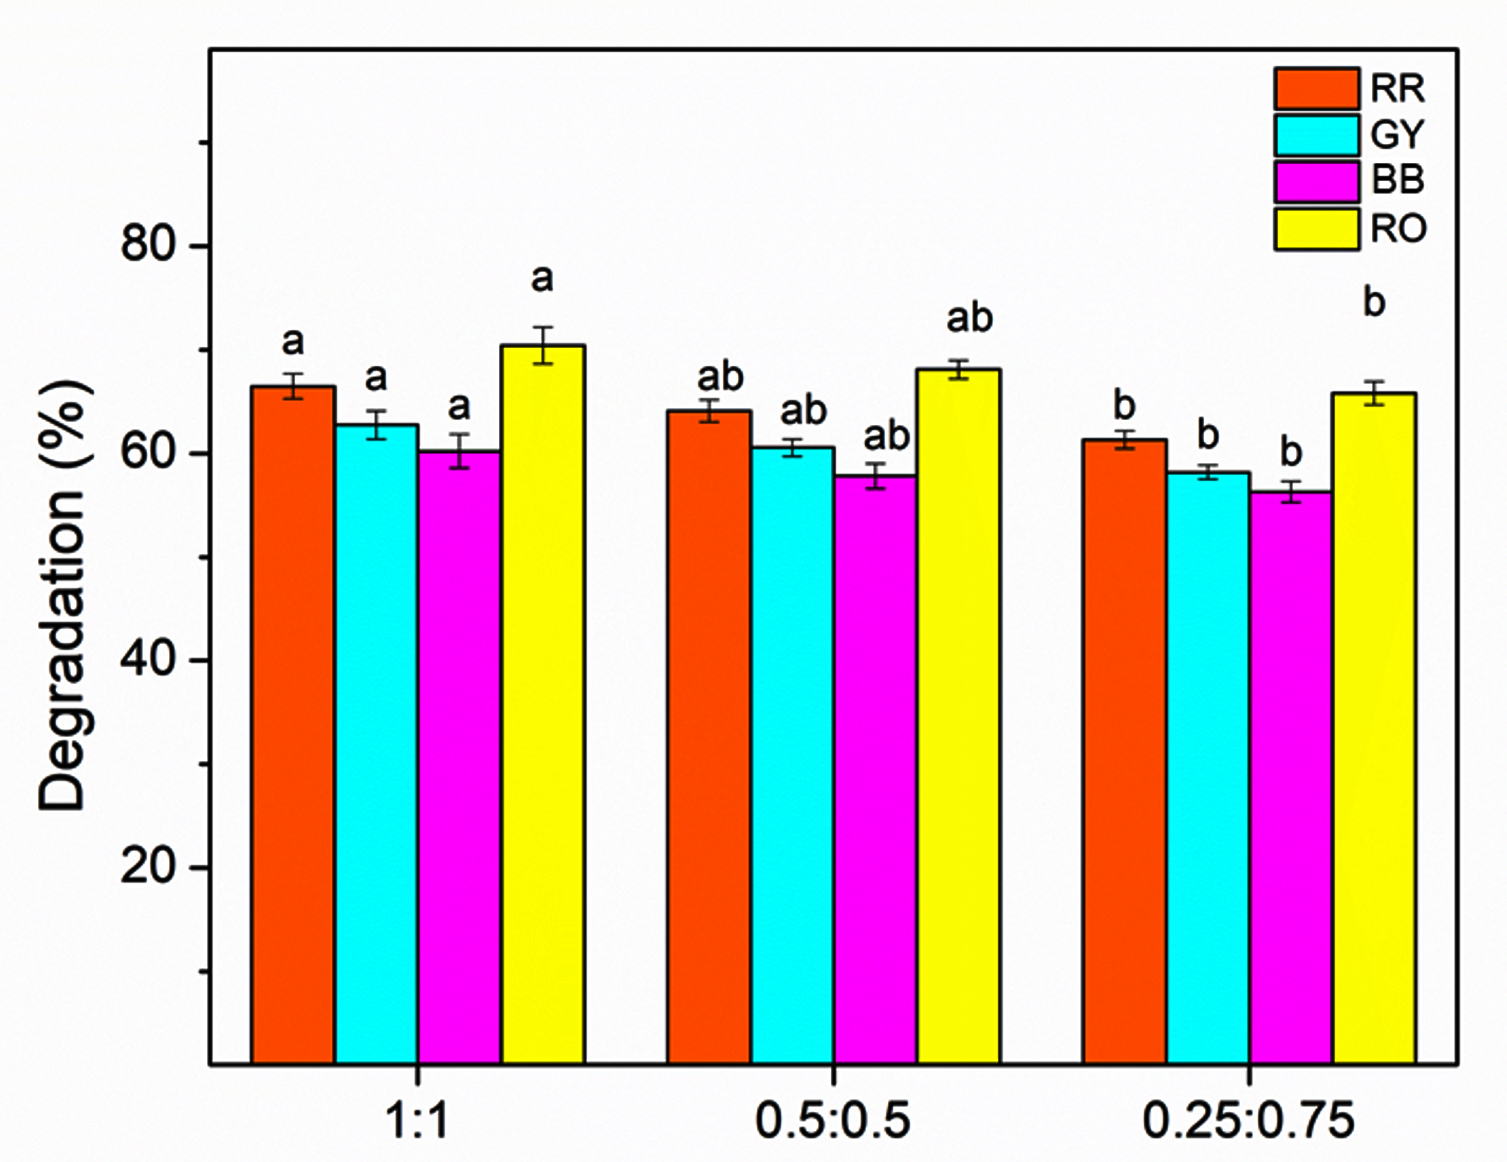
Figure 5. Effect of bacterial consortia ratio (B7:B16) on the degradation efficiency of RR, GY, BB, and RO. Bars represent mean ± SE, and different letters indicate statistically significant differences among treatments (P £ 0.05)
Across all the consortium ratios at a dye concentration of 10 mg, RO was the most efficiently degraded, followed by RR, GY, and BB. These results demonstrate that the composition of the consortium impacts dye degradation efficiency significantly, and that an equal proportion of the isolates B-7 (Pseudomonas spp.) and B-16 (Klebsiella spp.) most effectively degrades the dye under the optimized concentration conditions identified by studying the individual isolates.
Impact of incubation time on dye degradation by bacterial consortia
The impact of incubation time on the efficiency of dye degradation by the bacterial consortia composed of isolates B-7 and B-16 was evaluated at an optimized dye concentration of 10 mg over a period of 24-30 hrs (Table 4).
Table (4): Effect of incubation time on dye degradation efficiency (%) by the bacterial consortia (B7:B16) at different ratios
| Incubation Time (hrs) | Dye | Dye degradation by consortia (%) | ||
|---|---|---|---|---|
| 1:1 | 0.5:0.5 | 0.25:0.75 | ||
| 24 | RR | 66.5 ± 1.2g | 64.1 ± 1.1g | 61.3 ± 0.9g |
| GY | 62.7 ± 1.4g | 60.6 ± 0.8g | 58.2 ± 0.7g | |
| BB | 60.2 ± 1.6g | 57.8 ± 1.2g | 56.3 ± 1.0g | |
| RO | 70.4 ± 1.8g | 68.1 ± 0.9g | 65.8 ± 1.1g | |
| 25 | RR | 69.1 ± 1.1f | 66.8 ± 1.0f | 64.0 ± 0.8f |
| GY | 65.4 ± 1.4f | 63.3 ± 0.8f | 61.1 ± 0.6f | |
| BB | 62.9 ± 1.6f | 60.6 ± 1.2f | 59.0 ± 1.0f | |
| RO | 73.1 ± 1.7f | 70.9 ± 0.8f | 68.6 ± 1.1f | |
| 26 | RR | 71.8 ± 1.1e | 69.5 ± 0.9e | 66.6 ± 0.8e |
| GY | 68.1 ± 1.3e | 66.0 ± 0.7e | 63.7 ± 0.6e | |
| BB | 65.8 ± 1.5e | 63.4 ± 1.1e | 61.7 ± 1.0e | |
| RO | 76.0 ± 1.6e | 73.8 ± 0.8e | 71.5 ± 1.0e | |
| 27 | RR | 74.7 ± 1.0d | 72.4 ± 0.9d | 69.4 ± 0.8d |
| GY | 70.9 ± 1.3d | 68.8 ± 0.7d | 66.4 ± 0.6d | |
| BB | 68.7 ± 1.5d | 66.3 ± 1.1d | 64.5 ± 1.0d | |
| RO | 79.1 ± 1.6d | 76.9 ± 0.8d | 74.6 ± 1.0d | |
| 28 | RR | 77.6 ± 1.0c | 75.3 ± 0.9c | 72.4 ± 0.7c |
| GY | 73.7 ± 1.2c | 71.6 ± 0.7c | 69.3 ± 0.6c | |
| BB | 71.6 ± 1.4c | 69.1 ± 1.0c | 67.4 ± 0.9c | |
| RO | 82.4 ± 1.5c | 80.1 ± 0.7c | 77.8 ± 0.9c | |
| 29 | RR | 80.5 ± 1.0a | 78.2 ± 0.8a | 75.4 ± 0.7a |
| GY | 76.5 ± 1.2a | 74.4 ± 0.7a | 72.1 ± 0.5a | |
| BB | 74.9 ± 1.4a | 72.5 ± 1.0a | 70.7 ± 0.9a | |
| RO | 85.7 ± 1.5a | 83.4 ± 0.7a | 81.1 ± 0.9a | |
| 30 | RR | 80.5 ± 1.0a | 78.2 ± 0.8a | 75.4 ± 0.7a |
| GY | 76.5 ± 1.2a | 74.4 ± 0.7a | 72.1 ± 0.5a | |
| BB | 74.9 ± 1.4a | 72.5 ± 1.0a | 70.7 ± 0.9a | |
| RO | 85.7 ± 1.5a | 83.4 ± 0.7a | 81.1 ± 0.9a | |
RR = Reactive Red, GY = Golden Yellow, BB = Brilliant Blue, RO = Reactive Orange. Values are expressed as mean ± SE, and different superscript letters within a column indicate significant differences at P £ 0.05
All consortia exhibited substantial dye degradation after 24 hrs of incubation, with the 1:1 consortium showing the highest efficiency for all dyes. The degradation values at this time ranged from 60.22% (BB) to 70.41% (RO) for the 1:1 ratio, whereas the 0.25:0.75 consortium consistently showed the lowest degradation efficiencies. A progressive increase in dye degradation was observed with increasing incubation time from 25-27 hrs for all dye and consortia ratios. RO showed the most pronounced increase, followed by RR and GY, whereas BB exhibited a comparatively slower degradation. Throughout this period, the 1:1 consortium exhibited superior degradation performance, followed by the 0.5:0.5 and 0.25:0.75 ratios. At 28 and 29 hrs, the degradation efficiencies reached notably higher levels. The 1:1 consortium recorded the maximum degradation of RO, reaching 82.4% at 28 h and 85.7% at 29 hrs. Similar trends were observed for RR, GY, and BB, with consistent increases at all consortia ratios. At the maximum incubation period of 30 hrs, the degradation efficiencies stabilized or showed marginal changes compared to those at 29 hrs. The highest degradation at this time too was observed for RO, with values of 85.65% (1:1), 83.35% (0.5:0.5), and 81.05% (0.25:0.75). For all dyes, the overall order of degradation efficiency based on the consortium ratio was 1:1, followed by 0.5:0.5, and then 0.25:0.75 (Figure 6).
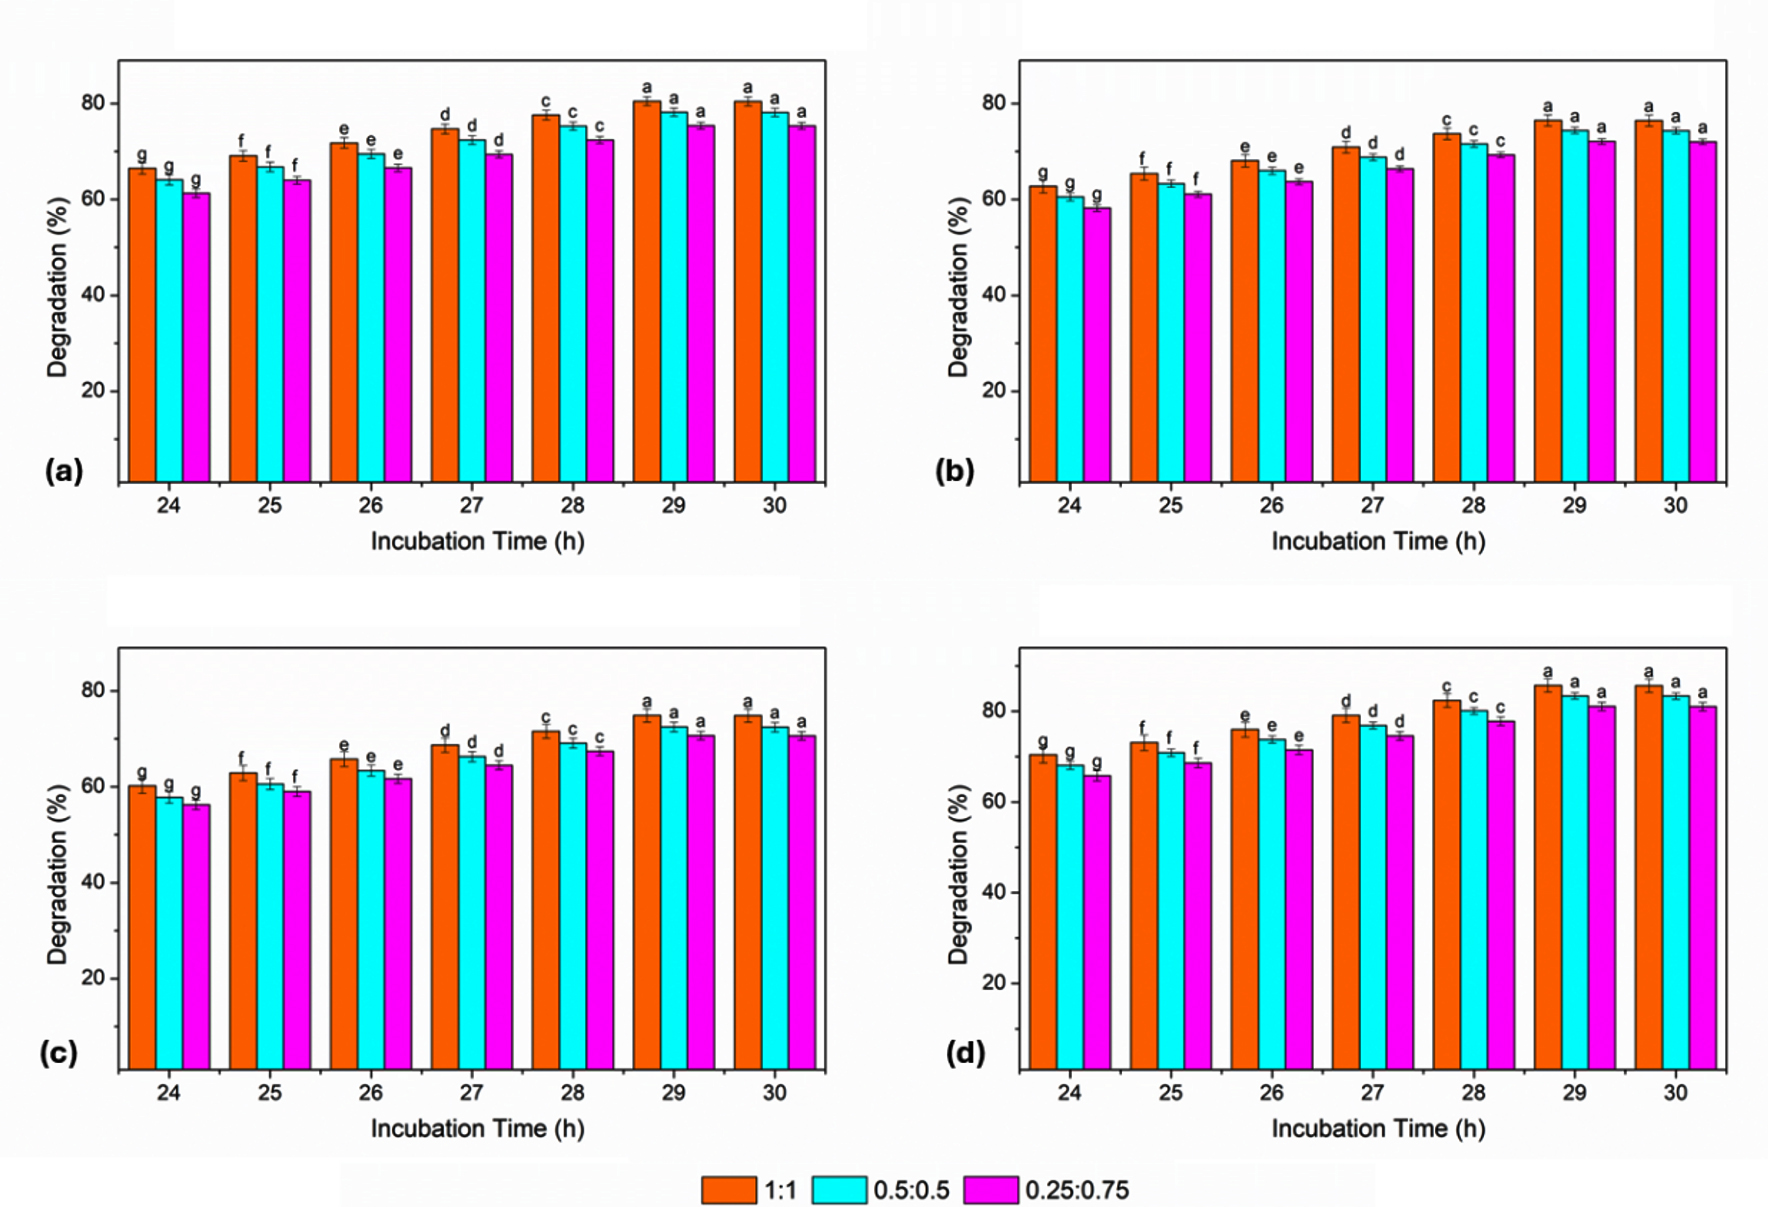
Figure 6. Effect of incubation time (24-30 hrs) on dye degradation efficiency by bacterial consortia (B7:B16) at different ratios (1:1, 0.5:0.5, and 0.25:0.75) for (a) RR, (b) GY, (c) BB, and (d) RO. Bars represent mean ± SE, and different letters indicate statistically significant differences among treatments (P £ 0.05)
The dye degradation efficiency of the bacterial consortia increased with incubation time, reaching optimal levels between 29 and 30 hrs at a dye concentration of 10 mg. Among the tested consortia, the equal-ratio (1:1) consortium of B-7 (Pseudomonas spp.) and B-16 (Klebsiella spp.) consistently exhibited the highest degradation potentials across all dyes and time intervals. RO was the most efficiently degraded dye, followed by RR, GY, and BB, confirming the enhanced synergistic effect of the bacterial consortia compared to individual isolates under optimized conditions.
Impact of bacterial isolates and consortia on pH of degraded dyes
The impact of the bacterial isolates and their consortia on the pH of the degraded dye solutions was evaluated. The control values represented the initial pH of the dye solutions prior to bacterial treatment, whereas changes in the pH following degradation reflected microbial activity during decolorization (Table 5).
Table (5): pH changes of dyes after degradation by individual bacterial isolates and their consortia
| Isolates and consortia | pH of degraded dyes | |||
|---|---|---|---|---|
| RR | GY | BB | RO | |
| Control | 5.5 ± 0.1e | 5.7 ± 0.1e | 5.4 ± 0.1e | 5.6 ± 0.1d |
| B7 | 9.6 ± 0.1b | 9.8 ± 0.0b | 9.7 ± 0.1a | 9.4 ± 0.1b |
| B8 | 9.5 ± 0.1c | 9.7 ± 0.1c | 9.6 ± 0.1a | 9.1 ± 0.1c |
| B16 | 9.7 ± 0.0ab | 9.9 ± 0.1a | 9.8 ± 0.1a | 9.5 ± 0.1b |
| 01:01 | 9.8 ± 0.1a | 10.0 ± 0.1a | 9.0 ± 0.1b | 9.8 ± 0.1a |
| 0.5:0.5 | 9.6 ± 0.1bc | 9.8 ± 0.0b | 8.8 ± 0.1c | 9.5 ± 0.1b |
| 0.25:0.75 | 9.4 ± 0.1d | 9.6 ± 0.1d | 8.6 ± 0.1d | 9.3 ± 0.1c |
RR = Reactive Red, GY = Golden Yellow, BB = Brilliant Blue, RO = Reactive Orange. B7, B8, and B16 represent individual bacterial isolates, while 1:1, 0.5:0.5, and 0.25:0.75 denote consortia ratios of B7:B16. Values are expressed as mean ± SE, and different superscript letters within a column indicate significant differences at P £ 0.05
The initial pH of the untreated dye solutions (control) ranged from 5.38-5.68, indicating the mildly acidic nature of all four dyes. A marked increase in pH, to 9.40-9.90, was observed for all dyes after degradation using individual bacterial isolates (B-7, B-8, and B-16), demonstrating a clear shift from acidic to alkaline conditions. Among the isolates, B-16 delivered the greatest increase in pH, particularly for GY (9.90) and BB (9.78). Treatment with bacterial consortia resulted in a further increase in pH compared to that using the individual isolates. The 1:1 consortium (B-7:B-16) caused the highest increase in pH values across all dyes: 9.82 (RR), 10.02 (GY), 9.02 (BB), and 9.82 (RO). This indicated an enhanced metabolic interaction between the bacterial strains, leading to increased alkalinization of the medium. Treatment using the 0.5:0.5 and 0.25:0.75 consortia also resulted in elevated pH levels relative to the individual isolates, although slightly lower than those observed for the 1:1 ratio (Figure 7).
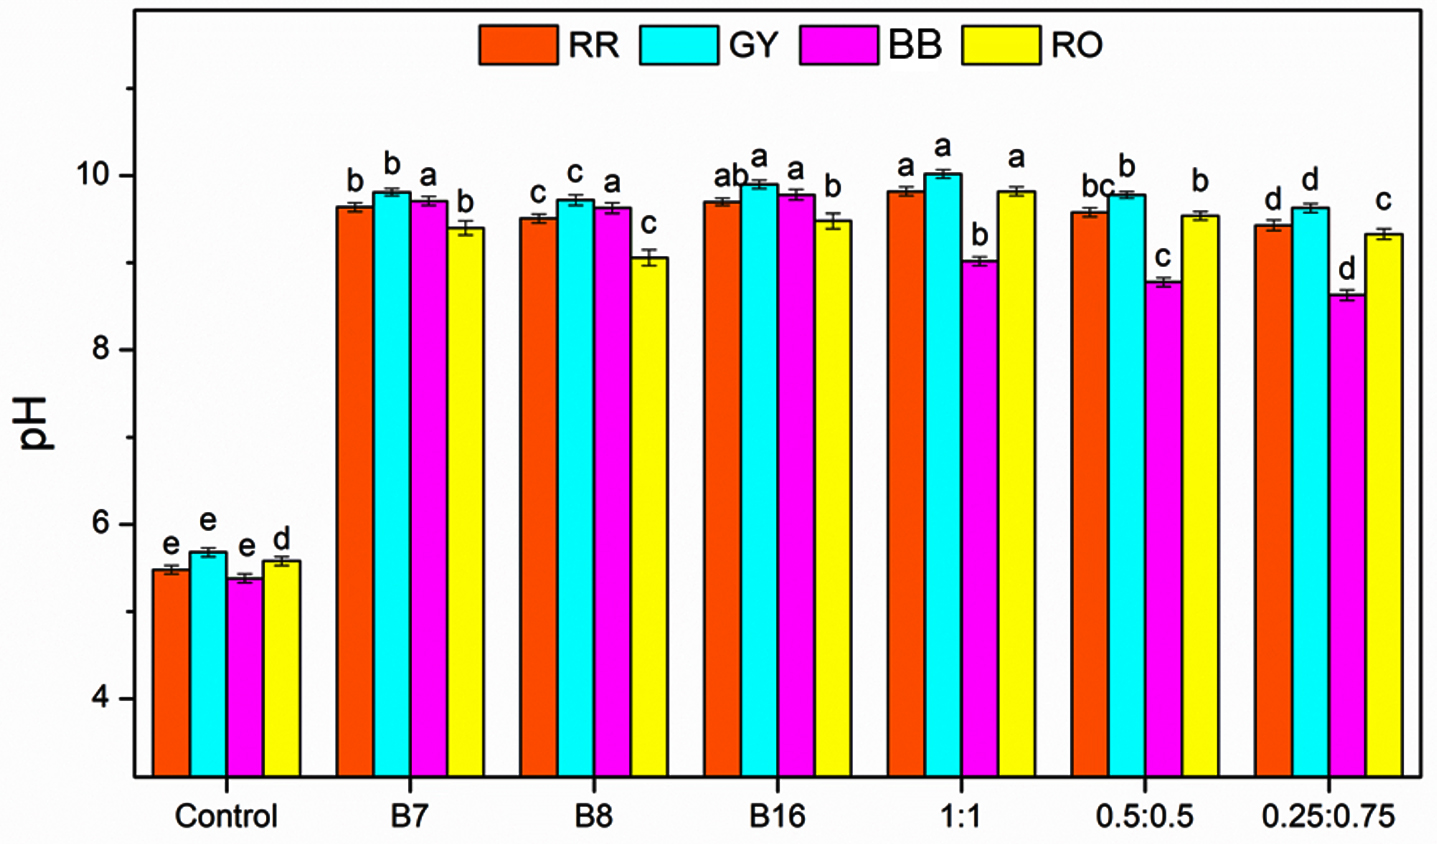
Figure 7. Changes in pH of dyes following degradation by individual bacterial isolates (B7, B8, B16) and their consortia (B7:B16). Bars represent mean ± SE, and different letters indicate statistically significant differences among treatments (P £ 0.05)
The bacterial degradation of the dyes led to a significant increase in the pH, shifting the medium from acidic to alkaline. This increase in pH is likely with a result of acidic dye functional groups breaking down and alkaline metabolites forming during microbial degradation. This effect was most pronounced in the bacterial consortium treatments, particularly at the 1:1 ratio, indicating synergistic metabolic activity. These findings further support the effectiveness of bacterial isolates derived from polluted soil not only in degrading dyes, but also in modifying the physicochemical characteristics of dye solutions toward less acidic conditions.
FTIR analysis of dye degradation products
The FTIR spectrum of the control RR dye showed absorption peaks at 3613 cm-1 corresponding to hydroxyl (–OH) stretching; 1642 cm-1 assigned to conjugated carbonyl or imino (–C=N–) stretching; and 1527 cm-1 representing aromatic nitro (–NO2) groups. Additional peaks were observed at 1055 cm-1 for Si–O–Si stretching, 586 cm-1 for disulfide (C–S) stretching, 526 cm-1 for C–I stretching, and 707 cm-1 for aromatic C–H monosubstitution. In the degradation product obtained using B-16, the absorption bands were recorded at 3417 cm-1 (H-bonded –OH stretching), 2890 cm-1 (methyne C–H stretching), 1641 cm-1 (open-chain imino –C=N– stretching), and 1461 cm-1 (methyl C–H bending). Additional peaks appeared at 1088 cm-1 (C–O stretching), 1014 cm-1 (aromatic C–H in-plane bending), and 713 cm-1 and 660 cm-1 corresponding to alcohol –OH out-of-plane bending. The degradation product for B-7 showed absorption peaks at 3567 cm-1 assigned to internally bonded –OH stretching and 2825 cm-1 corresponding to methyl ether (O–CHƒ ) C–H stretching. In the B-7:B-16 consortium degradation product, absorption bands corresponding to the functional groups detected in both the B-16 and B-7 treatments were observed (Figure 8).
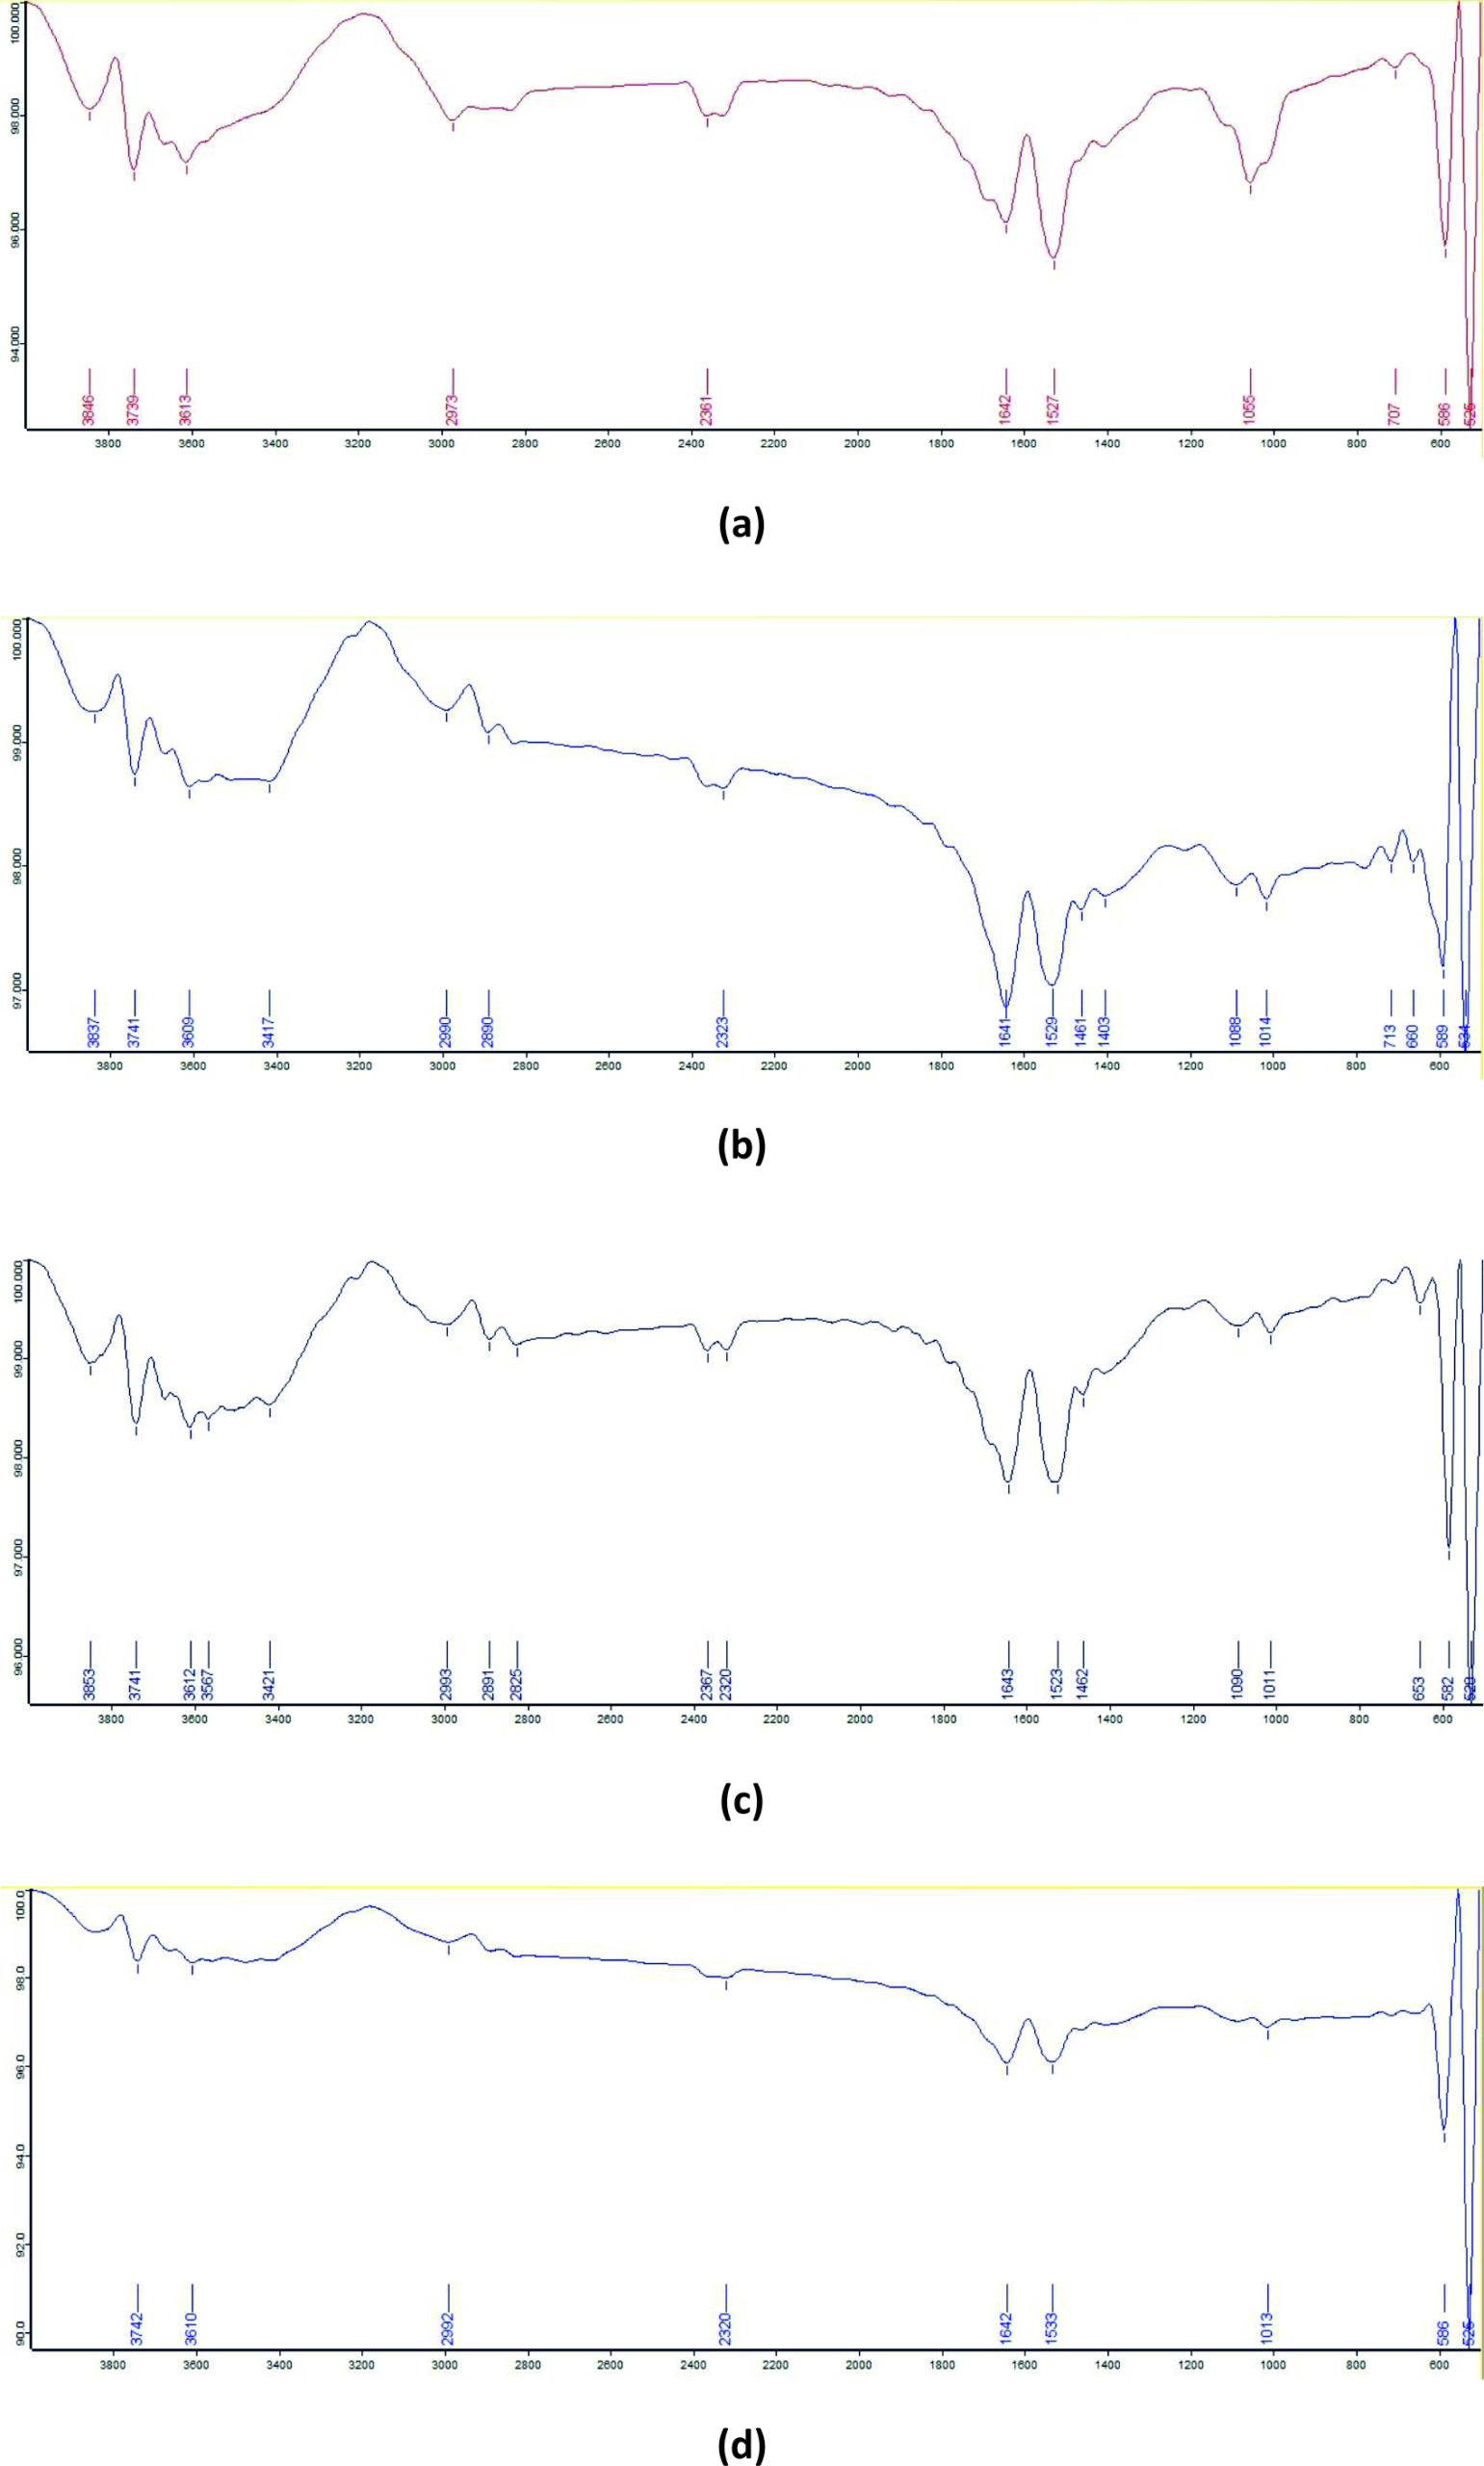
Figure 8. FTIR spectra of RR dye: (a) untreated dye, (b) degraded by isolate B7, (c) degraded by isolate B16, and (d) degraded by consortia B7:B16 (1:1)
The FTIR spectrum of the control GY dye exhibited absorption peaks at 3477 cm-1 (H-bonded –OH stretching), 1641 cm-1 (open-chain imino –C=N– stretching), 1540 cm-1 (aromatic nitro compounds), 1020 cm-1 (Si–O–Si stretching), 588 cm-1 (disulfide C–S stretching), and 525 cm-1 (C–I stretching). In the degradation product obtained using B-16, an additional absorption peak was observed at 3613 cm-1 corresponding to non-bonded –OH stretching. The B-7 degradation product showed several additional bands at 2921 cm-1 (methylene C–H asymmetric/symmetric stretching), 1555 cm-1 (secondary amine >N–H bending), 1457 cm-1 (methyl C–H asymmetric/symmetric bending), 1365 cm-1 (trimethyl or tert-butyl groups), and 711 cm-1 (aryl thioether C–S stretching), along with peaks at 1101 cm-1 (C–F stretching) and 3480 cm-1 (dimeric –OH stretching). In the B-7:B-16 consortium degradation product, absorption peaks were recorded at 1368 cm-1 (gem-dimethyl groups) and 717 cm-1 (alcohol –OH out-of-plane bending), in addition to the peaks present in the individual bacterial treatments (Figure 9).
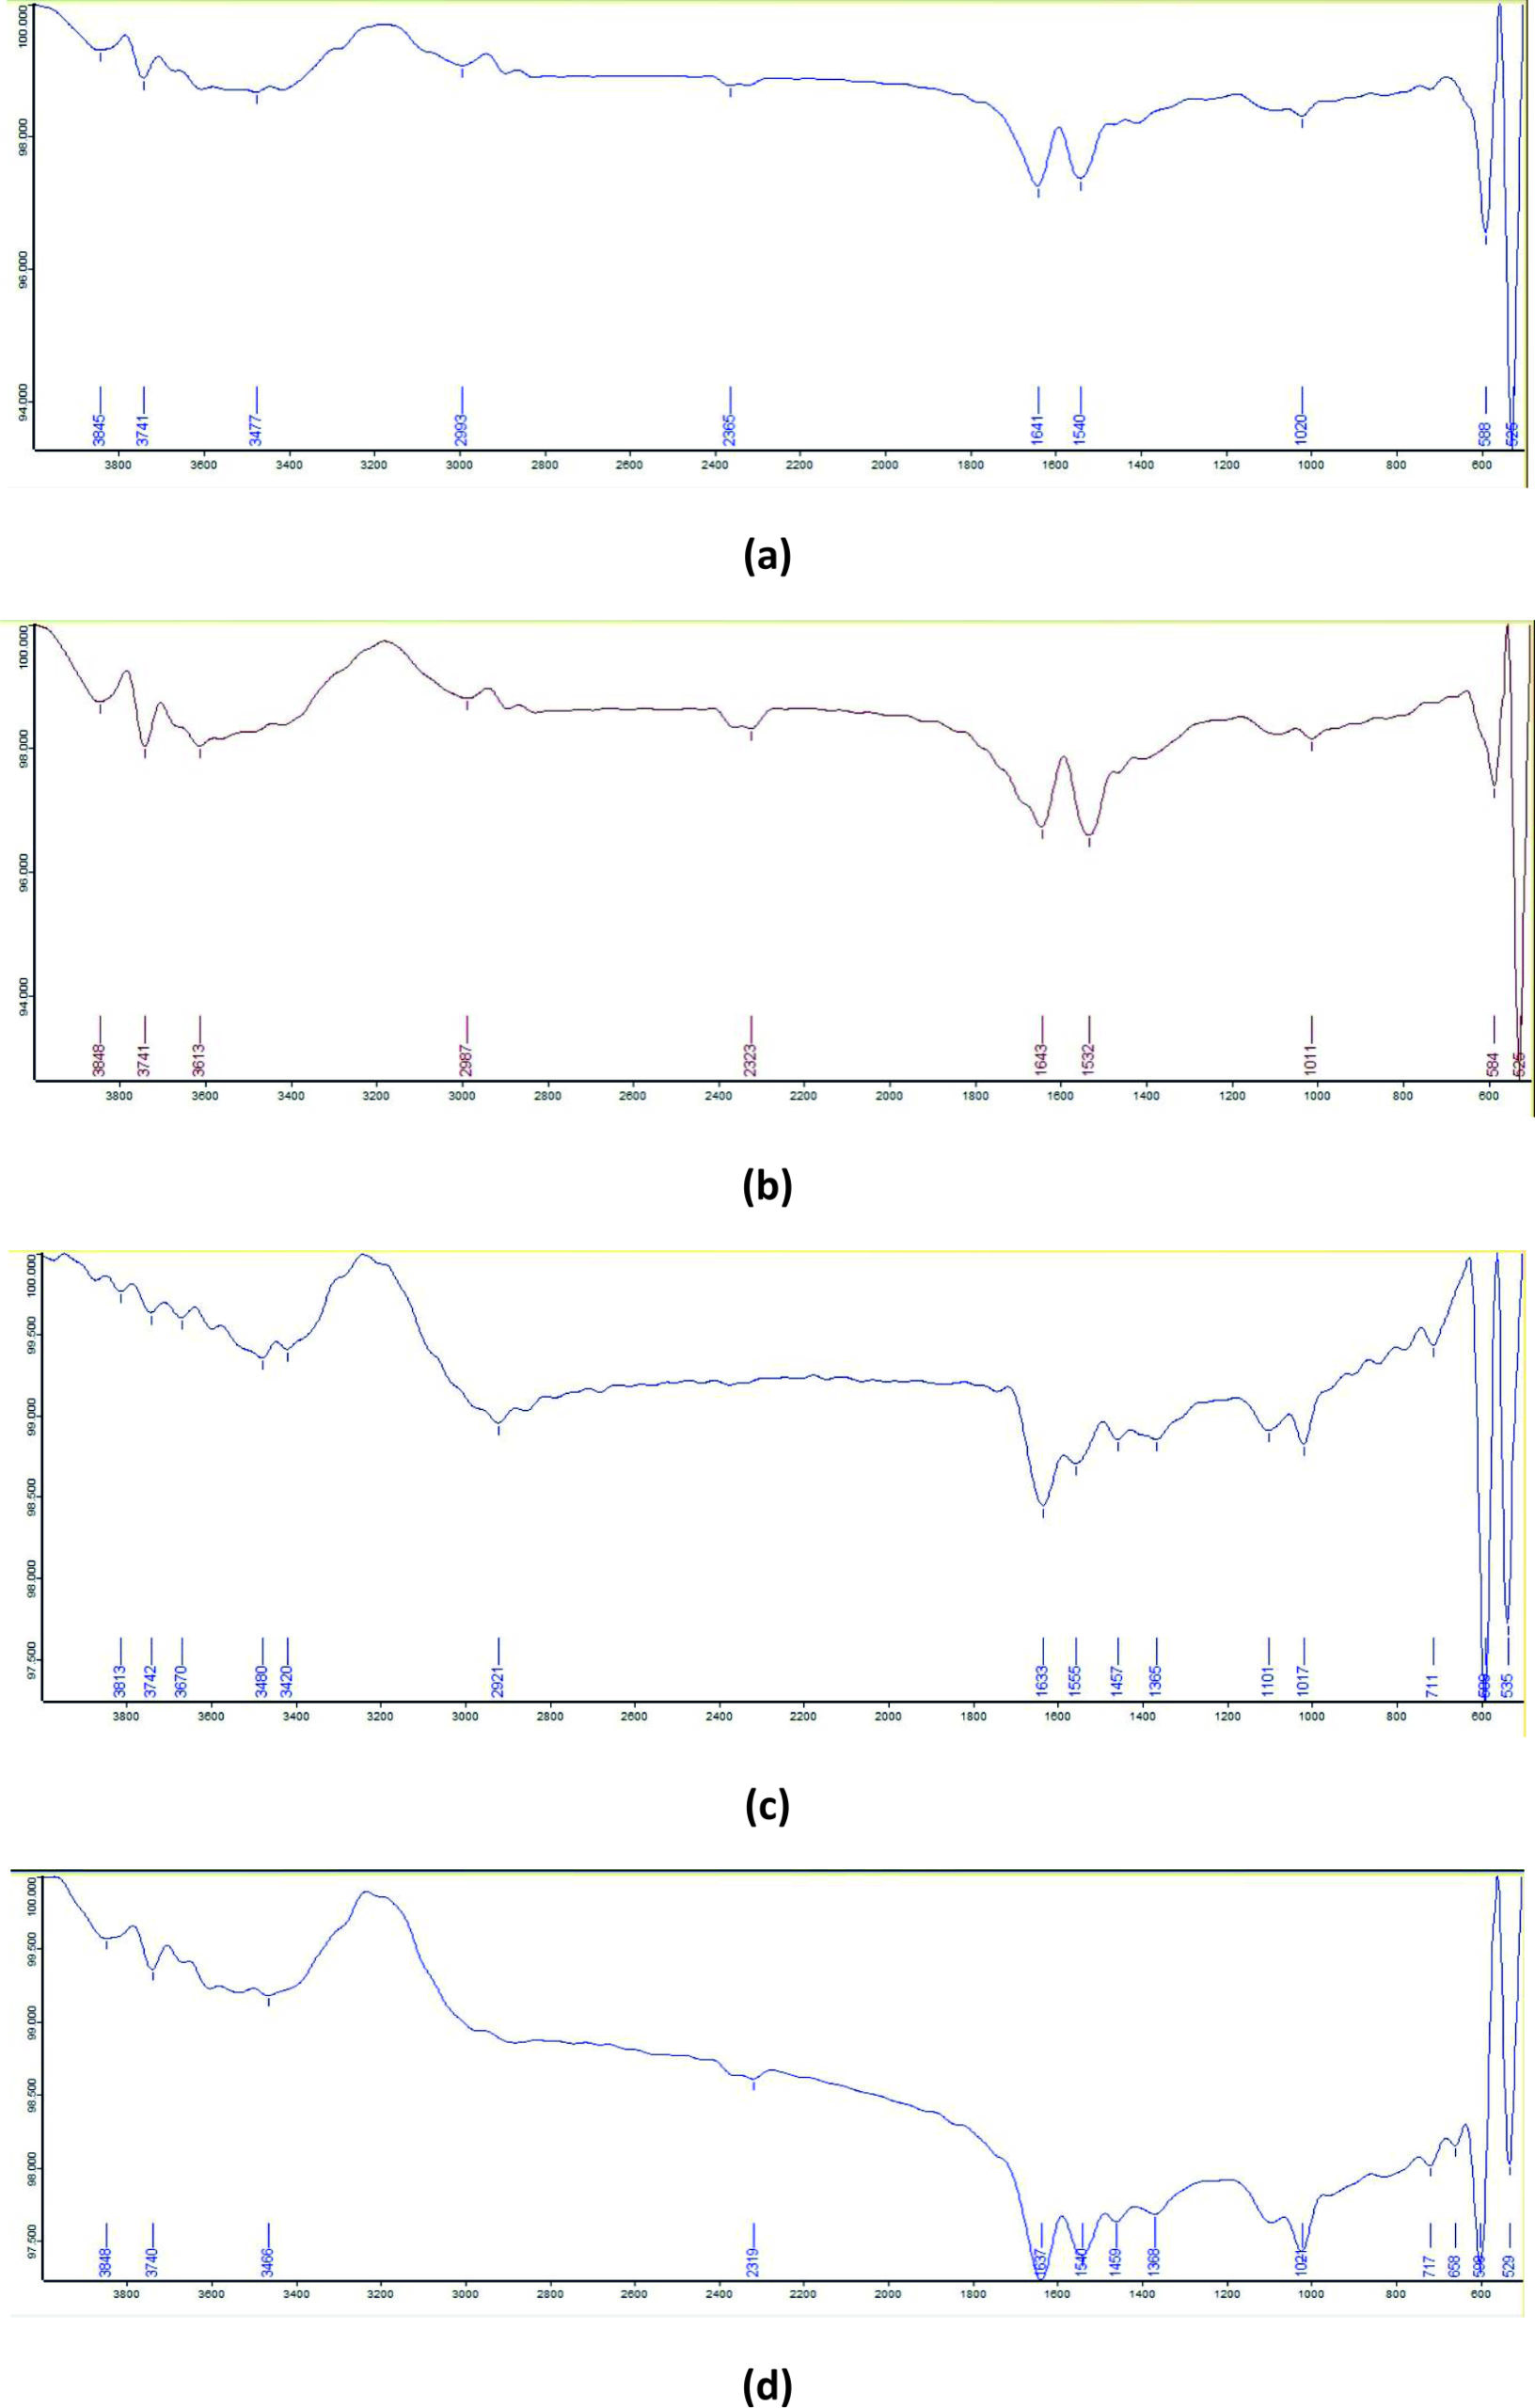
Figure 9. FTIR spectra of GY dye: (a) untreated dye, (b) degraded by isolate B7, (c) degraded by isolate B16, and (d) degraded by consortia B7:B16 (1:1)
The FTIR spectrum of the control BB dye showed absorption peaks at 3613 cm-1 (non-bonded –OH stretching), 2892 cm-1 (methyne C–H stretching), 2829 cm-1 (methyl ether O–CHƒ stretching), 1643 cm-1 (quinone stretching), 1528 cm-1 (aromatic nitro compounds), 1017 cm-1 (C–F stretching), 594 cm-1 (C–S stretching), and 529 cm-1 (C–I stretching). In the degradation products obtained with B-16 and B-7, absorption bands were observed at 712 cm-1 and 708 cm-1, respectively, corresponding to alcohol –OH out-of-plane bending. The B-7:B-16 consortium degradation product showed all the absorption bands observed in the individual bacterial treatments, along with an additional peak at 1408 cm-1 assigned to tertiary alcohol –OH bending (Figure 10).
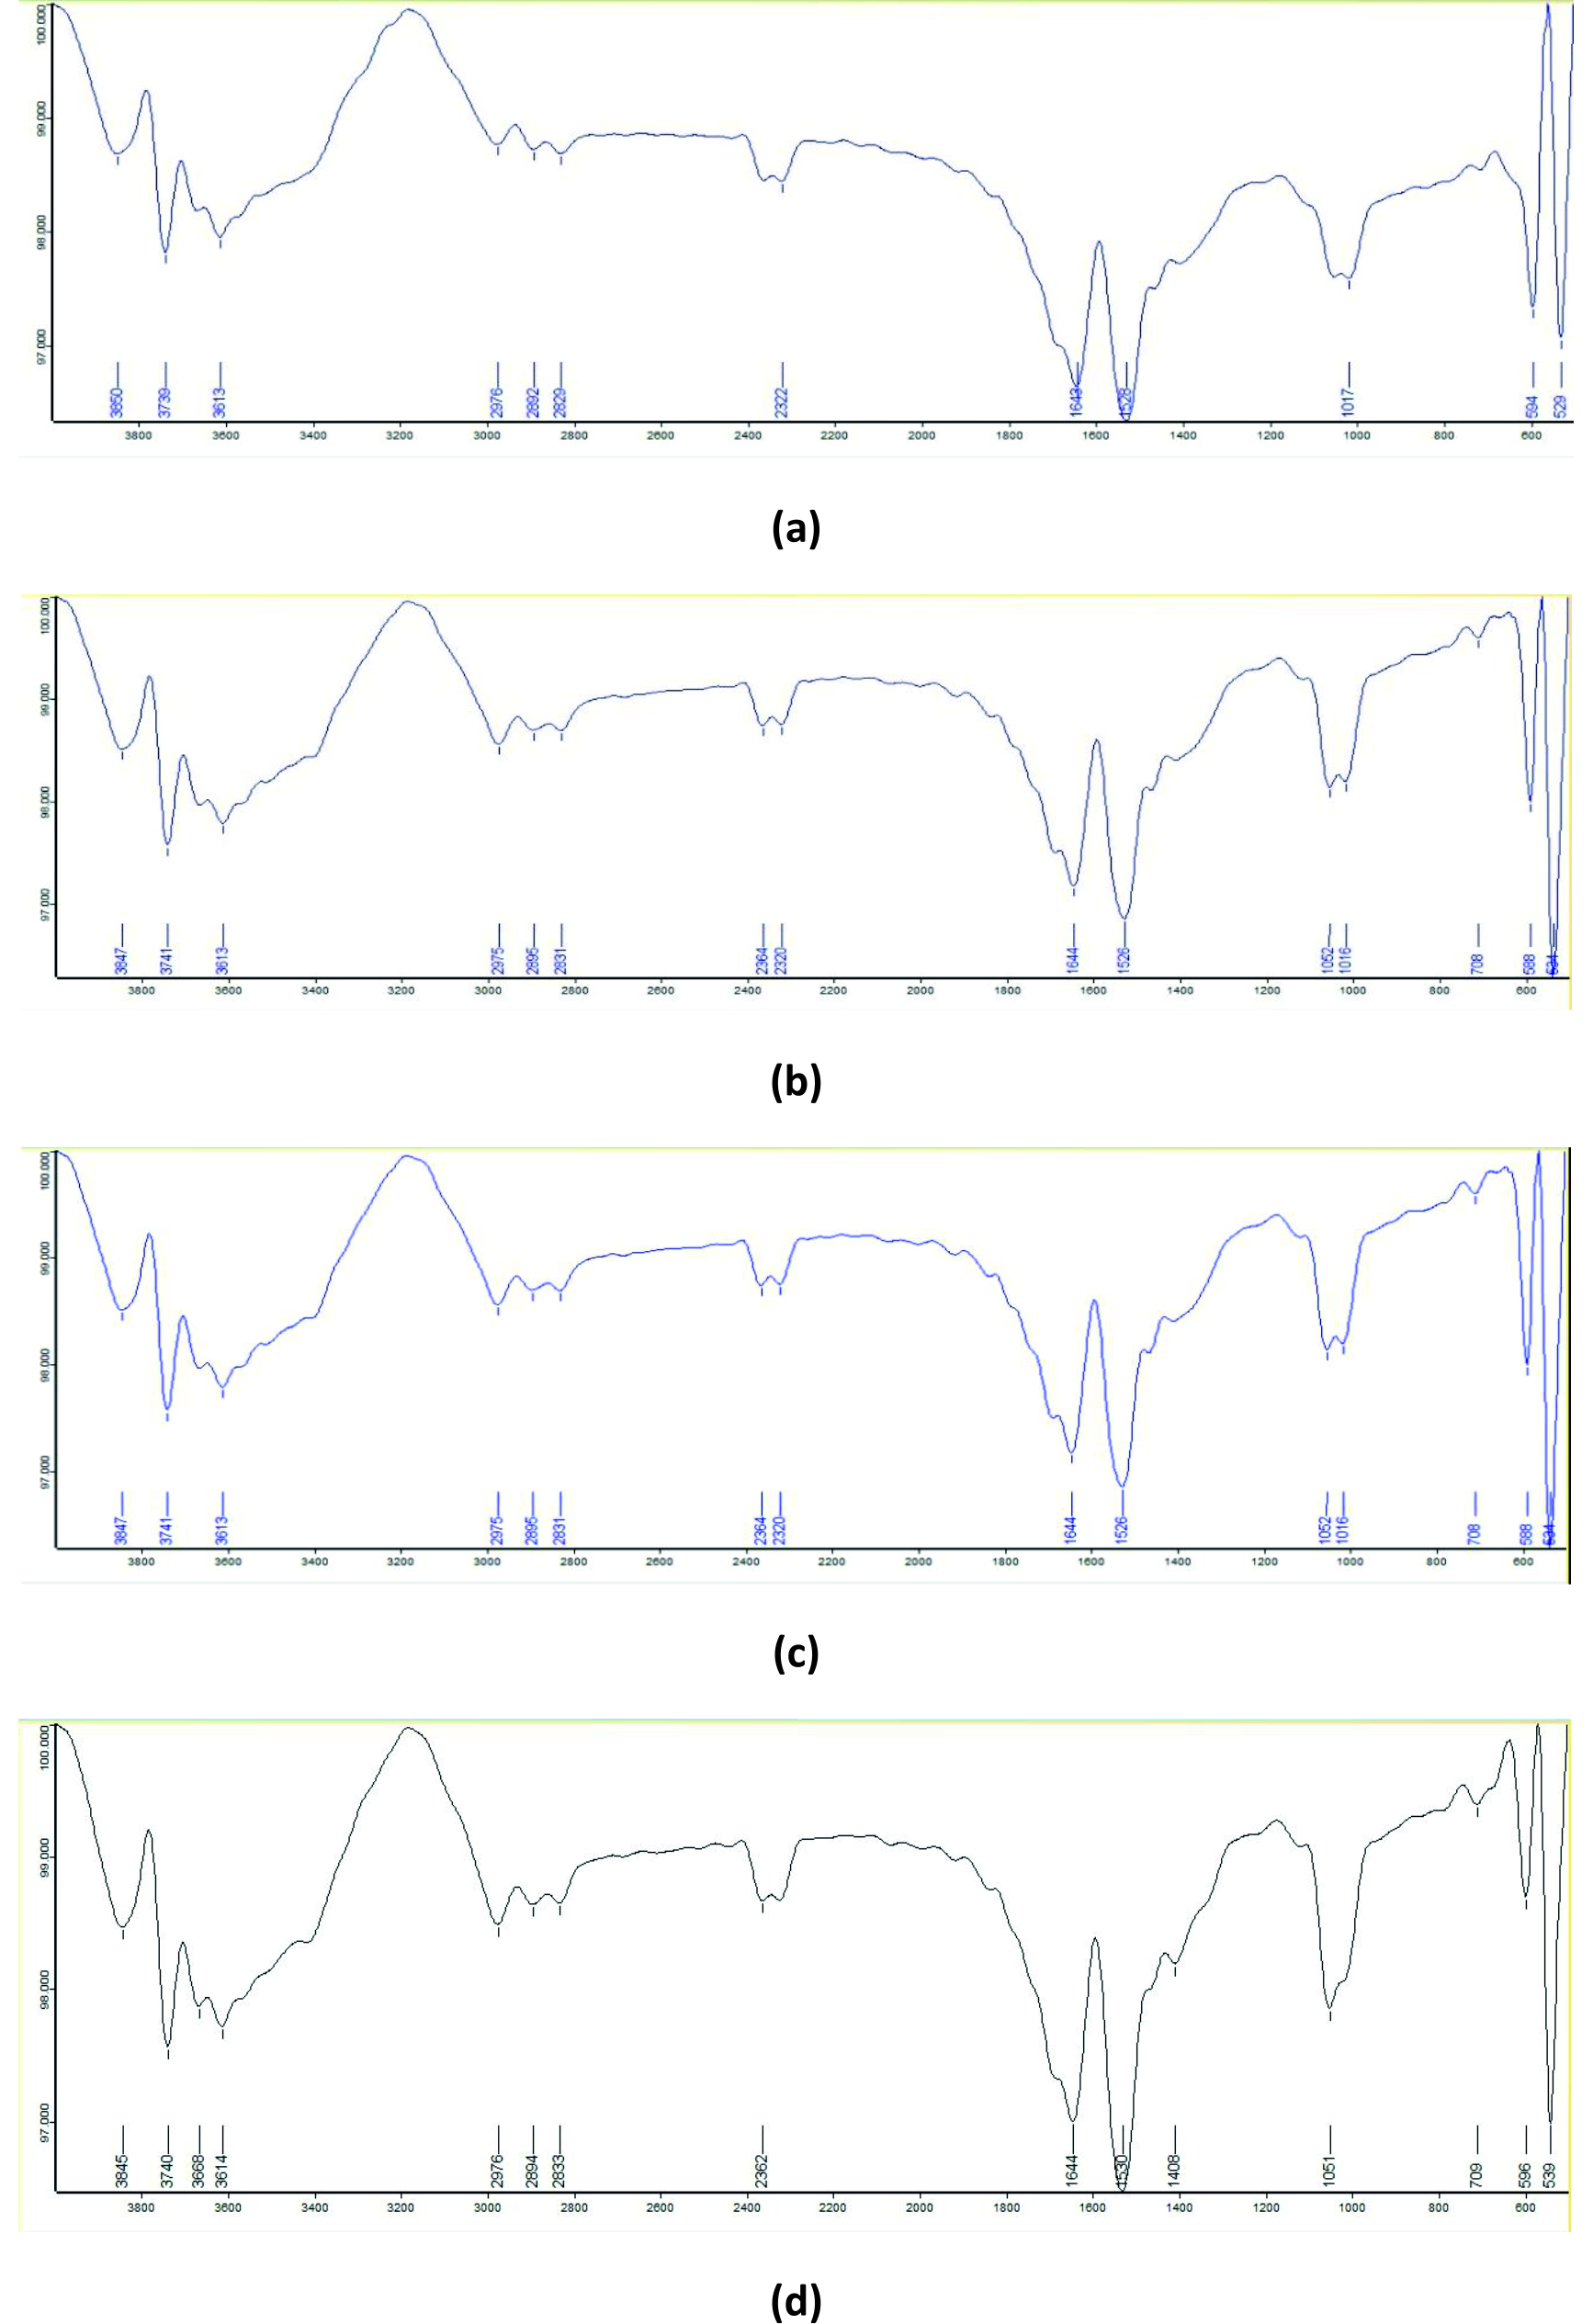
Figure 10. FTIR spectra of BB dye: (a) untreated dye, (b) degraded by isolate B7, (c) degraded by isolate B16, and (d) degraded by consortia B7:B16 (1:1)
The FTIR spectrum of the control RO dye exhibited absorption peaks at 3614 cm-1 (phenolic –OH stretching), 1644 cm-1 (–C=N– stretching), 1527 cm-1 (aromatic nitro compounds), 1051 cm-1 (Si–O–Si stretching), 595 cm-1 (disulfide C–S stretching), and 534 cm-1 (C–I stretching). In the degradation product obtained with B-16, absorption bands were recorded at 1689 cm-1 corresponding to quinone groups and 709 cm-1 representing aryl thioether (C–S stretching). The B-7 degradation product showed an absorption peak at 1407 cm-1, assigned to tertiary alcohol –OH bending. In the B-7:B-16 consortium degradation product, absorption bands corresponding to the functional groups detected in both individual bacterial treatments were seen along with an additional peak at 639 cm-1 corresponding to alcohol –OH out-of-plane bending (Figure 11).
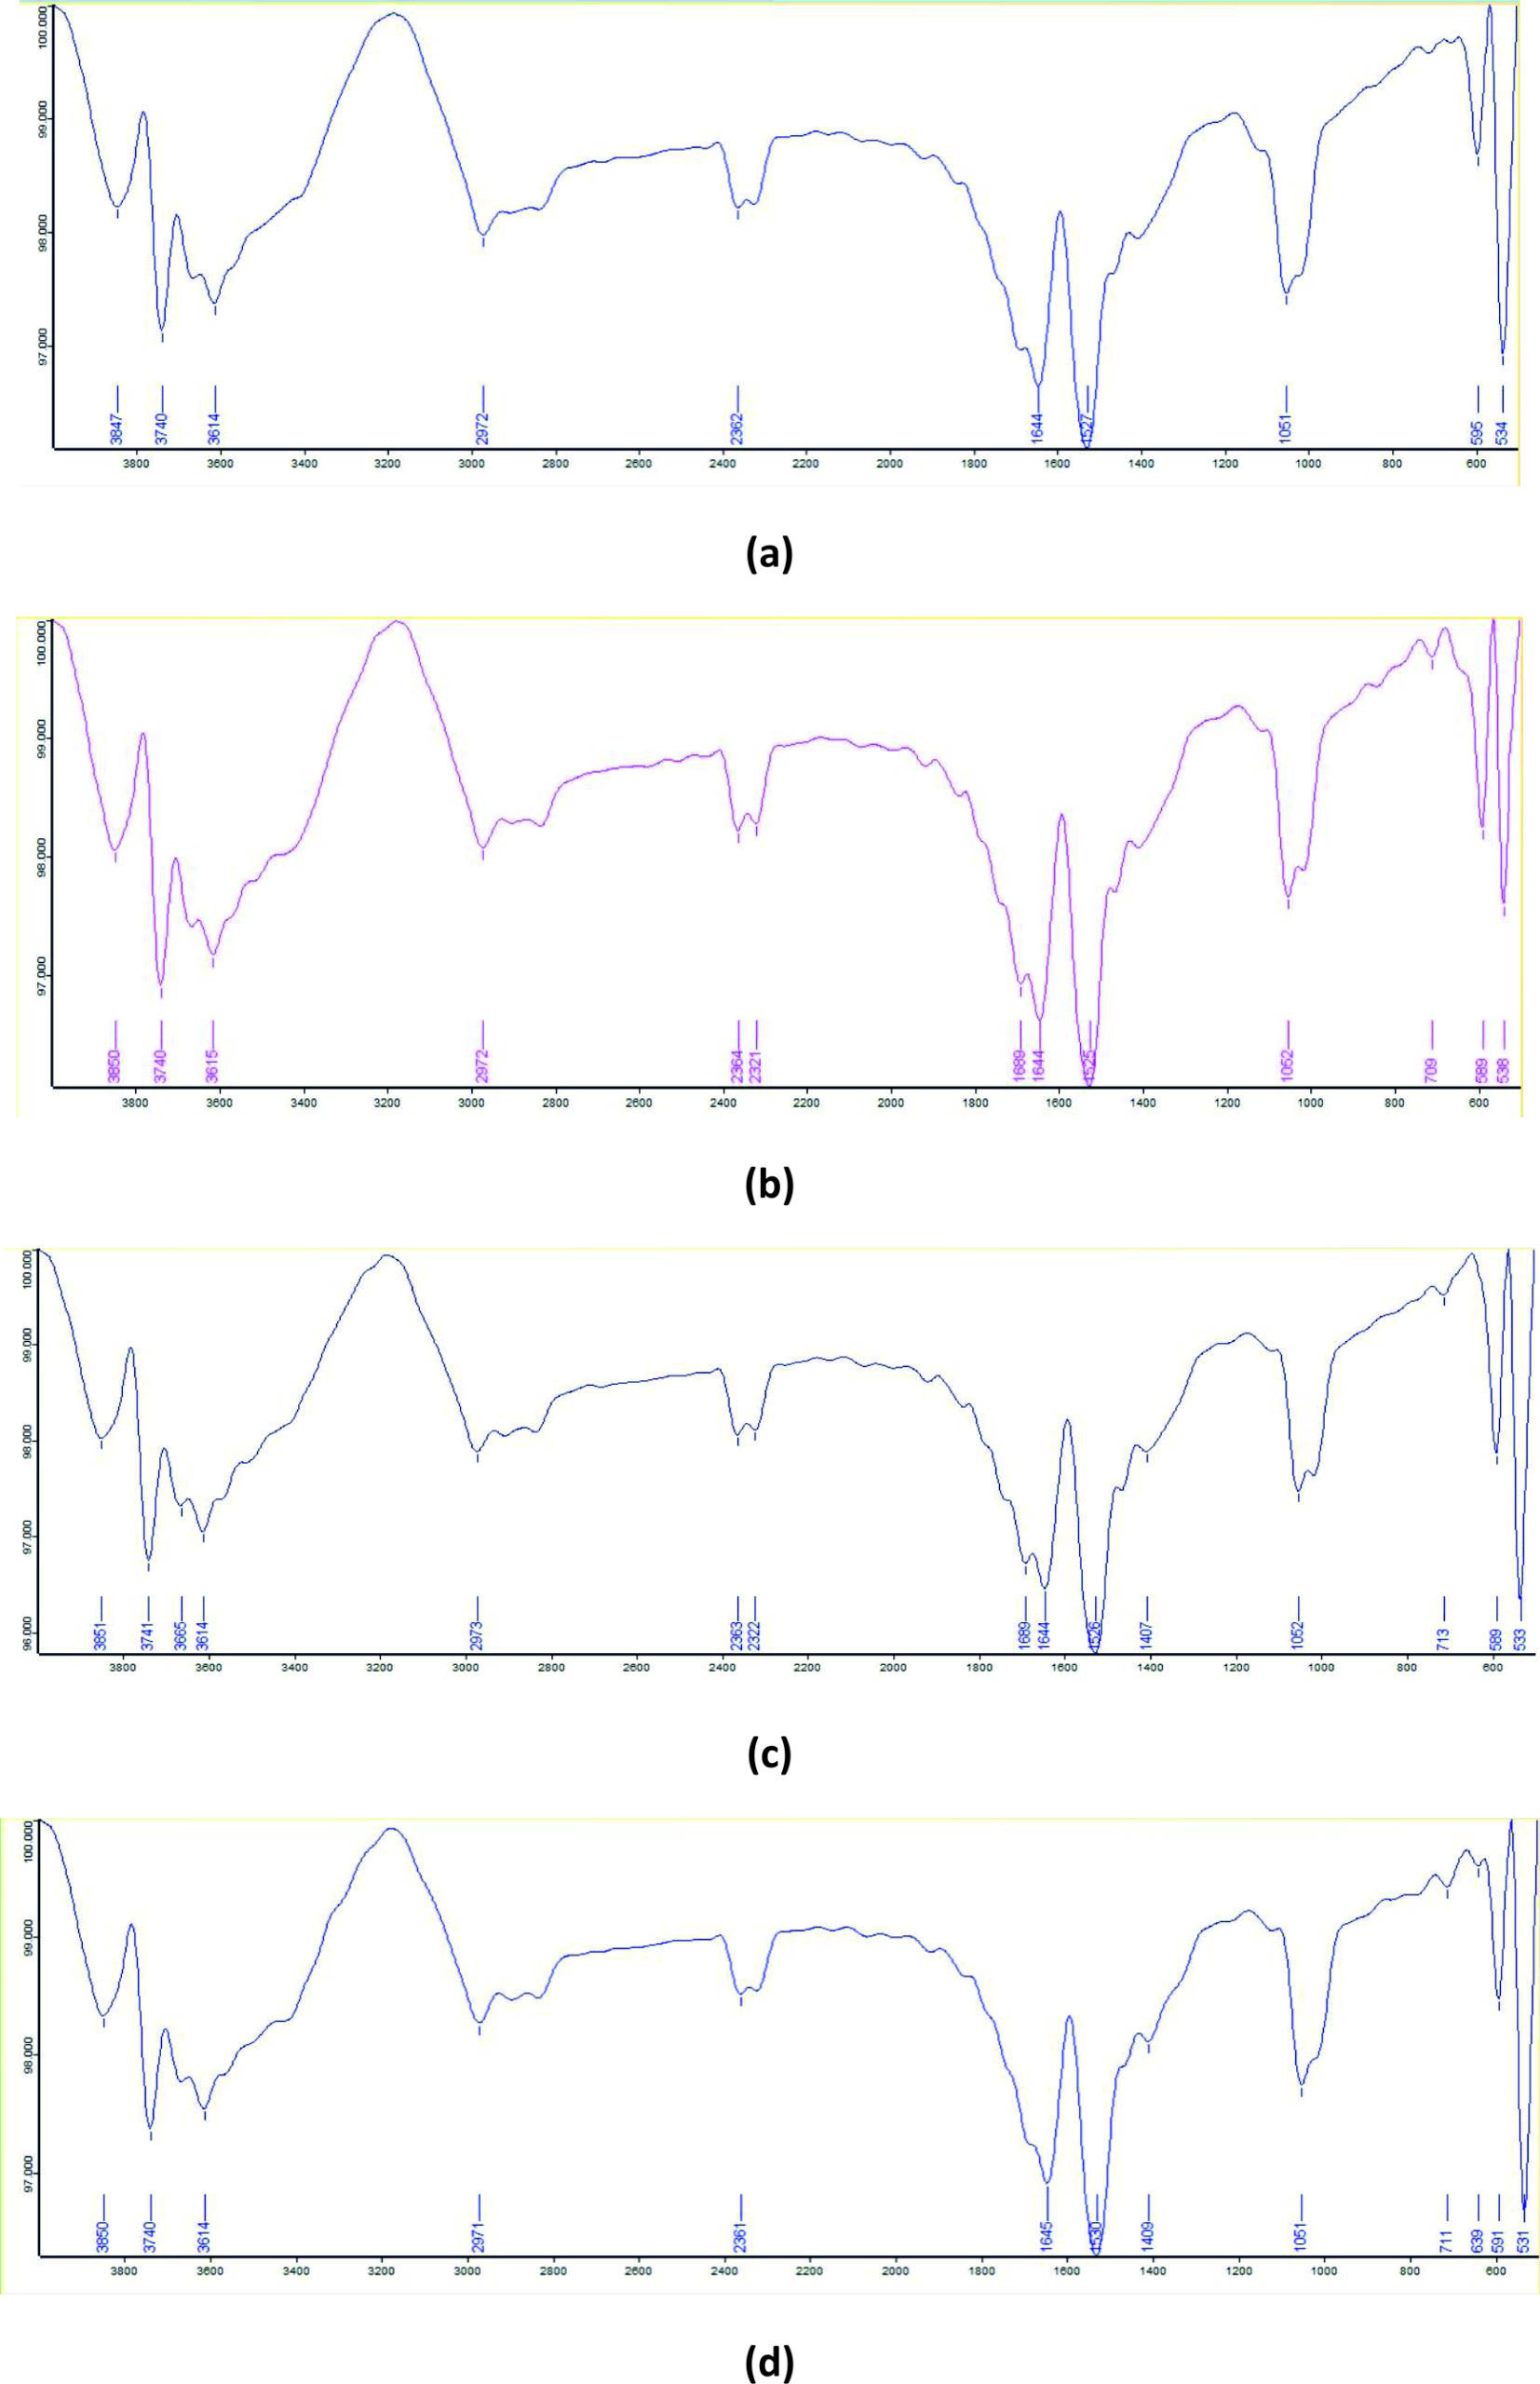
Figure 11. FTIR spectra of RO dye: (a) untreated dye, (b) degraded by isolate B7, (c) degraded by isolate B16, and (d) degraded by consortia B7:B16 (1:1)
Impact of bacterial consortia on growth and seedling vigor of Z. mays
The impact of bacterial consortia on the seed germination and early seedling growth of Z. mays was evaluated at an optimized dye concentration of 10 mg in unpolluted soil. Three consortium ratios (1:1, 0.5:0.5, and 0.25:0.75) were compared with the untreated controls, and growth parameters, including the seed germination percentage, shoot length, root length, and SVI were recorded (Table 6).
Table (6): Effect of bacterial consortia ratio (B7:B16) on seed germination (%) and seedling growth parameters of Z. mays grown under dye-treated conditions
| Bacterial consortia ratio | RR | GY | BB | RO |
|---|---|---|---|---|
| Seed germination (%) | ||||
| Control | 30.0 ± 1.9d | 30.0 ± 1.9d | 30.0 ± 1.9c | 30.0 ± 1.9d |
| 01:01 | 70.0 ± 1.8a | 70.0 ± 1.4a | 60.0 ± 6.0a | 80.0 ± 1.0a |
| 0.5:0.5 | 60.0 ± 1.2b | 50.0 ± 1.7b | 40.0 ± 1.4b | 70.0 ± 1.8b |
| 0.25:0.75 | 50.0 ± 2.2c | 40.0 ± 2.1c | 35.0 ± 0.3b | 60.0 ± 2.3c |
| Shoot length (cm) | ||||
| Control | 32.0 ± 1.9c | 32.0 ± 1.9c | 32.0 ± 1.9b | 32.0 ± 1.9d |
| 01:01 | 43.0 ± 1.0a | 40.0 ± 1.0a | 37.0 ± 2.0a | 51.0 ± 2.1a |
| 0.5:0.5 | 41.0 ± 1.4ab | 39.0 ± 1.4a | 35.0 ± 2.3ab | 42.8 ± 1.7b |
| 0.25:0.75 | 38.0 ± 1.7b | 36.0 ± 1.7b | 33.0 ± 2.8b | 39.0 ± 1.7c |
| Root length (cm) | ||||
| Control | 10.0 ± 1.4b | 9.9 ± 1.4c | 9.7 ± 1.5c | 9.8 ± 1.4c |
| 01:01 | 18.0 ± 1.5a | 17.2 ± 1.2a | 17.0 ± 1.4a | 22.0 ± 1.9a |
| 0.5:0.5 | 17.0 ± 1.1ab | 16.0 ± 1.5ab | 15.3 ± 1.0ab | 19.8 ± 1.2b |
| 0.25:0.75 | 16.8 ± 1.3ab | 14.0 ± 1.8b | 13.0 ± 1.4b | 19.5 ± 0.9b |
| Seed Vigor Index (%) | ||||
| Control | 12.6 ± 0.7d | 12.6 ± 0.5d | 12.5 ± 0.4d | 12.5 ± 0.2d |
| 01:01 | 42.7 ± 0.2a | 40.0 ± 0.6a | 32.4 ± 0.6a | 58.4 ± 0.4a |
| 0.5:0.5 | 34.8 ± 0.2b | 27.5 ± 0.5b | 20.1 ± 0.8b | 43.8 ± 0.5b |
| 0.25:0.75 | 27.4 ± 0.3c | 20.0 ± 0.9c | 16.1 ± 0.5c | 35.1 ± 0.8c |
RR = Reactive Red, GY = Golden Yellow, BB = Brilliant Blue, RO = Reactive Orange. Control represents untreated dye, while 1:1, 0.5:0.5, and 0.25:0.75 denote consortia ratios of B7:B16. Values are expressed as mean ± SE, and different superscript letters within a column indicate significant differences at P £ 0.05
In the control treatments, the seed germination was uniformly low (30%) for all dyes, with limited shoot and root growth, reflecting the inhibitory effects of the dyes on early plant development. Significant improvements were observed in all growth parameters after treatment with bacterial consortia. The 1:1 consortium (B-7:B-16) showed the highest seed germination percentages: 70% for RR and GY, 60% for BB, and a maximum of 80% for RO. The 0.5:0.5 and 0.25:0.75 consortia showed a gradual decline in the germination percentages, although the values remained substantially higher than those of the control for all dyes. Among the dyes, the RO-treated soil consistently registered the highest germination, whereas BB exhibited comparatively lower germination, indicating higher phytotoxicity (Figure 12).
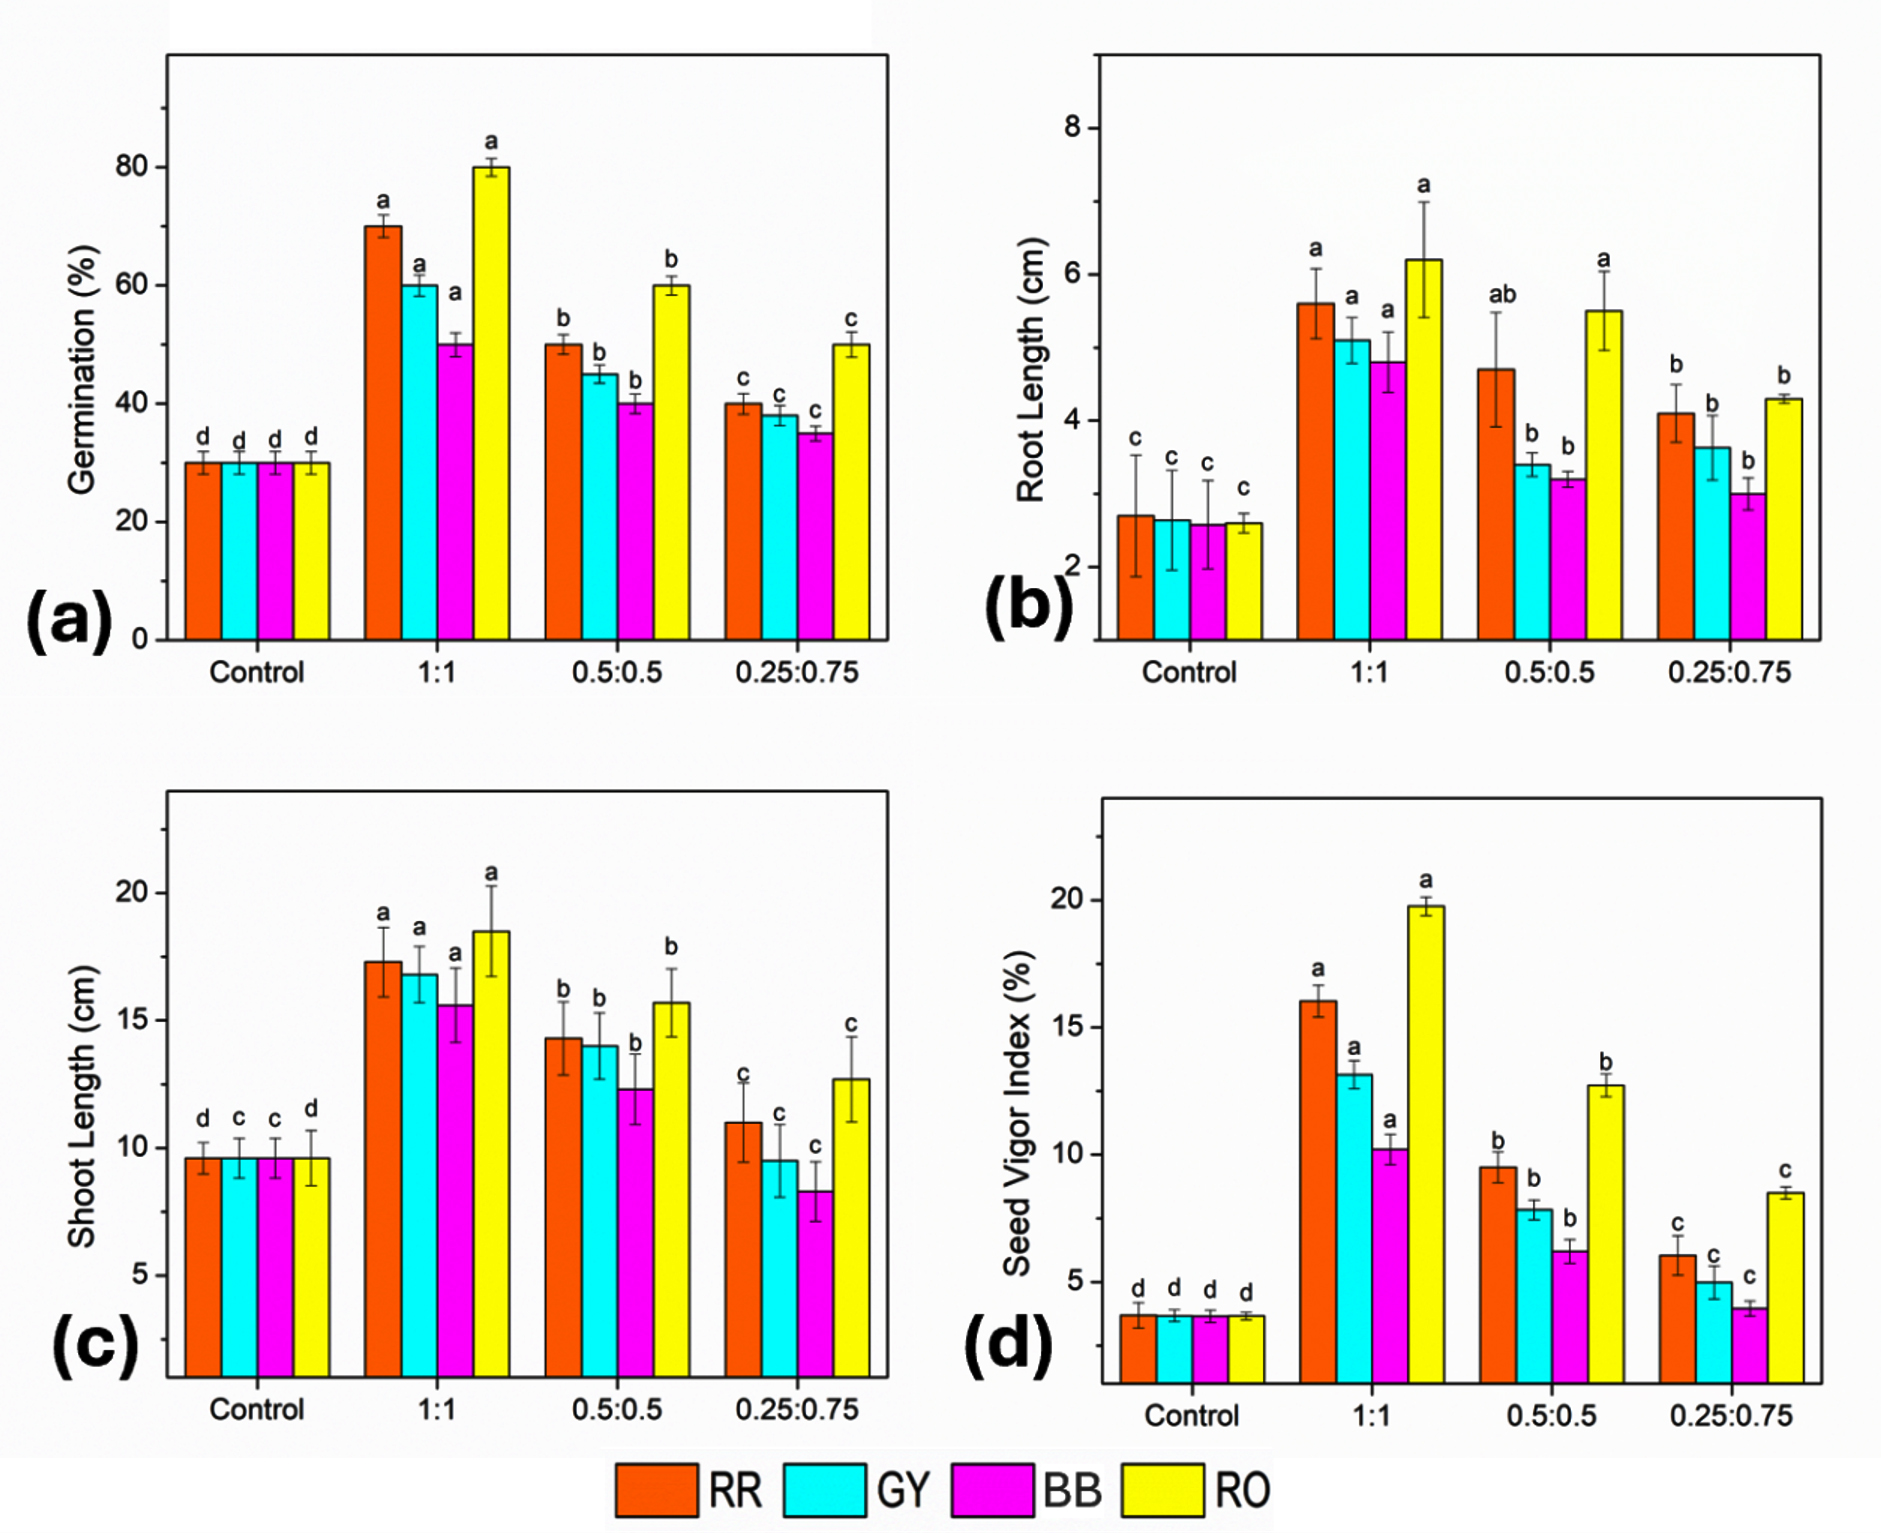
Figure 12. Effect of bacterial consortia ratio (B7:B16) on growth of Z. mays grown under dye-treated conditions: (a) seed germination, (b) root length, (c) shoot length, and (d) seed vigor index. Bars represent mean ± SE, and different letters indicate statistically significant differences among treatments (P £ 0.05)
A similar trend was observed for shoot length, where the 1:1 consortium produced the tallest seedlings, particularly in RO-treated soil (51 cm), followed by RR (43 cm), GY (40 cm), and BB (37 cm). Reduced shoot elongation was noted at lower consortium ratios, although the values remained higher than those of the control. Root length also increased markedly following the consortium treatment, with maximum values again recorded at a 1:1 ratio, reaching 22 cm in RO-treated soil compared to approximately 10 cm in the control. The SVI showed the most significant improvement following the application of bacterial consortia. The control values remained low (approximately 12.5%), whereas the 1:1 consortium increased SVI to 42.7% (for RR), 40.04% (GY), 32.4% (BB), and 58.4% (RO). Lower consortium ratios resulted in reduced but significantly enhanced SVI values compared to the control. Among all the treatments, RO exhibited the highest SVI, followed by RR, GY, and BB.
The application of 10 mg of bacterial consortia effectively alleviated dye-induced phytotoxicity in unpolluted soil, leading to improvements in the seed germination, seedling growth, and vigor of Z. mays. Among the tested treatments, the 1:1 consortium of B-7 (Pseudomonas spp.) and B-16 (Klebsiella spp.) consistently showed the greatest positive impact on all growth parameters. These findings indicate the possible role of bacterial consortia not only in dye degradation, but also in promoting plant growth under dye-stress conditions (Figures 13 and 14).
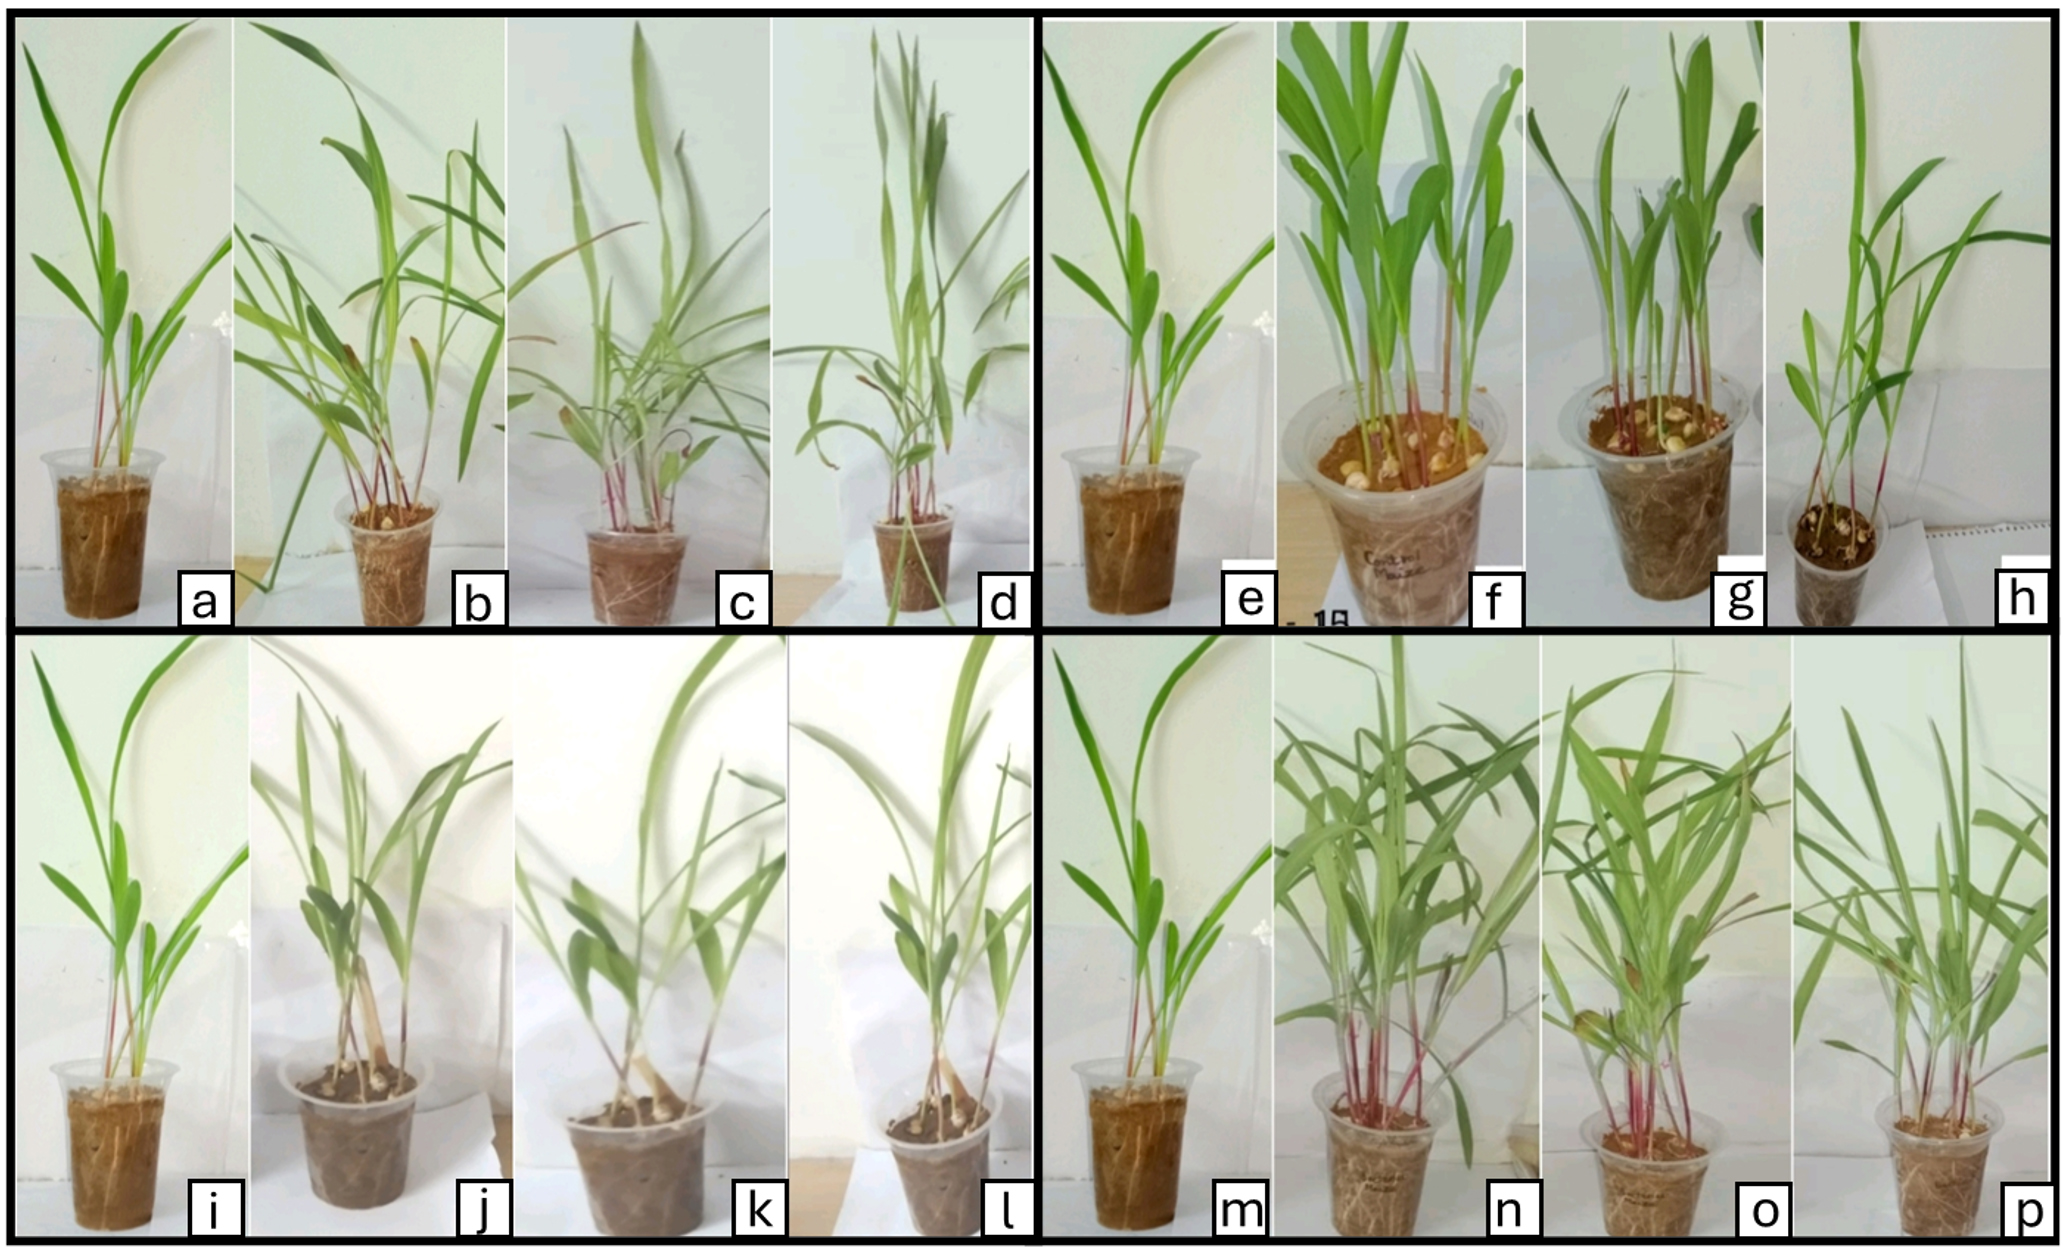
Figure 13. Effect of bacterial consortia ratio (B7:B16) on seed germination and growth of Z. mays grown under dye-treated conditions; (a-d) RR, (e-h) GY, (i-l) BB, and (m-p) RO, the panels represent: (a/e/i/m) control, (b/f/j/n) 1:1, (c/g/k/o) 0.5:0.5, and (d/h/l/p) 0.25:0.75 consortia ratios
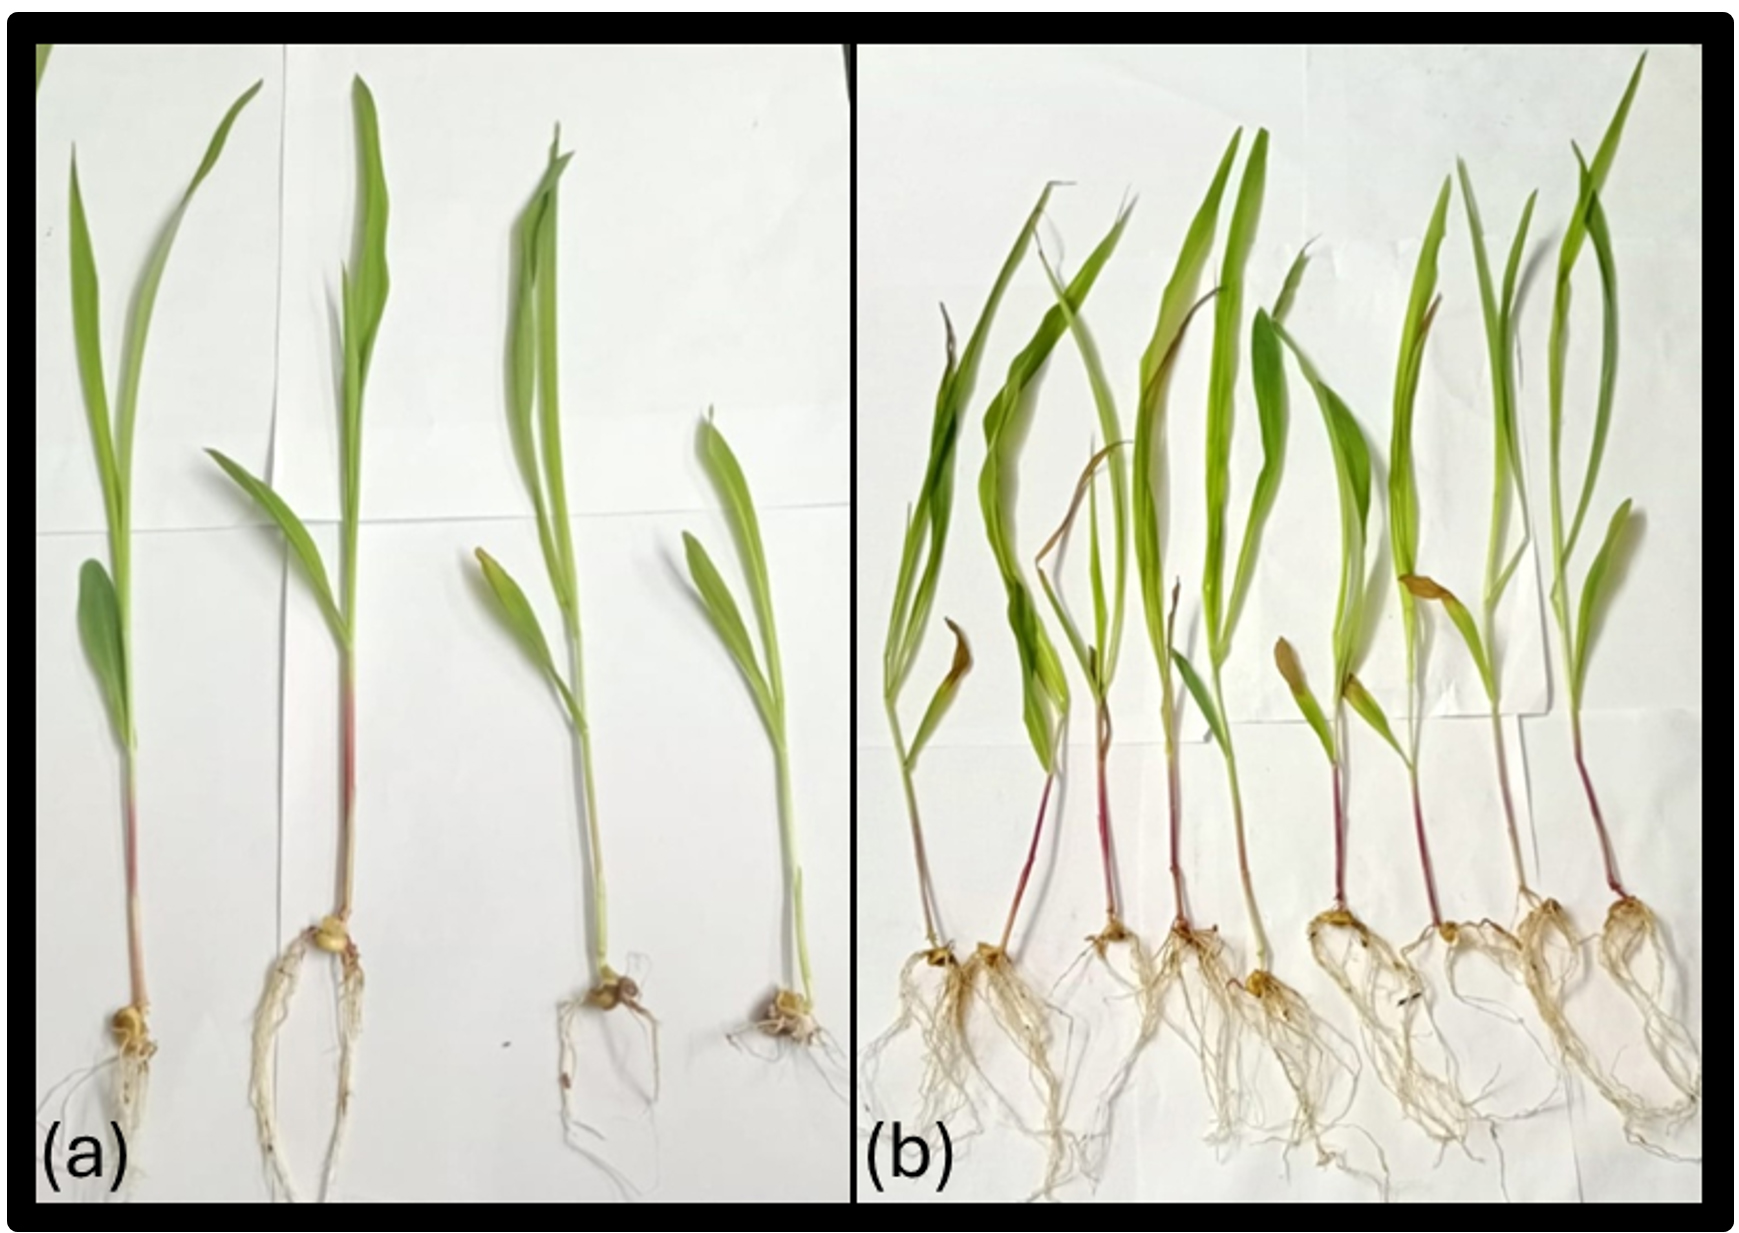
Figure 14. Effect of bacterial consortia ratio on seedling development of Z. mays grown under dye-treated conditions: (a) control and (b) bacterial consortia (B7:B16) at a 1:1 ratio
Impact of bacterial consortia on biochemical attributes of Z. mays
The influence of the bacterial consortia on the key biochemical attributes of Z. mays seedlings was evaluated at a dye concentration of 10 mg. The biochemical parameters analyzed included protein content, total soluble sugar concentration, and starch content. The results are presented in Table 7.
Table (7): Effect of bacterial consortia ratio (B7:B16) on biochemical attributes of Z. mays seedlings grown under dye-treated conditions
| Bacterial consortia ratio | RR | GY | BB | RO |
|---|---|---|---|---|
| Protein concentration (mg g-1) | ||||
| Control | 1.5 ± 0.0d | 1.5 ± 0.0d | 1.5 ± 0.0d | 1.5 ± 0.0d |
| 01:01 | 3.6 ± 0.1a | 3.2 ±0.1a | 2.8 ± 0.1a | 4.0 ± 0.1a |
| 0.5:0.5 | 3.1 ± 0.1b | 2.7 ± 0.0b | 2.5 ± 0.0b | 3.1 ± 0.1b |
| 0.25:0.75 | 2.5 ± 0.0c | 2.2 ± 0.1c | 1.8 ± 0.0c | 2.8 ± 0.1c |
| Total soluble sugar concentration (µg g-1) | ||||
| Control | 339.6 ± 13.9d | 338.2 ± 12.7d | 340.7 ± 13.1d | 342.6 ± 12.4d |
| 01:01 | 603.6 ± 17.4a | 597.6 ± 9.4a | 589.6 ± 18.8a | 658.6 ± 16.1a |
| 0.5:0.5 | 563.6 ± 20.2b | 506.6 ± 27.0b | 498.6 ± 12.5b | 572.6 ± 4.1b |
| 0.25:0.75 | 407.6 ± 6.4c | 395.1 ± 15.0c | 383.1 ± 4.3c | 422.6 ± 26.4c |
| Starch concentration (mg g-1) | ||||
| Control | 736.6 ± 6.0d | 734.6 ± 6.0d | 731.6 ± 6.0d | 732.6 ± 6.0d |
| 01:01 | 928.1 ± 16.4a | 912.1 ± 27.3a | 901.6 ± 11.6a | 945.6 ± 1.09a |
| 0.5:0.5 | 882.6 ± 8.9b | 863.6 ± 20.1b | 854.1 ± 23.6b | 893.1 ± 18.6b |
| 0.25:0.75 | 814.1 ± 22.3c | 799.1 ± 16.9c | 784.6 ± 8.1c | 838.6 ± 14.4c |
RR = Reactive Red, GY = Golden Yellow, BB = Brilliant Blue, RO = Reactive Orange. Control represents untreated dye, while 1:1, 0.5:0.5, and 0.25:0.75 denote consortia ratios of B7:B16. Values are expressed as mean ± SE, and different superscript letters within a column indicate significant differences at P £ 0.05
The protein content of the control seedlings remained low and uniform for all dyes, ranging from 1.538 to 1.541 mg g-1, which indicates limited metabolic activity under dye stress in the absence of bacterial treatment. Applying the bacterial consortia resulted in a significant increase in protein concentration, with the 1:1 consortium (B-7:B-16) exhibiting the highest values for all dyes. The maximum protein content was recorded in the RO-treated seedlings (4.009 mg g-1), followed by RR (3.601 mg g-1), GY (3.23 mg g-1), and BB (2.784 mg g-1) seedlings. The 0.5:0.5 and 0.25:0.75 consortia also showed enhanced protein levels compared to the control, although the increase was progressively reduced with a decrease in the proportion of B-7. Overall, the RO-treated seedlings showed the greatest improvement in protein accumulation across all consortium ratios.
The total soluble sugar content in control seedlings ranged between 338.2 and 342.6 µg g-1, reflecting restricted carbohydrate metabolism under untreated conditions. Applying the consortia significantly enhanced sugar accumulation in Z. mays seedlings. The 1:1 consortium resulted in the highest soluble sugar concentrations for all dyes, with a maximum of 658.6 µg g-1 observed in RO-treated seedlings, followed by RR (603.6 µg g-1), GY (597.6 µg g-1), and BB (589.6 µg g-1). The 0.5:0.5 consortium produced moderately high sugar levels, whereas the 0.25:0.75 consortium showed comparatively lower yet still significantly enhanced sugar levels relative to the control. These results indicate improved photosynthate production and carbohydrate metabolism following treatment with bacterial consortia.
The starch content in the control seedlings ranged from 731.6 to 736.6 mg g-1, with minimal variation among the dyes. By contrast, treatment with bacterial consortia resulted in a substantial increase in starch accumulation. The highest starch content was again observed with the 1:1 consortium, reaching 945.6 mg g-1 in RO-treated seedlings, followed by RR (928.1 mg g-1), GY (912.1 mg g-1), and BB (901.6 mg g-1). The 0.5:0.5 and 0.25:0.75 consortia showed a gradual reduction in starch levels but consistently maintained higher values than the control across all dyes (Figure 15).
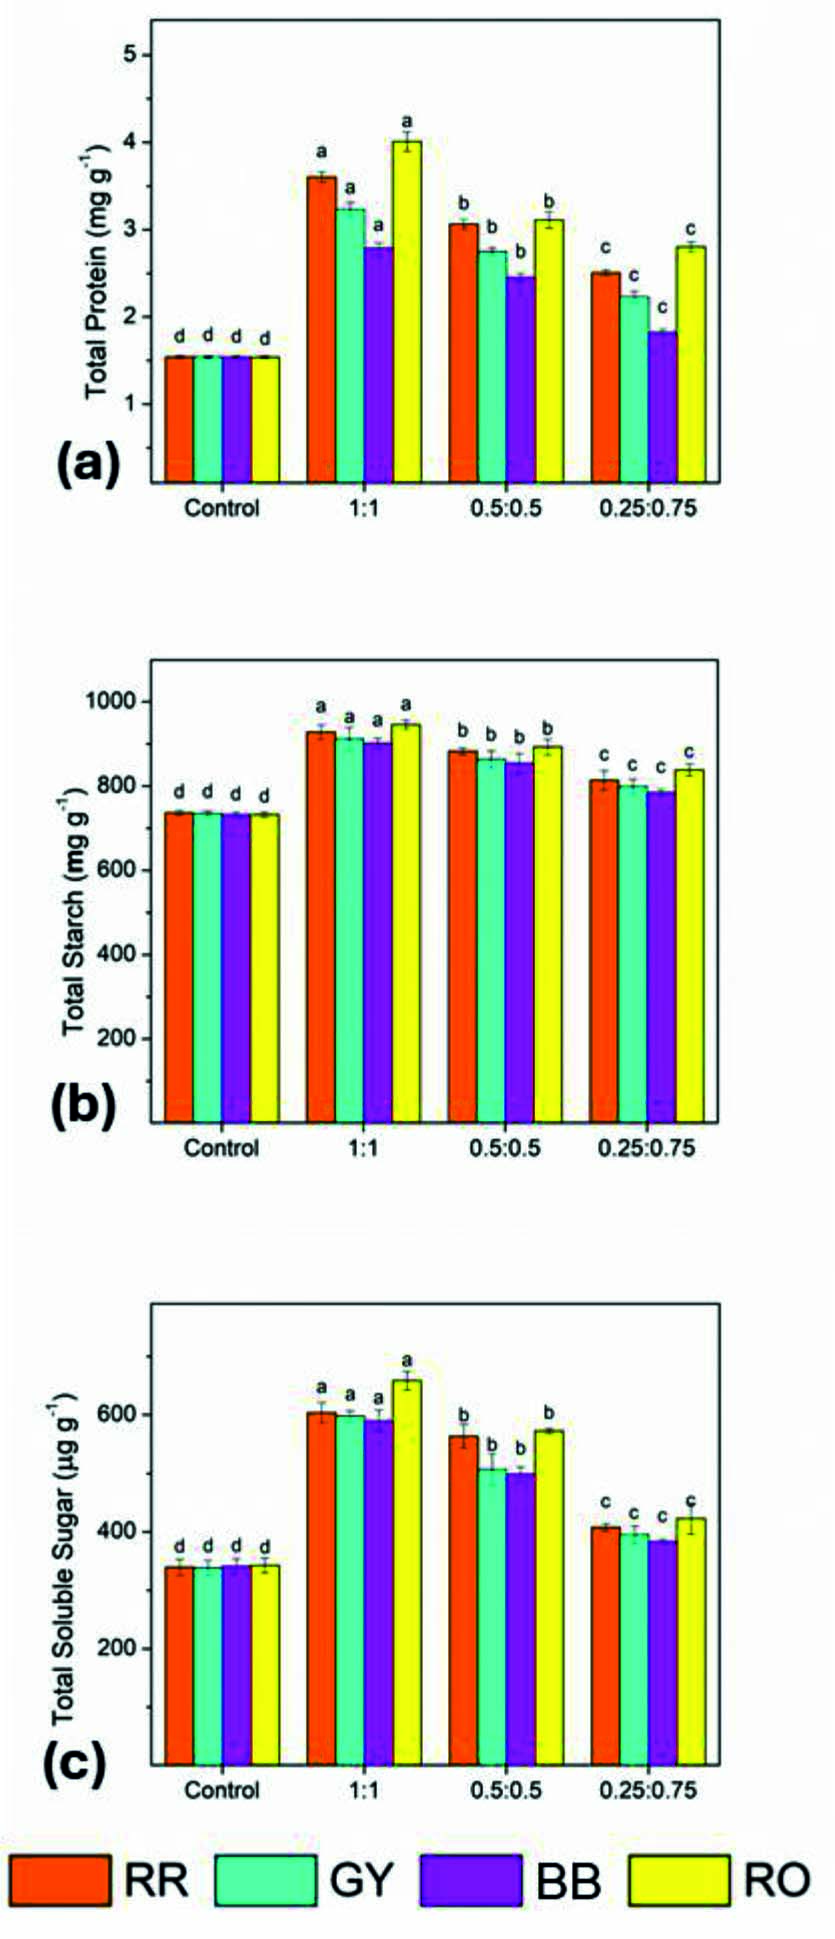
Figure 15. Effect of bacterial consortia ratio (B7:B16) on biochemical attributes of Zea mays seedlings grown under dye-treated conditions: (a) total protein content, (b) total starch content, and (c) total soluble sugar content. Bars represent mean ± SE, and different letters indicate statistically significant differences among treatments (P £ 0.05)
The application of 10 mg of bacterial consortia significantly enhanced the biochemical status of Z. mays seedlings, as evidenced by increased protein, soluble sugar, and starch contents. Among the tested treatments, the 1:1 consortium of B-7 (Pseudomonas spp.) and B-16 (Klebsiella spp.) proved to be the most effective in improving biochemical attributes, particularly in the RO-treated soil. These findings support using bacterial consortia to mitigate dye-induced stress and promote plant metabolic activity under controlled soil conditions.
Microbial adaptation to dye-contaminated environments
The morphological and biochemical characterization of the bacterial isolates conducted in this study revealed the presence of Gram-negative bacteria commonly reported in dye- and effluent-contaminated environments. Pseudomonas spp. were prominently identified in the present study based on colony morphology and biochemical characteristics, including positive catalase, oxidase, methyl red, citrate utilization, and carbohydrate fermentation tests and negative indole production, VP test, nitrate reduction, and starch hydrolysis. Comparable biochemical profiles of Pseudomonas spp. isolated from textile and industrial effluents have been widely reported.25 Additionally, Klebsiella spp., Acinetobacter spp., and Proteus spp. were identified as Gram-negative bacteria, consistent with earlier reports describing these genera in textile wastewater and contaminated soils.26 The repeated isolation of Pseudomonas spp. from textile effluent and tannery wastewater highlights its ecological fitness and metabolic versatility under chemically stressed conditions. Previous studies have emphasized the role of Pseudomonas spp. in textile dye bioremediation, attributing their effectiveness to robust enzymatic systems and adaptability to toxic environments.27
The dominance of Gram-negative bacteria isolated from dye-polluted soils reflects long-term ecological selection driven by chronic chemical stress. Gram-negative bacteria possess a lipopolysaccharide-rich outer membrane that acts as a permeability barrier against toxic aromatic compounds while allowing the controlled transport of xenobiotics into the periplasmic space.28 This structural advantage, combined with high genetic plasticity, enables these organisms to evolve and regulate dye-degrading pathways under polluted conditions. In addition, polluted soils often experience oxidative stress owing to redox-active dye molecules. The universal catalase positivity observed among the isolates indicated a conserved protective mechanism against the hydrogen peroxide and reactive oxygen species generated during dye metabolism.
Enzymatic basis of dye degradation
In this study, the dye degradation efficiency was strongly influenced by the dye structure. The azo dyes (RO and RR) were degraded more efficiently than BB. This difference can be mechanistically attributed to the presence of azo bonds, which are susceptible to reductive cleavage by bacterial azoreductases and flavin-dependent enzymes that utilize nicotinamide adenine dinucleotide + hydrogen (NADH) or nicotinamide adenine dinucleotide phosphate + hydrogen (NADPH) as electron donors.29 The chromophoric structures collapse, leading to rapid decolorization, after the azo bonds are cleaved. Subsequent aerobic steps involve oxidative enzymes, such as monooxygenases and dioxygenases, which further transform aromatic amines into less toxic intermediates.30 The observed decline in the degradation efficiency at higher dye concentrations reflects classic substrate inhibition and toxic stress effects. The elevated dye levels interfere with membrane integrity, enzyme conformation, and electron transport processes, thereby reducing the metabolic efficiency.31 High dye concentrations also increase the intracellular accumulation of toxic intermediates, overwhelming bacterial detoxification systems. Despite this inhibition, Klebsiella sp. (B-16) maintained a relatively high degradation efficiency across all concentrations. This resilience can be mechanistically linked to its efficient central carbon metabolism, as indicated by citrate utilization and VP test positivity, which ensures sustained ATP generation and reduced power for enzyme-driven dye transformation.32
The gradual increase in dye degradation with incubation time indicates the presence of inducible enzyme systems and microbial acclimatization. Initial exposure to dyes likely triggers stress-response pathways, followed by the transcriptional activation of dye-degrading genes. Enzyme synthesis, cofactor availability, and biofilm formation collectively enhanced the degradation efficiency over time.7 The maximum degradation between 29 and 30 hrs suggests that the bacterial populations reached an optimal physiological state with balanced growth rate, enzyme activity, and substrate availability. Similar temporal patterns have been reported for bacterial dye degraders operating under batch conditions.33
Dye degradation efficiency and process parameters
Several studies have demonstrated the capacity of individual bacterial strains to decolorize textile dyes, although these often have lower efficiencies, longer incubation periods, or narrower operational windows. Pseudomonas spp. isolated from dye-contaminated soils have shown high degradation potential for reactive dyes under optimized conditions, consistent with the significant degradation of RR, GY, BB, and RO observed in this study.34 The ability of bacteria to degrade dyes is largely governed by the secretion of oxidative and reductive enzymes, which cleave azo bonds and transform aromatic structures into less complex forms. Multiple studies have confirmed the involvement of these enzymes across diverse bacterial genera, including Bacillus, Enterobacter, Pseudomonas, Aeromonas, and Shewanella.18,35,36 Therefore, the effective degradation observed in this study is consistent with the established enzyme-mediated mechanisms reported for the biodegradation of azo dyes.
Dye concentration is a critical factor that influences the degradation efficiency. Dye concentration levels in textile wastewater commonly range from 10-250 mg L-1, and numerous studies have reported optimal degradation at lower concentrations, with sharp declines at higher levels due to dye toxicity, enzyme inhibition, and unfavorable biomass-to-dye ratios.25,37,38 This study observed maximum degradation at 10 mg L-1, with an increase in concentrations resulting in reduced efficiency, thus agreeing with previous studies and supporting the view that excess dye concentration interferes with bacterial metabolism and enzyme activity. The time-dependent degradation trends further support these findings. While individual bacterial strains typically initiate decolorization after 24 hrs, bacterial consortia often begin earlier and achieve greater degradation because of their cooperative metabolism. In this study, the selected bacteria and their consortia efficiently degraded the dyes within 30 hrs, highlighting their rapid activity under optimized conditions. This performance aligns with earlier observations that the effectiveness of dye decolorization depends on microbial survival, adaptability, and sustained enzyme production,27 and that environmental parameters, particularly pH, also play a decisive role in dye biodegradation. Most bacterial dye degradation processes are optimal under neutral to slightly alkaline conditions, which favor both bacterial growth and enzyme stability.39
Synergistic mechanisms in bacterial consortia
The superior performance of the 1:1 consortium of Pseudomonas sp. (B-7) and Klebsiella sp. (B-16) can be explained by metabolic complementarity and cross-feeding interactions. In such consortia, Klebsiella likely initiates the reductive cleavage of dye molecules, generating partially transformed intermediates that are further oxidized by Pseudomonas, which is known for its strong oxidative metabolism.40 Balanced population ratios are critical for maintaining efficient metabolite exchange. Unequal ratios may lead to the accumulation of toxic intermediates or resource competition, explaining the reduced performance observed in the 0.5:0.5 and 0.25:0.75 consortia. The comparable synergistic effects of bacterial consortia on dye degradation have been widely documented.31,32
Recent research has moved from using single bacterial strains to deploying bacterial consortia to enhance dye degradation efficiency. Mixed microbial cultures consistently outperform individual isolates due to synergistic metabolic interactions, complementary enzyme systems, and improved adaptability to complex dye structures.41 The enhanced performance of the 1:1 consortium of Klebsiella sp. and Pseudomonas sp. we observed is consistent with previous studies reporting improved dye decolorization by bacterial consortia compared to single strains.42,43 While several reports have documented higher degradation efficiencies under optimized conditions or extended incubation times, the degradation levels achieved in this study are noteworthy given the short incubation period and low dye concentration, highlighting the effectiveness of the selected consortium.44,45 The physicochemical changes observed after microbial treatment, together with reduced phytotoxicity in bioassays, further indicate the less toxic nature of the degradation products. Beyond dye degradation, beneficial bacterial populations play an important role in soil conditioning and plant growth promotion through nutrient solubilization, suppression of pathogens, and improvement of rhizospheric health.46 This study agrees with these findings, demonstrating that a Klebsiella–Pseudomonas consortium not only enhances dye degradation but also contributes to reduced toxicity and improved biological compatibility, underscoring its potential application in the bioremediation of textile dye–contaminated environments.
The shift in pH from acidic to alkaline after bacterial treatment provides strong, if indirect, evidence of dye mineralization. The acidic pH of the untreated dyes arises from sulfonic and carboxylic groups. The microbial cleavage of these groups and subsequent amine formation alkalinizes the medium.29 Greater pH elevation in consortium treatments reflects more extensive dye transformation and higher metabolic flux. This alkalinization is environmentally beneficial because acidic dye residues are more phytotoxic and disruptive to soil microbial communities.47
FTIR analysis of dye degradation products
FTIR spectroscopy is a fundamental technique for identifying functional groups in dyes and their degradation products, and is widely used to confirm microbial dye biodegradation.48 In this study, the FTIR spectra of the untreated dyes exhibited multiple characteristic peaks corresponding to hydroxyl, imino/azo, aromatic nitro, alkyl, sulfonyl, siloxane, disulfide, and halogenated functional groups, reflecting the complex aromatic structure of textile dyes. Similar spectral features have been reported for Congo red, Evans blue, methyl orange, and direct red dyes.49-51 Noticeable changes in the FTIR spectra were observed after bacterial treatment, including peak shifts, the appearance of new absorption bands, and the disappearance of several control dye peaks. Such spectral modifications have been widely recognized as evidence of dye degradation rather than simple adsorption.18,52 The new peaks corresponding to the hydroxyl, amine, imino, alkyl, and ether functional groups were detected in treated samples, similar to those reported for Congo red and methyl orange degradation, as previously reported.50,53 The disappearance of the characteristic peaks observed in untreated dyes after treatment further supports the microbial transformation of dye molecules, as also reported for Eriochrome Black T and other azo dyes.52,54 Iordache et al.55 have demonstrated hydrogen bond formation with azo groups during fungal dye degradation, while Singh et al.51 have reported the formation of new functional groups following the microbial treatment of Reactive Yellow-145 dyes. The targeted cleavage of azo bonds around 1600-1620 cm-1 has also been reported during the bacterial degradation of Direct Red-22.49
Mechanism of phytotoxicity alleviation and plant growth recovery
Seed germination, seedling growth, and seed vigor are sensitive indicators of the phytotoxic stress caused by textile dyes and dye effluents. Previous studies have indicated that germination capacity, root and shoot lengths, and SVI are significantly affected by the dye type and concentration, with higher concentrations causing growth inhibition.56
In this study, the untreated dyes adversely affected the seed germination, shoot length, root length, and SVI of maize, whereas treatment with dye-degrading bacterial isolates and, more effectively, bacterial consortia significantly improved all growth parameters. These findings are consistent with earlier reports showing that microbial degradation reduces dye toxicity and restores plant growth.48 Similarly, maize growth has been enhanced after bacterial treatment of dye-contaminated soils.57 Consortium-based treatments consistently exhibited superior performance compared to individual strains, particularly in the case of RO dye. This observation aligns with previous studies reporting synergistic dye degradation and improved plant growth using microbial consortia.51,58 The improvement in seed vigor after treatment with degraded dye solutions further supports reduced phytotoxicity, as has been reported in studies using biologically treated effluents.59,60 Biochemical attributes, such as protein, total soluble sugars, and starch content, were suppressed under untreated dye stress but increased significantly after treatment using bacterial consortia. Similar reductions under untreated effluent stress, and recovery following biological treatments, have been reported for maize and other crops.61-63
Taken together, the mechanistic evidence indicates that bacterial consortia derived from polluted soils act via multilevel interactions, including enzymatic dye breakdown, microbial cooperation, physicochemical modification of the environment, and indirect promotion of plant metabolism. These findings are consistent with, and extend those of earlier reports, demonstrating that balanced bacterial consortia can simultaneously achieve pollutant degradation and ecological restoration.
This study confirmed that indigenous bacteria isolated from textile effluent–contaminated soils possess significant potential for the biodegradation of synthetic dyes. Among the isolates, Pseudomonas sp. (B-7) and Klebsiella sp. (B-16) showed the highest degradation efficiencies, particularly when used as a 1:1 bacterial consortium. Dye degradation was influenced by the dye type, concentration, and incubation time. The FTIR analysis verified the structural breakdown of the dye molecules, indicating their biodegradation. Biological treatment markedly reduced dye-induced phytotoxicity, leading to improved seed germination, seedling growth, and SVI, and enhanced primary metabolite accumulation in Z. mays. These findings demonstrate that soil-derived bacterial consortia provide an effective and eco-friendly approach for textile dye bioremediation, while simultaneously supporting plant growth and soil health, highlighting their potential application in sustainable agriculture.
ACKNOWLEDGMENTS
The authors are thankful to the SLAS, Mody University of Science and Technology, Lakshmangrah-332311, Sikar, Rajasthan, India, for providing research support facilities, and to the “CURIE Core Grants for Women Universities” dated 23 January 2023, File No.: DST/CURIE-01/2023/MU for the funding support.
CONFLICT OF INTEREST
The authors declare that there is no conflict of interest.
AUTHORS’ CONTRIBUTION
Both authors listed have made a substantial, direct and intellectual contribution to the work, and approved it for publication.
FUNDING
None.
DATA AVAILABILITY
All datasets generated or analyzed during this study are included in the manuscript.
ETHICS STATEMENT
Not applicable.
- Desore A, Narula SA. An overview on corporate response towards sustainability issues in textile industry. Environ Dev Sustain. 2018;20(2):1439-1459.
Crossref - Ikram M, Haider A, Moeen S. Chemical Composition of Organic Dyes. In: Ferrite Nanomaterials for Wastewater Treatment: Springer. 2026:57-75.
Crossref - Holkar CR, Jadhav AJ, Pinjari DV, Mahamuni NM, Pandit AB. A critical review on textile wastewater treatments: possible approaches. J Environ Manage. 2016;182:351-366.
Crossref - Bafana A, Devi SS, Chakrabarti T. Azo dyes: past, present and the future. Environ Rev. 2011;19:350-371.
Crossref - Ahmad SM, Al-Taie ZS, Al-Mashhadani MH, et al. An overview of preparation for different azo compounds. Al-Nahrain J Sci. 2024;27(1):1-13.
Crossref - El-Sayed E, Abd El-Aziz E, Othman H, Hassabo AG. Azo dyes: Synthesis, classification and utilisation in textile industry. Egypt J Chem. 2024;67:87-97.
Crossref - Saratale RG, Saratale GD, Chang J-S, Govindwar SP. Bacterial decolorization and degradation of azo dyes: a review. J Taiwan Inst Chem Eng. 2011;42(1):138-157.
Crossref - Pang YL, Abdullah AZ. Current status of textile industry wastewater management and research progress in Malaysia: a review. Clean – Soil Air Water. 2013;41(8):751-764.
Crossref - Meena RS, Mathur AK. Available micronutrients in relation to soil properties of Ghatol tehsil, Banswara district of Rajasthan, India. Int J Curr Microbiol Appl Sci. 2017:6:102-108.
Crossref - Vikrant K, Giri BS, Raza N, et al. Recent advancements in bioremediation of dye: current status and challenges. Bioresour Technol. 2018;253:355-367.
Crossref - Bhatia D, Sharma NR, Singh J, Kanwar RS. Biological methods for textile dye removal from wastewater: A review. Crit Rev Environ Sci Technol. 2017;47(19):1836-1876.
Crossref - Asses N, Ayed L, Hkiri N, Hamdi M. Congo red decolorization and detoxification by Aspergillus niger: removal mechanisms and dye degradation pathway. Biomed Res Int. 2018;2018:3049686.
Crossref - Bustard M, McMullan G, McHale AP. Biosorption of textile dyes by biomass derived from Kluyveromyces marxianus IMB3. Bioprocess Eng. 1998;19:427-430.
Crossref - Ilyas A, Batool K. Innovative enzymatic and microbial approaches for wastewater bioremediation: Advances in enzyme engineering, biotechnology, and nanotechnology for sustainable water management-A comprehensive review. Premier J Sci. 2025:9:100074.
Crossref - Ayub A, Wani AK, Chopra C, et al. Advancing dye degradation: integrating microbial metabolism, photocatalysis, and nanotechnology for eco-friendly solutions. Bacteria. 2025;4(1):15.
Crossref - Jamee R, Siddique R. Biodegradation of synthetic dyes of textile effluent by microorganisms: an environmentally and economically sustainable approach. Eur J Microbiol Immunol. 2019;9(4):114-118.
Crossref - Dong H, Guo T, Zhang W, et al. Biochemical characterization of a novel azoreductase from Streptomyces sp.: application in eco-friendly decolorization of azo dye wastewater. Int J Biol Macromol. 2019;140:1037-1046.
Crossref - Bharagava RN, Mani S, Mulla SI, Saratale GD. Degradation and decolourization potential of an ligninolytic enzyme producing Aeromonas hydrophila for crystal violet dye and its phytotoxicity evaluation. Ecotoxicol Environ Saf. 2018;156:166-175.
Crossref - Qurashi AW, Sabri AN. Bacterial exopolysaccharide and biofilm formation stimulate chickpea growth and soil aggregation under salt stress. Braz J Microbiol. 2012;43(3):1183-1191.
Crossref - Pimpalse M, Supriya GNR. A multifaceted approach of Rhizobium sp. PS1 for biodegradation of azo dye blue GSL and plant growth promotion by alleviating dye induced stress. World J Microbiol Biotechnol. 2025;41(7):210.
Crossref - Lowry OH, Rosebrough NJ, Farr AL, Randall RJ. Protein measurement with the Folin phenol reagent. J Biol Chem. 1951;193(1):265-275.
Crossref - Osborne DJ. Effect of kinetin on protein & nucleic acid metabolism in Xanthium leaves during senescence. Plant Physiol. 1962;37(5):595.
Crossref - Dubois M, Gilles K, Hamilton JK, Rebers PA, Smith F. A colorimetric method for the determination of sugars. Nature. 1951;168(4265):167-167.
Crossref - Loomis WE, Shull CA, Snedecor, G.W. Methods in Plant Physiology: A Laboratory Manual and Research Handbook: McGraw-Hill. 1937.
- Bera SP, Tank SK. Screening and identification of newly isolated Pseudomonas sp. for biodegrading the textile azo dye CI Procion Red H 3B. J Appl Microbiol. 2021;130(6):1949-1959.
Crossref - Roy DC, Sheam MM, Hasan MR, et al. Isolation and characterization of two bacterial strains from textile effluents having Malachite Green dye degradation ability. bioRxiv. 2020.
Crossref - Senan RC, Abraham TE. Bioremediation of textile azo dyes by aerobic bacterial consortium aerobic degradation of selected azo dyes by bacterial consortium. Biodegradation. 2004;15(4):275-280.
Crossref - Pandey A, Singh P, Iyengar L. Bacterial decolorization and degradation of azo dyes. Int Biodeterior Biodegrad. 2007;59:73-84.
Crossref - Jay NP, Darshit KV, Pavan RJ, Devayani RT. Bacterial enzymes for azo dye degradation: an insight. Res J Chem Environ. 2023;27(4):135-148.
Crossref - Mohanty SS, Kumar A. Microbial decolorization of anthraquinone dyes: batch and continuous treatment systems-a mini-review. Front Environ Eng. 2025;4:1553712.
Crossref - Saratale RG, Saratale GD, Chang JS, Govindwar SP. Decolorization and biodegradation of reactive dyes and dye wastewater by a developed bacterial consortium. Biodegradation. 2010;21(6):999-1015.
Crossref - Jadhav JP, Phugare SS, Dhanve RS, Jadhav SB. Rapid biodegradation and decolorization of Direct Orange 39 (Orange TGLL) by an isolated bacterium Pseudomonas aeruginosa strain BCH. Biodegradation. 2010;21(3):453-463.
Crossref - Khehra MS, Saini HS, Sharma DK, Chadha BS, Chimni SS. Decolorization of various azo dyes by bacterial consortium. Dyes Pigments. 2005;67:55-61.
Crossref - Shah MP, Patel KA, Darji A. Microbial decolorization of reactive black by Pseudomonas stutzeri ETL-79. Int J Environ Bioremediat Biodegrad. 2013;1(2):37-42.
Crossref - Imran M, Negm F, Hussain S, et al. Characterization and purification of membrane bound azoreductase from azo dye degrading Shewanella sp. strain IFN4. Clean – Soil Air Water. 2016;44(11):1523-1530.
Crossref - Skvortsova EG, Golovanova IL, Filippov AA, Kulivatskaya EA, Filinskaya OV, Bogdanova AA. Activity of digestive enzymes and intestinal microbiota in the African catfish Clarias gariepinus. Microbiology. 2025;94(6);1087-1097.
Crossref - Ghaly A, Ananthashankar R, Alhattab M, Ramakrishnan VV. Production, characterization and treatment of textile effluents: a critical review. J Chem Eng Process Technol. 2014;5:1-19.
Crossref - Sharma SCD, Sun Q, Li J, et al. Decolorization of azo dye methyl red by suspended and co-immobilized bacterial cells with mediators anthraquinone-2, 6-disulfonate and Fe3O4 nanoparticles. Int Biodeterior Biodegrad. 2016;112:88-97.
Crossref - Ezhilarasu A. Textile industry dye degrading by bacterial strain Bacillus sp. Int J Adv Res Biol Sci. 2016;3(3):211-226.
- Zhang Q, Chen L, Xie X, et al. Molecular mechanism triggered by co-metabolic biodegradation of azo dyestuff by Klebsiella sp. KL-1: Based on enzymatic and proteomic responsiveness. J Water Process Eng. 2024;62:105339.
Crossref - Thiruppathi K, Rangasamy K, Ramasamy M, Muthu D. Evaluation of textile dye degrading potential of ligninolytic bacterial consortia. Environ Challenges. 2021;4:100078.
Crossref - Mao J, Luo Y, Teng Y, Li Z. Bioremediation of polycyclic aromatic hydrocarbon-contaminated soil by a bacterial consortium and associated microbial community changes. Int Biodeterior Biodegrad. 2012;70:141-147.
Crossref - Mahmood R, Sharif F, Ali S, Hayyat MU. Enhancing the decolorizing and degradation ability of bacterial consortium isolated from textile effluent affected area and its application on seed germination. Sci World J. 2015;2015:628195.
Crossref - Das A, Mishra S. Removal of textile dye reactive green-19 using bacterial consortium: process optimization using response surface methodology and kinetics study. J Environ Chem Eng. 2017;5(1):612-627.
Crossref - Mohanty SS, Kumar A. Biodegradation of Indanthrene Blue RS dye in immobilized continuous upflow packed bed bioreactor using corncob biochar. Sci Rep. 2021;11(1):13390.
Crossref - Akhtar N, Naveed M, Khalid M, Ahmad N, Rizwan M, Siddique S. Effect of bacterial consortia on growth and yield of maize grown in Fusarium infested soil. Soil Environ. 2018;37(1):35-40.
Crossref - Forgacs E, Cserhati T, Oros G. Removal of synthetic dyes from wastewaters: a review. Environ Int. 2004;30(7):953-971.
Crossref - Kishor R, Purchase D, Saratale GD, et al. Degradation mechanism and toxicity reduction of methyl orange dye by a newly isolated bacterium Pseudomonas aeruginosa MZ520730. J Water Process Eng. 2021;43:102300.
Crossref - Prasad ASA, Rao KVB. Aerobic biodegradation of Azo dye by Bacillus cohnii MTCC 3616; an obligately alkaliphilic bacterium and toxicity evaluation of metabolites by different bioassay systems. Appl Microbiol Biotechnol. 2013;97(16):7469-7481.
Crossref - Kishor R, Purchase D, Saratale GD, et al. Environment friendly degradation and detoxification of Congo red dye and textile industry wastewater by a newly isolated Bacillus cohnni (RKS9). Environ Technol Innov. 2021;22:101425.
Crossref - Singh AL, Chaudhary S, Kumar S, Kumar A, Singh A, Yadav A. Biodegradation of Reactive Yellow-145 azo dye using bacterial consortium: A deterministic analysis based on degradable Metabolite, phytotoxicity and genotoxicity study. Chemosphere. 2022;300:134504.
Crossref - Kurade MB, Waghmode TR, Kagalkar AN, Govindwar SP. Decolorization of textile industry effluent containing disperse dye Scarlet RR by a newly developed bacterial-yeast consortium BL-GG. Chem Eng J. 2012;184:33-41.
Crossref - Haq I, Raj A, Markandeya. Biodegradation of Azure-B dye by Serratia liquefaciens and its validation by phytotoxicity, genotoxicity and cytotoxicity studies. Chemosphere. 2017;196:58-68.
Crossref - Chaieb K, Hagar M, Radwan NRE. Biodegradation and decolorization of azo dyes by adherent Staphylococcus lentus strain. Appl Biol Chem. 2016;59(3):405-413.
Crossref - Iordache O, Moga IC, Mitran E-C, et al. Microbial degradation of an industrial azo-dye and FT-IR analysis. Industria Textila. 2020;71(06):600-604.
Crossref - Rahman MA, Rayhan MYH, Chowdhury MAH, Mohiuddin K, Chowdhury MAK. Phytotoxic effect of synthetic dye effluents on seed germination and early growth of red amaranth. Fundam Appl Agric. 2018;3(2):480-490.
Crossref - Maqbool Z, Hussain S, Mahmood F, et al. Metaltolerant Pseudomonas aeruginosa strain ZM130 has the potential for concurrent dye decolorization and plant growth promotion PP: 2621-2631. Int J Agric Biol. 2018;20(12):2621-2631
- Shakeel M, Imran M, Ashraf M, Ullah N. Biodegradation by co inoculated bacteria and fungi alleviates adverse effects of red S3B on growth and nitrogen uptake of wheat. Clean – Soil Air Water. 2020;48(3):1900305.
Crossref - Rahman MA, Rahman MS, Mohiuddin K, Chowdhury MAH, Chowdhury MAK. Germination and seedling growth of rice (Oryza sativa L.) as affected by varying concentrations of loom-dye effluent: germination and rice growth affected by effluent. J Bangladesh Agric Univ. 2019;17(2):153-160.
Crossref - Nordin N, Halmi MIE, Thobunluepop P, et al. Effect of seed germination and early seedling growth response on two Rice (Oryza sativa) varieties supplied with different types and concentrations of Wastewater in Thailand. J Biochem Microbiol Biotechnol. 2023;11(2):24-34.
Crossref - Ramya S, Kumar RP, Murugesan S, Anitha S. Effect of textile effluent on seedling germination, growth and biochemical characteristics of Arachis hypogaea L. variety K6. Int J Pharma Res Health Sci. 2017; 5(4):1805-09
Crossref - Hussain F, Malik SA, Athar M, et al. Effect of tannery effluents on seed germination and growth of two sunflower cultivars. Afr J Biotechnol. 2010;9(32):5113-5120.
Crossref - Yasmeen T, Ali Q, Islam F, Noman A, Akram MS, Javed MT. Biologically treated wastewater fertigation induced growth and yield enhancement effects in Vigna radiata L. Agric Water Manag. 2014;146:124-130.
Crossref
© The Author(s) 2026. Open Access. This article is distributed under the terms of the Creative Commons Attribution 4.0 International License which permits unrestricted use, sharing, distribution, and reproduction in any medium, provided you give appropriate credit to the original author(s) and the source, provide a link to the Creative Commons license, and indicate if changes were made.