

ISSN: 0973-7510
E-ISSN: 2581-690X
Among 46 numbers of total germplasms screened, two germplasms Pant P 244 and Pant P 42 showed moderate resistant, 13 germplasms were moderately susceptible, 29 germplasms were found susceptible and two germplasms HFP-4 and HUVP 1 were found highly susceptible. Moderately resistant germplasm showed low AUDPC value (160.83-188.33) with slow infection rate (0.054-0.062). Pustule appeared on these genotypes were small (1.5-1.7mm) as compare to other susceptible genotypes whereas moderately susceptible genotypes scored AUDPC value from 175.83-437.50 with infection rate of 0.051-0.095. Size of the pustules showed high variation of 1.3-4.4mm. Genotypes with susceptible reaction showed AUDPC value of 292.50-797.50. Infection rate was ranged from 0.055-0.113 with pustule size of 2.9-4.8mm. Those genotypes which fall under highly susceptible reaction (HFP-4 and HUVP-1) scored highest AUDPC value of 1078.33-1223.33 with 0.064-0.075 infection rate. They showed largest pustule size of 4.2-4.6mm. Thus, two genotypes showing moderately resistant reaction in the following experiment can be fruitfully integrate with reduced number of fungicidal spray to obtain maximum yield with minimal rust severity.
Germplasm, Area under disease progress curve (AUDPC), Pustule, Resistant, Susceptible.
India is the largest producer, consumer and importer of pulses in the world. In India pulses are grown about 24-26 million hectares of area producing 17-19 million tonnes of pulses annually. India accounts for over one third of the total world area and over 20 per cent of total world pulse production. Consequently per capita production and availability of pulses in the country has witnessed sharp decline. Per capita net pulse availability has declined from around 60 grams per day in the 1950s to 40 grams in the 1980s and further to around 35 grams per day in 2000s. However, in the past four years, there has been significant increase in consumption averaging around 50 grams due to higher production, under owing to National Food Security Mission (NFSM), with major emphasis on pulses and their imports, mostly of dry peas from Canada and Australia1.
Major pulses grown in India include chickpea or bengal gram (Cicer arietinum), pigeonpea or red gram (Cajanus cajan), lentil (Lens culinaris), urdbean or black gram (Vigna mungo), mungbean or green gram (Vigna radiata), lablab bean (Lablab purpureus), moth bean (Vigna aconitifolia), horse gram (Dolichos uniflorus), pea (Pisum sativum L.), grass pea or khesari (Lathyrus sativus), cowpea (Vigna unguiculata), and broad bean or faba bean (Vicia faba).
During 2012-13, field pea (Pisum sativum L.) occupies an area of 0.76 million hectares with a production 0.84 million tonnes and productivity of 1100 kg/ha in our country. In Uttarakhand, area, production and productivity of pea during 2012-13 was 61.0 thousand hectares, 51.3 thousand tones and 841 kg/ha, respectively2. Field pea is a high quality protein rich pulse and vegetable crop. Dry pea generally contain 23 per cent protein, 48 per cent starch, eight per cent sugar, four per cent lipid, seven per cent crude fibre and three per cent ash3. Dry pea (also known as field pea) differs from fresh peas in that field pea is marketed as a dry, shelled product for human food whereas fresh peas are typically marketed as fresh green pods and immature seeds, which are consumed as vegetables.
Pea is affected by a number of fungal (rust, powdery mildew, downy mildew, root rot, alternaria blight, aschochyta blight, wilt, anthracnose, cercospora leaf spot, damping off, seedling rot etc.), bacterial (bacterial blight and brown spot), nematode (cyst nematode, lesion nematode and root-knot nematode) and viral diseases (cucumber mosaic virus, pea early browning virus, pea enation mosaic, pea mosaic, pea seed borne mosaic, pea streak and pea stunt). These diseases, under the right conditions, can significantly decrease both yield and quality. Among these, the rust of pea caused by Uromyces viciae–fabae (Pers.) J. Schrot (syn. Uromyces fabae (Pers.) de Bary) is considered the most important under warm and humid conditions4. It has been reported from different parts of the country including eastern India5, 6, central India7, southern parts of India8, 9 and from Himalayan region of Uttarakhand and Himachal Pradesh10, 11. In the last few years, disease has been observed in almost epiphytotic form and could cause up to 20-100% losses in yield12, 11.
The disease can be controlled by applying a number of management strategies including biological, cultural, chemical and planting resistant varieties 13. The use of host plant resistance is considered the best means of rust control14. Screening of pea germplasm under field conditions for resistance to rust has been reported from India15 and continuous efforts were made from few decades to find a good source of resistance in pea against rust disease. Presently, there is no single variety showing complete resistance against rust. Therefore, the present experiment was carried out in search for good resistance against pea rust.
Based on the severity of rust disease, Pantnagar has been designated as one of the hotspot for screening of pea germplasm against rust disease. A total of 46 pea germplasms obtained from AICRP MULLaRP (All India Coordinated Research Project on Mung, Urd, Lentil, Lathyrus, Rajmash and Pea) of ICAR, New Delhi, India were used in this study. Topographically, Pantnagar falls in the humid and subtropical (Tarai) climate of North West Plain Zone (NWPZ). The zone lies at the foothills of Shivalic range in lower Himalayas. It is situated at 29p N latitude and 79.73p E longitude, at an altitude of 243.8 m. above the mean sea level (MSL). The average relative humidity is highest (70-80%) in July-August and December–January, while lowest (35-40%) in April-May. Average rainfall in this area is about 1400 mm per annum (GBPUAT meteorological station, Pantnagar).
Screening of germplasm under natural epiphytotic condition was carried out in the field during Rabi season 2013-14 and 2014-15 at N.E. Borlogue Crop Research Centre (NEBCRC), G.B. Pant University of Agriculture and Technology, Pantnagar. The germplasm screening was undertaken following ‘Infector row technique’. Each entry was sown with wider spacing of 30 x 10cm in 3m row with a susceptible check ‘HFP-4’ after every five entries and a susceptible border row for over 2 seasons (Rabi 2013-2014 and 2014-2015). The observation on rust severity was recorded when first symptoms appear and subsequent observations were recorded at ten days interval and Table1
Table (1):
Disease severity scale showing different types of disease reaction.
Rating |
Description |
Disease reaction |
|---|---|---|
0 |
No symptoms on leaf |
Immune (I) |
1 |
Rust pustules small, scattering covering 1% or less of leaf area |
Resistant (R) |
3 |
Rust pustules more in number covering 1-10% of leaf area |
Moderately resistant (MR) |
5 |
Typical rust pustules covering 11-25% of leaf area |
Moderately susceptible (MS) |
7 |
Typical rust pustules covering 26-50% of leaf area. Leaf shedding |
Susceptible (S) |
9 |
Typical rust pustules covering 51% or more of leaf area. Defoliation severe |
Highly susceptible (HS) |
final observations was recorded at 20 days before harvesting of entries. Disease severity was determined using 0-9 rating scale16. The genotypes were later grouped into different categories based on 0 to 9 scale of disease severity from immune to highly susceptible according to Mayee and Datar (1986)16 with slight modifications (Table 1.). Scoring for the pustule size was done by adopting the modified 0–6 scale17 at a stage, when the disease intensity was highest in susceptible genotype (0 = less than 0.5 mm, 1 = 0.5–1.2 mm, 2 = 1.3–2.0 mm, 3 = 2.1–2.8 mm, 4 = 2.9–3.6 mm, 5 = 3.7–4.4 mm, 6 = 4.5–5.2 mm)18. To compare the different genotypes for their resistance ‘A’ value and ‘r’ value were calculated for each genotype. Correlation coefficients of AUDPC with pustule size were also estimated using Karl Pearson’s correlation coefficient (r).
The following parameters were calculated in the studies:
(i) AUDPC (A) value:
K
A= ½ (Si + Si -1) d
i =1
Rust severity was quantified using the formula given by Wilcoxson et al. (1975)19.
Where Si = Disease incidence at the end of the week i, k = Number of successive evaluations of disease, and d = Interval between two evaluations.
(ii) Apparent rate of infection (‘r’):
r = 2.303/t2 – t1
log x2 (1-x1)/x1(1-x2)
The apparent rate of infection was calculated using Vanderplank (1968)20 formula:
where, r is the apparent infection rate in non-logarithmic phase, x1 is the disease index at initial week time (t1), x2 is the disease index at subsequent week time (t2)
(iii) Observation on yield components:
(a) 1000-grain weight (g)
One thousand grains were counted from each plot and weight (g) was recorded with the help of monophan digital electronic balance.
(b) Grain yield (kg/ha)
Naturally dried plants from the individual plot were harvested, air dried, threshed and cleaned. The cleaned grains were dried upto 10 per cent moisture by weight. The grain yield per plot was recorded in gram, and converted into Kg/ha.
(iv) Karl Pearson’s correlation coefficient (r):
Where, r = coefficient of correlation, X= xi -, Y= yi -,, Sx = standard deviation of x series, Sy = standard deviation of y series, n= number of series.
During both the years, among the 46 total genotypes, none of the genotype was found to be completely resistant to the rust disease. Among all the germplasms, two germplasms Pant P 244 and Pant P 42 showed moderately resistant reaction, 13 germplasms were moderately susceptible, 29 germplasms were found susceptible and two germplasms HFP-4 and HUVP 1 were found highly susceptible (Fig. 1) (Table 2).
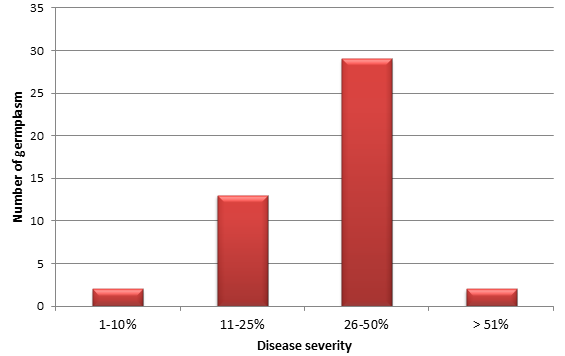 Fig. 1. Frequency distribution of rust severity in different germplasm of pea during 2013 -2014 and 2014-2015 (pooled)
 Two germplasm Pant P 244 and Pant P 42 showed moderately resistant reaction with low per cent disease severity of 8.17 and 8.50 respectively. They have also scored low AUDPC value (160.83-188.33) with slow infection rate (0.054-0.062). Pustule appeared on these genotypes were small (1.5-1.7mm) as compare to other susceptible genotypes. Moderately susceptible genotypes scored percent disease severity of 10.33-23.33. AUDPC value of these genotypes vary from 175.83-437.50 with infection rate of 0.051-0.095. Size of the pustules showed high variation of 1.3-4.4mm. Genotypes with susceptible reaction showed the severity range of 25.83-49.17with an AUDPC value of 292.50-797.50. Infection rate was ranged from 0.055-0.113 with pustule size of 2.9-4.8mm. Those genotypes which fall under highly susceptible reaction (HFP-4 and HUVP-1) scored highest percent disease severity of 55.83-65.00. The progresses of disease in these genotypes were very fast with AUDPC value of 1078.33-1223.33. Rate of infection ranged from 0.064-0.075. Pustule size was in a range of 4.2-4.6mm (Table 2).
Table (2):
Phenotypic screening of different germplasm for rust resistance in pea during crop season 2013-2014 and 2014-2015 under field condition.
| Germplasm | Disease severity (%) | ‘A’ value | ‘r’ value | Pustule size (mm) | Disease reaction | ||||||
|---|---|---|---|---|---|---|---|---|---|---|---|
| 2013 | 2014 | pooled | 2013 | 2014 | pooled | 2013 | 2014 | pooled | |||
| Pant P 244 | 7.33 (15.56) | 9.23 (17.40) | 8.17 (16.55) | 155.00 | 167.70 | 160.83 | 0.038 | 0.085 | 0.062 | 1.7 | MR |
| Pant P 42 | 7.67 (15.92) | 9.33 (17.76) | 8.50 (16.91) | 185.00 | 191.70 | 188.33 | 0.022 | 0.086 | 0.054 | 1.5 | MR |
| KPF 12-04 | 35.00 (36.23) | 38.33 (38.19) | 36.67 (37.22) | 723.35 | 593.20 | 660.00 | 0.066 | 0.103 | 0.085 | 4.4 | S |
| KPMR 522 | 40.00 (39.21) | 35.00 (42.12) | 42.50 (40.67) | 769.95 | 603.25 | 686.67 | 0.053 | 0.088 | 0.071 | 3.9 | S |
| HUVP 1 | 53.33 (49.92) | 58.33 (49.83) | 55.83 (48.39) | 1199.90 | 956.70 | 1078.33 | 0.050 | 0.079 | 0.064 | 4.2 | HS |
| HFP530 | 28.33 (32.14) | 31.67 (34.23) | 30.00 (33.21) | 581.60 | 460.00 | 520.83 | 0.043 | 0.074 | 0.058 | 3.7 | S |
| HFP 1016 | 25.00 (29.92) | 26.67 (31.07) | 25.83 (30.50) | 528.35 | 370.00 | 449.17 | 0.062 | 0.100 | 0.081 | 3.1 | S |
| HFP 9907 | 18.33 (25.30) | 25.00 (29.92) | 21.67 (27.73) | 440.05 | 391.70 | 415.83 | 0.036 | 0.070 | 0.053 | 3.4 | MS |
| HFP 8909 | 38.33 (38.24) | 38.33 (38.24) | 38.33 (38.24) | 598.30 | 475.00 | 536.67 | 0.078 | 0.096 | 0.087 | 4.2 | S |
| KPMR 925 | 45.00 (42.12) | 45.00 (42.12) | 45.00 (42.12) | 566.65 | 470.05 | 518.33 | 0.088 | 0.137 | 0.113 | 4.4 | S |
| Pant P 200 | 28.33 (32.09) | 31.67 (34.18) | 30.00 (33.16) | 401.65 | 349.95 | 375.83 | 0.074 | 0.096 | 0.085 | 3.2 | S |
| VL 202 | 41.67 (40.19) | 45.00 (42.12) | 43.33 (41.16) | 683.30 | 533.35 | 608.33 | 0.062 | 0.088 | 0.075 | 3.8 | S |
| Pant P223 | 25.00 (29.92) | 30.00 (33.00) | 27.50 (31.51) | 310.00 | 274.95 | 292.50 | 0.087 | 0.121 | 0.104 | 3.8 | S |
| VL 59 | 20.00 (26.45) | 23.33 (28.66) | 21.67 (27.59) | 383.30 | 288.20 | 335.83 | 0.063 | 0.113 | 0.088 | 3.5 | MS |
| Pant P 222 | 18.33 (25.19) | 20.00 (26.45) | 19.17 (25.83) | 319.95 | 260.05 | 290.00 | 0.077 | 0.090 | 0.084 | 3.5 | MS |
| Pant P 217 | 9.00 (17.40) | 11.67 (19.88) | 10.33 (18.74) | 179.90 | 171.70 | 175.83 | 0.057 | 0.074 | 0.066 | 1.7 | MS |
| Pant P 213 | 11.33 (19.65) | 13.00 (21.10) | 12.17 (20.41) | 261.60 | 201.75 | 231.67 | 0.042 | 0.060 | 0.051 | 1.3 | MS |
| Pant P 243 | 12.33 (20.49) | 14.00 (21.94) | 13.17 (21.25) | 238.30 | 190.05 | 214.17 | 0.059 | 0.080 | 0.069 | 2.0 | MS |
| VL 58 | 12.33 (20.49) | 14.00 (21.94) | 13.17 (21.25) | 281.65 | 225.05 | 253.33 | 0.048 | 0.097 | 0.073 | 2.5 | MS |
| RPG 79 | 28.33 (32.14) | 30.00 (33.21) | 29.17 (32.68) | 459.95 | 340.10 | 400.00 | 0.050 | 0.076 | 0.063 | 3.7 | S |
| NDP 12-102 | 31.67 (34.14) | 35.00 (36.15) | 33.33 (35.16) | 513.35 | 379.95 | 446.67 | 0.054 | 0.086 | 0.070 | 3.6 | S |
| KPMR 853 | 48.33 (44.04) | 46.67 (43.07) | 47.50 (43.56) | 698.35 | 571.75 | 635.00 | 0.096 | 0.111 | 0.103 | 4.8 | S |
| Pant P 195 | 18.33 (25.30) | 20.00 (26.56) | 19.17 (25.95) | 264.90 | 223.35 | 244.17 | 0.070 | 0.090 | 0.080 | 3.9 | MS |
| HUDP 1302 | 21.67 (27.59) | 23.33 (28.85) | 22.50 (28.24) | 483.30 | 391.70 | 437.50 | 0.045 | 0.072 | 0.059 | 4.4 | MS |
| RFP 2009-2-1 | 25.00 (29.92) | 26.67 (31.07) | 25.83 (30.50) | 543.25 | 463.35 | 503.33 | 0.043 | 0.072 | 0.057 | 3.7 | S |
| HUDP 1209 | 25.00 (29.92) | 26.67 (31.07) | 25.83 (30.50) | 645.00 | 511.70 | 578.33 | 0.041 | 0.068 | 0.055 | 3.2 | S |
| RFP 2009-2 | 18.33 (25.30) | 20.00 (26.56) | 19.17 (25.95) | 368.30 | 310.00 | 339.17 | 0.047 | 0.063 | 0.055 | 3.1 | MS |
| RFP 2009-3 | 38.33 (38.19) | 40.00 (39.21) | 39.17 (38.70) | 625.00 | 524.95 | 575.00 | 0.060 | 0.083 | 0.072 | 3.5 | S |
| HUDP 1301 | 48.33 (44.04) | 50.00 (44.99) | 49.17 (44.52) | 898.30 | 696.65 | 797.50 | 0.064 | 0.084 | 0.074 | 4.5 | S |
| KPMR 851 | 25.00 (29.92) | 26.67 (30.99) | 25.83 (30.46) | 583.30 | 440.00 | 511.67 | 0.046 | 0.065 | 0.055 | 4.3 | S |
| KPM 928 | 25.00 (29.92) | 26.67 (31.07) | 25.83 (30.50) | 388.35 | 310.00 | 349.17 | 0.080 | 0.100 | 0.090 | 3.8 | S |
| HUDP 15 | 20.00 (26.45) | 21.67 (27.59) | 20.83 (27.03) | 291.70 | 216.70 | 254.17 | 0.080 | 0.110 | 0.095 | 3.3 | MS |
| IPFD 13-14 | 25.00 (29.92) | 26.67 (31.07) | 25.83 (30.50) | 486.65 | 356.65 | 421.67 | 0.054 | 0.072 | 0.063 | 2.9 | S |
| IPFD 99-2 | 28.33 (32.09) | 30.00 (33.16) | 29.17 (32.63) | 433.30 | 336.65 | 385.00 | 0.044 | 0.069 | 0.056 | 3.4 | S |
| IPFD 12-8 | 35.00 (36.23) | 36.67 (37.25) | 35.83 (36.75) | 733.25 | 558.40 | 645.83 | 0.044 | 0.068 | 0.056 | 4.3 | S |
| IPF 10 | 25.00 (29.92) | 26.67 (31.07) | 25.83 (30.50) | 558.25 | 408.30 | 483.33 | 0.044 | 0.068 | 0.056 | 3.5 | S |
| IPFD 13-2 | 30.00 (33.16) | 31.67 (34.14) | 30.83 (33.65) | 548.35 | 413.40 | 480.83 | 0.056 | 0.083 | 0.069 | 3.8 | S |
| IPF 2-17 | 20.00 (26.45) | 21.67 (27.59) | 20.83 (27.03) | 306.70 | 246.65 | 276.67 | 0.063 | 0.083 | 0.073 | 3.7 | MS |
| IPFD 11-5 | 40.00 (39.21) | 41.67 (40.19) | 40.83 (39.70) | 534.95 | 468.30 | 501.67 | 0.083 | 0.099 | 0.091 | 4.5 | S |
| IPFD 5-19 | 21.67 (27.71) | 25.00 (29.92) | 23.33 (28.85) | 428.30 | 370.00 | 399.17 | 0.075 | 0.087 | 0.081 | 3.0 | MS |
| IPFD 99-13 | 45.00 (42.12) | 43.33 (41.15) | 44.17 (41.63) | 649.95 | 498.40 | 574.17 | 0.077 | 0.095 | 0.086 | 4.5 | S |
| IPFD 11-5 | 25.00 (29.92) | 26.67 (31.07) | 25.83 (30.50) | 411.70 | 323.40 | 367.50 | 0.070 | 0.082 | 0.076 | 3.0 | S |
| 45.00 (42.12) | 46.67 (43.07) | 45.83 (42.59) | 586.55 | 485.10 | 535.83 | 0.088 | 0.098 | 0.093 | 4.6 | S | |
| IPFD 13-3 | 26.67 (30.94) | 28.33 (32.09) | 27.50 (31.52) | 531.70 | 400.00 | 465.83 | 0.045 | 0.079 | 0.062 | 3.3 | S |
| IPFD 13-4 | 38.33 (38.24) | 40.00 (39.23) | 39.17 (38.74) | 753.30 | 563.35 | 658.33 | 0.055 | 0.080 | 0.068 | 3.6 | S |
| HFP-4 (check) | 68.33 (55.85) | 61.67 (51.75) | 65.00 (53.73) | 1474.90 | 971.70 | 1223.33 | 0.066 | 0.084 | 0.075 | 4.6 | HS |
| CD at 5% | 4.56** | 4.78** | 4.44** | ||||||||
| SEM± | 1.62 | 1.70 | 1.58 | ||||||||
| CV | 8.83 | 8.89 | 8.43 | ||||||||
Value in parenthesis are angular transformed, ‘A’- Area under disease progress curve (AUDPC), ‘r’ – Apparent rate of infection, MR-moderately resistant, MS-moderately susceptible, S- susceptible, HS-highly susceptible, ** Significant level at 0.01.
Correlation studies of AUDPC with pustule size during both the years showed significant positive correlation of AUDPC with pustule size (0.66**) (Table 3.).
Table (3):
Correlation coefficients of AUDPC with size of rust pustules formed in different germplasm of pea.
| Correlation coefficients (r) | |||
|---|---|---|---|
| AUDPC | |||
| 2013 | 2014 | 2013 and 2014 (pooled) | |
| Pustule size | 0.66** | 0.62** | 0.66** |
AUDPC – Area under disease progress curve, ** Correlation is significant at the 0.01 level (2-tailed).
Progress of disease severity in selected pea germplasms showing different disease reaction
Progress of disease severity during both the year in selected pea germplasms showing different disease reaction i.e. Pant P 244 and Pant P 42 (moderately resistant), KPF 12-04 and KPMR 522 (susceptible), VL 59 and HFP 9907 (moderately susceptible) and HFP 4 (Highly susceptible) illustrate that initiation of disease was observed 70 days after sowing (DAS) on all the germplasms. Highly susceptible germplasms scored maximum per cent disease severity of 9.33 at 70DAS followed by moderately susceptible (1.17-3.50) and susceptible germplasms (2.33-4.83). The lowest per cent disease severity was recorded in moderately resistant germplasms (1.00-1.83). Disease progressed slowly in all the germplasms during both the years till 90 DAS whereas in HFP 4 disease severity was increased at a high rate from the day of appearance. There were abrupt increase in per cent disease severity at 100DAS and 110DAS on germplasms showing moderately susceptible (10.83-15.83, 21.67), susceptible (20.00-24.17, 36.67-42.50) and highly susceptible reaction (44.17, 65.00) whereas moderately Fig.2
Resistant germplasms showed slow progress of disease (6.17-6.50, 8.17-8.50) throughout the period (Fig.2)
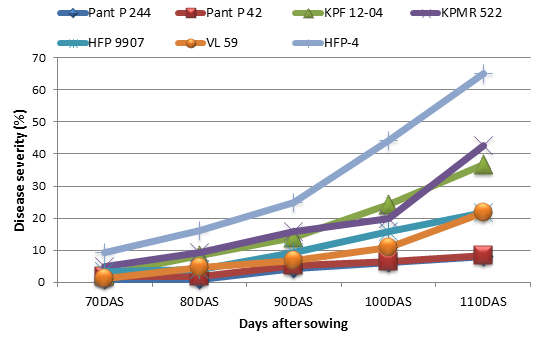 Fig. 2. Progress of rust severity in pea germplasm showing different disease reaction during 2013-2014 and 2014-2015 (pooled)
 In India Uromyces fabae (Pers. de Bary) causing pea rust disease usually appears during the 1st week of month of January to the second week of February when crop is in the flowering or pod formation stage. This period generally coincides with a warm and humid weather, which favours growth, reproduction and spread of the rust pathogen. Among 46 pea genotypes screened, none of them were found resistant to rust disease during both the seasons. Further, in our search, none of the genotype was found to be completely resistant to the rust disease, which was in agreement with earlier reports 15, 21, 7, 22, 5, 9, 23, 4, although these reports were based on the screening of limited genotypes. The screening of 46 lines indicated a high variability for rust intensity in terms of AUDPC. Only two genotypes showed moderate reaction with 1-10 per cent disease severity (Pant P 244 and Pant P 42). These genotypes showed slow progress of disease with low rate of infection. It was also observed that the size of pustules were small in moderate resistant genotypes. Size of pustules is considered as one of the important components of slow rusting trait and also play vital role in influencing AUDPC which were earlier reported in wheat24 and beans25,26. The pustule size is also related with the sporulation i.e. bigger pustules produce more spore than the small ones26. Maximum numbers (29) of genotypes fall under susceptible category followed by moderately susceptible (13) and highly susceptible category (2). The progress of disease was very fast in susceptible and highly susceptible genotypes and the rate of infection was also high in these genotypes. Large size pustules were observed in these genotypes which showed the rapid growth and multiplication of the pathogen leads to highest susceptibility.
Thus, two genotypes showing moderately resistant reaction can be a good option to integrate it with reduced number of fungicidal spray to obtain maximum yield with minimal rust severity.
- Indian Institute of Pulses Research (IIPR), 2014; E- Pulses data book.
- National Council of Applied Economic Research (NCAER), 2014; India’s Pulses scenario
- Duke, J.A. and Ayensu, E.S. Medicinal Plants of China. Reference Publications. Inc. ISBN 0-917256-20-4. Reference Publications Algonac MI (USA), 1985.
- Chand, R., Srivastava, C.P. and Kushwaha, C. Screening technique for pea (Pisum sativum L.) genotypes against rust disease (Uromyces fabae Pers. de Bary). Indian J. Agric. Sci., 2004; 74: 166-7.
- Gupta, R.P. Evaluation of pea germplasm for their reaction to powdery mildew and rust. Indian J. Pul. Res., 1990; 3: 186-8.
- Chand, R., Srivastava, C.P., Singh, R.M. and Singh, R.B. Pea specific strains in Uromyces fabae. Indian J. Pul. Res., 1997; 10: 127-8.
- Narsinghani, V.G., Singh. S.P. and Pal, B.S. Note on rust resistance pea varieties. Indian. J. Agric. Sci., 1980; 50: 453.
- Sokhi, H.S., Sokhi. S.S. and Rawal, R.D.Vertical reaction of pea to powdery mildew (Erysiphe polygoni) and rust (Uromyces vicia fabae). Mysore J. Agril. Sci., 1974; 8: 529-532.
- Kumar, T.B.A., Rangaswamy, K.T. and Ravi, K. Assessment of tall field pea genotypes for slow rusting resistance. Legume Res., 1994; 17: 79-82.
- Chauhan, R.S., Sugha, S.K. and Singh, B.M. A note on the prevalence and distribution of pea rust in Himachal Pradesh. Him. J. Agric. Res., 1991; 17: 105-107.
- Sharma, A.K. Epidemiology and management of rust disease of French bean. Veg. Sci., 1998; 25: 85-88.
- Stavely, J.R. Compendium of Bean Diseases. APS Press, St Paul MN., 1991; pp. 24-25.
- Marshi, R.P., Gupta, R.B.L. and Mathur, A.K. Response of Pea varieties to powdery mildew and rust in Rajastan. Indian Phytopath.., 1982; 35(2): 232-235.
- Bayaa, B. and Erskine, W. Diseases of lentils In: Allen DJ and Lenné JM (eds.) The Pathology of Food and Pasture Legumes. CAB International and ICRISAT Wallingford UK., 1998; pp. 423-471.
- Singh,V.K., Sangar, R.B.S. and Singh, R.N. Effect of varieties and sowing dates on disease incidence and productivity of field pea (Pisum sativum). Indian J. Agron., 1995; 4: 451-453.
- Mayee, C.D. and Datar, V.V. Phytopathometry. Technical Bulletin-1 (Special Bulletin 3), Marathwada Agric. Univ. Parbhani., 1986; p 218.
- Stavely, J.R., Freytag, G.F., Steadman, J.R. and Schwartz, H.F. The 1983 bean rust workshop. Annual Report of Common Bean Improvement Cooperative, 1983; 26: 4-6.
- Chand, R., Srivastava, C.P., Singh, B.D. and Sarode, S.B. Identification and characterization of slow rusting components in pea (Pisum sativum L.). Genet. Resour. Crop. Ev., 2006; 53: 219-224.
- Wilcoxson, R.D., Skovmand, B. and Atif, A.F. Evaluation of wheat cultivars for ability to retard development of stem rust. An. Appl. Biol., 1975; 80: 275-281.
- Van der Plank, J.E. Plant Diseases, Epidemics and Control. Academic Press, New York and London, 1968; pp. 349.
- Pal, A.B., Brahmappa, R., Rawal, D. and Ullasa, B. A. Field resistance of pea germplasm to powdery mildew (Erysiphe polygoni) and rust (Uromyces fabae). Plant Dis., 1980; 64: 1085-1086.
- Singh, R.M. and Srivastava, C.P. Evaluation, classification and usefulness of pea germplasm lines for quantitative characters. Legume Res., 1985; 8: 68-73.
- Xue, A.G. and Warkentin, T.D. Reaction of field pea varieties to three isolates of Uromyces fabae. Cana. J. Pl. Sci., 2002; 82: 253-255.
- Ohm, H.W. and Shaner, G.E. Three components of slow leaf-rusting at different stages in wheat. Phytopathology, 1976; 66: 1356–1360.
- Statler, G.D. and Mc Key, M.A. Partial resistance to Uromyces appendiculatus in dry edible beans. Phytopathology, 1987; 77: 1101–1103.
- Habtu, A. and Zadoks, J.C. Components of partial resistance in Phaseolus beans against an Ethiopian isolate of bean rust. Euphytica, 1995; 83: 95–102.
© The Author(s) 2017. Open Access. This article is distributed under the terms of the Creative Commons Attribution 4.0 International License which permits unrestricted use, sharing, distribution, and reproduction in any medium, provided you give appropriate credit to the original author(s) and the source, provide a link to the Creative Commons license, and indicate if changes were made.