

ISSN: 0973-7510
E-ISSN: 2581-690X
Mohammed Ali Alshehri1,2![]() , Al Thabiani Aziz1
, Al Thabiani Aziz1![]() , Othman Alzahrani1,2
, Othman Alzahrani1,2![]() , Abdulrahman Alasmari1
, Abdulrahman Alasmari1![]() , Shafik Ibrahim3, Gamal Osman3,4 and Omar Bahattab1
, Shafik Ibrahim3, Gamal Osman3,4 and Omar Bahattab1![]()
Among the different biological sources, seaweeds have lot of biotechnological applications. Saudi Arabia is bounded by three bodies of water. With a coastal border of almost 1,800 km. This area high species richness caused by its complex geological history has encompassed genetic and morphological diversity studies for decades. The DNA-barcoding using rbcL gene has proved its usefulness in studying seaweeds phylogenetic diversity, multiple cryptic introductions, environmental modulation the geographical distribution and species identification in different seaweed species. Eight algae samples were collected from different locations in Saudi Arabia. The rbcL gene was used through PCR protocol for species identification. A total number of 8 sequences were obtained with a total sequence length of 5263 bp. where it ranged from 610 to 753 with an average length of 658 bp. The species identification revealed that the specimens samples 1,2,3,4,5,6,7 and 8 belongs to Padina pavonica, Turbinaria gracilis, Carpomitra costata, Pterocladiella capillacea, Cladostephus spongiosus, Ulva lactuca, Sporochnus comosus and Sargassum muticum respectively. The rbcL-based DNA bar-coding was almost successful to identify different seaweeds specimens according to species and genus. Some specimens rbcL was not adequate to identify genus level and failed to differentiate between highly similar species. We suggest to use more DNA barcoding techniques in addition to rbcL to ad more resolution to the species identification.
Seaweeds, Saudi Arabia, rbcL, species identification, geographical distribution.
Among the different biological sources, seaweeds have lot of biotechnological applications. Seaweeds reduces inorganic nutrient wastes environmental effects through absorption undesirable compounds from mariculture (Al-Hafedh et al. 2012) Potential medical and biological applications for seaweeds have been reported such as anti-Inflammatory, antibacterial, antifungal, antiviral and antitumor effects (Men’shova et al. 2012; Zheng et al. 2016). Additionally, biological invasions of non-native seaweeds species proved to have a high environmental and economic impacts and considered one of the main threats to global biodiversity (Nunes et al. 2014). Saudi Arabia is bounded by three bodies of water. With a coastal border of almost 1,800 km. This area high species richness caused by its complex geological history has encompassed genetic and morphological diversity studies for decades (Basson, 1979). The complex current circulation is an influencing factor in shaping and homogenization the population structure of seaweeds (Buchanan and Zuccarello, 2012). Shipping is the most important pathway for integrating non-indigenous marine species and more than a thousand marine foreign species have been reported in different European countries (Katsanevakis et al. 2013). Moreover, the activities of aquaculture could cause a variety of environmental effects involving habitat modification and coastal eutrophication (Read and Fernandes, 2003). Seaweeds are widely distributed worldwide, inhabiting areas with divergent environmantal conditions, from tropical to polar regions (Harley et al. 2012; Guiry and Guiry, 2016) This wide distribution can caused structured populations through environmental differences and the existence of cryptic species and restricted gene flow (Calegario et al. 2019). We are far from unravel the true biogeography and genetic diversity of seaweeds in this region. Conducting algae population structure is an important component for the development of a basic knowledge of seaweeds ecology research. These studies could inform population subdivision, population variation and geneflow.
Identification of seaweeds based on morphology is a classical method, so DNA-based molecular techniques have increasingly been used for taxonomical identification. These studies interested mainly on the use of DNA sequences to elucidate taxonomic and systematic issues (Kim et al. 2014). Among these techniques DNA-barcoding where a short piece of DNA is used to distinguish between species. Progress within DNA-barcoding systematics has led to the development of different approaches in algal phylogenetics and increased the use of newly developed molecular markers. Ribulose- l,5-bisphosphate carboxylase / oxygenase (RuBisCO) is responsible for facilitating fixation of primary CO2 in the Calvin cycle. This enzyme quaternary structure composes of 8 small and 8 large subunits. In chlorophytes the small subunit (rbcS) is encoded in the nuclear genome and the large subunit (rbcL) is plastid-encoded (Palmer, 1985).The plastid RuBisCO large subunit (rbcL) marker has been widely used for studying unknown species taxonomic position to clarify phylogenetic relationships between different species (Tan et al. 2015). The stable exon structure of rbcL gene and high amino acid sequence similarity, supported it as a reliable marker for these studies (Kazi et al. 2013). Additionally, The Consortium for the Barcode of Life (CBOL) has recommended the rbcL and matK genes as DNA barcodes for plant species (Group et al. 2009). The rbcL gene has proved its usefulness in studying seaweeds phylogenetic diversity, multiple cryptic introductions, environmental modulation and the geographical distribution in Japanese red alga (Polysiphonia harveyi) (McIvor et al. 2001). Red seaweed (Plocamium brasiliense) (Calegario et al. 2019) Gracilaria vermiculophylla (Gracilariaceae, Rhodophyta) (Yang et al. 2008) and Ulva and Enteromorpha (Ulvaceae, Chlorophyta) (Wang et al. 2010) Compared to other DNA-barcoding based techniques, rbcL unraveled some errors in species identifications appears in seaweeds genetic databases (Kim et al. 2014). The rbcL data at a variety of taxonomic levels has a high resolution improving its utility for the study of interspecific relationships (Yang et al. 2008). Therefore, the aims of this study were to assess the genetic diversity and discover the phylogeographic structure for seaweeds specimens using molecular genetically identification using rbcL genes as barcodes. The retrieved rbcL sequences for these specimens have been used as a key markers for studying the relationship between species of seaweeds algae depending on genetic divergence and geographic distribution. Additionally, the effectiveness of rbcL-based DNA barcoding has been evaluated for species identification and differentiation after blasting new sequences against GenBank databases.
Collection of samples
Eight algae samples were collected from Gulf of Aqaba specifically from the beaches of Haql (From 29°20’25.4″N 34°56’53.5″E To 29°14’47.6″N 34°56’02.5″E ) areas the marine seaweeds were on May 2018.
DNA extraction, polymerase chain reaction amplification and sequencing
For most samples of seaweeds, DNA was extracted from 5 g of fresh algal using DNAeasy Plant Mini Kit (Qiagen, Santa Clarita, CA) according to the manufacturer’s instructions. The DNA concentration was estimated by injecting 2 µl of the parents DNA samples on 1% agarose gel in comparison to 10µl of a DNA size marker (lambda DNA Hind III digest Phi X 174/HaeIII digest) and the degree of fluorescence of the DNA sample with the different bands in DNA size marker was compared. DNA barcoding analysis was performed with the plastidial rbcL region. For PCR amplification and sequencing of rbcL, the reaction mixture consisted of 1x buffer (Promega), 15 mM MgCl2, 0.2 mM dNTPs, 20pcoml of each primers, 1u of Taq DNA polymerase (GoTaq, Promega), 40 ng DNA and ultra-pure water to a final volume of 50 uL. For rbcL PCR the forward and reverse primers were, respectively, rbcL-F (5’-ATGTCACCACAAACAGAGACTAAAGC-3’ ) and rbcL-R (5’-TCGCATGTACCTGCAGTAGC-3’). The PCR predicted product size was estimated to be 600bp.
PCR amplification was performed in a Perkin-Elmer/GeneAmp® PCR System 9700 (PE Applied Biosystems) programmed to fulfill 40 cycles after an initial denaturation cycle for 5 min at 94°C. Each cycle consisted of a denaturation step at 94°C for 30 sec., an annealing step at 50°C for 30 sec. and an elongation step at 72°C for 30 sec. The primer extension segment was extended to 7 min at 72÷C in the final cycle. The amplification products were resolved by electrophoresis in a 1.5% agarose gel containing ethidium bromide (0.5ug/ml) in 1X TBE buffer at 95 volts. A 100bp DNA ladder was used as a molecular size standard. PCR products were visualized on UV light and photographed using a Gel Documentation System (BIO-RAD 2000). Amplified products for all PCR were purified using GeneJET PCR Purification Kit (Catalog number: K0701) according to the manufacturer’s instructions. The purified PCR products were incubated at room temperature for 2 minutes and when store purified DNA at -20 °C. The rbcL PCR products DNA sequencing was carried out by Macrogen Inc., Korea using Sanger DNA sequencing technology.
Computational analysis
The rbcL PCR product sequences were used for species identification was carried out using NCBI-BLAST (Altschul et al. 1997) to search GenBank databases. Species identifications were accepted if they showed more than 98% similarity to the reference sequences available in databases. The most similar 100 rbcL sequences revealed by NCBI-Blast were used for further phylogenetic analysis. Sequence Alignments were made using CLUSTALW (Thompson et al. 1994). The phylogenetic trees were constructed using iTOL online tool (Letunic and Bork, 2006). The visualizing and clustering of multivariate phylogenetic similarity data was conducted using ClustVis web tool (Metsalu and Vilo, 2015). Additional seaweeds sequences information obtained from GenBank were used in geographical distribution analyses, where geographical distributions were demonstarted through R package using “rworldmap” package (South, 2011). The R package “ape”. Paradis et al. 2004) has been used for phylogenetic trees statistical analysis. The global algal database of taxonomic were used as a reference for algae distribution (Guiry and Guiry, 2016).
PCR amplification
The rbcL PCR primers were successful to amplify and produce PCR product with expected band size (» 600 bp) (Fig. 1).
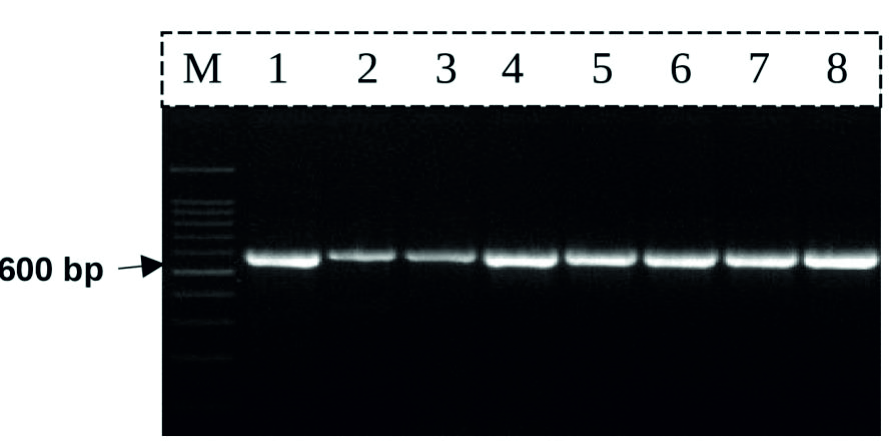
Fig. 1. The gel electrophoresis result for the PCR product of rbcL primers.
Species identification
A total number of 8 sequences were obtained with a total sequence length of 5263 bp, where it ranged from 610 to 753 with an average length of 658 bp (Supplementary 1). The NCBI-BLAST tool was successful to identify 7 rbcL specimens sequences according to it species and genus (Table 1 & 2). All sequences species were successfully identified and most sequences have an identity percentage higher than 90%. On the other hand, the query coverage which stands for the length of similar nucleotide between the query (our PCR product sequences) and the subject (rbcL genes in the NCBI database) ranged from 73% (sample-2) to 96% (sample-7), indicating a similarity issue with sample-2, could be regarding to the low number of sequences for this species in the database or the low efficiency of rbcL gene to identify this species. The species identification revealed that the specimens samples 1,2,3,4,5,6,7 and 8 belongs to Padina pavonica, Turbinaria gracilis, Carpomitra costata, Pterocladiella capillacea, Cladostephus spongiosus, Ulva lactuca, Sporochnus comosus and Sargassum muticum, respectively.
Table (1):
The NCBI blast results details for the 8 seaweeds rbcL sequences.
Sample No. |
Genus |
Species |
Max Score |
Total Score |
Query Cover |
E value |
Per. Ident |
Similar Sequences |
|---|---|---|---|---|---|---|---|---|
Sample-1 |
Padina |
pavonica |
89.7 |
424 |
82.00% |
7.00E-90 |
97.62% |
ACD87049.1 |
Sample-2 |
Turbinaria |
gracilis |
96.3 |
431 |
73.00% |
4.00E-76 |
93.88% |
AIB10353.1 |
Sample-3 |
Carpomitra |
costata |
338 |
428 |
90.00% |
3.00E-112 |
100.00% |
ABU51023.1 |
Sample-4 |
Pterocladiella |
capillacea |
391 |
391 |
95.00% |
2.00E-133 |
97.55% |
QBM02984.1 |
Sample-5 |
Cladostephus |
spongiosus |
383 |
383 |
94.00% |
4.00E-130 |
93.97% |
CBJ55508.1 |
Sample-6 |
Ulva |
lactuca |
399 |
399 |
95.00% |
2.00E-139 |
98.46% |
ADT81597.1 |
Sample-7 |
Sporochnus |
comosus |
309 |
309 |
96.00% |
1.00E-140 |
95.31% |
ABU51045.1 |
Sample-8 |
Sargassum |
muticum |
418 |
418 |
91.00% |
6.00E-144 |
99.50% |
AFP55262.1 |
Table (2):
The details for the 8 seaweeds samples after DNA sequencing.
| Code | Samples Names | GPS |
|---|---|---|
| 1 | Padina pavonica | (collected from Gulf of Aqaba specifically from the beaches of Haql) From 29°20’25.4″N 34°56’53.5″E To 29°14’47.6″N 34°56’02.5″E |
| 2 | Turbinaria gracilis | |
| 3 | Carpomitra costata | |
| 4 | Pterocladiella capillacea | |
| 5 | Cladostephus spongiosus | |
| 6 | Ulva lactuca | |
| 7 | Sporochnus comosus | |
| 8 | Sargassum muticum |
Seaweeds species geographical distribution
In order to strengthen the results, the NCBI Genbank submitted sequences information has been used to clarify and compare the geographical location for identified species between the AlgaeBase database Guiry and Guiry, 2016) in the species and genus levels (Fig. 2). Although the AlgaeBase database located the some seaweeds habitat locations in specific locations in the world, some rbcL sequences submitted from specimens collected refer to the extension of these species areas (Fig. 2) for example Carpomitra sp., Padina sp. and Sargassum. Additionally, the obtained maps fill the information gaps for the geographical distribution of Turbinaria sp. which is missing in the database.
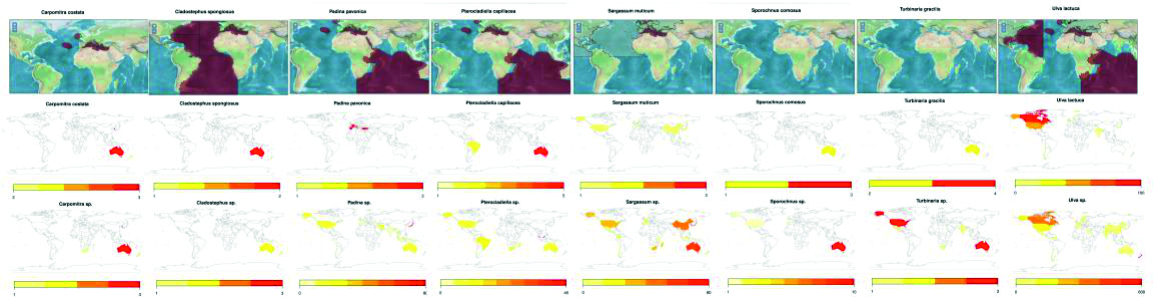
Fig. 2. The geographical distribution for studied seaweed species as retived from AlgaeBase (above) and Genbank sequence information (bellow).
Multiple sequence alignment
The sequences of the rbcL gene along with high similar GenBank genes were used to generate the dataset of nucleotide positions in seqeunce alignment. The intron was removed from the rbcL gene sequences before analysis and the sequences were translated into amino acids forms. In total, 8 clusters were recovered in multiple sequence alignment analysis (Supplementary 1). A heat map were constructed depicting the similarity matrix between rbcL sequences between every specimen and similar sequences in the GenBank database. According to (Fig. 3A) the most genetically similar species to sample 3 are accessions ABU51019,ABU51017, ABU51021, ABU51015 and ABU51019, which belongs to Carpomitra costata species with a similarity score of 98.51%. On the other hand, the sequence belongs to Sargassum echinocarpum (ABW81412) has the lowest similarity score (84.13%). Generally, genus Sargassum sp. has the lowest similarity scores with our Carpomitra costata rbcL sequence. notably, the ABW81412 has the lowest similarity score with all sequences set (continuous red boxes in Fig 3A). Sample 5 has a 92.46% similarity with CBJ55508, which belongs to Cladostephus spongiosus and a low similarity (86.93%) with BAK64367, which belongs to Cutleria multifida (Fig. 3B). The general reddish color for similarity matrix inform that, although these species are genetically similar, they formed three subpopulation according to genus. The sequences BAK64367 (Cutleria multifida), CBJ55511 (Halopteris obovata ) and AAF98089 (Sargassum thunbergii) has a high dissimilarity compared to other rbcL sequences (the red continuous boxes in Fig. 3B). The sample 1 has a similarity score higher than 91% with sequences belongs to species such as Padina pavonica, Padina antillarum, Padina tetrastromatica (Fig. 3C). On the other hand it has a low similarity with sequences belongs to species such as Padina melemele, Dictyopteris muelleri, Homoeostrichus sinclairii. The hsiget dissimilarity between sequence set (10.7%), which suggested that rbcL gene has a high differentiation level. On the other hand rbcL failed to differentiate between species such as Padina antillarum and Padina tetrastromatica or between Padina boergesenii and Padina jonesii. Sample 4 has a high similarity with rbcL sequence with accession number AAR14730 belongs to Pterocladiella capillacea 97.5%, while it has a high dissimilarity with sequence QAU11119 which belongs to Acanthophora dendroides (91.6%). The genus Gelidium sp. has the high dissimilarity score with other species, where Gelidium pusillum is the highest (Fig. 3D). Sequences belongs to species Sargassum muticum, Sargassum glaucescens, Sargassum fusiforme, Sargassum emarginatum, Sargassum zhangii and Sargassum confusum have the highest similarity to sample 8 (99.5%), suggesting that rbcL was successful to identify sample genus, although it could not differentiate between different species with the same level. On the other hand, the species Haplospora globosa has the highest dissimilarity with other species (Fig. 3E). The sequence of sample 7 has a high similarity with sequences ABU51046 and ABU51072 belongs to species Sporochnus comosus and Sporochnus radiciformis (97.03%). The similarity matrix is divided into 3 distinctive subpopulations (blue areas) (Fig. 3F), suggesting the low power of rbcL to differentiate between species inside the population but it has a high power to differentiate between species belongs to different populations. The rbcL gene failed to identify adequately the species of sample 2. The highest score of similarity (91.3%) was with sequences ASJ80801, ABE02294 and AAP78675 belongs to species Turbinaria ornata, Turbinaria decurrens and Myriodesma integrefolium, respectively. The sequence CAC67466 belongs to Desmarestia viridis has the highest dissimilarity with other sequences (Fig. 3G). The DNA-barcoding was successful to identify the species of sample 6 with 98.4% of similarity with rbcL sequence ABP82141 belongs to Ulva lactuc. The highest dissimilarity was 95.90% with Ulva lobata (Fig. 3H). According to similarity matrix, rbcL gene has a low differentiating power between most of species belongs to geuns Ulva.
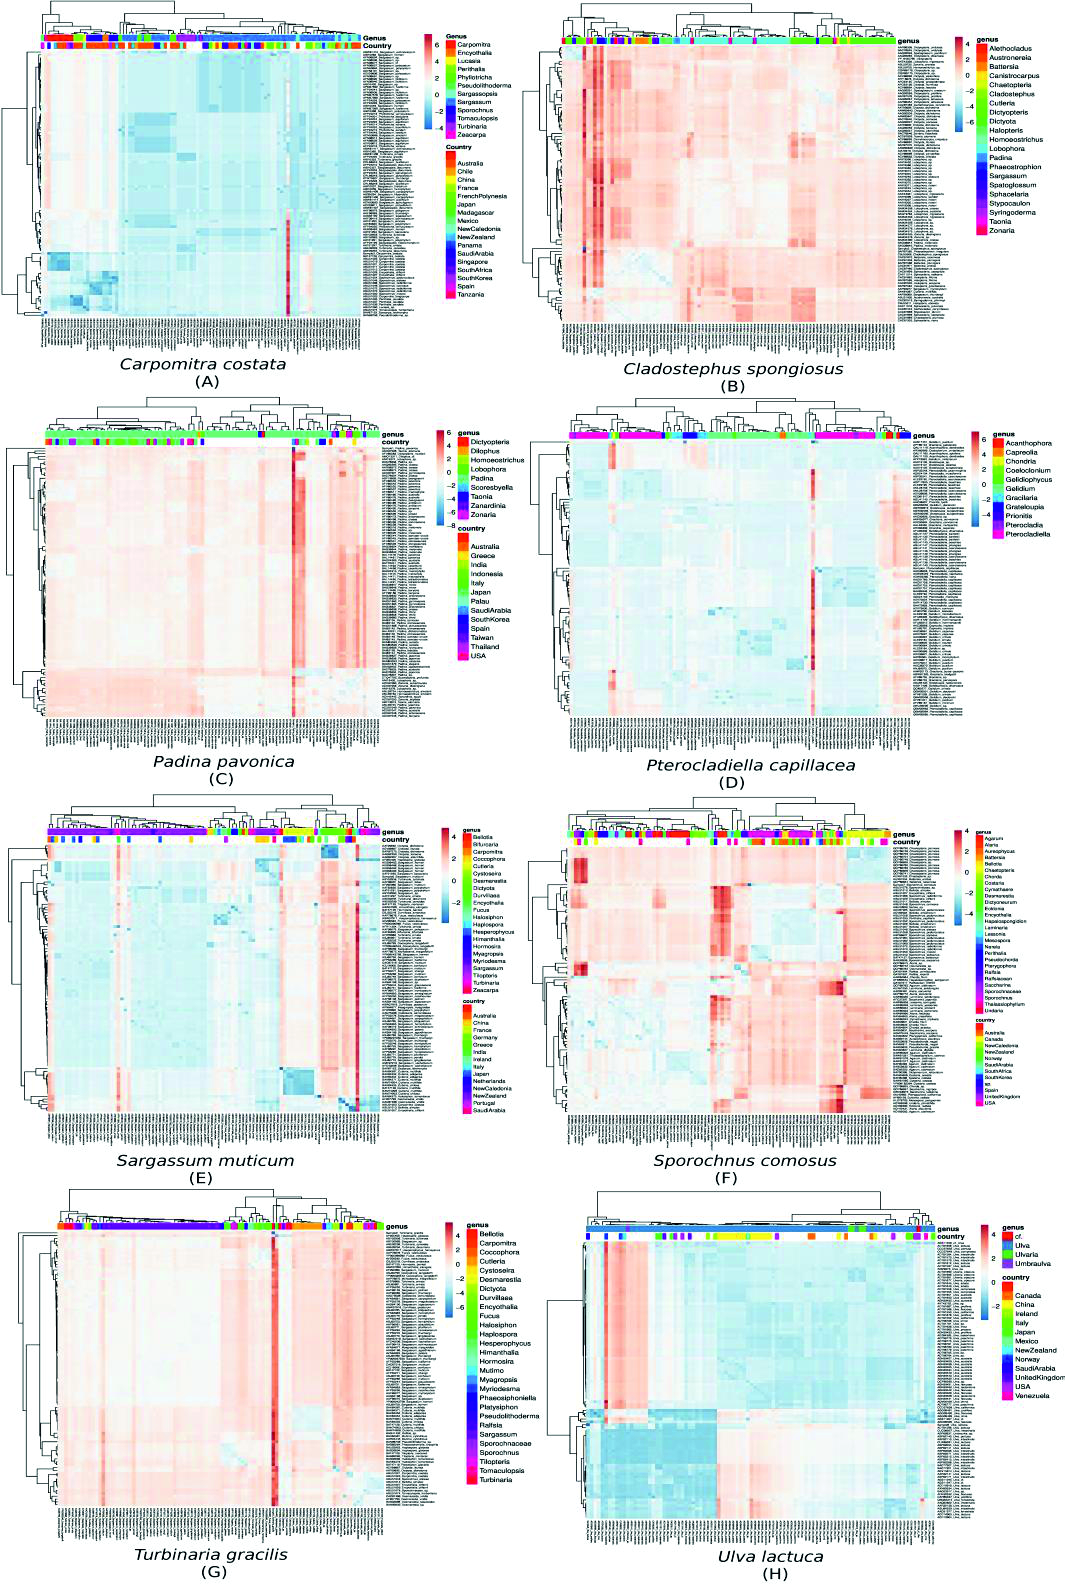
Fig. 3. The multiple sequence alignment matrices showing the relation between different seaweads specimens according to country and genus. The similarity scale ranged from highly similar sequences (blue) to highly divergence sequences (red).
Phylogenetic analysis
The sequences of the rbcL gene along with high similar GenBank genes were used to generate the dataset of nucleotide for phylogenetic analysis (Fig. 4). The phylogenetic tree constructed for sample 3 (Carpomitra costata) divided specimens from into six groups. The mean branch length was 0.0018 with a variance of 2.59e-05,where the length ranged from -0.027 to 0.038. The sample 3 with formed a monophyletic clade together with other species belongs to Carpomitra genus. While the genus Sargassum sp. formed a distinctive clades (Fig. 4A). In sample 5 (Cladostephus spongiosus) the phylogenetic tree mean length is 0.0042 with a variance of 3.9e-05. Where the tree length ranged from -0.01 to 0.05. the phylogenetic tree consists of 5 clades, where sample 5 formed one clade with another C. spongiosus. The Lobophora and Dictyota genus formed separate clades, which suggested that, rbcL gene can successfully differentiate between these genus (Fig. 4B). Additionally, the phylogenetic tree obtained by sample 1 and other GenBank sequences was diveded into six clades with a mean length and a variance of 0.002 and 1.36e-05, respectively. The phylogenetic tree branch length ranged from -0.0094 to 0.029. The specimen 3 (Padina pavonica) formed a clade with other Padina rbcL sequences (Fig. 4C). The mean branch length and variance for sample 4 tree was 0.004 and 5.5e-05, respectively. The branch length ranged form -0.01 to 0.06. The sample 4 (Pterocladiella capillacea) ranged a separated clade with other Pterocladiella sequences (Fig. 4D). Sample 8 phylogenetic tree consists of 7 clades (Fig. 4E). The mean of branch length was 0.003 with a variance of 4.5e-05. The branch length ranged from -0.024 to 0.05. The rbcL sequence of sample 8 (Sargassum muticum) contained in one clade with other Sargassum genus sequences. The mean of branch length for phylogenetic trees of sample 7 (Sporochnus comosus), 2 (Turbinaria gracilis) and 6 (Ulva lactuca) was 0.003, 0.003, 0.001 with a variance of 4.5e-05, 6.3e-05 and 1.76e-05, respectively. The branch length in sample 7, 2 and 6 trees ranged form -0.014 to 0.029, from -0.024 to 0.063 and from -0.017 to 0.019. The sample 7 and 2 formed with sequences belongs to the same genus a clade, while sample 6 formed with rbcL sequence belongs to the same species (Fig. 4F-H). Clearly clustered all rbcL sequences of U. lactuca in one clade and C. taxifolia in another, indicating that even though sequences varied within the species (evident from branching patterns of phylogram), variations are minimum enough to cluster the same species in one clade indicating the DNA barcode ability of the rbcL gene (Mahendran and Saravanan, 2017).
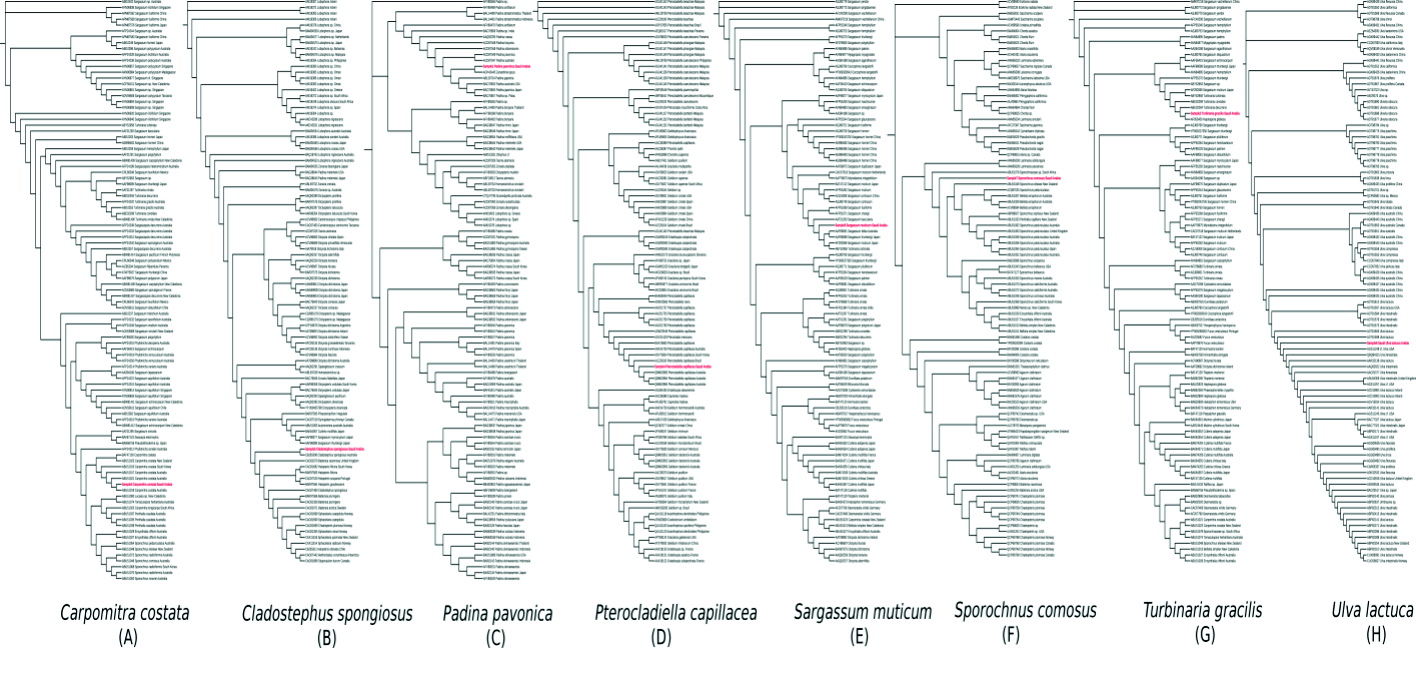
Fig. 4. The phylogenetic trees depicting the relationship between different seaweeds specimens and GenBank sequences.

Fig. 5. phylogenetic tree of sample no 7
The characteristic and biological application for the identified seaweeds samples
The extract of Carpomitra costatahas has a potential anti-Inflammatory antibacterial, antifungal, and photoprotective effects and is a part of the traditional diet in Asia(Pesando and Caram, 1984; Yim et al. 2018). Cladostephus spongiosus (Hudson) is a brown alga, with one to many repeatedly branched, subdichotomous axes arising from a crust-like hold fast (El Hattab et al. 2008). On the other hand, It was reoiretd that P. pavonica is a potential source of alginic acids, which have a high capacity for fucoidans, and gelation, which shows anticancer effect against human melanoma cells. Moreover, Brown algae of the genus Padina (Dictyotaceae) are widely distributed in the seas of Lebanon, Russia, Thailand, India, and other countries (Karmakar et al. 2010). They were studied for their compounds with biological activity, such as, anticoagulant, antioxidant, antiviral and antithrombic properties (Albuquerque et al. 2004; Adhikari, et al. 2006). Some algal lectins have been detected and isolated from Pterocladiella capillacea (Oliveira et al. 2002) and its extracts have anti-inflammatory and antinociceptive activities (Silva et al. 2010). Moreover, Sargassum muticum is native to the northwest Pacific region and has become the dominant species at the low-tide level in North America west coast (Fletcher and Fletcher, 1975; Milledge et al. 2016). Additionally, Sargassum muticum, has been appeared in Europe in the early 1970s and is now found on shorelines from Norway to Portugal (Engelen and R. Santos, 2009). The growth rate of S. muticum is generally considerably higher than most UK seaweed species and has been described as very invasive in terms of its rate of spread (Davison, 2009; Milledge and Harvey, 2016). notably, The Sporochnus comosus has been reported to have cytotoxic compounds. The Turbinaria is characterized as having monopodially developed axes, radially branched, bearing leaves, more or less turbinate structures and and flat or concave outer face(Feitsch, 1945; Wynne, 2002). This species are utilized by herbivorous fishes in tropical areas, it has a low level of tannins and phenolics (Steinberg, 1986). with approximate time of regeneration from 24 to 36 months (Ellis and Ellis, 2002). As an example, in the genus Ulva the rbcL has been studied massivelly to clarify taxonomic issues (Group et al. 2009). Enteromorpha and Ulva, two major genera in the Ulvaceae, are known for their global distributions, many species and morphological variation (Hoek et al. 1995)
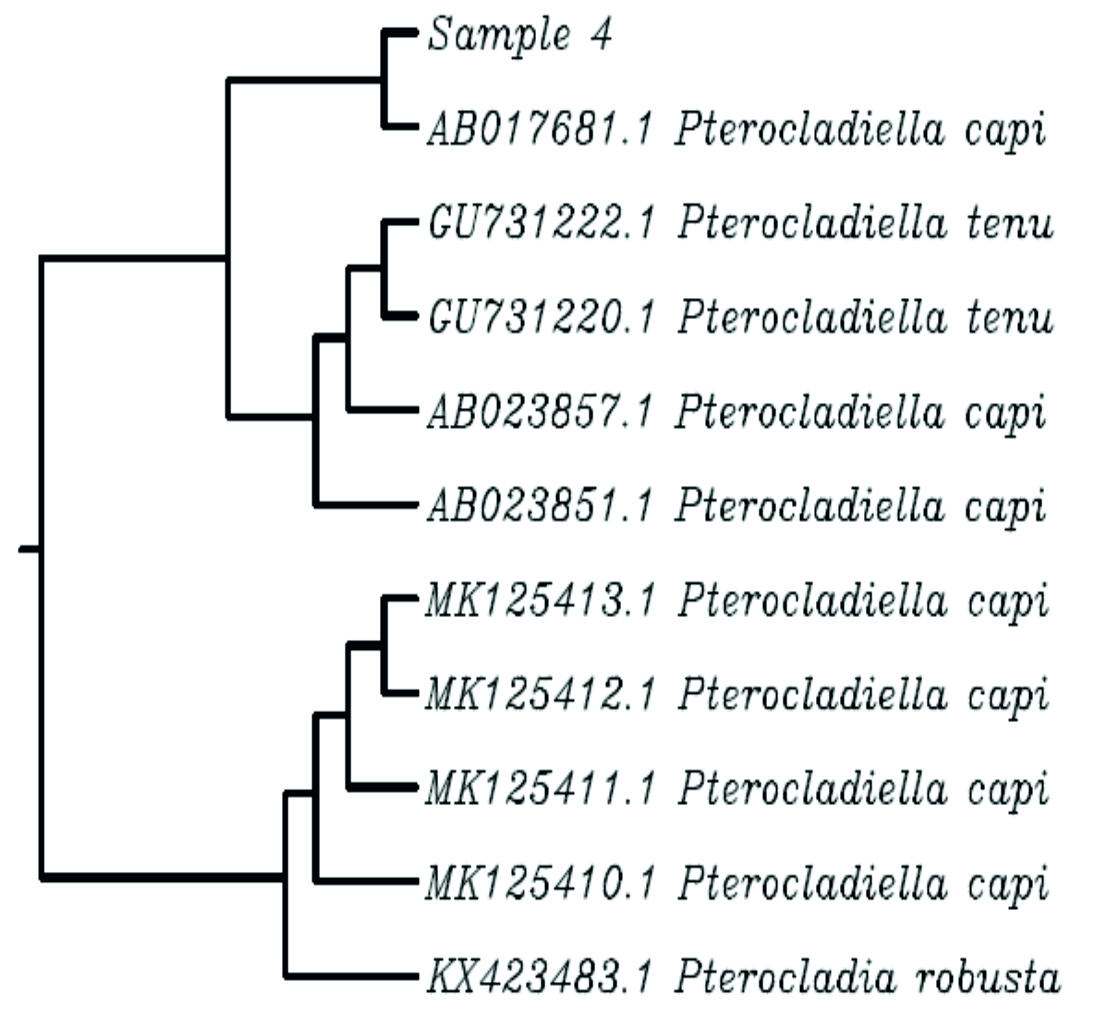
Fig. 6. phylogenetic tree of sample no 4
Molecular analysis was by far the most effective method of species level identification in this work and rbcL sequences supported much more precise identifications as previously reported (Gargiulo et al. 2013; Montes et al. 2017) Unfortunately not all the samples showed reproductive structures. Complex and related genera of seeweads have been established, proposed, discussed and rearranged using the rbcL gene (Zhang et al. 2012; Yang and. Kim, 2015). Saudi Arabia coasts are undiscovered areas for seaweeds ecology, this study was successful to report some known species in this area. The rbcL-based DNA bar-coding was almost successful to identify different seaweeds specimens according to species and genus. Some specimen rbcL was not adequate to identify genus level and failed to differentiate between highly similar species. We suggest to use more DNA barcoding techniques in addition to rbcL to ad more resolution to the species identification. We hope that this study would be a small push Arabian researchers unravel and studied the unknown ecological areas in their countries.
ACKNOWLEDGEMENT
None.
CONFLICT OF INTEREST
The authors declares that there is no conflict of interest.
FUNDING
None.
AUTHORS’ CONTRIBUTION
All authors listed have made a substantial, direct and intellectual contribution to the work, and approved it for publication.
DATA AVAILABILITY
All datasets obtained or studied during this study are incorporated in the manuscript.
ETHICS STATEMENT
This article does not contain any studies with human participants or animals performed by any of the authors.
- Adhikari U, Mateu C.G., Chattopadhyay K, Pujol C. A, Damonte E.B., Ray B. Structure and antiviral activity of sulfated fucans from Stoechospermum marginatum. Phytochemistry, 2006; 67(22): 2474–2482.
Crossref - Albuquerque I.R.L., Queiroz K.C.S., Alves L.G., dos Santos E.A., Leite E.L., Rocha H.A.O. Heterofucans from Dictyota menstrualis have anticoagulant activity. Brazilian J. Med. Biol. Res., 2004; 37: (2): 167–171.
Crossref - Al-Hafedh Y.S., Alam A., Buschmann A.H., Fitzsimmons K.M. Experiments on an integrated aquaculture system (seaweeds and marine fish) on the Red Sea coast of Saudi Arabia: efficiency comparison of two local seaweed species for nutrient biofiltration and production. Rev. Aquac., 2012; 4(1): 21–31.
Crossref - Altschul S.F. et al., Gapped BLAST and PSI-BLAST: a new generation of protein database search programs. Nucleic Acids Res., 1997; 25(17): 3389–3402.
Crossref - Basson P.W. Marine algae of the Arabian Gulf coast of Saudi Arabia (second half). Bot. Mar., 1979; 22(2): 65–82.
Crossref - Buchanan J., Zuccarello G.C. Decoupling of short-and long-distance dispersal pathways in the endemic new zealand seaweed Carpophyllum maschalocarpum (phaeophyceae, fucales). J. Phycol., 2012; 48(3): 518–529.
Crossref - Calegario G.et al. Environmental modulation of the proteomic profiles from closely phylogenetically related populations of the red seaweed Plocamium Brasiliense. Peer J., 2019; 7: e6469.
Crossref - Davison D.M. Sargassum Muticum on Scotland 2008: A Review of Information, Issues and Implications. Scottish Natural Heritage, 2009.
- El Hattab M., Culioli G., Valls R., Richou M., Piovetti L. Apo-fucoxanthinoids and loliolide from the brown alga Cladostephus spongiosus f. verticillatus (Heterokonta, Sphacelariales). Biochem. Syst. Ecol., 2008; 5(36): 447–451.
Crossref - Ellis S., Ellis E. Recent Advances in Lagoon-based Farming Practices for Eight Species of Commercially Valuable Hard and Soft Corals: A Technical Report. Citeseer, 2002.
- Engelen A., Santos R. Which demographic traits determine population growth in the invasive brown seaweed Sargassum muticum. J. Ecol., 2009; 97(4): 675–684.
Crossref - Feitsch F.E. The structure and reproduction of the algae, vol. II. Cambridge, 1945.
- Fletcher R.L., Fletcher S.M. Studies on the recently introduced brown alga Sargassum muticum (Yendo) Fensholt I. Ecology and reproduction. Bot. Mar., 1975; 18(3): 149–156.
Crossref - Gargiulo GM, Morabito M, Manghisi A. A re-assessment of reproductive anatomy and postfertilization development in the systematics of Grateloupia (Halymeniales, Rhodophyta). Cryptogam. Algol., 2013; 34(1): 3–36.
Crossref - Group C.P.W. et al. A DNA barcode for land plants. Proc. Natl. Acad. Sci., 2009; 106(31): 12794–12797.
- Guiry M., Guiry G. AlgaeBase, Available at http://www.algaebase.org, 2016.
- Harley C.D.G. et al. Effects of climate change on global seaweed communities. J. Phycol., 2012; 48(5): 1064–1078.
Crossref - Hoek C., den Hoeck H., Mann D., Jahns H.M. Algae: an introduction to phycology. Cambridge university press, 1995.
- Karmakar P, Pujol C.A., Damonte E.B., Ghosh T., Ray B. Polysaccharides from Padina tetrastromatica: Structural features, chemical modification and antiviral activity. Carbohydr. Polym., 2010; 80(2): 513–520.
Crossref - Katsanevakis S., Gatto F., Zenetos A., Cardoso A.C., et al. How many marine aliens in Europe. Manag. Biol. Invasions., 2013; 4(1): 37–42.
Crossref - Kazi M.A., Reddy C.R.K., Jha B. Molecular phylogeny and barcoding of caulerpa (bryopsidales) based on the tufA, rbcL, 18S rDNA and ITS rDNA genes. PLoS One, 2013; 8(12): e82438.
Crossref - Kim S.Y. et al. Genetic diversity and haplotype distribution of Pachymeniopsis gargiuli sp. nov. and P. lanceolata (Halymeniales, Rhodophyta) in Korea, with notes on their non-native distributions. J. Phycol., 2014; 50(5): 885–896.
Crossref - Letunic I., Bork P. Interactive Tree Of Life (iTOL): an online tool for phylogenetic tree display and annotation. Bioinformatics, 2006; 23(1): 127–128.
Crossref - Mahendran S., Saravanan S. Molecular taxonomy of green seaweeds Ulva lactuca and Caulerpa taxifolia through phylogenetic analysis, 2017.
- McIvor L., Maggs C.A., Provan J., Stanhope M.J. rbcL sequences reveal multiple cryptic introductions of the Japanese red alga Polysiphonia harveyi. Mol. Ecol., 2001; 10(4): 911–919.
Crossref - Men’shova R.V., Ermakova S.P., Rachidi S.M., Al-Hajje A.H., Zvyagintseva T.N., Kanaan H.M. Seasonal variations of the composition, structural features, and antitumor properties of polysaccharides from Padina pavonica (Lebanon) as a function of composition. Chem. Nat. Compd., 2012; 47(6): 870–875.
Crossref - Metsalu T., Vilo J., ClustVis: A web tool for visualizing clustering of multivariate data using Principal Component Analysis and heatmap. Nucleic Acids Res., 2015; 43(1): W566—W570.
Crossref - Milledge J.J., Harvey P.J. Ensilage and anaerobic digestion of Sargassum muticum. J. Appl. Phycol., 2016; 28(5): 3021–3030.
Crossref - Milledge J.J., Nielsen B.V., Bailey D. High-value products from macroalgae: the potential uses of the invasive brown seaweed, Sargassum muticum. Rev. Environ. Sci. Bio/Technology, 2016; 15(1): 67–88.
Crossref - Montes M., Rico J.M., Garcia-Vazquez E., Pichs Y.J.B. Molecular barcoding confirms the presence of exotic Asian seaweeds (Pachymeniopsis gargiuli and Grateloupia turuturu) in the Cantabrian Sea, Bay of Biscay. Peer J., 2017; (5): e3116.
Crossref - Nunes A.L., Katsanevakis S., Zenetos A., Cardoso A.C., et al. Gateways to alien invasions in the European seas. Aquat. Invasions., 2014; 9(2): 133–144.
Crossref - Oliveira S.R.M., A.E. Nascimento, M.E.P. Lima, Y.F. M.M. Lite and N. Benevides Purification and characterisation of a lectin from the red marine alga Pterocladiella capillacea (SG Gmel.) Santel. & Hommers. Brazilian J. Bot., 2002; 25(4): 397–403.
Crossref - Ovenden S.P.B. et al. Comosusols A-D and Comosone A: Cytotoxic Compounds from the Brown Alga Sporochnus comosus. J. Nat. Prod., 2011; 74(4): 739–743.
Crossref - Palmer J.D. Comparative organization of chloroplast genomes. Annu. Rev. Genet., 1985; 19(1) 325–354.
Crossref - Paradis E., Claude J., Strimmer K. A.P.E. Analyses of phylogenetics and evolution in R language Bioinformatics, 2004; 20(2): 289–290.
Crossref - Pesando D., Caram B. Screening of marine algae from the French Mediterranean coast for antibacterial and antifungal activity. Bot. Mar., 1984; 27(8): 381–386.
Crossref - Read P. and T. Fernandes, “Management of environmental impacts of marine aquaculture in Europe,” Aquaculture, 2003; 226(1–4): 139–163.
Crossref - Silva L., M.C.M. et al. Antinociceptive and anti-inflammatory activities of lectin from marine red alga Pterocladiella capillacea. Biol. Pharm. Bull., 2010; 33(5): 830–835.
Crossref - South A worldmap: A new R package for mapping global data. R.J., 2011; 3(1).
Crossref - Steinberg P.D. Chemical defenses and the susceptibility of tropical marine brown algae to herbivores. Oecologia, 1986; 69(4): 628–630.
Crossref - Tan P.-L., Lim P.-E., Lin S.-M., Phang S.-M., Draisma S.G.A., Liao L.M. Foliose Halymenia species (Halymeniaceae, Rhodophyta) from Southeast Asia, including a new species, Halymenia malaysiana sp. nov. Bot. Mar., 2015; 58(3): 203–217.
Crossref - Thompson J.D., Higgins D.G., Gibson T.J clustal W. Improving the sensitivity of progressive multiple sequence alignment through sequence weighting, position-specific gap penalties and weight matrix choice. Nucleic Acids Res., 1994; 22(22): 4673–4680.
Crossref - Wang J.et al. Ulva and Enteromorpha (Ulvaceae, Chlorophyta) from two sides of the Yellow Sea: analysis of nuclear rDNA ITS and plastid rbcL sequence data. Chinese J. Oceanol. Limnol., 2010; 28(4): 762–768.
Crossref - Wynne M.J.Turbinaria foliosasp. nov.(Fucales, Phaeophyceae) from the Sultanate of Oman, with a census of currently recognized species in the genus Turbinaria. Phycol. Res., 2002; 50(4): 283–293.
- Yang E.C., Kim M.S., Geraldino P.J.L., Sahoo D., Shin J.-A., Boo S.M. Mitochondrial cox1 and plastid rbcL genes of Gracilaria vermiculophylla (Gracilariaceae, Rhodophyta). J. Appl. Phycol., 2008; 20(2):161–168.
Crossref - Yang M.Y., Kim M.S. Taxonomy of Grateloupia (Halymeniales, Rhodophyta) by DNA barcode marker analysis and a description of Pachymeniopsis volvita sp. Nov. J. Appl. Phycol., 2015; 27(3): 1373–1384.
Crossref - Yim MJ et al. Anti-Inflammatory Potential of Carpomitra costata Ethanolic Extracts via Inhibition of NF-κB and AP-1 Activation in LPS-Stimulated RAW264. 7 Macrophages. Evidence-Based Complement Altern. Med., 2018.
Crossref - Zhang W., Wang H.W., Zhao D., Sheng Y.W., Luan R. X. Morphological observation and rbcL gene sequence analysis of Grateloupia orientalis (Rhodophyta), a new record of the Hainan province. Mar. Sci., 2012; 36(7): 109–116.
- Zheng J.et al. Photoprotective effect of carpomitra costata extract against ultraviolet B-induced oxidative damage in human keratinocytes. J. Environ. Pathol. Toxicol. Oncol., 2016; 35(1).
Crossref
© The Author(s) 2019. Open Access. This article is distributed under the terms of the Creative Commons Attribution 4.0 International License which permits unrestricted use, sharing, distribution, and reproduction in any medium, provided you give appropriate credit to the original author(s) and the source, provide a link to the Creative Commons license, and indicate if changes were made.