


ISSN: 0973-7510
E-ISSN: 2581-690X
Oil palm Elaeis guineensis Jacq is the highest oil-yielding perennial plant. In this paper, Genotypic and phenotypic correlation coefficients and path analysis study was discussed conducted on 58 Indian Oil palm genotypes for twenty four characters. Fresh fruit bunch yield (FFBY) was found to be significantly and positively correlated with bunch dry weight, bunch index, average bunch weight, number of bunches, total dry matter, number of leaflets and oil to bunch ratio. Path coefficient analysis also showed that bunch dry weight, bunch index, average bunch weight, number of bunches and total dry matter had maximum positive effect on FFBY. Hence these are the most potent characters influencing FFBY per palm in the selection programme.
Oil palm, Fresh fruit bunch yield, path analysis, correlation.
The Oil palm Elaeis guineensis (Jacq) is a native of Guinea Bissau of West Africa and belongs to the family Arecaceae and order Arecales. In India, Oil palm has been introduced as an irrigated crop. Use of palm oil is known for the last 500 years in India. Oil palm cultivation has now been extended to about 50,000 hectares in almost eleven states. Oil palm is the highest vegetable oil yielding crop which is the second most important vegetable oil crop next to soya. It is grown on a commercial scale throughout Malaysia, Indonesia and southern parts of India. The mesocarp is the source of palm oil and the seed yields palm kernel oil (Wood et al., 1984; Donough and Law, 1988; Chan et al., 1989).
It produces 4-6 tonnes of crude palm oil/ha. As India is one of the highest consumers of palm oil, the yield did not meet the consumption, so India is still importing palm oil from other countries. An effective breeding programme for high yielding varieties can be developed by genetic variation in available resources, analysis of character association with FFBY and path analysis. As yield is complex, it is associated with number of component characters. These characters were interrelated. These interrelated characters may affect the yield which make correlation coefficient ineffective (Chitra et al., 2005). The path coefficient analysis provides direct and indirect causes of association of yield and their component characters. This will be helpful for developing the varieties or hybrids with high yielding and other improved characters (Krualee et al., 2013; Tanya et al., 2013; Sumalini and Manjulatha, 2012; Pulli Bai et al., 2005; Anuradha et al., 2005; Vinothini et al., 2005; Karunakar Raju et al., 2005 and Chitra et al., 2005).
In the present study, different characters of oil palm genotypes associated with Fresh fruit bunch yield (FFBY) was correlated with bunch dry weight, bunch index, average bunch weight, number of bunches, total dry matter, number of leaflets and oil to bunch ratio. Path coefficient analysis was carried out analyzing bunch dry weight, bunch index, average bunch weight, number of bunches and total dry matter.
Sample collection and parameters analyzed
In the present study fifty eight oil palm genotypes from different Indian villages of Andhra Pradesh and Telangana states were selected (Table.1). At every location the experiment was laid out in randomized block design (RBD) with 3 replications i.e., 3 palms (from each genotype). 24 morphological traits were recorded in 3 replications in all the genotypes. Morphological biometric observations like 1.height (HT), 2.girth at base (GT), 3.height increment (HT incre), 4.sex ratio (SR), 5.number of leaves (NL), 6.petiole width (PW), 7.petiole depth (PD), 8.number of leaflets (NLL), 9.rachis length (RL), 10.leaflet length (LLL), 11.leaflet width (LLW), 12.leaf area (LA), 13.leaf dry weight (LDW), 14.total leaf dry weight (TLDW), 15.specific leaf weight (SLW), 16.trunk dry matter (TrDM), 17.vegetative dry matter (VDM), 18.total dry matter (TDM) and yield parameters like 19.bunch number (BN), 20.fresh fruit bunch yield (FFBY), 21.average bunch weight (ABW), 22.bunch dry weight (BDW), 23.bunch index (BI) and 24.oil/bunch ratio were recorded during year 2011-2016 as per Corley et al. (1971) and Kushairi et al. (1999). With the measuring tape height-HT of the palm was measured from the ground above 50 cm to 17th leaf base and girth-GT at base was measured at that 50 cm level from ground. Height increment was measured by comparing height for 5 years Total number of leaves-NL and number of spindles-NS produced per year was counted thrice per year by marking 17th leaf and 1st leaf with paint. Sex ratio-SR was obtained from the below formulae. Inflorescences in the leaf base was counted thrice in a year by marking 17th leaf and 1st leaf with paint. Number of leaflets-NLL, Rachis length-RL, Petiole width-PW, Petiole depth-PD, Leaflet length-LLL and Leaflet width-LLW were measured on 17th leaf. Bunch number-BN, fresh fruit bunch yield-FFBY and average bunch weight-ABW was recorded while harvesting the bunches. Leaf area-LA, Leaf dry weight-LDW, Specific leaf weight-SLW, Total leaf dry weight-TLDW, Trunk dry matter-TrDM, Vegetative dry matter-VDM, Bunch dry matter-BDM, Total dry matter-TDM and Bunch index-BI was measured using the indirect non destructive method and they are measured by below formulas (Corley et al., 1971 and Kushairi et al., 1999).
Table (1):
List of genotypes and their sources.
S.No |
Village |
Genotype |
S.No |
Village |
Genotype |
|---|---|---|---|---|---|
1 |
A Polavaram |
APV |
30 |
Ankannagudem |
ANG |
2 |
Annadevarapeta |
ADP |
31 |
Bandivarigudem |
BVG |
3 |
Bayyannagudem |
BNG |
32 |
Busarajupalli |
BRP |
4 |
Bhimolu |
BMU |
33 |
Chityala |
CHT |
5 |
Gavaravaram |
GVM |
34 |
Doramamidi |
DRM |
6 |
Jelugumilli |
JLG |
35 |
Eduvadalla Palu |
EVP |
7 |
Komatikunta |
KMK |
36 |
Guravaigudem |
GVG |
8 |
Kommugudem |
KMG |
37 |
Jaggavaram |
JGV |
9 |
Kuntala Gudem |
KTG |
38 |
Kanakadripuram |
KKP |
10 |
Lakkavaram |
LKV |
39 |
Kollivarigudem |
KVG |
11 |
Lingaraopalem |
LGP |
40 |
Krishnapuram |
KSP |
12 |
Mulagalampalli |
MLG |
41 |
P Rajavaram |
PRM |
13 |
P Narayanapuram |
PNP |
42 |
Rachanna gudem |
RNG |
14 |
R Ganapavaram |
RGP |
43 |
Rudrarajukotagudem |
RRK |
15 |
Rajavaram |
RJV |
44 |
Bandamcharla |
BMC |
16 |
Gudlapalli |
GDP |
45 |
Borrampalem |
BMP |
17 |
Kethavaram |
KTV |
46 |
Cherukumili |
CRK |
18 |
Laxmanagudem |
LXG |
47 |
Darbhagudem |
DRB |
19 |
Mysannna Gudem |
MNG |
48 |
Devulapalli |
DVP |
20 |
Peddipalli |
PDP |
49 |
Gangolu |
GNG |
21 |
Pullepudi |
PLP |
50 |
Gopalapuram |
GPP |
22 |
Rajupothepalli |
RPP |
51 |
Vegavaram |
VGV |
23 |
Ramacherllagudem |
RCG |
52 |
Kamayya Palem |
KMP |
24 |
Taduvai |
TDV |
53 |
Makkinavarigudem |
MKV |
25 |
Teklavarigudem |
TVG |
54 |
P Ankampalem |
PAP |
26 |
Aswaraopeta |
ARP |
55 |
Pangidigudem |
PGG |
27 |
Janagareddygudem |
JRG |
56 |
Parimpudi |
PRP |
28 |
Pedavegi |
PED |
57 |
Ponguturu |
PGT |
29 |
Akkampeta |
AKP |
58 |
Pragadapalli |
PGD |
Sex ratio-SR = number of female inflorescence/number of male+female+hermophrodite inflorescences.
Leaf area-LA = 0.455(NLL x LLL x LLW)-0.245
Leaf dry weight-LDW = 0.058(PW x PD)+0.00541 x RL-0.902
Total leaf dry weight-TLDW = LDW(NL + NS-1)
SLW = LDW/LA
Trunk dry matter-TDM = Diameter x volume x density of palm
Vegetative dry matter-VDM = TLDW + TrDM
Bunch dry weight-BDW = 0.53 x fresh fruit bunch weight-FFB
Total dry matter-TDM = VDM + BDW
Bunch index-BI = BDW/TDM
Oil to bunch ratio was obtained using bunch analysis (Soxhlet method). Three bunches from each genotype was collected. Weights of bunch, fruits, spikelets and stalk was recorded. Fresh weight and dry weight of mesocarp, kernel, nuts was recorded for obtaining moisture percentage and the dry samples of mesocarp were kept in soxhlet apparatus where the petroleum ether was evaporated on heating and after cooling it was converted into vapours where it will flush the oil from the dry mesocarp samples and the weights of samples was recorded before and after the extraction in soxhlet. The oil to bunch ratio was calculated by oil/fresh mesocarp to mesocarp/fruit to fruit/bunch.
Data Analysis
The Morphological data from 3 replications of 58 genotypes was recorded on 24 characters was submitted to statistical package WINDOSTAT 9.2 (INDOSTAT services Ltd. Hyderabad, India) to carry out the Genotypic and Phenotypic correlation coefficients and path analysis. Genotypic and Phenotypic correlation was carried out by using the formulae suggested by Falconer (1964) and path analysis as described by Dewey and Lu (1959) was carried out to calculate direct and indirect contribution of various traits to fresh fruit bunch yield-FFBY.
The analyzed data showed positive genotypic correlation with reference to the number of leaflets-NLL (0.1278), petiole width-PW (0.1091), petiole depth-PD (0.0867), rachis length-RL (0.2012), leaflet length-LLL (0.0253), leaflet width-LLW (0.0596), leaf area-LA (0.0845), leaf dry weight-LDW (0.1467), total leaf dry weight-TLDW (0.2766), specific leaf weight-SLW (0.0548) and vegetative dry matter-VDM (0.1107) (Table.2; Fig.1). Number of leaves-NL had significant and positive correlation with bunch number-BN (Oboh and Fakorede, 1990). Number of leaves-NL was negatively associated in the present study with height-HT and average bunch weight-ABW but there was a positive association in the previous study (Rafii et al., 2013). It was also reported that rachis length-RL was negatively correlated with number of leaves-NL and has no correlation with FFBY and oil to bunch ratio (Rafii et al., 2013), but in the present study rachis length-RL was positively correlated with number of leaves-NL and negatively correlation with FFBY and oil to bunch ratio.
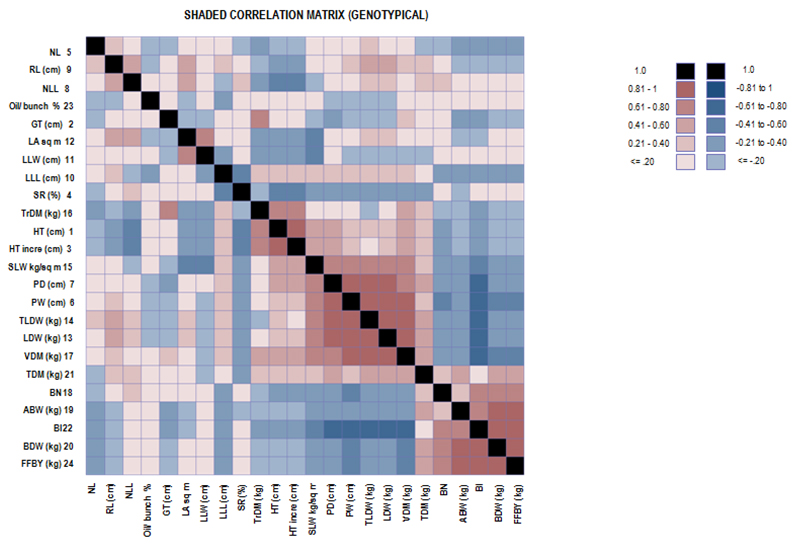 Fig. 1. Genotypical Shaded Correlation Matrix
Table (2):
Genotypical Correlation Matrix for 24 characters.
Character |
HT (cm) |
GT (cm) |
HT incre (cm) |
SR (%) |
NL |
PW (cm) |
PD (cm) |
NLL |
RL (cm) |
LLL (cm) |
LLW (cm) |
LA sq m |
LDW (kg) |
TLDW (kg) |
SLW kg/sq m |
TrDM (kg) |
VDM (kg) |
BN |
ABW (kg) |
BDW (kg) |
TDM (kg) |
BI |
Oil/ bunch % |
|---|---|---|---|---|---|---|---|---|---|---|---|---|---|---|---|---|---|---|---|---|---|---|---|
HT (cm) |
1.0000 |
0.1101 |
0.9835 |
-0.4191 |
-0.1815 |
0.3528 |
0.4275 |
-0.4314 |
-0.3446 |
0.2677 |
-0.2563 |
-0.3026 |
0.2308 |
0.2015 |
0.4621 |
0.6697 |
0.5506 |
-0.3169 |
-0.0034 |
-0.1675 |
0.3619 |
-0.3672 |
0.0431 |
GT (cm) |
0.1101 |
1.0000 |
0.1573 |
0.1525 |
-0.1114 |
-0.1643 |
-0.2098 |
0.0564 |
0.0830 |
0.1088 |
-0.1992 |
-0.0861 |
-0.1268 |
-0.1439 |
-0.0256 |
0.7991 |
0.3356 |
0.0363 |
-0.2268 |
-0.1529 |
0.1746 |
-0.2854 |
0.1207 |
HT incre (cm) |
0.9835 |
0.1573 |
1.0000 |
-0.4169 |
-0.1995 |
0.3206 |
0.4065 |
-0.4141 |
-0.3284 |
0.2590 |
-0.2010 |
-0.2474 |
0.2128 |
0.1800 |
0.4078 |
0.7094 |
0.5553 |
-0.2624 |
-0.0034 |
-0.1396 |
0.3918 |
-0.3527 |
0.0403 |
SR (%) |
-0.4191 |
0.1525 |
-0.4169 |
1.0000 |
-0.1033 |
-0.3269 |
-0.2953 |
0.3258 |
0.0177 |
-0.4666 |
0.1127 |
0.0184 |
-0.2738 |
-0.2719 |
-0.2947 |
-0.1310 |
-0.3021 |
0.1407 |
-0.0459 |
0.0545 |
-0.2329 |
0.1546 |
0.0180 |
NL |
-0.1815 |
-0.1114 |
-0.1995 |
-0.1033 |
1.0000 |
0.1091 |
0.0867 |
0.1278 |
0.2012 |
0.0253 |
0.0596 |
0.0845 |
0.1467 |
0.2766 |
0.0548 |
-0.2105 |
0.1107 |
-0.1822 |
-0.2325 |
-0.2919 |
-0.1620 |
-0.2501 |
-0.0876 |
PW (cm) |
0.3528 |
-0.1643 |
0.3206 |
-0.3269 |
0.1091 |
1.0000 |
0.9663 |
0.1195 |
0.2472 |
0.3104 |
-0.1285 |
0.0723 |
0.9590 |
0.9418 |
0.7958 |
0.0576 |
0.8193 |
-0.4427 |
-0.2546 |
-0.4037 |
0.3984 |
-0.6616 |
-0.0145 |
PD (cm) |
0.4275 |
-0.2098 |
0.4065 |
-0.2953 |
0.0867 |
0.9663 |
1.0000 |
0.0755 |
0.1176 |
0.2505 |
0.0200 |
0.1805 |
0.9100 |
0.8963 |
0.6693 |
0.0721 |
0.7895 |
-0.3861 |
-0.2316 |
-0.3612 |
0.4092 |
-0.6144 |
-0.0645 |
NLL |
-0.4314 |
0.0564 |
-0.4141 |
0.3258 |
0.1278 |
0.1195 |
0.0755 |
1.0000 |
0.5757 |
-0.0379 |
0.0492 |
0.4748 |
0.2926 |
0.3129 |
-0.1159 |
-0.2229 |
0.1337 |
0.2230 |
0.1137 |
0.1899 |
0.2980 |
0.0716 |
0.1627 |
RL (cm) |
-0.3446 |
0.0830 |
-0.3284 |
0.0177 |
0.2012 |
0.2472 |
0.1176 |
0.5757 |
1.0000 |
0.2300 |
0.1286 |
0.4885 |
0.4995 |
0.5160 |
0.0997 |
-0.1679 |
0.3349 |
0.0974 |
-0.1016 |
-0.0247 |
0.2907 |
-0.1943 |
-0.0088 |
LLL (cm) |
0.2677 |
0.1088 |
0.2590 |
-0.4666 |
0.0253 |
0.3104 |
0.2505 |
-0.0379 |
0.2300 |
1.0000 |
-0.3632 |
0.1260 |
0.3393 |
0.3219 |
0.2241 |
0.2260 |
0.3979 |
-0.2500 |
-0.2234 |
-0.2735 |
0.1231 |
-0.3870 |
-0.2597 |
LLW (cm) |
-0.2563 |
-0.1992 |
-0.2010 |
0.1127 |
0.0596 |
-0.1285 |
0.0200 |
0.0492 |
0.1286 |
-0.3632 |
1.0000 |
0.7755 |
-0.0046 |
-0.0035 |
-0.5974 |
-0.2504 |
-0.1457 |
0.1434 |
0.0098 |
0.0654 |
-0.0766 |
0.1198 |
0.0047 |
LA sq m |
-0.3026 |
-0.0861 |
-0.2474 |
0.0184 |
0.0845 |
0.0723 |
0.1805 |
0.4748 |
0.4885 |
0.1260 |
0.7755 |
1.0000 |
0.2884 |
0.2855 |
-0.5062 |
-0.2106 |
0.1182 |
0.1299 |
-0.0380 |
0.0306 |
0.1386 |
-0.0345 |
-0.0505 |
LDW (kg) |
0.2308 |
-0.1268 |
0.2128 |
-0.2738 |
0.1467 |
0.9590 |
0.9100 |
0.2926 |
0.4995 |
0.3393 |
-0.0046 |
0.2884 |
1.0000 |
0.9912 |
0.6763 |
0.0090 |
0.8327 |
-0.3394 |
-0.2483 |
-0.3481 |
0.4616 |
-0.6350 |
-0.0348 |
TLDW (kg) |
0.2015 |
-0.1439 |
0.1800 |
-0.2719 |
0.2766 |
0.9418 |
0.8963 |
0.3129 |
0.5160 |
0.3219 |
-0.0035 |
0.2855 |
0.9912 |
1.0000 |
0.6684 |
-0.0237 |
0.8214 |
-0.3460 |
-0.2631 |
-0.3672 |
0.4337 |
-0.6420 |
-0.0350 |
SLW kg/sq m |
0.4621 |
-0.0256 |
0.4078 |
-0.2947 |
0.0548 |
0.7958 |
0.6693 |
-0.1159 |
0.0997 |
0.2241 |
-0.5974 |
-0.5062 |
0.6763 |
0.6684 |
1.0000 |
0.1991 |
0.6717 |
-0.3846 |
-0.2057 |
-0.3353 |
0.3226 |
-0.5524 |
0.0034 |
TrDM (kg) |
0.6697 |
0.7991 |
0.7094 |
-0.1310 |
-0.2105 |
0.0576 |
0.0721 |
-0.2229 |
-0.1679 |
0.2260 |
-0.2504 |
-0.2106 |
0.0090 |
-0.0237 |
0.1991 |
1.0000 |
0.5508 |
-0.1455 |
-0.1454 |
-0.1855 |
0.3459 |
-0.3974 |
0.1342 |
VDM (kg) |
0.5506 |
0.3356 |
0.5553 |
-0.3021 |
0.1107 |
0.8193 |
0.7895 |
0.1337 |
0.3349 |
0.3979 |
-0.1457 |
0.1182 |
0.8327 |
0.8214 |
0.6717 |
0.5508 |
1.0000 |
-0.3722 |
-0.3026 |
-0.4125 |
0.5593 |
-0.7628 |
0.0474 |
BN |
-0.3169 |
0.0363 |
-0.2624 |
0.1407 |
-0.1822 |
-0.4427 |
-0.3861 |
0.2230 |
0.0974 |
-0.2500 |
0.1434 |
0.1299 |
-0.3394 |
-0.3460 |
-0.3846 |
-0.1455 |
-0.3722 |
1.0000 |
0.3221 |
0.7254 |
0.3124 |
0.6712 |
0.1425 |
ABW (kg) |
-0.0034 |
-0.2268 |
-0.0034 |
-0.0459 |
-0.2325 |
-0.2546 |
-0.2316 |
0.1137 |
-0.1016 |
-0.2234 |
0.0098 |
-0.0380 |
-0.2483 |
-0.2631 |
-0.2057 |
-0.1454 |
-0.3026 |
0.3221 |
1.0000 |
0.8825 |
0.5200 |
0.7801 |
0.0403 |
BDW (kg) |
-0.1675 |
-0.1529 |
-0.1396 |
0.0545 |
-0.2919 |
-0.4037 |
-0.3612 |
0.1899 |
-0.0247 |
-0.2735 |
0.0654 |
0.0306 |
-0.3481 |
-0.3672 |
-0.3353 |
-0.1855 |
-0.4125 |
0.7254 |
0.8825 |
1.0000 |
0.5244 |
0.9010 |
0.1017 |
TDM (kg) |
0.3619 |
0.1746 |
0.3918 |
-0.2329 |
-0.1620 |
0.3984 |
0.4092 |
0.2980 |
0.2907 |
0.1231 |
-0.0766 |
0.1386 |
0.4616 |
0.4337 |
0.3226 |
0.3459 |
0.5593 |
0.3124 |
0.5200 |
0.5244 |
1.0000 |
0.1069 |
0.1368 |
BI |
-0.3672 |
-0.2854 |
-0.3527 |
0.1546 |
-0.2501 |
-0.6616 |
-0.6144 |
0.0716 |
-0.1943 |
-0.3870 |
0.1198 |
-0.0345 |
-0.6350 |
-0.6420 |
-0.5524 |
-0.3974 |
-0.7628 |
0.6712 |
0.7801 |
0.9010 |
0.1069 |
1.0000 |
0.0517 |
Oil/ bunch % |
0.0431 |
0.1207 |
0.0403 |
0.0180 |
-0.0876 |
-0.0145 |
-0.0645 |
0.1627 |
-0.0088 |
-0.2597 |
0.0047 |
-0.0505 |
-0.0348 |
-0.0350 |
0.0034 |
0.1342 |
0.0474 |
0.1425 |
0.0403 |
0.1017 |
0.1368 |
0.0517 |
1.0000 |
FFBY (kg) |
-0.1676 |
-0.1528 |
-0.1396 |
0.0544 |
-0.2920 |
-0.4035 |
-0.3611 |
0.1900 |
-0.0246 |
-0.2735 |
0.0654 |
0.0308 |
-0.3479 |
-0.3670 |
-0.3352 |
-0.1854 |
-0.4123 |
0.7254 |
0.8824 |
1.0000 |
0.5246 |
0.9009 |
0.1017 |
Similarly, positive phenotypic correlation (Table. 3; Fig. 2) was noticed for number of leaves-NL with number of leaflets-NLL (0.0031), rachis length-RL (0.1037), leaflet width-LLW (0.0143), total leaf dry weight-TLDW (0.1143) and vegetative dry matter-VDM (0.0297). Due to masking effect of environment on the genetic association with characters, mostly the genotypic correlation coefficients are higher than phenotypic correlations (Johnson et al., 1955; Chitra et al., 2005).
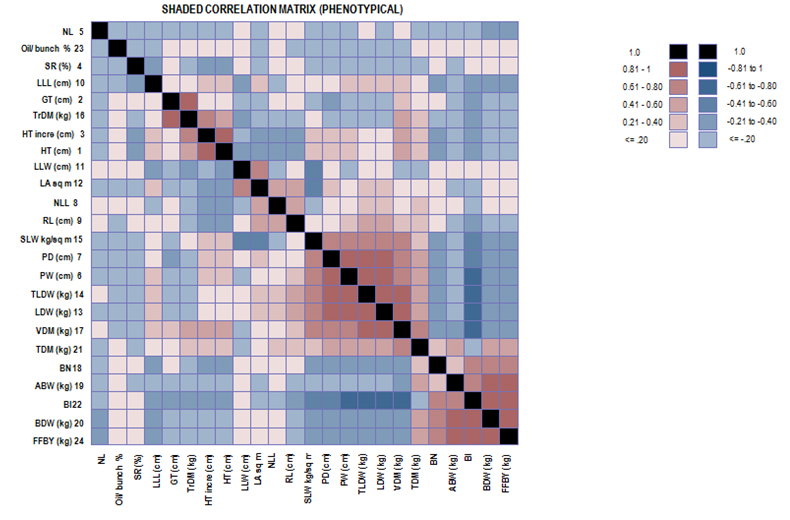
Fig. 2. Phenotypical Shaded Correlation Matrix
Table (3):
Phenotypical Correlation Matrix for 24 characters.
Character |
HT (cm) |
GT (cm) |
HT incre (cm) |
SR (%) |
NL |
PW (cm) |
PD (cm) |
NLL |
RL (cm) |
LLL (cm) |
LLW (cm) |
LA sq m |
LDW (kg) |
TLDW (kg) |
SLW kg/sq m |
TrDM (kg) |
VDM (kg) |
BN |
ABW (kg) |
BDW (kg) |
TDM (kg) |
BI |
Oil/ bunch % |
|---|---|---|---|---|---|---|---|---|---|---|---|---|---|---|---|---|---|---|---|---|---|---|---|
HT (cm) |
1.0000 |
0.0837 |
0.9748 |
-0.2405 |
-0.1402 |
0.2912 |
0.3025 |
-0.3251 |
-0.3218 |
0.2242 |
-0.2342 |
-0.2628 |
0.1876 |
0.1671 |
0.3846 |
0.5975 |
0.4804 |
-0.2921 |
-0.0056 |
-0.1642 |
0.3192 |
-0.3505 |
0.0406 |
GT (cm) |
0.0837 |
1.0000 |
0.1153 |
0.0430 |
-0.0331 |
-0.1905 |
-0.2446 |
0.0627 |
0.0634 |
0.0801 |
-0.1826 |
-0.0733 |
-0.1770 |
-0.1863 |
-0.1060 |
0.8319 |
0.2998 |
0.0354 |
-0.1869 |
-0.1254 |
0.1807 |
-0.2553 |
0.0196 |
HT incre (cm) |
0.9748 |
0.1153 |
1.0000 |
-0.2405 |
-0.1673 |
0.2584 |
0.2834 |
-0.3168 |
-0.3060 |
0.2126 |
-0.1716 |
-0.2082 |
0.1686 |
0.1428 |
0.3287 |
0.6336 |
0.4792 |
-0.2336 |
-0.0092 |
-0.1354 |
0.3415 |
-0.3329 |
0.0489 |
SR (%) |
-0.2405 |
0.0430 |
-0.2405 |
1.0000 |
-0.0073 |
-0.1565 |
-0.1159 |
0.0903 |
0.0109 |
-0.2795 |
0.0549 |
-0.0511 |
-0.1265 |
-0.1273 |
-0.0809 |
-0.0900 |
-0.1623 |
0.1055 |
-0.0659 |
0.0129 |
-0.1424 |
0.0748 |
-0.0314 |
NL |
-0.1402 |
-0.0331 |
-0.1673 |
-0.0073 |
1.0000 |
-0.0317 |
-0.0849 |
0.0031 |
0.1037 |
-0.0145 |
0.0143 |
-0.0124 |
-0.0332 |
0.1143 |
-0.0254 |
-0.1269 |
0.0297 |
-0.1305 |
-0.1852 |
-0.2316 |
-0.1600 |
-0.1728 |
-0.0687 |
PW (cm) |
0.2912 |
-0.1905 |
0.2584 |
-0.1565 |
-0.0317 |
1.0000 |
0.8367 |
0.1770 |
0.2173 |
0.2159 |
-0.0634 |
0.1349 |
0.9236 |
0.9123 |
0.7546 |
-0.0200 |
0.7919 |
-0.3603 |
-0.1836 |
-0.3238 |
0.4833 |
-0.6272 |
-0.0109 |
PD (cm) |
0.3025 |
-0.2446 |
0.2834 |
-0.1159 |
-0.0849 |
0.8367 |
1.0000 |
0.1494 |
0.1014 |
0.1611 |
0.0807 |
0.2237 |
0.9058 |
0.8836 |
0.6729 |
-0.0477 |
0.7512 |
-0.2709 |
-0.1484 |
-0.2539 |
0.5018 |
-0.5600 |
-0.0543 |
NLL |
-0.3251 |
0.0627 |
-0.3168 |
0.0903 |
0.0031 |
0.1770 |
0.1494 |
1.0000 |
0.4434 |
-0.0599 |
-0.0233 |
0.4672 |
0.2892 |
0.3010 |
-0.0794 |
-0.1397 |
0.1868 |
0.1694 |
0.0758 |
0.1436 |
0.2928 |
-0.0012 |
0.0726 |
RL (cm) |
-0.3218 |
0.0634 |
-0.3060 |
0.0109 |
0.1037 |
0.2173 |
0.1014 |
0.4434 |
1.0000 |
0.1960 |
0.1104 |
0.4176 |
0.4437 |
0.4616 |
0.1157 |
-0.1424 |
0.3269 |
0.0795 |
-0.0908 |
-0.0266 |
0.2867 |
-0.2022 |
-0.0198 |
LLL (cm) |
0.2242 |
0.0801 |
0.2126 |
-0.2795 |
-0.0145 |
0.2159 |
0.1611 |
-0.0599 |
0.1960 |
1.0000 |
-0.2844 |
0.2135 |
0.2445 |
0.2347 |
0.0731 |
0.1706 |
0.3017 |
-0.2132 |
-0.1575 |
-0.2187 |
0.1068 |
-0.3129 |
-0.1961 |
LLW (cm) |
-0.2342 |
-0.1826 |
-0.1716 |
0.0549 |
0.0143 |
-0.0634 |
0.0807 |
-0.0233 |
0.1104 |
-0.2844 |
1.0000 |
0.7271 |
0.0480 |
0.0453 |
-0.4925 |
-0.2221 |
-0.0840 |
0.0989 |
0.0207 |
0.0532 |
-0.0359 |
0.0888 |
0.0133 |
LA sq m |
-0.2628 |
-0.0733 |
-0.2082 |
-0.0511 |
-0.0124 |
0.1349 |
0.2237 |
0.4672 |
0.4176 |
0.2135 |
0.7271 |
1.0000 |
0.3053 |
0.3015 |
-0.4498 |
-0.1725 |
0.1690 |
0.0837 |
-0.0099 |
0.0291 |
0.1832 |
-0.0661 |
-0.0554 |
LDW (kg) |
0.1876 |
-0.1770 |
0.1686 |
-0.1265 |
-0.0332 |
0.9236 |
0.9058 |
0.2892 |
0.4437 |
0.2445 |
0.0480 |
0.3053 |
1.0000 |
0.9870 |
0.6999 |
-0.0650 |
0.8325 |
-0.2782 |
-0.1803 |
-0.2800 |
0.5573 |
-0.6225 |
-0.0361 |
TLDW (kg) |
0.1671 |
-0.1863 |
0.1428 |
-0.1273 |
0.1143 |
0.9123 |
0.8836 |
0.3010 |
0.4616 |
0.2347 |
0.0453 |
0.3015 |
0.9870 |
1.0000 |
0.6905 |
-0.0873 |
0.8315 |
-0.2893 |
-0.1989 |
-0.3039 |
0.5370 |
-0.6376 |
-0.0407 |
SLW kg/sq m |
0.3846 |
-0.1060 |
0.3287 |
-0.0809 |
-0.0254 |
0.7546 |
0.6729 |
-0.0794 |
0.1157 |
0.0731 |
-0.4925 |
-0.4498 |
0.6999 |
0.6905 |
1.0000 |
0.0783 |
0.6516 |
-0.2991 |
-0.1626 |
-0.2721 |
0.3931 |
-0.5282 |
-0.0066 |
TrDM (kg) |
0.5975 |
0.8319 |
0.6336 |
-0.0900 |
-0.1269 |
-0.0200 |
-0.0477 |
-0.1397 |
-0.1424 |
0.1706 |
-0.2221 |
-0.1725 |
-0.0650 |
-0.0873 |
0.0783 |
1.0000 |
0.4808 |
-0.1103 |
-0.1327 |
-0.1626 |
0.3209 |
-0.3645 |
0.0616 |
VDM (kg) |
0.4804 |
0.2998 |
0.4792 |
-0.1623 |
0.0297 |
0.7919 |
0.7512 |
0.1868 |
0.3269 |
0.3017 |
-0.0840 |
0.1690 |
0.8325 |
0.8315 |
0.6516 |
0.4808 |
1.0000 |
-0.3163 |
-0.2491 |
-0.3582 |
0.6515 |
-0.7645 |
-0.0014 |
BN |
-0.2921 |
0.0354 |
-0.2336 |
0.1055 |
-0.1305 |
-0.3603 |
-0.2709 |
0.1694 |
0.0795 |
-0.2132 |
0.0989 |
0.0837 |
-0.2782 |
-0.2893 |
-0.2991 |
-0.1103 |
-0.3163 |
1.0000 |
0.2277 |
0.6857 |
0.2591 |
0.6153 |
0.1003 |
ABW (kg) |
-0.0056 |
-0.1869 |
-0.0092 |
-0.0659 |
-0.1852 |
-0.1836 |
-0.1484 |
0.0758 |
-0.0908 |
-0.1575 |
0.0207 |
-0.0099 |
-0.1803 |
-0.1989 |
-0.1626 |
-0.1327 |
-0.2491 |
0.2277 |
1.0000 |
0.8617 |
0.4653 |
0.7334 |
0.0343 |
BDW (kg) |
-0.1642 |
-0.1254 |
-0.1354 |
0.0129 |
-0.2316 |
-0.3238 |
-0.2539 |
0.1436 |
-0.0266 |
-0.2187 |
0.0532 |
0.0291 |
-0.2800 |
-0.3039 |
-0.2721 |
-0.1626 |
-0.3582 |
0.6857 |
0.8617 |
1.0000 |
0.4749 |
0.8695 |
0.0813 |
TDM (kg) |
0.3192 |
0.1807 |
0.3415 |
-0.1424 |
-0.1600 |
0.4833 |
0.5018 |
0.2928 |
0.2867 |
0.1068 |
-0.0359 |
0.1832 |
0.5573 |
0.5370 |
0.3931 |
0.3209 |
0.6515 |
0.2591 |
0.4653 |
0.4749 |
1.0000 |
-0.0141 |
0.0645 |
BI |
-0.3505 |
-0.2553 |
-0.3329 |
0.0748 |
-0.1728 |
-0.6272 |
-0.5600 |
-0.0012 |
-0.2022 |
-0.3129 |
0.0888 |
-0.0661 |
-0.6225 |
-0.6376 |
-0.5282 |
-0.3645 |
-0.7645 |
0.6153 |
0.7334 |
0.8695 |
-0.0141 |
1.0000 |
0.0567 |
Oil/ bunch % |
0.0406 |
0.0196 |
0.0489 |
-0.0314 |
-0.0687 |
-0.0109 |
-0.0543 |
0.0726 |
-0.0198 |
-0.1961 |
0.0133 |
-0.0554 |
-0.0361 |
-0.0407 |
-0.0066 |
0.0616 |
-0.0014 |
0.1003 |
0.0343 |
0.0813 |
0.0645 |
0.0567 |
1.0000 |
FFBY (kg) |
-0.1642 |
-0.1254 |
-0.1354 |
0.0130 |
-0.2317 |
-0.3237 |
-0.2539 |
0.1436 |
-0.0265 |
-0.2186 |
0.0532 |
0.0292 |
-0.2799 |
-0.3038 |
-0.2721 |
-0.1626 |
-0.3582 |
0.6856 |
0.8618 |
1.0000 |
0.4749 |
0.8695 |
0.0813 |
Number of leaflets-NLL showed positive correlation with girth (G=0.0564; P=0.0627), sex ratio-SR (G=0.3258; P=0.0903), number of leaves-NL (G=0.1278; P=0.0031), petiole width-PW (G=0.1195; P=0.1770) petiole depth-PD (G=0.0755; P=0.1494), rachis length-RL (G=0.5757; P=0.4434), leaflet width-LLW (G=0.0492; P=-0.0233), leaf area-LA (G=0.4748; P=0.4672), leaf dry weight-LDW (G=0.2926; P=0.2892), total leaf dry weight-TLDW (G=0.3129; P=0.3010), vegetative dry matter-VDM (G=0.1337; P=0.1868), bunch number-BN (G=0.2230; P=0.1694), average bunch weight-ABW (G=0.1137; P=0.0758), bunch dry weight-BDW (G=0.1899; P=0.1436), total dry matter-TDM (G=0.2980; P=0.2928), bunch index-BI (G=0.0716; P=-0.0012) and oil to bunch ratio (G=0.1627; P=0.0726). Number of leaflets-NLL showed different correlation for leaflet width-LLW and bunch index-BI which is positive for genotypic and negative for phenotypic correlation.
Height of the palm-HT exhibits positive correlation with girth-GT (G=0.1101; P=0.0837), height increment-HT incre (G=0.9835; P=0.9748), petiole width-PW (G=0.3528; P=0.2912), petiole depth-PD (G=0.4275; P=0.3025), leaflet length-LLL (G=0.2677; P=0.2242), leaf dry weight-LDW (G=0.2308; P=0.1876), total leaf dry weight-TLDW (G=0.2015; P=0.1671), specific leaf weight-SLW (G=0.4621; P=0.3846), trunk dry matter-TrDM (G=0.6697; P=0.5975), vegetative dry matter-VDM (G=0.5506; P=0.4804), total dry matter-TDM (G=0.3619; P=0.3192) and oil to bunch ratio (G=0.0431; P=0.0406). These results were in coordination with the previous work where height-HT was positively and significantly correlated to yield component like oil to bunch ratio (Rafii et al., 2013).
Leaf area-LA was maximum and significantly correlated with leaflet width-LLW (G=0.7755; P=0.7271), rachis length-RL (G=0.4885; P=0.4176) and number of leaflets-NLL (G=0.4748; P=0.4672). Leaf area-LA was positively correlated with total dry matter-TDM and it was also significantly correlated with FFBY and bunch number-BN (Tan and Hardon, 1976). Greater correlation for Leaf area-LA with height-HT was observed (Hardon et al., 1969).
Vegetative dry matter-VDM was significantly associated with height-HT (G=0.5506; P=0.4804), height increment-HT incre (G=0.5553; P=0.4792), girth at base-GT (G=0.3356; P=0.2998), petiole width-PW (G=0.8193; P=0.7919), petiole depth-PD (G=0.7895; P=0.7512), rachis length-RL (G=0.3349; P=0.3269), leaflet length-LLL (G=0.3979; P=0.3017), leaf dry weight-LDW (G=0.8327; P=0.8325), total leaf dry weight-TLDW (G=0.8214; P=0.8315), specific leaf weight-SLW (G=0.6717; P=0.6516), total dry matter-TDM (G=0.5593; P=0.6515) and trunk dry matter-TrDM (G=0.5508; P=0.4804). Total dry matter-TDM was significantly correlated with vegetative dry matter-VDM (G=0.5593; P=0.6515), bunch dry weight-BDW (G=0.5244; P=0.4749), average bunch weight-ABW (G=0.5200; P=0.4653), leaf dry weight-LDW (G=0.4616; P=0.5573), total leaf dry weight-TLDW (G=0.4337; P=0.5370), petiole depth-PD (G=0.4092; P=0.5018), petiole width-PW (G=0.3984; P=0.4833), height increment-HT incre (G=0.3918; P=0.3415) and height of the palm-HT (G=0.3619; P=0.3192). Number of leaves-NL, height-HT and girth-GT had positively correlation with total dry matter-TDM (Lucas, 1980).
Bunch number-BN was positively associated with girth-GT (G=0.0363; P=0.0354), sex ratio-SR (G=0.1407; P=0.1055), number of leaflets-NLL (G=0.2230; P=0.1694), rachis length-RL (G=0.0974; P=0.0795), leaflet width-LLW (G=0.1434; P=0989), leaf area-LA (G=0.1299; P=0.0837), average bunch weight-ABW (G=0.3221; P=0.2277), bunch dry weight-BDW (G=0.7254; P=0.6857), total dry matter-TDM (G=0.3124; P=0.2591), bunch index-BI (G=0.6712; P=0.6153) and oil to bunch ratio (G=0.1425; P=0.1003). Similarly, positive correlation was observed for sex ratio-SR with bunch number-BN (Mason and Lewin, 1925). Bunch index-BI was positively and significantly correlated with bunch number-BN (G=0.6712; P=0.6153), average bunch weight-ABW (G=0.7801; P=0.7334) and bunch dry weight-BDW (G=0.9010; P=0.8695). Similar results had evinced that bunch index-BI is highly correlated with fresh fruit bunch yield (FFBY) and bunch number (BN) (Junaidah et al., 2004; Kushairi et al., 1999).
Sex ratio-SR (G=0.0544; P=0.0130), number of leaflets-NLL (G=0.1900; P=0.1436), total dry matter-TDM (G=0.5246; P=0.4749), leaflet width-LLW (G=0.0654; P=0.0532), bunch number-BN (G=0.7254; P=0.6856), bunch index-BI (G=0.9009; P=0.8695), average bunch weight-ABW (G=0.8824; P=0.8618) and oil to bunch ratio (G=0.1017; P=0.0813) had strong positive association with fresh fruit bunch yield-FFBY per palm and hence maximum emphasis should given for these characters to increase the fresh fruit bunch yield-FFBY per palm. Similar results were noticed where positive correlation was observed for fresh fruit bunch yield-FFBY with oil to bunch ratio (Krualee et al., 2013). Positive and significant correlation for fresh fruit bunch yield-FFBY with height-HT, number of leaflets-NLL, leaflet length-LLL, leaflet width-LLW, rachis length, petiole width-PW, petiole depth-PD, leaf area-LA and average bunch weight-ABW, but negatively associated with oil to bunch ratio (Marhalil et al., 2013). Highest correlation was obtained for fresh fruit bunch-FFB with number of leaves-NL (Oboh and Fakorede, 1990). Girth-GT and leaf area-LA were positively and significantly correlated with fresh fruit bunch yield-FFBY (Subronto et al., 1989; Agyei-Dwarko et al., 2012). Petiole width-PW, petiole depth-PD, rachis length-RL, leaflet length-LLL, leaflet width-LLW, leaf area-LA, leaf dry weight-LDW, total leaf dry weight-TLDW, specific leaf weight-SLW and vegetative dry matter-VDM were interrelated among themselves and would bring in simultaneous improvement in addition to FFBY.
The path analysis indicated (Table.4 & 5) that bunch number-BN, average bunch weight-ABW, bunch dry weight-BDW, total dry matter-TDM and bunch index-BI exerted direct positive effect on fresh fruit bunch yield-FFBY and for these traits direct selection can be made to improve the yield. Selecting FFBY alone could not get the superior hybrids, which can be improved by selecting high bunch index-BI and other vegetative character traits in breeding may get good superior high yielding and uniform palms (Corley et al., 1971). Average bunch weight-ABW had positive and indirect effect on yield via number of leaflets-NLL, leaflet width-LLW, bunch number-BN, bunch dry weight-BDW, total dry matter-TDM, bunch index-BI and oil to bunch ratio. For average bunch weight-ABW maximum indirect effect on yield was obtained through bunch index-BI, bunch dry weight-BDW, total dry matter-TDM and bunch number-BN. Hence selection through these characters may bring about improvement in fresh fruit bunch yield-FFBY.
Table (4):
Genotypical Path Matrix of FFBY.
Character |
HT (cm) |
GT (cm) |
HT incre (cm) |
SR (%) |
NL |
PW (cm) |
PD (cm) |
NLL |
RL (cm) |
LLL (cm) |
LLW (cm) |
LA sq m |
LDW (kg) |
TLDW (kg) |
SLW kg/sq m |
TrDM (kg) |
VDM (kg) |
BN |
ABW (kg) |
BDW (kg) |
TDM (kg) |
BI |
Oil/ bunch % |
|---|---|---|---|---|---|---|---|---|---|---|---|---|---|---|---|---|---|---|---|---|---|---|---|
HT (cm) |
0.0023 |
0.0003 |
0.0023 |
-0.0010 |
-0.0004 |
0.0008 |
0.0010 |
-0.0010 |
-0.0008 |
0.0006 |
-0.0006 |
-0.0007 |
0.0005 |
0.0005 |
0.0011 |
0.0016 |
0.0013 |
-0.0007 |
0.0000 |
-0.0004 |
0.0008 |
-0.0009 |
0.0001 |
GT (cm) |
0.0000 |
0.0003 |
0.0000 |
0.0000 |
0.0000 |
0.0000 |
-0.0001 |
0.0000 |
0.0000 |
0.0000 |
-0.0001 |
0.0000 |
0.0000 |
0.0000 |
0.0000 |
0.0002 |
0.0001 |
0.0000 |
-0.0001 |
0.0000 |
0.0001 |
-0.0001 |
0.0000 |
HT incre (cm) |
-0.0007 |
-0.0001 |
-0.0007 |
0.0003 |
0.0001 |
-0.0002 |
-0.0003 |
0.0003 |
0.0002 |
-0.0002 |
0.0001 |
0.0002 |
-0.0001 |
-0.0001 |
-0.0003 |
-0.0005 |
-0.0004 |
0.0002 |
0.0000 |
0.0001 |
-0.0003 |
0.0002 |
0.0000 |
SR (%) |
0.0001 |
0.0000 |
0.0001 |
-0.0002 |
0.0000 |
0.0001 |
0.0001 |
-0.0001 |
0.0000 |
0.0001 |
0.0000 |
0.0000 |
0.0000 |
0.0000 |
0.0001 |
0.0000 |
0.0001 |
0.0000 |
0.0000 |
0.0000 |
0.0000 |
0.0000 |
0.0000 |
NL |
-0.0006 |
-0.0004 |
-0.0007 |
-0.0003 |
0.0033 |
0.0004 |
0.0003 |
0.0004 |
0.0007 |
0.0001 |
0.0002 |
0.0003 |
0.0005 |
0.0009 |
0.0002 |
-0.0007 |
0.0004 |
-0.0006 |
-0.0008 |
-0.0010 |
-0.0005 |
-0.0008 |
-0.0003 |
PW (cm) |
0.0027 |
-0.0013 |
0.0025 |
-0.0025 |
0.0008 |
0.0078 |
0.0075 |
0.0009 |
0.0019 |
0.0024 |
-0.0010 |
0.0006 |
0.0075 |
0.0073 |
0.0062 |
0.0004 |
0.0064 |
-0.0034 |
-0.0020 |
-0.0031 |
0.0031 |
-0.0052 |
-0.0001 |
PD (cm) |
0.0006 |
-0.0003 |
0.0005 |
-0.0004 |
0.0001 |
0.0013 |
0.0013 |
0.0001 |
0.0002 |
0.0003 |
0.0000 |
0.0002 |
0.0012 |
0.0012 |
0.0009 |
0.0001 |
0.0010 |
-0.0005 |
-0.0003 |
-0.0005 |
0.0005 |
-0.0008 |
-0.0001 |
NLL |
0.0002 |
0.0000 |
0.0002 |
-0.0001 |
-0.0001 |
-0.0001 |
0.0000 |
-0.0004 |
-0.0002 |
0.0000 |
0.0000 |
-0.0002 |
-0.0001 |
-0.0001 |
0.0000 |
0.0001 |
-0.0001 |
-0.0001 |
0.0000 |
-0.0001 |
-0.0001 |
0.0000 |
-0.0001 |
RL (cm) |
-0.0011 |
0.0003 |
-0.0011 |
0.0001 |
0.0007 |
0.0008 |
0.0004 |
0.0019 |
0.0033 |
0.0008 |
0.0004 |
0.0016 |
0.0016 |
0.0017 |
0.0003 |
-0.0006 |
0.0011 |
0.0003 |
-0.0003 |
-0.0001 |
0.0010 |
-0.0006 |
0.0000 |
LLL (cm) |
-0.0005 |
-0.0002 |
-0.0005 |
0.0009 |
0.0000 |
-0.0006 |
-0.0005 |
0.0001 |
-0.0004 |
-0.0019 |
0.0007 |
-0.0002 |
-0.0006 |
-0.0006 |
-0.0004 |
-0.0004 |
-0.0008 |
0.0005 |
0.0004 |
0.0005 |
-0.0002 |
0.0007 |
0.0005 |
LLW (cm) |
0.0007 |
0.0005 |
0.0005 |
-0.0003 |
-0.0002 |
0.0003 |
-0.0001 |
-0.0001 |
-0.0003 |
0.0010 |
-0.0026 |
-0.0020 |
0.0000 |
0.0000 |
0.0016 |
0.0007 |
0.0004 |
-0.0004 |
0.0000 |
-0.0002 |
0.0002 |
-0.0003 |
0.0000 |
LA sq m |
0.0014 |
0.0004 |
0.0012 |
-0.0001 |
-0.0004 |
-0.0003 |
-0.0009 |
-0.0023 |
-0.0023 |
-0.0006 |
-0.0037 |
-0.0048 |
-0.0014 |
-0.0014 |
0.0024 |
0.0010 |
-0.0006 |
-0.0006 |
0.0002 |
-0.0001 |
-0.0007 |
0.0002 |
0.0002 |
LDW (kg) |
0.0059 |
-0.0033 |
0.0055 |
-0.0070 |
0.0038 |
0.0246 |
0.0233 |
0.0075 |
0.0128 |
0.0087 |
-0.0001 |
0.0074 |
0.0256 |
0.0254 |
0.0173 |
0.0002 |
0.0213 |
-0.0087 |
-0.0064 |
-0.0089 |
0.0118 |
-0.0163 |
-0.0009 |
TLDW (kg) |
-0.1053 |
0.0752 |
-0.0940 |
0.1420 |
-0.1445 |
-0.4920 |
-0.4682 |
-0.1634 |
-0.2695 |
-0.1682 |
0.0018 |
-0.1491 |
-0.5177 |
-0.5224 |
-0.3491 |
0.0124 |
-0.4290 |
0.1808 |
0.1374 |
0.1918 |
-0.2265 |
0.3353 |
0.0183 |
SLW kg/sq m |
-0.0048 |
0.0003 |
-0.0043 |
0.0031 |
-0.0006 |
-0.0083 |
-0.0070 |
0.0012 |
-0.0010 |
-0.0023 |
0.0063 |
0.0053 |
-0.0071 |
-0.0070 |
-0.0105 |
-0.0021 |
-0.0070 |
0.0040 |
0.0022 |
0.0035 |
-0.0034 |
0.0058 |
0.0000 |
TrDM (kg) |
-0.2269 |
-0.2707 |
-0.2404 |
0.0444 |
0.0713 |
-0.0195 |
-0.0244 |
0.0755 |
0.0569 |
-0.0766 |
0.0848 |
0.0713 |
-0.0030 |
0.0080 |
-0.0675 |
-0.3388 |
-0.1866 |
0.0493 |
0.0493 |
0.0628 |
-0.1172 |
0.1346 |
-0.0455 |
VDM (kg) |
-0.1472 |
-0.0897 |
-0.1484 |
0.0807 |
-0.0296 |
-0.2190 |
-0.2110 |
-0.0357 |
-0.0895 |
-0.1063 |
0.0390 |
-0.0316 |
-0.2225 |
-0.2195 |
-0.1795 |
-0.1472 |
-0.2672 |
0.0995 |
0.0809 |
0.1102 |
-0.1495 |
0.2039 |
-0.0127 |
BN |
-0.0014 |
0.0002 |
-0.0012 |
0.0006 |
-0.0008 |
-0.0020 |
-0.0017 |
0.0010 |
0.0004 |
-0.0011 |
0.0006 |
0.0006 |
-0.0015 |
-0.0015 |
-0.0017 |
-0.0006 |
-0.0017 |
0.0045 |
0.0014 |
0.0032 |
0.0014 |
0.0030 |
0.0006 |
ABW (kg) |
0.0000 |
-0.0013 |
0.0000 |
-0.0003 |
-0.0014 |
-0.0015 |
-0.0014 |
0.0007 |
-0.0006 |
-0.0013 |
0.0001 |
-0.0002 |
-0.0015 |
-0.0016 |
-0.0012 |
-0.0009 |
-0.0018 |
0.0019 |
0.0059 |
0.0052 |
0.0031 |
0.0046 |
0.0002 |
BDW (kg) |
-0.0276 |
-0.0252 |
-0.0230 |
0.0090 |
-0.0481 |
-0.0666 |
-0.0596 |
0.0313 |
-0.0041 |
-0.0451 |
0.0108 |
0.0050 |
-0.0574 |
-0.0605 |
-0.0553 |
-0.0306 |
-0.0680 |
0.1196 |
0.1455 |
0.1649 |
0.0865 |
0.1486 |
0.0168 |
TDM (kg) |
0.3313 |
0.1598 |
0.3586 |
-0.2132 |
-0.1483 |
0.3647 |
0.3746 |
0.2728 |
0.2661 |
0.1127 |
-0.0701 |
0.1269 |
0.4225 |
0.3970 |
0.2953 |
0.3166 |
0.5120 |
0.2860 |
0.4760 |
0.4801 |
0.9154 |
0.0978 |
0.1252 |
BI |
0.0033 |
0.0025 |
0.0031 |
-0.0014 |
0.0022 |
0.0059 |
0.0055 |
-0.0006 |
0.0017 |
0.0034 |
-0.0011 |
0.0003 |
0.0056 |
0.0057 |
0.0049 |
0.0035 |
0.0068 |
-0.0060 |
-0.0069 |
-0.0080 |
-0.0009 |
-0.0089 |
-0.0005 |
Oil/ bunch % |
0.0000 |
0.0000 |
0.0000 |
0.0000 |
0.0000 |
0.0000 |
0.0000 |
0.0000 |
0.0000 |
0.0000 |
0.0000 |
0.0000 |
0.0000 |
0.0000 |
0.0000 |
0.0000 |
0.0000 |
0.0000 |
0.0000 |
0.0000 |
0.0000 |
0.0000 |
-0.0002 |
FFBY (kg) |
-0.1676 |
-0.1528 |
-0.1396 |
0.0544 |
-0.2920 |
-0.4035 |
-0.3611 |
0.1900 |
-0.0246 |
-0.2735 |
0.0654 |
0.0308 |
-0.3479 |
-0.3670 |
-0.3352 |
-0.1854 |
-0.4123 |
0.7254 |
0.8824 |
1.0000 |
0.5246 |
0.9009 |
0.1017 |
Partial R² |
-0.0004 |
0.0000 |
0.0001 |
0.0000 |
-0.0010 |
-0.0031 |
-0.0005 |
-0.0001 |
-0.0001 |
0.0005 |
-0.0002 |
-0.0001 |
-0.0089 |
0.1917 |
0.0035 |
0.0628 |
0.1102 |
0.0032 |
0.0052 |
0.1649 |
0.4802 |
-0.0080 |
0.0000 |
R SQUARE = 1.0000 RESIDUAL EFFECT = SQRT(1- 1.0000)
Table (5):
Phenotypical Path Matrix of FFBY.
Character |
HT (cm) |
GT (cm) |
HT incre (cm) |
SR (%) |
NL |
PW (cm) |
PD (cm) |
NLL |
RL (cm) |
LLL (cm) |
LLW (cm) |
LA sq m |
LDW (kg) |
TLDW (kg) |
SLW kg/sq m |
TrDM (kg) |
VDM (kg) |
BN |
ABW (kg) |
BDW (kg) |
TDM (kg) |
BI |
Oil/ bunch % |
|---|---|---|---|---|---|---|---|---|---|---|---|---|---|---|---|---|---|---|---|---|---|---|---|
HT (cm) |
0.0001 |
0.0000 |
0.0001 |
0.0000 |
0.0000 |
0.0000 |
0.0000 |
0.0000 |
0.0000 |
0.0000 |
0.0000 |
0.0000 |
0.0000 |
0.0000 |
0.0000 |
0.0001 |
0.0001 |
0.0000 |
0.0000 |
0.0000 |
0.0000 |
0.0000 |
0.0000 |
GT (cm) |
0.0001 |
0.0007 |
0.0001 |
0.0000 |
0.0000 |
-0.0001 |
-0.0002 |
0.0000 |
0.0000 |
0.0001 |
-0.0001 |
0.0000 |
-0.0001 |
-0.0001 |
-0.0001 |
0.0006 |
0.0002 |
0.0000 |
-0.0001 |
-0.0001 |
0.0001 |
-0.0002 |
0.0000 |
HT incre (cm) |
0.0003 |
0.0000 |
0.0003 |
-0.0001 |
0.0000 |
0.0001 |
0.0001 |
-0.0001 |
-0.0001 |
0.0001 |
0.0000 |
-0.0001 |
0.0000 |
0.0000 |
0.0001 |
0.0002 |
0.0001 |
-0.0001 |
0.0000 |
0.0000 |
0.0001 |
-0.0001 |
0.0000 |
SR (%) |
0.0000 |
0.0000 |
0.0000 |
0.0001 |
0.0000 |
0.0000 |
0.0000 |
0.0000 |
0.0000 |
0.0000 |
0.0000 |
0.0000 |
0.0000 |
0.0000 |
0.0000 |
0.0000 |
0.0000 |
0.0000 |
0.0000 |
0.0000 |
0.0000 |
0.0000 |
0.0000 |
NL |
0.0000 |
0.0000 |
0.0000 |
0.0000 |
0.0002 |
0.0000 |
0.0000 |
0.0000 |
0.0000 |
0.0000 |
0.0000 |
0.0000 |
0.0000 |
0.0000 |
0.0000 |
0.0000 |
0.0000 |
0.0000 |
0.0000 |
0.0000 |
0.0000 |
0.0000 |
0.0000 |
PW (cm) |
0.0002 |
-0.0001 |
0.0002 |
-0.0001 |
0.0000 |
0.0007 |
0.0006 |
0.0001 |
0.0002 |
0.0002 |
0.0000 |
0.0001 |
0.0007 |
0.0007 |
0.0006 |
0.0000 |
0.0006 |
-0.0003 |
-0.0001 |
-0.0002 |
0.0004 |
-0.0005 |
0.0000 |
PD (cm) |
0.0001 |
-0.0001 |
0.0001 |
0.0000 |
0.0000 |
0.0004 |
0.0004 |
0.0001 |
0.0000 |
0.0001 |
0.0000 |
0.0001 |
0.0004 |
0.0004 |
0.0003 |
0.0000 |
0.0003 |
-0.0001 |
-0.0001 |
-0.0001 |
0.0002 |
-0.0002 |
0.0000 |
NLL |
-0.0001 |
0.0000 |
-0.0001 |
0.0000 |
0.0000 |
0.0000 |
0.0000 |
0.0003 |
0.0001 |
0.0000 |
0.0000 |
0.0001 |
0.0001 |
0.0001 |
0.0000 |
0.0000 |
0.0001 |
0.0000 |
0.0000 |
0.0000 |
0.0001 |
0.0000 |
0.0000 |
RL (cm) |
-0.0001 |
0.0000 |
-0.0001 |
0.0000 |
0.0000 |
0.0001 |
0.0000 |
0.0001 |
0.0003 |
0.0001 |
0.0000 |
0.0001 |
0.0001 |
0.0001 |
0.0000 |
0.0000 |
0.0001 |
0.0000 |
0.0000 |
0.0000 |
0.0001 |
-0.0001 |
0.0000 |
LLL (cm) |
0.0001 |
0.0000 |
0.0001 |
-0.0001 |
0.0000 |
0.0001 |
0.0001 |
0.0000 |
0.0001 |
0.0004 |
-0.0001 |
0.0001 |
0.0001 |
0.0001 |
0.0000 |
0.0001 |
0.0001 |
-0.0001 |
-0.0001 |
-0.0001 |
0.0000 |
-0.0001 |
-0.0001 |
LLW (cm) |
-0.0001 |
-0.0001 |
-0.0001 |
0.0000 |
0.0000 |
0.0000 |
0.0000 |
0.0000 |
0.0001 |
-0.0001 |
0.0005 |
0.0004 |
0.0000 |
0.0000 |
-0.0003 |
-0.0001 |
0.0000 |
0.0001 |
0.0000 |
0.0000 |
0.0000 |
0.0000 |
0.0000 |
LA sq m |
0.0001 |
0.0000 |
0.0001 |
0.0000 |
0.0000 |
0.0000 |
-0.0001 |
-0.0001 |
-0.0001 |
-0.0001 |
-0.0002 |
-0.0002 |
-0.0001 |
-0.0001 |
0.0001 |
0.0000 |
0.0000 |
0.0000 |
0.0000 |
0.0000 |
0.0000 |
0.0000 |
0.0000 |
LDW (kg) |
0.0002 |
-0.0002 |
0.0002 |
-0.0001 |
0.0000 |
0.0009 |
0.0009 |
0.0003 |
0.0004 |
0.0002 |
0.0000 |
0.0003 |
0.0009 |
0.0009 |
0.0007 |
-0.0001 |
0.0008 |
-0.0003 |
-0.0002 |
-0.0003 |
0.0005 |
-0.0006 |
0.0000 |
TLDW (kg) |
-0.0133 |
0.0149 |
-0.0114 |
0.0102 |
-0.0091 |
-0.0728 |
-0.0705 |
-0.0240 |
-0.0368 |
-0.0187 |
-0.0036 |
-0.0241 |
-0.0788 |
-0.0798 |
-0.0551 |
0.0070 |
-0.0664 |
0.0231 |
0.0159 |
0.0243 |
-0.0429 |
0.0509 |
0.0033 |
SLW kg/sq m |
0.0001 |
0.0000 |
0.0001 |
0.0000 |
0.0000 |
0.0002 |
0.0002 |
0.0000 |
0.0000 |
0.0000 |
-0.0002 |
-0.0001 |
0.0002 |
0.0002 |
0.0003 |
0.0000 |
0.0002 |
-0.0001 |
-0.0001 |
-0.0001 |
0.0001 |
-0.0002 |
0.0000 |
TrDM (kg) |
-0.0297 |
-0.0414 |
-0.0315 |
0.0045 |
0.0063 |
0.0010 |
0.0024 |
0.0070 |
0.0071 |
-0.0085 |
0.0111 |
0.0086 |
0.0032 |
0.0043 |
-0.0039 |
-0.0498 |
-0.0239 |
0.0055 |
0.0066 |
0.0081 |
-0.0160 |
0.0181 |
-0.0031 |
VDM (kg) |
-0.1418 |
-0.0885 |
-0.1415 |
0.0479 |
-0.0088 |
-0.2338 |
-0.2217 |
-0.0551 |
-0.0965 |
-0.0891 |
0.0248 |
-0.0499 |
-0.2457 |
-0.2454 |
-0.1923 |
-0.1419 |
-0.2952 |
0.0934 |
0.0735 |
0.1057 |
-0.1923 |
0.2257 |
0.0004 |
BN |
-0.0001 |
0.0000 |
-0.0001 |
0.0000 |
0.0000 |
-0.0001 |
-0.0001 |
0.0000 |
0.0000 |
-0.0001 |
0.0000 |
0.0000 |
-0.0001 |
-0.0001 |
-0.0001 |
0.0000 |
-0.0001 |
0.0003 |
0.0001 |
0.0002 |
0.0001 |
0.0002 |
0.0000 |
ABW (kg) |
0.0000 |
-0.0001 |
0.0000 |
0.0000 |
-0.0001 |
-0.0001 |
-0.0001 |
0.0001 |
-0.0001 |
-0.0001 |
0.0000 |
0.0000 |
-0.0001 |
-0.0001 |
-0.0001 |
-0.0001 |
-0.0002 |
0.0002 |
0.0007 |
0.0006 |
0.0003 |
0.0005 |
0.0000 |
BDW (kg) |
-0.1097 |
-0.0838 |
-0.0905 |
0.0086 |
-0.1548 |
-0.2164 |
-0.1697 |
0.0959 |
-0.0178 |
-0.1461 |
0.0355 |
0.0194 |
-0.1871 |
-0.2031 |
-0.1818 |
-0.1087 |
-0.2394 |
0.4582 |
0.5759 |
0.6683 |
0.3173 |
0.5811 |
0.0543 |
TDM (kg) |
0.1298 |
0.0735 |
0.1389 |
-0.0579 |
-0.0651 |
0.1966 |
0.2041 |
0.1191 |
0.1166 |
0.0435 |
-0.0146 |
0.0745 |
0.2267 |
0.2184 |
0.1599 |
0.1305 |
0.2650 |
0.1054 |
0.1893 |
0.1932 |
0.4068 |
-0.0058 |
0.0263 |
BI |
-0.0002 |
-0.0002 |
-0.0002 |
0.0000 |
-0.0001 |
-0.0004 |
-0.0004 |
0.0000 |
-0.0001 |
-0.0002 |
0.0001 |
0.0000 |
-0.0004 |
-0.0004 |
-0.0003 |
-0.0002 |
-0.0005 |
0.0004 |
0.0005 |
0.0005 |
0.0000 |
0.0006 |
0.0000 |
Oil/ bunch % |
0.0000 |
0.0000 |
0.0000 |
0.0000 |
0.0000 |
0.0000 |
0.0000 |
0.0000 |
0.0000 |
0.0000 |
0.0000 |
0.0000 |
0.0000 |
0.0000 |
0.0000 |
0.0000 |
0.0000 |
0.0000 |
0.0000 |
0.0000 |
0.0000 |
0.0000 |
0.0001 |
FFBY (kg) |
-0.1642 |
-0.1254 |
-0.1354 |
0.0130 |
-0.2317 |
-0.3237 |
-0.2539 |
0.1436 |
-0.0265 |
-0.2186 |
0.0532 |
0.0292 |
-0.2799 |
-0.3038 |
-0.2721 |
-0.1626 |
-0.3582 |
0.6856 |
0.8618 |
1.0000 |
0.4749 |
0.8695 |
0.0813 |
Partial R² |
0.0000 |
-0.0001 |
0.0000 |
0.0000 |
0.0000 |
-0.0002 |
-0.0001 |
0.0000 |
0.0000 |
-0.0001 |
0.0000 |
0.0000 |
-0.0003 |
0.0242 |
-0.0001 |
0.0081 |
0.1057 |
0.0002 |
0.0006 |
0.6683 |
0.1932 |
0.0005 |
0.0000 |
R SQUARE = 1.0000 RESIDUAL EFFECT = 0.0009
Bunch number-BN exhibited positive indirect effect on yield through girth-GT, sex ratio-SR, number of leaflets-NLL, rachis length-RL, leaflet width-LLW, leaf area-LA, average bunch weight-ABW, bunch dry weight-BDW, total dry matter-TDM, bunch index-BI and oil to bunch ratio. Bunch dry weight-BDW had positive indirect effect on yield via, sex ratio-SR, number of leaflets-NLL, leaflet width-LLW, leaf area-LA, average bunch weight-ABW, bunch number-BN, total dry matter-TDM, bunch index-BI and oil to bunch ratio. Number of leaves-NL, sex-ratio-SR and other bunch characters, would be effective as indirect selection criteria for bunch number-BN and fresh fruit bunch yield-FFBY (Oboh and Fakorede, 1990). Total dry matter-TDM had indirect effect on yield via height-HT, girth-GT, height increment-HT incre, petiole width-PW, petiole depth-PD, number of leaflets-NLL, rachis length-RL, leaflet length-LLL, leaf area-LA, leaf dry weight-LDW, total leaf dry weight-TLDW, specific leaf weight-SLW, trunk dry matter-TrDM, vegetative dry matter-VDM, bunch number-BN, average bunch weight-ABW, bunch dry weight-BDW, bunch index-BI and oil to bunch ratio. Selection of high total dry matter-TDM character may increase the yields of the hybrids which had indirect effect on bunch number-BN (Rees, 1963). Total dry matter-TDM production is going to bunch number-BN in fraction or more. Path coefficient analysis results show that fresh fruit bunch yield-FFBY was directly influenced by average bunch weight-ABW and bunch number (Tanya et al., 2013). The characters fresh fruit bunch yield-FFBY and bunch number-BN shows highly positive correlation with large direct and indirect positive effects on oil yield and percent oil/bunch (Eksomtramage et al., 2001).
The trait fresh fruit bunch yield-FFBY can be improved through bunch number-BN, average bunch weight-ABW, bunch dry weight-BDW, total dry matter-TDM and bunch index-BI and these characters showed positive association with quality parameter like oil to bunch ratio and the major emphasis should be laid on selection process with high number of bunch number-BN, average bunch weight-ABW, bunch dry weight-BDW, total dry matter-TDM and bunch index-BI for better genotypes with superior oil quality and for realizing higher fresh fruit bunch yield-FFBY.
- Agyei-Dwarko D, Ofori K and Kaledzi P D. Variation and correlation analysis of growth parameters in D x P oil palm (Elaeis guineensis J.) seedlings. Elixir Agriculture, 2012; 47: 8946-8949.
- Anuradha N, Rama Kumar P V, Durga Rani Ch V and Vishnuvardhan Reddy A. Correlation and Path Coefficient analyses in sunflower (Helianthus annuus L.). The Andhra Agricultural Journal, 2005; 52(3&4): 346-349.
- Chan K W, Alwi A and Liau S S. The long-term influence of weevil pollination on yield production pattern of oil palm in Guthrie Estates in Malaysia. Proc. of the 1989 PORIM International Palm Oil Development Congress. Agriculture Conference. Kuala Lumpur, 1989; 133-143.
- Chitra S, Ananda Kumar C R and Vivekanandan P. Correlation and Path analyses in Assam Rice collection (Oryza sativa L.). The Andhra Agricultural Journal, 2005; 52(3&4): 388-391.
- Corley R H V, Hardon J J and Tan G Y. Analysis of growth of the oil palm (Elaeis guineensis Jacq.). 1. Estimation of growth parameters and application in breeding. Euphytica, 1971; 20: 307-315.
- Dewey D R and Lu K H. A correlation and path analysis of components of crested wheat grass seed production. Agronomy Journal, 1959; 51: 515-518.
- Donough C R and Law I H. The effect of weevil pollination on yield and profitability at Pamol Plantations. Proc. of the 1987 International Oil Palm/Palm Oil Conferences. PORIM, Bangi., 1988; 523-527.
- Eksomtramage T, Songsri N, Juntaraniyom T, Tongkum P, Nilnond C, Chaumongkol Y. Correlation, path coefficient analysis and heritability for agronomic characters of oil palm (Elaeis guineensis Jacq.). Songklanakarin Journal of Science and Technology, 2001; 23(Suppl.): 691.
- Falconer D S. An Introduction to Quantitative Genetics. Second edition. Oliver and Boyd Ltd. Edinburgh, 1964; pp.312-324.
- Hardon J J, Williams C N and Watson I. Leaf area and yield in the oil palm in Malaya. Expl. Agric., 1969; 5: 25-32.
- Johnson A W, Robinson H F and Comstock R E. Estimates of genetic and environmental variability in soyabean. Agronomy Journal, 1955; 47: 314-318.
- Junaidah J, Kushairi A, Isa Z A, Mohd Din A, Noh A and Rajanaidu N. High Bunch Index breeding population. MPOB Information series, PS7: 228, MPOB TT No. 221.
- Karunakar Raju G B, Chenga Reddy C, Panduranga Rao C, Reddy K V S and Srinivasa Rao V. Character Association and Path Coefficient analyses in Upland Cotton (Gossypium hirsutum L.). The Andhra Agricultural Journal, 2005; 52 (3&4): 459-463.
- Krualee Sudanai, Sdoodee S, Eksomtramage T, Sereeprasert V. Correlation and path analysis of palm oil yield components in oil palm (Elaeis guineensis Jacq.). Kasetsart Journal – Natural Science, 2013; 47(4): 528-533.
- Kushairi A, Rajanaidu N, Jalani B S and Zakri A H. Agronomic Performance and Genetic variability of Dura x Pisifera progenies. Journal of Oil Palm Research. 1999; 11(2): 1-24.
- Lucas E O. Relations between growth parameters in oil palm seedling growth in polybags. Expl Agric., 1980; 16: 275-278.
- Marhalil M, Rafii M Y, Afizi M M A, Arolu I W, Noh A, Mohd Din A, Kushairi A, Norziha A, Rajanaidu N, Latif A, Malek M A. Genetic variability in yield and vegetative traits in elite germplasm of MPOB-Nigerian dura × AVROS pisifera progenies. Journal of Food Agriculture and Environment, 2013; 11(2): 515-519.
- Mason T G and Lewin C J. Growth and correlation in the oil-palm (Elaeis guineensis). Annals of Applied Biology, 1925; 12(4): 410-421.
- Oboh B O and Fakorede M A B. Interrelations among vegetative, yield and bunch quality traits in short-tem oil palm progenies. Euphytica, 1990; 46(1): 7-14.
- Pulli Bai P, Sultana Razia, Panduranga Rao C and Srinivasa Rao V. Character Association and Path analyses in Roselle Hemp (Hibiscus sabdariffa L.). The Andhra Agricultural Journal, 2005; 52(3&4): 403-406.
- Rafii M Y, Isa Z A, Kushairi A, and Latif M A. Variation in yield components and vegetative traits in Malaysian oil palm (Elaeis guineensis Jacq.) dura × pisifera hybrids under various planting densities. Industrial Crops and Products, 2013; 46: 147–157·
- Rees A R. (1963). Relationship between crop growth rate and leaf area index in the oil palm. Nature, 197: 63-64.
- Subronto, Taniputra B and Manurung A. (1989). Correlation between vegetative characters of oil palm in the nursery and yield. Buletin-Perkebunan (Indonesia), 20: 107-116.
- Sumalini K and Manjulatha G. Heritability, correlation and path coefficient analysis in maize. Maize Journal, 2012; 1(2): 97-101.
- Tan G Y and Hardon J J. Nursery selection. In: Oil palm research (Ed. by R H V Corley, J J Hardon & B J Wood), pp.139-143, Elsevier, Amsterdam 1976.
- Tanya Patcharin, Hadkam Yaowanat, Taeprayoon Puntaree and Srinives Peerasak. Estimates of repeatability and path Coefficient of bunch and fruit traits In bang boet dura oil palm. Journal of oil palm research, 2013; 25(1): 108-115.
- Vinothini S and Ananda Kumar C R. Correlation and Path Coefficient analyses in Drought tolerant Rice cultures for yield. The Andhra Agricultural Journal, 2005; 52 (3&4): 373-377.
- Wood B J, Said I, Loong S G and Chew S C. (1984). A preliminary report on a long-term study of the effect of oil palm harvesting strategy on product recovery, including a comparison before and after weevil pollination. Proc. of the Symposium on Impact of the Pollination Weevil on the Malaysian Oil Palm Industry. Kuala Lumpur. 187-219.
© The Author(s) 2018. Open Access. This article is distributed under the terms of the Creative Commons Attribution 4.0 International License which permits unrestricted use, sharing, distribution, and reproduction in any medium, provided you give appropriate credit to the original author(s) and the source, provide a link to the Creative Commons license, and indicate if changes were made.