

ISSN: 0973-7510
E-ISSN: 2581-690X
Mass spectrometry is an analytical technique for molecules detection after separating the particle motion (charged molecules, atoms and fragment ions) according to their mass-to-charge ratio, under the action of an electric field and a magnetic field. In this study, ten kinds of fragment ions of metabolites in Escherichia coli were detected by ion trap liquid mass instrument and triple quadrupole mass chromatograph. Two different detection methods were then compared, to provide a foundation for later metabolomic research. This experiment detects metabolites with multistage mass spectrometry by electrospray ion trap mass spectrometry and triple quadrupole mass spectrometry, when scanning at anion mode using Agilent SB-C18 (250mm×4.6mm×5ìm) chromatographic column and using ammonium acetate and acetonitrile as the mobile phase. The result showed that both methods can act as multistage mass spectrometry, while triple quadrupole mass spectrometry enables to produce finer ions under low collision energy. Triple quadrupole mass spectrometry is a superior method to acquire a clear peak in detecting fragment ions of metabolites.
Ion trap mass spectrometry, triple quadrupole mass spectrometry, metabolites, mass-to-charge ratio
In studies of metabolic processes in microorganisms, it’s very important to detect target metabolite, both qualitatively and quantitatively. Detecting target metabolite precisely and determining its content are important goals in modern metabolomics. Such studies have progressed significantly in recent years as a result of new and improved methodologies1-4.
The aim of this study is to analyse Escherichia coli carbon center metabolites by High Performance Liquid Chromatography, coupled with Tandem Mass Spectrometry. Escherichia coli is commonly used for experimental purposes, and particularly in genetic engineering. There have been 904 different Escherichia coli metabolites mentioned in research papers, involving in 932 different reactions [5-6], the number of which seems to be rapidly increasing as more research follows. Carbon central metabolism are common to many reactions in Escherichia coli and are therefore important to study to further understand the metabolomics of this commonly used bacterium. This study is to establish the experimental conditions of High Performance Liquid Chromatography coupled with Tandem Mass Spectrometry for Escherichia coli carbon center metabolites. In addition, we hope to provide some references with regards to cell extraction methods and detection, for future studies.
There have been many studies describing extraction methods of mesostate in TCA and modern analysis techniques for phosphorylation products in most of the central metabolic pathways. Gas chromatography coupled with mass spectrometry is very common in metabolite detection, but its disadvantage is that heat-sensitive compounds have denatured decomposition more easily during the detection. Both triple quadrupole mass spectrometry and ion trap mass spectrometry are multi-stage mass spectrometry. Triple quadrupole mass spectrometry is mainly used for quantitative and qualitative analysis of target compounds and is often referred to as space tandem mass spectrometry. Ion trap mass spectrometry is time tandem mass spectrometry which is generally used for qualitative analysis and structural analysis of unknown compounds7-9.
Recently, with the development of MS and interface technology of LC/MS, it is now possible to determine conjugated metabolites directly. It has been reported that glucuronide conjugates can be determined directly by LC/MS/MS. The basis for the structure of this conjugate is that the new fragment ions are found when a molecular ion peak draws off 176u in the secondary mass [10]. In this study, we set out to explore and establish analysis of Escherichia coli carbon center metabolites using high performance liquid chromatography coupled with tandem mass spectrometry (LC/MS/MS). It is one of the most important methods for standard sample detection of these kinds of metabolites.
Main Instruments
Triple quadrupole mass spectrometer; ion trap mass spectrometer; sonicator; electronic analytical balance
Experimental Methods
Chromatographic conditions
Chromatographic column: 250mm × 4.6mm × 5um; column temperature: 35°C capillary temperature: 380°C; molecular weight range: 50-400°C mobile phase A: 10mmol/L ammonium acetate solution; mobile phase B: acetonitrile
Mass spectrometry conditions
negative ion scan; electrospray ionization voltage (ESI): 4.5 kV ion source temperature: 480°C; injection volume: 5 ml
Mass spectrometry conditions
Negative ion scan; electrospray ionization voltage (ESI): 4.5 kVion source temperature: 480!; injection volume: 5 ml
Preparation standard solution of samples
We prepared ten kinds of metabolites, which are pyruvic acid; glucose- 6-phosphate dipotassium salt; fructose-6-phosphate dipotassium salt; succinic acid; aspartic acid; isocitric acid trisodium salt; citric acid; glutamate acid; ±-ketoglutarate acid; fumaric acid acid respectively. To make all the standard solutions, use an electronic analytical balance to enable highly accurate weighing.
Table (1):
Gradient elution parameters.
Time |
Mobile phase A |
Mobile phase B |
|---|---|---|
0 |
0 |
100 |
3 |
10 |
90 |
15 |
50 |
50 |
25 |
50 |
50 |
27 |
90 |
10 |
35 |
100 |
0 |
Table (2):
The parameters of ten kinds of metabolites detected by ion trap mass spectrometry.
Metabolites |
parent ion |
ion |
CE |
|---|---|---|---|
Citric acid |
191 |
87 |
25eV |
D-Frutose-6-phosphate dipotassium salt |
259 |
97 |
27eV |
Dipotassium D-Glucose-6-phosphate |
259 |
97、78.9 |
27eV |
2-ketoglutaric acid |
145 |
101 |
18eV |
Glutamic acid |
146 |
128 |
20eV |
Fumaric acid |
115 |
71 |
20eV |
Pyruvic acid |
87 |
87 |
10eV |
Aspartic acid |
132 |
88 |
27eV |
Succitric acid |
117 |
73 |
27eV |
Isocitric acid trisodium salt hydrate |
191 |
111、173.1 |
27eV |
Table (3):
The parameters of ten kinds of metabolites detected by triple quadrupole mass spectrometry.
metabolites |
CE |
parent ion (m/z) |
ion(m/z) |
|---|---|---|---|
Dipotassium D-Glucose-6-phosphate |
135 |
259 |
139, 169, 199 |
Aspartic acid |
135 |
132 |
71.2, 88.1 |
Citric acid |
135 |
191 |
111.0 |
D-Frutose-6-phosphate dipotassium salt |
135 |
259 |
139, 169 |
Pyruvic acid |
135 |
87 |
43.0 |
Succitric acid |
135 |
117 |
73.1 |
Isocitric acid trisodium salt hydrate |
135 |
191 |
73.1, 167.1 |
Glutamic acid |
135 |
146 |
84.0, 102.1 |
2-ketoglutaric acid |
135 |
145 |
57.1, 145.1 |
Fumaric acid |
135 |
115 |
71.0 |
Results of ion trap LC
X-axis represents ion response; Y-axis represents the time respectively; ESI: electrospray ionization voltage; MRM-multistage reaction detection; Frag-collision voltage; CID-collisional dissociation voltage.
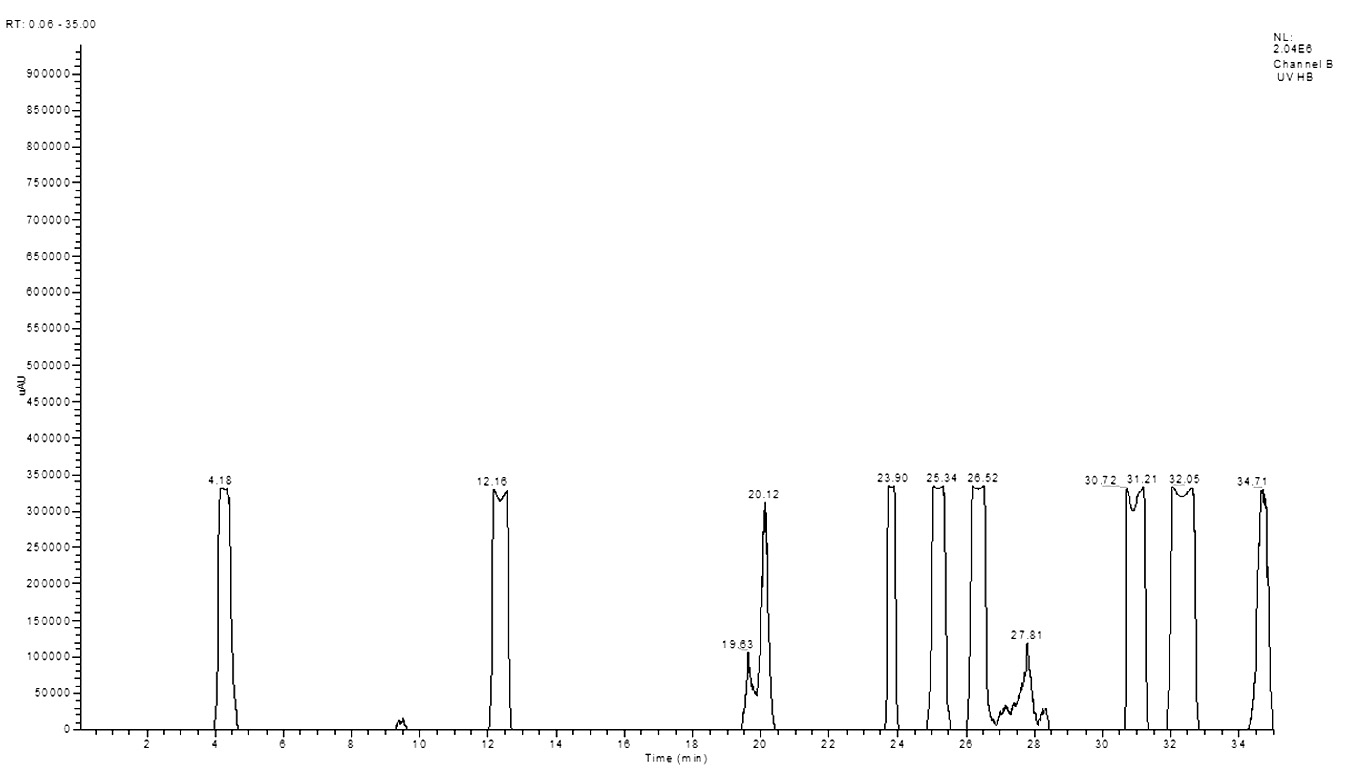
Fig. 1. Mixing spectrum of ten different metabolites.
The collision order of ten metabolites: glutamate acid→aspartic acid→glucose- 6-phosphate dipotassium salt→fructose-6-phosphate dipotassium salt→succinic acid→isocitrate→pyruvic acid→fumaric acid→citric acid→α-ketoglutarate acid.
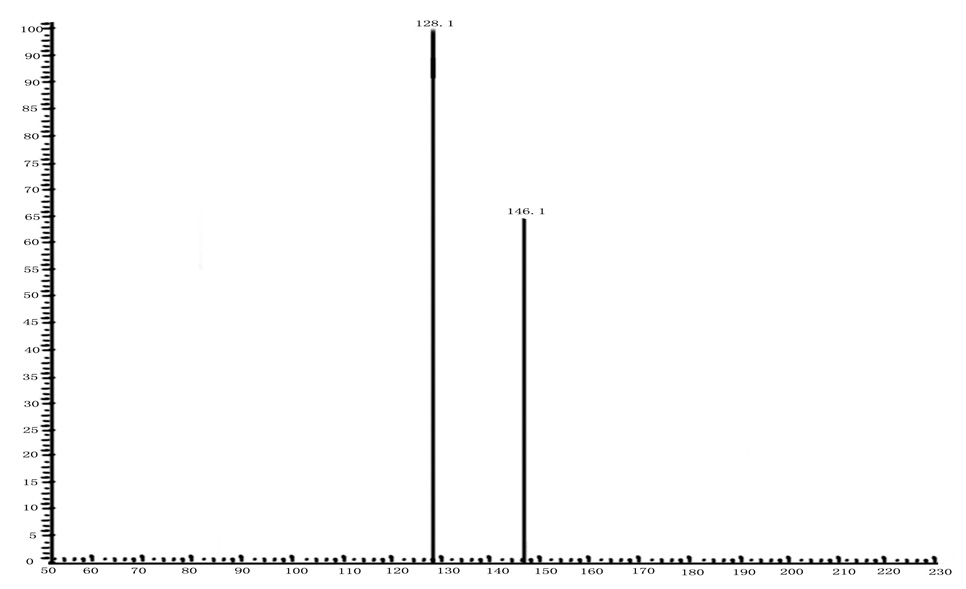
Fig. 2. Spectrum of glutamate acid with ion trap LC.
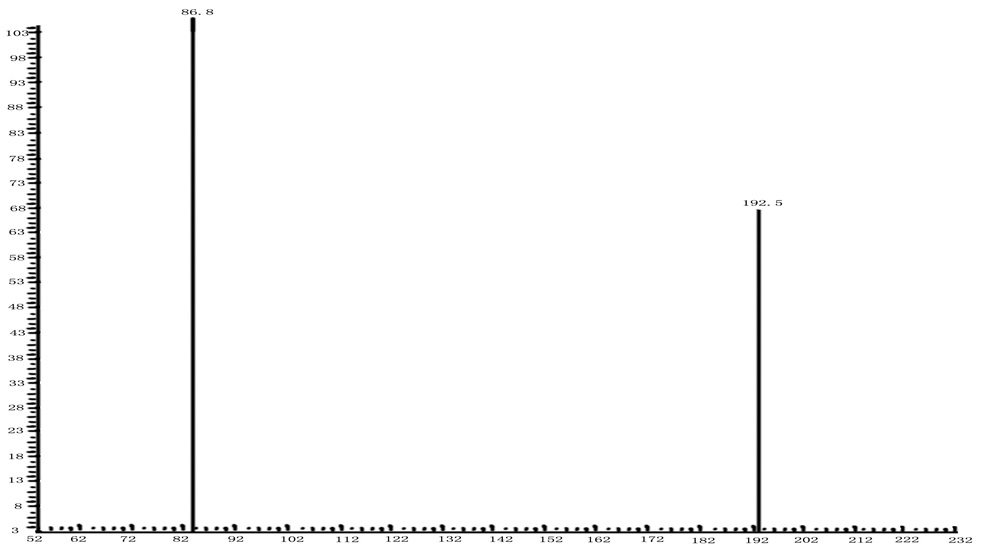
Fig. 3. Spectrum of citric acid with ion trap LC.
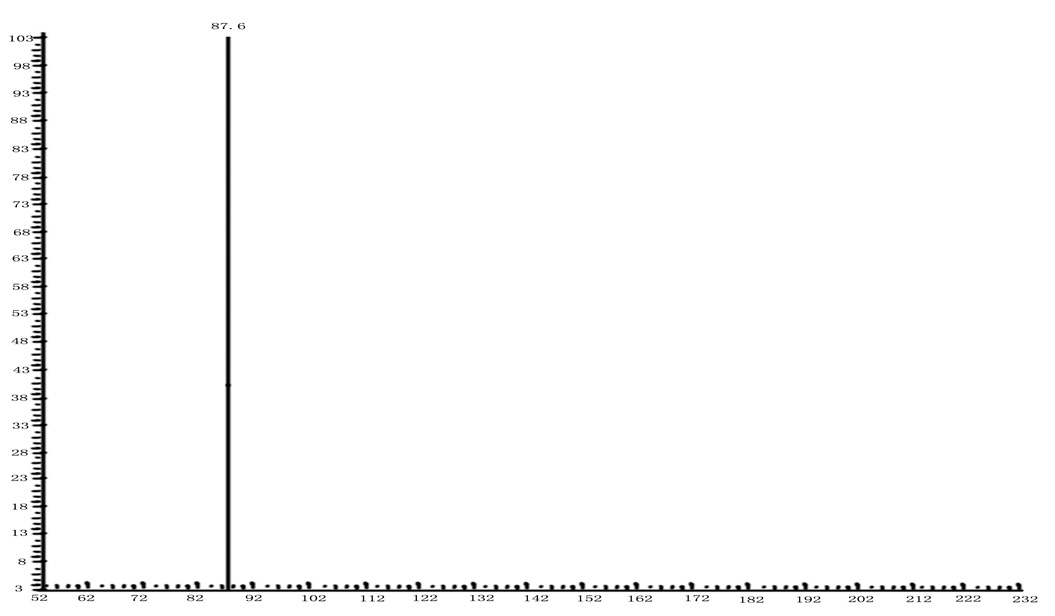
Fig. 4. Spectrum of pyruvic acid with ion trap LC.
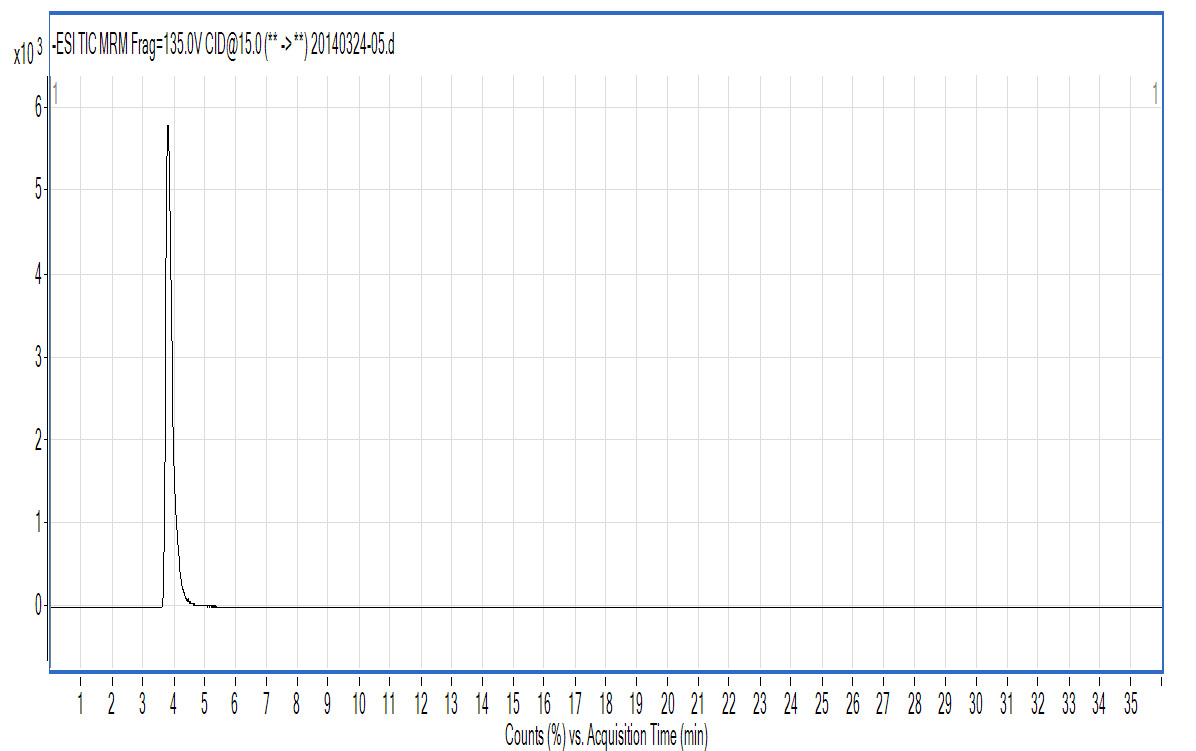
Fig. 5. Chromatogram of glutamate acid with triple quadrupole LC.
X-axis represents ion response; Y-axis represents the time respectively; ESI: electrospray ionization voltage; MRM-multistage reaction detection; Frag-collision voltage; CID-collisional dissociation voltage.
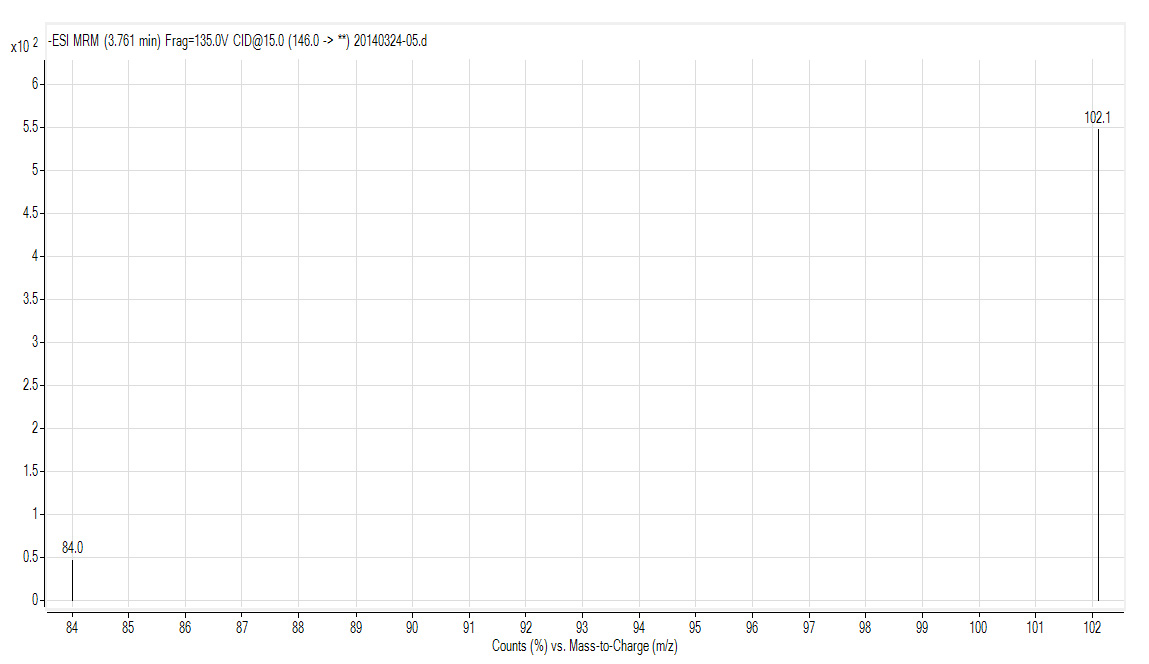
Fig. 6. Spectrum of glutamate acid with triple quadrupole LC X-axis represents mass to charge ratio; Y-axis represents ion response
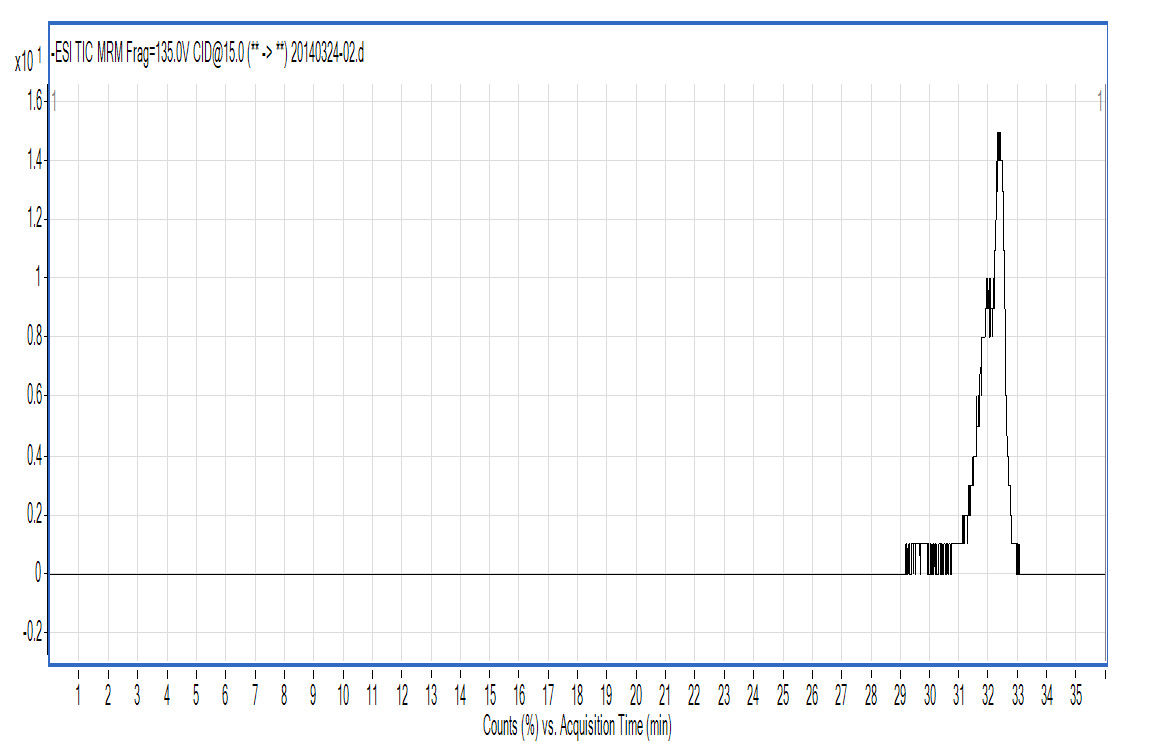
Fig. 7. Chromatogram of citric acid with triple quadrupole LC X-axis represents ion response; Y-axis represents time

Fig. 8. Spectrum of citric acid with triple quadrupole LC
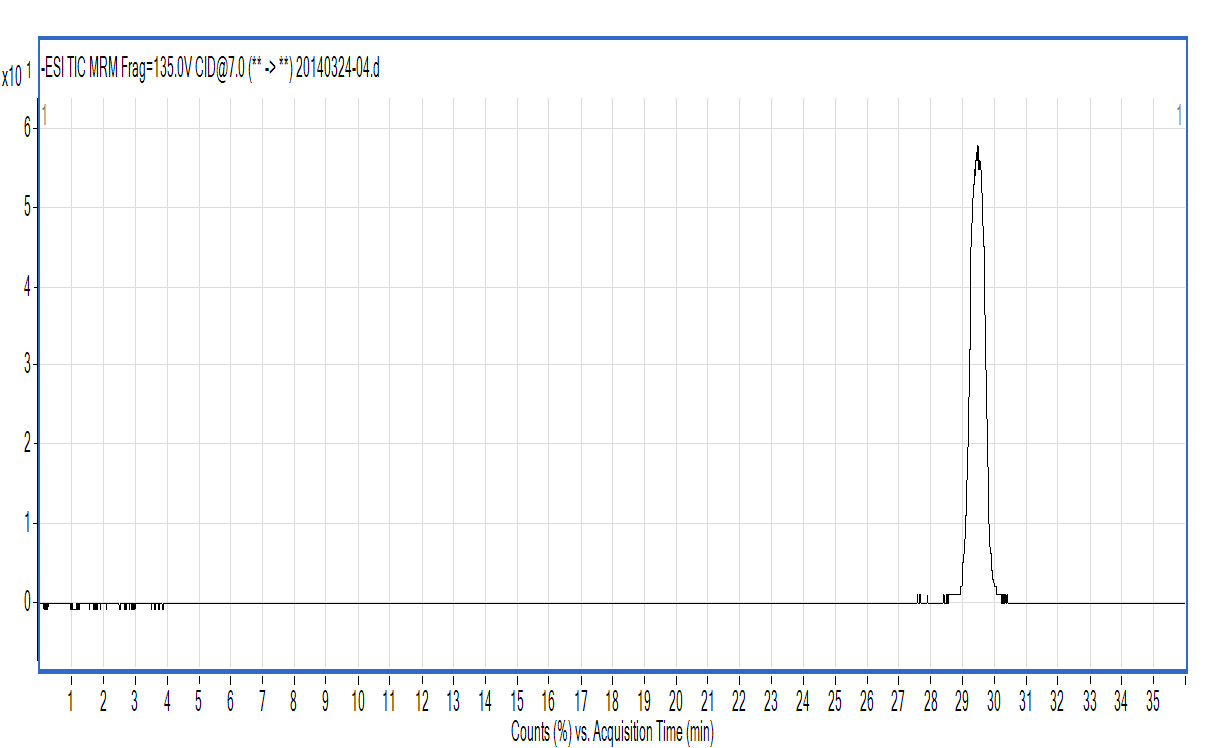
Fig. 9. Chromatogram of pyruvic acid with triple quadrupole LC
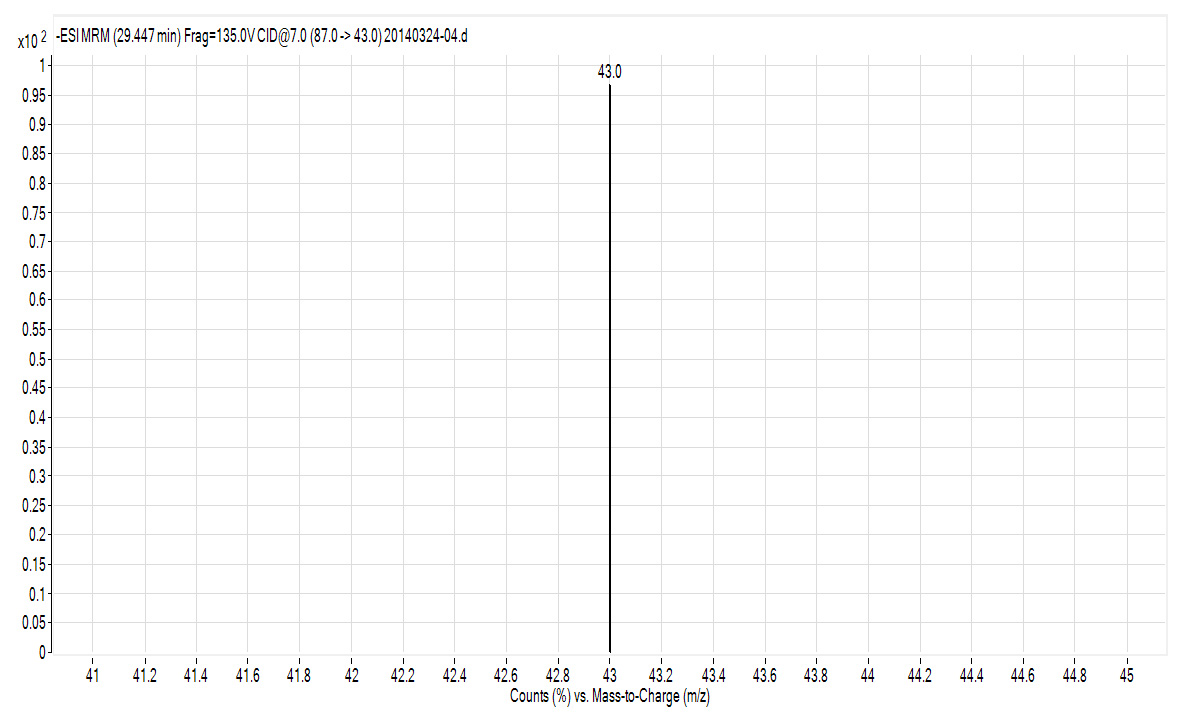
Fig. 10. Spectrum of pyruvic acid with triple quadrupole LC
Compared with Fig. 5 and Fig. 6, Fig. 1 and Fig. 2 show that only under a collision-induced voltage of -20 eV can fluid glutamate – prospective parent ion 146.1, be broken down for Sub ion and detected by an ion trap mass spectrometer. However, glutamate – prospective parent ion 146 detected by liquid chromatography triple quadrupole mass spectrometer could be broken down for Sub ion if the collision-induced voltage was -15 eV. So, the required collision-induced voltage for a Gas chromatography-ion trap mass spectrometry instrument is lower. The chromatomap illustrates the differences in the peak time. Fig. 1 (MS/MS) shows that glutamic acid appears at 4.18 min, whereas in Fig. 5 (GC-ITMS) the time to appearance is 3.76 min. This suggests that the Gas chromatography-ion trap mass spectrometry instrument can make the glutamic acid peak time earlier. From Fig. 2 it can be seen that the sub ion is 128.1 and in Fig. 6 it is 84.0 and 102.1. This suggests that MS/MS and GC-ITMS can both be used in multistage mass spectrometry, and that GC-ITMS can obtain smaller sub ions at a lower collision energy. Comparing Fig. 1 and Fig. 3 with Fig. 7 and Fig. 8, we can learn that the collision energy of breaking citrate prospective parent ion 191 in MS/MS is -25 eV and in GC-ITMS is only -15eV. Comparing the chromatograms in Fig. 1 and Fig. 7, the peak of citrate in Fig. 7 is sharper and fuller than it is in Fig. 1. Sub ion in Fig. 3 is 87.3 and in Fig. 8 is 111.0. So, the two mass spectrometry methods can both be used in a multi-stage mass spectrometry, but in contrast, GC-ITMS can get an improved peak for Citric acid detection. Comparing Fig. 1 and Fig. 4 with Fig. 9 and Fig. 10, collision energy of breaking pyruvate parent ion 87.0 is -10eV in MS/MS and is only -7eV in GC-ITMS. The pyruvate peak in Fig. 9 is sharper and more beautiful than it is in Fig. 1. and there is no broken parent ion 87.1 in Fig. 4, but in Fig. 10 sub ion we can see that 43.0 appears in the spectrum. The minimum mass set by the ion trap LC-MS instrument is 50, which means that any fragment ions below 50 cannot be detected. It is possible that the collision energy produced by Ion Trap is too small to detect pyruvate fragment ions by GC-ITMS. In that case, GC-ITMS would be a better way to detect pyruvate.
In conclusion, using GC-ITMS we can obtain smaller particle size fragment ions. Relatively speaking, detecting metabolite fragment ions by GC-ITMS is an improved method to obtain a clearer peak.
Acknowledgements
This work was supported by the Chinese National Natural Science Foundation [grants 31200626 and 31460233, 31372402); the Biology Key Subject Construction of Anhui (2014SKQJ017).
- Dunn, W.B.; Bailey, N.J.C.; Johnson, H.E. Analyst 2005; 130: 606-625.
- Kopka, J.; Fernie, A.; Weckwerth, W. Genome Biol. 2004; 5: 1- 9.
- Goodacre, R.; Vaidyanathan, S.; Dunn, W.B.; Harrigan, G. Trends Biotechnol. 2004, 22: 245-252.
- Vaidyanathan, S.; Goodacre, R. In Metabolic Profiling, Its Role in Biomarker Discovery and Gene Function Analysis. 2003; 9-38.
- Covert, M.W.; Knight, E.M.; Reed, J.L.O. Nature 2004, 429: 92-96.
- Herring, C.D.; Raghunathan, A.; Honisch, C.B.O. Nat. Genet. 2006; 38: 1406-141.
- Maharjan R.P, Ferenci T. Ahal. Biochem., 2003, 313(1):145-154.
- Faijes M, Mars A E, Staid E [J]. Microbial Cell Factories 2007; 6(27):1-23.
- Lange H.C, Eman M, van Zuijlen G, Visser D, van Dam J. C, Frank J, Teixeira de Mattos M. J, Heijnen J. [J]. Biotechnol. Bioeng., 2001; 75(4): 406-415.
- Smith DJ, Appleton ML, Carlson JR, et al. Identification of ²-glucuronidase-resistant diastereomeric glucuronides of 3-hydroxy-3-methyloxindole formed during 3- methylindole metabolism in goats. Drug MetabDispos, 1996; 24: 119
- Pihlstrom T; Blomkvst G; Friman P; Pagard U; Osterdahl B.G.; Analysis of pesticide residues in fruit and vegetables with ethyl acetate extraction using gas and liquid chromatography with tandem mass spectrometric detection[J]. Anal Bioanal Chem, 2007; 389(6): 1773-1789.
- Velic I, Metzler M, Hege HG, et al. Separation and identification of phase I and phase II[14C]-antipyrine metabolites in rat and dog urine[J].Chromatogr B,1995, 666:139.
- Wang D W, Liuz Q, Guomq, et al.[J]. Journal of Mass Spectrometry, 2004, 39(11): 1356-1365.
- Bell J G, Dick J R, Strachan F, et u1. Complete replacement of fish oil with a blend of vegetable oils affects dioxin, dioxin-like polychlorinated biphenyls (PCBs) and polybrominated diphenyl ethers(PBDEs) in 3 Atlantic salmon(Salmo salar) families differing in flesh adiposity[J]. Aquaculture, 2012, 324, 325;118-126.
- Li C Y,Tsai S I, Damuag, et al.[J].Journal of Pharmaceutical and Biomedical and Biomedical Analysis, 2009; 49(5): 1272-1276.
© The Author(s) 2018. Open Access. This article is distributed under the terms of the Creative Commons Attribution 4.0 International License which permits unrestricted use, sharing, distribution, and reproduction in any medium, provided you give appropriate credit to the original author(s) and the source, provide a link to the Creative Commons license, and indicate if changes were made.