

ISSN: 0973-7510
E-ISSN: 2581-690X
The practical application of the reverse transcription loop-mediated isothermal amplification (RT-LAMP) technique has been confirmed in diagnosing different viral infections. Nevertheless, its accuracy in identifying SARS-CoV-2, particularly in practical clinical situations, has not been thoroughly investigated. This study aims to investigate the sensitivity and specificity of the Elva Diagnostic SARS-CoV-2 Saliva Nucleic Acid Test Kit, utilizing the RT-LAMP and Rapid Antigen Test (RAT) methods for in vitro diagnostic testing, compared to the real-time quantitative polymerase chain reaction (RT-qPCR) method throughout the progression of COVID-19. Method: This study employed an analytical observational diagnostic test at Dr. Soetomo Regional Public Hospital, Surabaya, from March 2022 to May 2022. This research involved 54 samples of saliva and nasopharyngeal swabs obtained from 36 patients confirmed positive for COVID-19 and 18 samples from subjects not confirmed to have COVID-19, tested using the RT-qPCR method. The diagnostic performance of both the RT-LAMP and RAT methods was assessed by calculating their sensitivity and specificity in comparison to RT-qPCR, beginning from the time the patient was confirmed positive for COVID-19. The suitability of each method was analyzed using Cohen’s kappa. The nucleocapsid (N) protein gene from SARS-CoV-2 RNA was detected with RT-LAMP and RAT test kits which showed incompatibilities with the RT-qPCR method (p value 0.308). The positive and negative results with the RT-LAMP and RAT method examinations were similar in number compared to the RT-qPCR method, where the positive results in the RT-LAMP and RAT methods were 2 subjects and the negative results were 52 subjects. Based on the results, only 2 confirmed cases had positive results with RT-LAMP and RAT, which means the sensitivity of both tests is only 5.5% and both are poor screening tests for patients suspected of having COVID-19. In addition, the specificity of RT-qPCR as the gold standard examination method for diagnosing COVID-19 cannot be replaced by the RT-LAMP and RAT methods.
COVID-19, RT-qPCR, RT-LAMP, Rapid Antigen Test, Sensitivity, Specificity
The global impact of the COVID-19 pandemic, stemming from the Severe Acute Respiratory Syndrome Coronavirus 2 (SARS-CoV-2), has affected numerous nations. The initial outbreak emerged in late 2019 within Wuhan City, Hubei Province, China. Later, on March 11, 2020, the World Health Organization (WHO) designated it as a pandemic.1 According to a WHO report unveiled on March 21, 2021, there were 122,524,424 verified cases and 2,703,620 fatalities, yielding a Case Fatality Rate of 2.20%. The condition has led to unprecedented economic, social, and health repercussions.2,3 Numerous strategies have been put into action to combat the COVID-19 pandemic, focusing on treatment and prevention by adhering to health protocols. Additionally, rapid and accurate patient identification through versatile diagnostic methods is deemed crucial in managing COVID-19, facilitating timely supportive therapy and isolation to curtail the virus’s spread.4-6
The SARS-CoV-2 virus possesses an enveloped, non-segmented positive-sense RNA genome, featuring several structural proteins, namely nucleocapsid (N), membrane (M), envelope (E), and spike (S). Notably, proteins S and N elicit immunogenic responses. Protein S comprises S1 and S2 subunits. The S1 subunit further divides into a receptor-binding domain (RBD) and a N-terminal domain (NTD) and plays a role in binding the virus using the RBD. When facilitated by angiotensin-converting enzyme-2 (hACE2), it displays a strong affinity for the ACE2 receptor found on the surface of human host cells.7,8
At present, the established benchmark for COVID-19 testing revolves around the identification of SARS-CoV-2 RNA through the reverse-transcriptase quantitative polymerase chain reaction (RT-qPCR) swab procedure. This method relies on samples obtained from the lower respiratory tract and is renowned for its relatively heightened sensitivity. Nevertheless, it presents certain limitations such as substantial expenses, the necessity for highly skilled laboratory personnel, and a protracted testing turnaround time.9 Furthermore, it is worth noting that the sensitivity of RT-qPCR testing using specimens obtained from the upper respiratory tract, including pharyngeal swabs (ranging from 32% to 61%) and nasopharyngeal swabs (ranging from 63% to 73%), tends to be lower when compared to specimens gathered from the lower respiratory tract, where sensitivity is higher (ranging from 72% to 93% for sputum and 93% to 100% for bronchoalveolar lavage fluid).10
The immunochromatography method underlies the SARS-CoV-2 Rapid Antigen Test (RAT) Kit, a widely utilized diagnostic tool in various countries, including Indonesia. RAT kits, manufactured by reputable companies, exhibit the ability to detect lower CT values than RT-qPCR, typically in the range of > 24 to 28.11 Notably, the Standard Q RAT kit, evaluated within a healthcare facility in Thailand, demonstrated an impressive sensitivity of 98.33% and specificity of 98.73%.12 RAT offers the advantage of being a swift and uncomplicated test; however, it is susceptible to a higher rate of false negatives, primarily due to factors such as low viral load and inadequate specimen processing. This is evident from a previous report where RAT sensitivity was 68.4%.13
In recent times, significant attention has been placed on the practical application of reverse-transcription loop-mediated isothermal amplification (RT-LAMP) analysis utilizing saliva specimens. This method, designed and employed as a point-of-care test (POCT) to diagnose various viral infections, is gaining traction.14 Unlike RT-qPCR, RT-LAMP offers the benefit of gene amplification at a steady temperature, typically around 65°C. Its operational simplicity allows patients to easily self-collect saliva samples by spitting into a collection tube, thus reducing patient burden and minimizing the risk of viral exposure for healthcare staff. Furthermore, results are obtained in less than 40 minutes after the reaction, and the testing process is significantly more cost-effective, being 2.09-fold lower in cost compared to nasopharyngeal swabs.15 Numerous laboratory studies have showcased RT-LAMP’s ability to detect even minute quantities of SARS-CoV-2 RNA.16 Consequently, there is substantial promise for the implementation of RT-LAMP in SARS-CoV-2 detection. Nevertheless, the clinical applicability of saliva samples for diagnosing COVID-19 is still a matter of debate. The extent to which this method matches the diagnostic accuracy of RT-qPCR in detecting SARS-CoV-2 remains uncertain. Moreover, reported sensitivity figures exhibit considerable variability, ranging from 69.2% to 100%, with limited sample sizes and a lack of comprehensive clinical data contributing to this uncertainty.17
The primary objective of this study is to assess the diagnostic sensitivity and specificity of RT-LAMP in comparison to RT-qPCR. Additionally, the study aims to investigate the diagnostic sensitivity and specificity of RT-LAMP in comparison to the Rapid Antigen Test (RAT) for the diagnosis of COVID-19. The research employs the Elva Diagnostic SARS-CoV-2 Saliva Nucleic Acid Test Kit, utilizing the reverse-transcription loop-mediated isothermal amplification (RT-LAMP) method. This kit is specifically designed for qualitatively detecting nucleic acid from the nucleocapsid (N) gene of the SARS-CoV-2 virus, relying on observable color changes in saliva specimens collected from individuals suspected of being infected with COVID-19.18,19 The study involves the analysis of saliva specimens using the Elva Diagnostic SARS-CoV-2 Saliva Nucleic Acid Test kit and nasopharyngeal swabs using RAT. The research encompasses confirmed COVID-19 positive individuals as well as those without a confirmed COVID-19 diagnosis, with the investigations conducted at Dr. Soetomo Regional Public Hospital in Surabaya.
Time and place of research
This research adopted an analytical observational design with a cross-sectional approach. Over a period of 3 months, this research was conducted from March 2022 to May 2022, in the Central Laboratory and the Special Isolation Room 7 on the 2nd and 3rd floors of Dr. Soetomo Regional Public Hospital, Surabaya. A total of 36 samples of nasopharyngeal swabs and saliva were collected from inpatients treated in the Special Isolation Room, all of whom had been confirmed to have COVID-19 through RT-qPCR. Additionally, 18 samples were collected from individuals who had come into contact with confirmed COVID-19 patients but had not themselves received a COVID-19 confirmation through RT-qPCR. Ethical clearance for this study was granted by the Ethics Committee of Dr. Soetomo Regional Public Hospital, Surabaya, with document number 0378/KEPK/III/2022.
Sample size
The sample size formula used is the sensitivity and specificity estimation formula, as follows:
Sample formula for sensitivity estimation
n ≥ Z21-α/2 Sens (1 – Sens) / d2 x Prev
Description
Z 1-α/2 (Confidence value on a 90% normal curve) = 1,64
Sens = 0,788
Prev = 0,121
d (error estimate) = 0,3
Sample formula for specificity estimation
n ≥ Z21-α/2 Spec (1 – Spec) / d2 x (1 – Spec)
Description
Z 1-α/2 (Confidence value on a 95% normal curve) = 1,96
Spec = 0,989
Prev = 0,121
d (error estimate) = 0,1
Based on this formula, the minimum sample size in this study for sensitivity estimation is 50 samples, and for specificity estimation, it is 42 samples.
The sample criteria included patients who were both confirmed and not confirmed for COVID-19 using RT-qPCR at Dr. Soetomo Regional Public Hospital, presenting either no symptoms or mild to moderate clinical symptoms, aged between 17-60 years, and both men and women who had direct contact with confirmed COVID-19 patients. All individuals meeting these criteria willingly participated in the research by signing an informed consent form. Participants who did not meet the predetermined sample criteria or experienced worsening clinical symptoms during the study were excluded. The total number of research samples collected was 54. The sampling approach followed a consecutive method, involving individuals who were previously confirmed for COVID-19 and those not confirmed but had contact with confirmed COVID-19 cases, and were under treatment in the central laboratory and Special Isolation Room located on the 2nd and 3rd floors of Dr. Soetomo Regional Public Hospital in Surabaya, while meeting the defined inclusion criteria.
Then participants took nasopharyngeal swab specimens for SARS-CoV-2 antigen testing using the rapid antigen test and saliva specimens for SARS-CoV-2 nucleocapsid (N) RNA gene analysis using the Elva Diagnostic Saliva Nucleic Acid Test kit on the first, third, and fifth days. Furthermore, the results of the rapid antigen test and saliva nucleic acid test were compared with the RT-qPCR results, as shown in Figure.
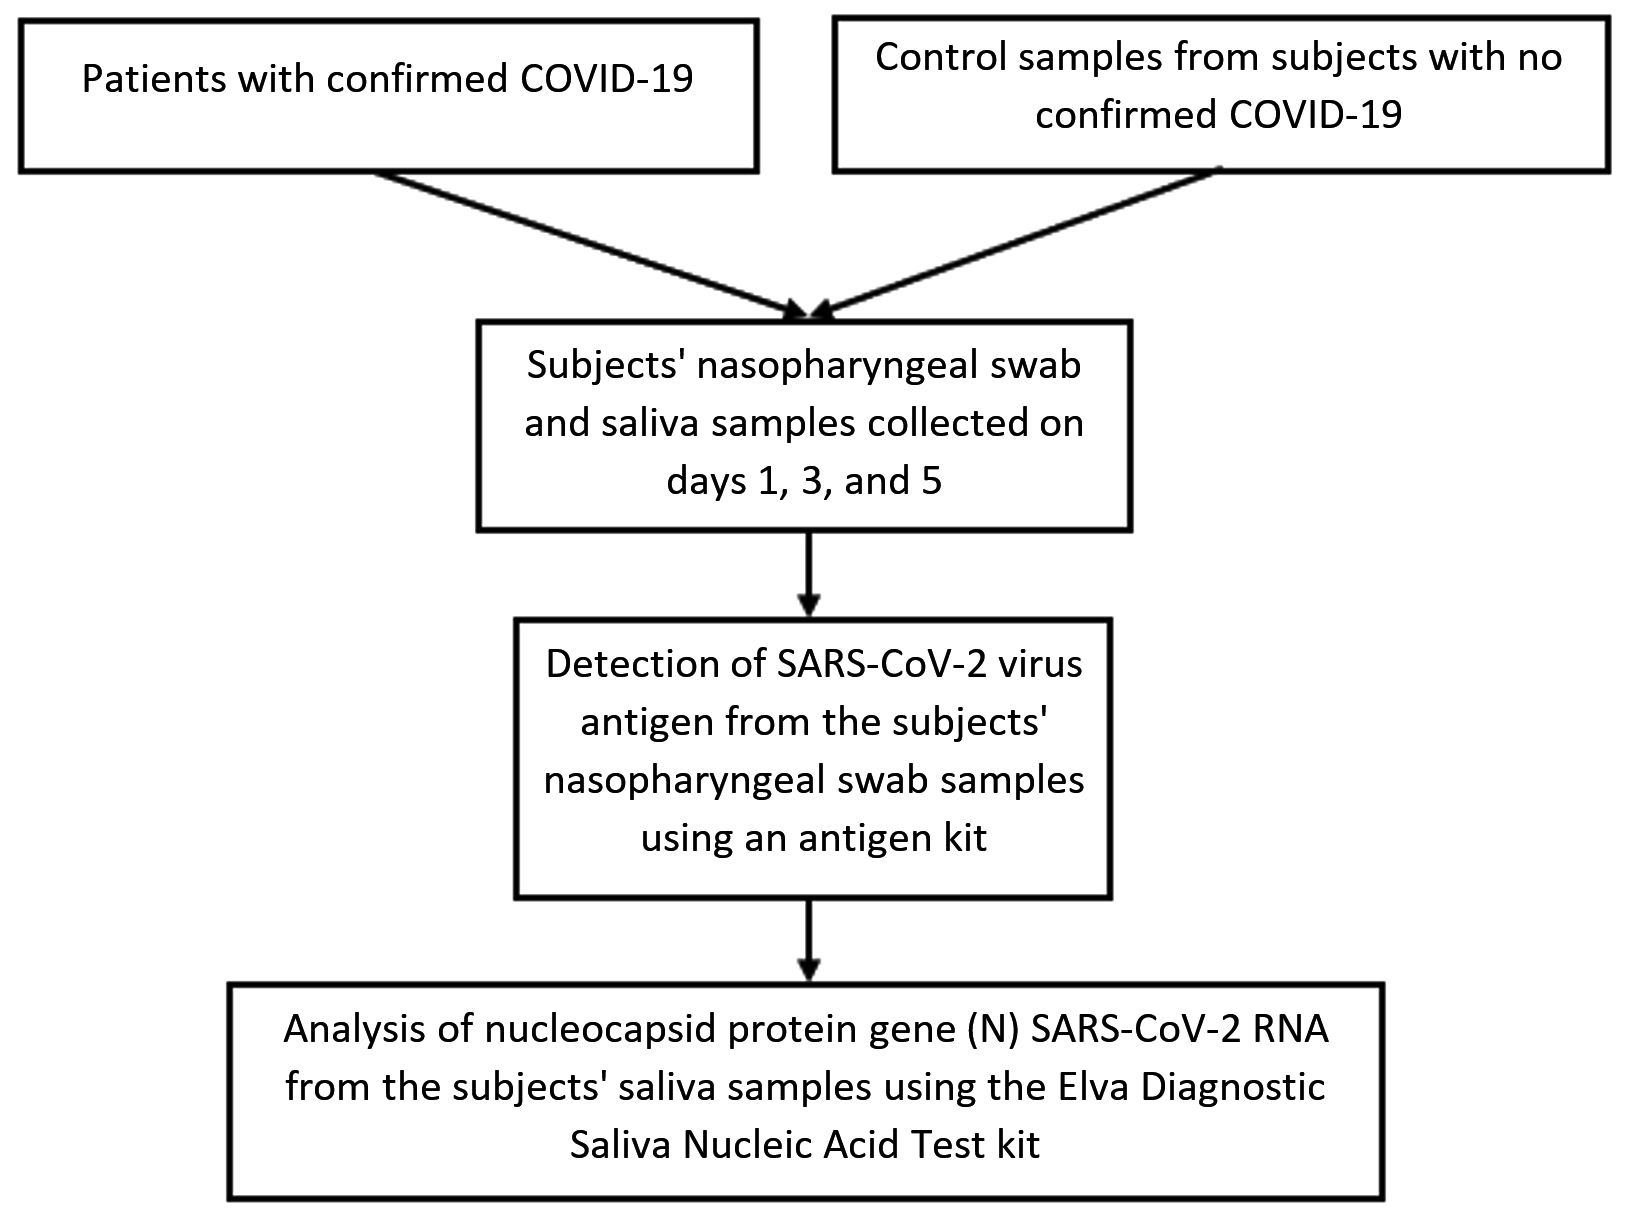
Figure. Research Flow
Research participants and sample collection
This research included participants who were previously confirmed for COVID-19 and those not confirmed but had contact with confirmed COVID-19 cases based on RT-qPCR results treated in the Special Isolation Room (RIK) on floors 2 and 3 of the central laboratory of Dr. Soetomo Regional Public Hospital, Surabaya. Nasopharyngeal swab and saliva samples were collected on the first, third, and fifth days. A nasopharyngeal swab specimen was taken. This was followed by utilizing an antigen kit at the RIK to conduct a rapid antigen test, specifically for identifying the SARS-CoV-2 antigen. Simultaneously, saliva specimens were collected using sterile containers, with research subjects instructed to self-collect their saliva by spitting into a sterile container that was leak-proof and had a screw cap, holding at least 0.5 mL and excluding air bubbles. The saliva collected was the normal saliva naturally present in the mouth, not containing phlegm, without the need for a coughing stage before specimen collection. Participants were advised to abstain from drinking water for at least 10 minutes before specimen collection. Additionally, they were instructed to avoid other beverages, food, and nasal sprays for at least 30 minutes prior to specimen collection18. Subsequently, the specimens were transported to the Clinical Pathology laboratory unit of Dr. Soetomo Regional Public Hospital, Surabaya, utilizing an ice pack for assessing the nucleocapsid (N) protein gene from SARS-CoV-2 RNA.
Detection of SARS-CoV-2 Virus antigens using Rapid Antigen Test (RAT)
The Rapid Antigen Test (RAT) was conducted employing the NewLungene rapid test kit, which is manufactured by PT Taishan Alkes Indonesia. The test procedure strictly adhered to the manufacturer’s provided guidelines. To outline the process briefly, the samples were obtained via a nasopharyngeal swab and then placed into a kit tube that had previously been filled with buffer solution. The contents were thoroughly homogenized to ensure proper mixing. Subsequently, 3-5 drops of the homogenized solution were dispensed into the designated sample port of the antigen test. The test results were then interpreted after an incubation period of 15 minutes. A positive result was indicated by the occurrence of two red lines, appearing on both the result and control lines. Conversely, a negative result was determined if only one red line was visible on the control line.20
Detection of viral RNA using RT-LAMP device
For each sample, two LAMP mixtures were meticulously prepared: IC LAMP Mix and Gen N LAMP Mix. The process for preparing IC LAMP Mix commenced by ensuring all reagents were in a liquid state, followed by thorough vortexing of the entire IC LAMP Mix. Subsequently, 21 µL aliquots of this mixture were carefully dispensed into respective PCR tubes. Then, to each PCR tube containing IC LAMP Mix, 7 µL of RNA, 7 µL of Internal Control, and 7 µL of Negative control were added, in sequence. The contents were gently vortexed after each addition. Following the addition of the sample, the color of the reaction mixture was observed. This was succeeded by an incubation step at 65°C for a duration of 37 minutes.18
In preparing the Gen N LAMP Mix, the reagents were first liquefied, and the entire Gen N LAMP Mix was thoroughly vortexed. Then, 21 µL aliquots were meticulously dispensed into each PCR tube. Following this, 7 µL of RNA was added to each PCR tube containing the Gen N LAMP Mix, and the contents were gently vortexed. The reaction mixture’s color change was observed after the sample addition. Subsequently, incubation at 65°C for precisely 37 minutes was carried out. Result interpretation was based on the final color observed; samples containing SARS-CoV-2 RNA exhibited a distinct yellow color, while samples lacking SARS-CoV-2 RNA maintained their original color, typically pink or pinkish.18
Statistical analysis
The data was statistically analyzed using the SPSS software. The sample size was calculated based on testing the estimated sensitivity and specificity of the diagnostic method. Descriptive statistical methods were applied for data analysis. Mean and standard deviation were utilized to describe quantitative variables, while frequencies and percentages were employed to present qualitative variables in tabular format. Diagnostic validation was assessed through the Kappa test, and an array of metrics including diagnostic accuracy, negative predictive value, positive predictive value, specificity, and sensitivity were computed.
The analytical performance characteristics, including the sensitivity and specificity of RT-LAMP compared to RT- qPCR, and the sensitivity and specificity of RAT compared to RT-qPCR, were calculated along with 95% confidence intervals (CI).21 To measure the agreement with RT-PCR, RT-LAMP, and RAT methods, Cohen’s kappa (k) was computed. In this evaluation, a k value below 0.40 suggests a weak goodness-of-fit correlation, a k value 0.41-0.60 represents a good fit, and a k value above 0.60 indicates a strong fit. Statistical significance was set at a p-value less than 0.05.
Afterward, the Shapiro-Wilk test was performed for the normality test, and data were deemed normal if the significance value was > 0.05. If the data did not follow a normal distribution, the Mann-Whitney test was employed for comparing the two groups (positive and negative) in RT-LAMP against the CT values of ORF 1ab, Gene E, and Gene N. The data were expressed in the form of values, and significance was determined if the Mann-Whitney test result yielded a significance value less than 0.05.
Patient demographics
The diagnostic testing using RT-LAMP Saliva was conducted on research subjects who had undergone the gold standard examination, utilizing both RAT and RT-qPCR for SARS-CoV-2. The samples for this study consisted of 54 subjects divided into two categories: COVID-19 and non-COVID-19 patients.
In Table 1, it is noted that the specimens are divided into 36 samples and 18 samples from COVID-19 and non-COVID-19 patients, respectively, according to the RT-qPCR results. According to gender, the majority of COVID-19 patients are male (21 individuals), and a significant number (16 individuals) falls within the age bracket of 50 to 60 years. In contrast, for non-COVID-19 patients, there is an equal distribution between male and female patients, each totaling nine individuals, with 11 individuals falling within the age range of 31 to 40 years. Among the COVID-19 patients, the majority have unknown CT values (18 individuals), followed by more than 30 CT values (16 individuals) and less than 25 CT values (2 individuals).
Table (1):
Sample Distribution Based on Demographic Characteristics
| Profile | COVID-19 | Non-COVID-19 | p-value | ||
|---|---|---|---|---|---|
| frequency | % | frequency | % | ||
| Sex | |||||
| Male | 21 | 38.9 | 9 | 16.7 | 0.565 |
| Female | 15 | 27.7 | 9 | 16.7 | |
| Age | |||||
| 17–30 years | 10 | 18.5 | 6 | 11.1 | |
| 31–40 years | 3 | 5.5 | 11 | 20.4 | 0.000 |
| 41–50 years | 7 | 13 | 1 | 1.9 | |
| 51–60 years | 16 | 29.6 | – | – | |
| CT value of the N gene according to the RT-PCR results | |||||
| > 30 | 16 | 44.4 | – | – | |
| 25–30 | – | – | – | – | |
| < 25 | 2 | 5.6 | – | – | |
| Unknown | 18 | 50 | – | – | |
Source: Processed data (2022)
Frequency & descriptive data
Diverse patterns in COVID-19 occurrence were identified based on the results from the RT-qPCR examination of both nasopharyngeal swab and saliva specimens.
Positive results were obtained from 36 out of 54 research subjects (66.7%) in the RT-qPCR examination, while negative results were observed in 18 out of 54 subjects (33.3%) (Table 2).
Table (2):
RT-qPCR Validation Results
| Frequency | Percentage | Valid Percentage | Cumulative Percentage | ||
|---|---|---|---|---|---|
| Valid | Positive | 36 | 66.7 | 66.7 | 66.7 |
| Negative | 18 | 33.3 | 33.3 | 100.0 | |
| Total | 54 | 100.0 | 100.0 | ||
Positive results with the RAT examination were observed in 2 out of 54 research subjects (3.7%), while negative results were noted in 52 out of 54 subjects (96.3%) (Table 3).
Table (3):
Rapid Antigen Test (RAT) Validation Results
| Frequency | Percentage | Valid Percentage | Cumulative Percentage | ||
|---|---|---|---|---|---|
| Valid | Positive | 2 | 3.7 | 3.7 | 3.7 |
| Negative | 52 | 96.3 | 96.3 | 100.0 | |
| Total | 54 | 100.0 | 100.0 | ||
Positive results with the RT-LAMP Saliva examination were found in 2 out of 54 research subjects (3.7%), and negative results were found in 52 out of 54 subjects (96.3%) (Table 4).
Table (4):
Saliva RT-LAMP Validation Results
| Frequency | Percentage | Valid Percentage | Cumulative Percentage | ||
|---|---|---|---|---|---|
| Valid | Positive | 2 | 3.7 | 3.7 | 3.7 |
| Negative | 52 | 96.3 | 96.3 | 100.0 | |
| Total | 54 | 100.0 | 100.0 | ||
In the RT-qPCR examination, it was observed that 24 research subjects had a Cycle Threshold (CT) value for the open reading frame (ORF) 1ab with a mean of 31.6875 ± 4.27848. Furthermore, 23 research subjects exhibited a CT value for the envelope protein gene (E) with a mean of 35.2391 ± 4.72549. Additionally, 20 research subjects showed a CT value for the nucleocapsid (N) protein gene with a mean of 34.3990 ± 4.26616 (Table 5).
Table (5):
CT Value of Positive Results for COVID-19 Patients using the RT-qPCR method
| CT value | |||
|---|---|---|---|
| ORF 1ab | E gene | N gene | |
| N | 24 | 23 | 20 |
| Minimum | 17.97 | 20.43 | 22.03 |
| Maximum | 35.32 | 39.60 | 38.50 |
| Mean | 31.6875 | 35.2391 | 34.3990 |
| Median | 32.5550 | 36.2000 | 35.6950 |
| Std. Deviation | 4.27848 | 4.72549 | 4.26616 |
Based on the results obtained from the RT-qPCR method, it was observed that the CT value of the N gene in individuals who tested positive using the RT-LAMP and RAT methods had a mean value of 23.2 ± 1.66. Conversely, in individuals with negative results in both the RT-LAMP and RAT methods, the CT value of the N gene was found to have a mean of 35.64 ± 1.95. To assess the normality of the data, the Shapiro-Wilk test was conducted. The CT value of the N gene resulted in a p-value of 0.000 (p < 0.05), meaning that the data deviated from normal distribution (Table 6).
Table (6):
CT Value of the Nucleocapsid (N) Protein Gene in the RT-LAMP and RAT Methods
RT-LAMP and RAT |
N |
Minimum |
Maximum |
Mean |
Median |
Std. Deviation |
p-value |
|---|---|---|---|---|---|---|---|
Positive |
2 |
22.03 |
24.38 |
23.2050 |
23.2050 |
1.66170 |
|
Negative |
18 |
31.88 |
38.50 |
35.6428 |
35.8750 |
1.94912 |
|
Total |
20 |
22.03 |
38.50 |
34.3990 |
35.6950 |
4.26616 |
0.000 |
*Data considered normal if the p-value is > 0.05
To analyze the CT value of the N gene using the RT-LAMP and RAT methods, the Mann-Whitney test was utilized, yielding a p-value of 0.023 (p < 0.05). This result implies a substantial difference in the CT value of the N gene between the RT-LAMP and RAT methods (Table 7). To summarize, patients with positive RT-LAMP and RAT results exhibited a mean CT value of the N gene at 23.2 ± 1.66, whereas patients with negative results in both RT-LAMP and RAT displayed a mean CT value of 35.64 ± 1.95. This suggests that the CT value for the N gene tends to be lower in patients with positive results using RT-LAMP and RAT compared to those with negative results in both methods.
Table (7):
Test Statistics
CT value for N gene |
|
|---|---|
Mann-Whitney U |
0.000 |
Wilcoxon W |
3.000 |
Z |
-2.268 |
p-value |
0.023 |
Exact Sig. |
0.011 |
*Significant if the p-value is < 0.05.
Analytical test
Table 8 displays the distribution of data results from 54 samples tested using the RT-LAMP and RT-qPCR methods. In the cross-tabulation, it was found that two research subjects (3.7%) had positive outcomes from the RT-LAMP and RT-qPCR methods. Negative results on RT-LAMP and positive results on RT-qPCR were 34 subjects (63%), while no positive results on RT-LAMP and negative results on RT-qPCR, as well as negative results on RT-LAMP and RT-qPCR, were 18 subjects (33.3%).
Table (8):
Correlation between RT-LAMP Saliva and RT-qPCR Methods for SARS-CoV-2 Detection
| RT-LAMP result | No. of samples with RT- qPCR result | Sensitivity (95% CI) | Specificity (95% CI) | p-value | ||
|---|---|---|---|---|---|---|
| Positive | Negative | Total | ||||
| Positive Negative Total |
2 34 36 |
0 18 18 |
2 52 54 |
100 (15.8–100.0) |
34.615 (21.9–49.1) |
0.308 |
*Statistically significant if the p-value is < 0.05
The sensitivity of the RT-LAMP method to RT- qPCR was 100% [with a 95% confidence interval (CI) of 15.811–100%], and the specificity was 34.615% (95% CI, 21.966-49.086%). The Cohen’s Kappa (k) statistic, reflecting the degree of agreement between the RT-LAMP and RT-qPCR methods, resulted in a p-value of 0.308. This suggests that the similarity of these two methods is not statistically significant (Table 8).
An overview of the distribution of data from the 54 samples tested using the RAT and RT-qPCR methods is shown in Table 9. In the cross-tabulation, it was found that two research subjects had positive results for both the RAT and RT-qPCR methods (3.7%), negative results on RAT and positive results on RT-qPCR were 34 subjects (63%), while no positive results on RAT and negative results on RT-qPCR, as well as negative results on RAT and RT-qPCR, were 18 subjects (33.3%).
Table (9):
Correlation between RAT and RT-qPCR Methods for SARS-CoV-2 Detection
| RAT result | No. of samples with RT-qPCR result | Sensitivity (95% CI) | Specificity (95% CI) | p-value | ||
|---|---|---|---|---|---|---|
| Positive | Negative | Total | ||||
| Positive Negative Total |
2 34 36 |
0 18 18 |
2 52 54 |
100 (15.8–100.0) | 34.615 (21.9–49.1) | 0.308 |
*Statistically significant if the p-value is < 0.05
The sensitivity results of the RAT method compared to RT-qPCR were 100% [95% confidence interval (CI) 15.811%-100%], and the specificity was 34.615% (95% CI, 21.966-49.086%). The Kappa (k) statistic, reflecting the degree of agreement between The RAT and RT-qPCR methods resulted in a p-value of 0.308. This suggests that the similarity of these two methods is not statistically significant. (Table 9).
Swift and accurate identification of infections plays a pivotal role in the battle against the COVID-19 pandemic.22 Hence, there is an urgent necessity for a rapid, uncomplicated, and dependable method, especially in large-scale testing initiatives, to expedite disease screening and surveillance. The Reverse-Transcription Loop-Mediated Isothermal Amplification (RT-LAMP) method emerges as a promising approach, offering the potential for swift, precise, and user-friendly diagnostics. However, it is important to recognize that the effectiveness of RT-LAMP relies on several factors, including the quality of reagents, primer design, and the selection of SARS-CoV-2 target genes for detection.23 One particular RT-LAMP method under scrutiny is the Elva Diagnostic SARS-CoV-2 Saliva Nucleic Acid Test Kit. It is worth noting that the reliability of the RT-LAMP method can significantly influence the rates of false positives and false negatives, as demonstrated in the study conducted by Freire-Paspuel and Garcia-Bereguiain.24 Therefore, it is imperative to conduct a comprehensive assessment of the clinical performance of the Elva Diagnostic SARS-CoV-2 Saliva Nucleic Acid Test Kit. This test kit was developed by an Indonesian startup, PT. Enseval Medika, which serves as the sole distributor. The kit employs a colorimetric RT-LAMP approach, which is not only cost-effective but also allows for result interpretation by monitoring the color shift from pink to yellow, typically occurring within a 40-minute timeframe after the reaction initiation. The introduction of this kit to the in vitro diagnostic market has the potential to address issues related to delays in reagent supply and the elevated costs associated with RT-qPCR tests, thus highlighting the feasibility of adopting the Elva Diagnostic SARS-CoV-2 Saliva Nucleic Acid Test Kit.18
Utilizing the reverse-transcription loop-mediated isothermal amplification (RT-LAMP) method, the Elva Diagnostic SARS-CoV-2 Saliva Nucleic Acid Test Kit amplifies SARS-CoV-2 nucleic acid, subsequently allowing for qualitative detection through colorimetry. Specific primers in the kit are designed to target the nucleocapsid (N) gene region of SARS-CoV-2 RNA. Additionally, it includes a primer set for the Internal Control, which targets the human RNAse P gene region. Each primer set consists of six primer strands designed to recognize specific regions of viral RNA or human DNA. The nucleic acid is extracted from diluted saliva specimens through the lysis of viral particles and human cells via heat treatment. The resulting RNA or DNA is then mixed with the RT-LAMP reagent. Qualitative interpretation of the test results hinges on the color shift occurring during the final reaction stage, indicating the presence of the nucleocapsid (N) protein gene sequence of the targeted SARS-CoV-2 RNA in the sample.18 A presence of SARS-CoV-2 is denoted by a positive result, while the absence of genetic material from SARS-CoV-2 in the collected sample is indicated by a negative result. It is important to highlight that patient management decisions should not solely rely on these results. In cases where clinical symptoms and epidemiological information do not align with the test results, further examination is strongly recommended.25
In this study, the performance of the colorimetric RT-LAMP and RAT kits was validated against RT-qPCR, aiming to establish these methods potential as an alternative diagnostic or screening tool for detecting COVID-19 in clinical settings. The overall sensitivity and specificity of RT-LAMP compared to RT-qPCR were 100% and 34.615%, respectively; while the overall sensitivity and specificity of RAT against RT-qPCR were 100% and 34.615%, respectively. The findings of this study reveal certain inconsistencies with previous RT-LAMP studies that reported a sensitivity range of 70% to 90% and a specificity range of 99% to 100%.26 The number of positive cases among the tested samples likely explains the high sensitivity of RT-LAMP when compared to RT-qPCR, achieving 100% sensitivity. Apart from sample quantity, the sensitivity and specificity of the RT-LAMP colorimetric test are influenced by various factors, including the detection limit, specimen type, sample quality, viral RNA levels in the sample, specimen collection time, and processing procedures. The presence of patient matrix in clinical samples can reduce the detection rate of RT-LAMP assays.14 Moreover, inadequate saliva collection, resulting in low viral loads, can affect sensitivity even when samples are collected during the early stages of infection.27 Additionally, elution buffer with a pH > 8 during the RNA purification step can interfere with the color change in the RT-LAMP reaction, leading to misinterpretations.26
This study has revealed that among the total of 54 samples subjected to examination via RT-qPCR, RAT, and RT-LAMP methods, The samples tested positive and negative by the RT-LAMP and RAT methods were equal in number compared to the RT-qPCR method. This shows that based on the results of only 2 confirmed cases that have positive results with RT-LAMP and RAT, the sensitivity of both tests is only 5.5%, and both are poor screening tests for detecting patients suspected of having COVID-19. Besides, the specificity of RT-qPCR as a gold standard examination method for diagnosing COVID-19 also cannot be replaced by RT-LAMP and RAT methods. Notably, the RT-LAMP test offers the advantage of being three times quicker and more cost-effective than the gold standard RT-qPCR, thus contributing to the reduction of time and expenses associated with diagnosis. Nonetheless, these kits require the expertise of trained clinical laboratory personnel well-versed in RT-LAMP techniques and in vitro diagnostic procedures. Additionally, they necessitate laboratory equipment for RNA extraction and reaction mixture preparation steps, with personnel free from visual impairments. 14,26
Limitations
This research is subject to several limitations. To begin with, saliva specimens were collected from COVID-19 confirmed patients using RT-qPCR, at varying stages of treatment. This variability in the timing of specimen collection made it challenging to design the study, as the viral load in the specimens might have varied over time.28 Secondly, subjects in contact with confirmed COVID-19 cases who have negative PCR results as non-COVID-19. This is another source of bias as these subjects could be silent carriers with false negative test results. Third, the quality of RNA extracted from saliva specimens was not verified. In this study, RT-qPCR, RT-LAMP and RAT methods testing were performed in single duplicates per sample individually, potentially affecting the precision of the results compared to more controlled experimental environments. The study’s strength lies in the careful selection and exclusion criteria for research subjects and the three specimen collections carried out on the first, third, and fifth days, aiming to obtain valid sensitivity and specificity of the RT-LAMP method on saliva specimens during treatment.
For individuals suspected of COVID-19, based on the results of only 2 confirmed cases that had positive results with RT-LAMP and RAT, which means that the sensitivity of both tests is only 5.5% and both are poor screening tests. In addition, the specificity of RT-qPCR as the gold standard examination method for diagnosing COVID-19 is still not replaced by RT-LAMP and RAT methods. in healthcare settings like hospitals and clinics where conducting on-site RT-qPCR is not feasible, negative results obtained through RT-LAMP and RAT methods cannot definitively rule out SARS-CoV-2 infection. Therefore, negative results from the RT-LAMP and RAT methods should be validated through RT-qPCR to ensure accuracy.
ACKNOWLEDGMENTS
The authors would like to express their gratitude to Jalan Tengah, Indonesia, for their assistance in editing the manuscript.
CONFLICT OF INTEREST
The authors declare that there is no conflict of interest.
AUTHORS’ CONTRIBUTION
All authors listed have made a substantial, direct and intellectual contribution to the work, and approved it for publication.
FUNDING
This study was supported by PT Enseval Medika Prima Indonesia with grant number S498/EMP.HO/HLBE.SBY/XI-21.
DATA AVAILABILITY
All datasets generated or analyzed during this study are included in the manuscript.
ETHICS STATEMENT
This study was approved by the Ethical Committee of Dr. Soetomo Surabaya Hospital with certificate number 0378/KEPK/III/2022.
INFORMED CONSENT
Written informed consent was obtained from the participants before enrolling in the study.
- Fahmi M, Kharisma VD, Ansori ANM, Ito M. Retrieval and Investigation of Data on SARS-CoV-2 and COVID-19 Using Bioinformatics Approach. Adv Exp Med Biol. 2021;1318:839-857.
Crossref - Ansori ANM, Kharisma VD, Fadholly A, Tacharina MR, Antonius Y, Parikesit AA. Severe Acute Respiratory Syndrome Coronavirus-2 Emergence and Its Treatment with Alternative Medicines: A Review. Res J Pharm Technol. 2021;14(10):5551-1557.
Crossref - Parwanto MLE, Digambiro RA, Nusantara DU, and Rarasati T. Coronavirus disease 2019 (COVID-19): A case report in a patient with diabetic ketoacidosis and hypertension. Bali Med J. 2020;9(3):624-629.
Crossref - Wijaya RM, Hafidzhah MA, Kharisma VD, Ansori ANM, Parikesit AA. COVID-19 In Silico Drug with Zingiber officinale Natural Product Compound Library Targeting the Mpro Protein. Makara J Sci. 2021;25(3):5.
Crossref - Kadriyan H, Prasedya ES, Pieter NAL, Gaffar M, Punagi AQ, Bukhari A. The potential role of exosome on cytokine storm and treatment of severe COVID-19 infection. Bali Med J. 2020;9(3):527-533.
Crossref - Minanti BR, Soelistijo SA, Pranoto A. Characteristic profiles of patients with diabetes mellitus and COVID-19 during the second epidemic wave in East Java, Indonesia: a retrospective study. Bali Med J. 2023;12(1):1120-1126.
Crossref - Listiyani P, Kharisma VD, Ansori ANM, Widyananda MH, Probojati RT, Murtadlo AAA. In Silico Phytochemical Compounds Screening of Allium sativum Targeting the Mpro of SARS-CoV-2. Pharmacognosy Journal. 2022;14:604-609.
Crossref - Sianipar O, Intansari US, Ratnaningsih T, et al. Seroprevalence SARS-CoV-2 among the academic population of Universitas Gadjah Mada Yogyakarta. Bali Med J. 2022;11(1):382-386.
Crossref - Chen N, Zhou M, Dong X, et al. Epidemiological and clinical characteristics of 99 cases of 2019 novel coronavirus pneumonia in Wuhan, China: a descriptive study. Lancet. 2020;395:507-513.
Crossref - Corman VM, Landt O, Kaiser M, et al. Detection of 2019 novel coronavirus (2019-nCoV) by real-time RT-PCR. Euro Surveill. 2020;25(3):2000045.
Crossref - Platten M, Hoffmann D, Grosser R, et al. SARS-CoV-2, CT-Values, and Infectivity-Conclusions to Be Drawn from Side Observations. Viruses. 2021;13(8):1459.
Crossref - Chaimayo C, Kaewnaphan B, Tanlieng N, et al. Rapid SARS-CoV-2 antigen detection assay in comparison with real-time RT-PCR assay for laboratory diagnosis of COVID-19 in Thailand. Virol J. 2020;17(1):177.
Crossref - Xie JW, He Y, Zheng YW, Wang M, Lin Y, Lin LR. Diagnostic accuracy of rapid antigen test for SARS-CoV-2: A systematic review and meta-analysis of 166,943 suspected COVID-19 patients. Microbiol Res. 2022;265:127185.
Crossref - Silva SJRD, Paiva MHS, Guedes DRD, et al. Development and Validation of Reverse Transcription Loop-Mediated Isothermal Amplification (RT-LAMP) for Rapid Detection of ZIKV in Mosquito Samples from Brazil. Sci Rep. 2019;9(1):4494.
Crossref - Huang C, Wang Y, Li X, et al. Clinical features of patients infected with 2019 novel coronavirus in Wuhan, China. Lancet. 2020;395(10223):497-506.
Crossref - Ganguli A, Mostafa A, Berger J, et al. Rapid Isothermal Amplification and Portable Detection System for SARS-CoV-2. bioRxiv. 2020;108381.
Crossref - Kojima N, Turner F, Slepnev V, et al. Self-Collected Oral Fluid and Nasal Swabs Demonstrate Comparable Sensitivity to Clinician Collected Nasopharyngeal Swabs for Coronavirus Disease 2019 Detection. Clin Infect Dis. 2021;73(9):e3106-e3109.
Crossref - KalGen DNA. Elva Diagnostic SARS-CoV-2 Saliva Nucleic Acid Test Kit, 2021. https://kalgendna.co.id/ products/sars-cov-2-saliva-nucleic/
- Wijaya T, Hsieh PP, Melinda F, Suarca IK. Hypercoagulation state in infant with COVID-19: a case report. Indonesia Journal of Biomedical Science. 2022;16(1): 66-69.
Crossref - Nagura-Ikeda M, Imai K, Tabata S, et al. Clinical Evaluation of Self-Collected Saliva by Quantitative Reverse Transcription-PCR (RT-qPCR), Direct RT-qPCR, Reverse Transcription-Loop-Mediated Isothermal Amplification, and a Rapid Antigen Test To Diagnose COVID-19. J Clin Microbiol. 2020;58(9):e01438-20.
Crossref - Awwaliyah E, Hotimah H, Shimabukuro M. Clinical characteristics and mortality associated with COVID-19 in islamic hospital of Jemursari, Surabaya, Indonesia: A hospital-based retrospective cohort study. Bali Med J. 2022;11(3):1202-1206.
Crossref - Puspita RD, Sujalmo P, Agustin RP, Ari ND. Clinical findings, laboratory, and imaging features of COVID-19 patients at Universitas Gadjah Mada (UGM) Academic Hospital, Yogyakarta, Indonesia. Indonesia Journal of Biomedical Science. 2021;15(2):159-163.
Crossref - Mulyanti BN, Handoyo T, Murbawani EA, et al. Frail geriatric patient with covid-19 infection: a case report. Bali Med J. 2021;10(1):491-493.
Crossref - Freire-Paspuel B, Garcia-Bereguiain MA. Low clinical performance of the Isopollo COVID-19 detection kit (M Monitor, South Korea) for RT-LAMP SARS-CoV-2 diagnosis: A call for action against low quality products for developing countries. Int J Infect Dis. 2021;104:303-305.
Crossref - Inaba M, Higashimoto Y, Toyama Y, et al. Diagnostic accuracy of LAMP versus PCR over the course of SARS-CoV-2 infection. Int J Infect Dis. 2021;107:195-200.
Crossref - Nawattanapaiboon K, Pasomsub E, Prombun P, et al. Colorimetric reverse transcription loop-mediated isothermal amplification (RT-LAMP) as a visual diagnostic platform for the detection of the emerging coronavirus SARS-CoV-2. Analyst. 2021;146(2):471-477.
Crossref - Bhat TA, Kalathil SG, Bogner PN, Blount BC, Goniewicz ML, Thanavala YM. An Animal Model of Inhaled Vitamin E Acetate and EVALI-like Lung Injury. N Engl J Med. 2020;382(12):1175-1177.
Crossref - Leow L, Ramanathan K, Antognini D, Kofidis T, Tam J, Mithiran H. Organization of thoracic surgical services during the covid pandemic. The Surgeon, 2021;19:E1 – E8.
Crossref
© The Author(s) 2024. Open Access. This article is distributed under the terms of the Creative Commons Attribution 4.0 International License which permits unrestricted use, sharing, distribution, and reproduction in any medium, provided you give appropriate credit to the original author(s) and the source, provide a link to the Creative Commons license, and indicate if changes were made.