

ISSN: 0973-7510
E-ISSN: 2581-690X
Aim to study the whole genome of cultured and uncultured microbes present within the ant gut environment can only be determined by using the advanced technology used is Next-generation sequencing (NGS) tool. Here’ in this research’ this tool is been used to study the exact composition or population of gut microbes present in the two ants are: Carpenter ant (genus Camponotus) and Weaver ant (genus Oecophylla), by 16S/18S/ITS rDNA amplicon sequencing and comparing whether these two ants have same microbial species and same composition, if yes then what is their percentage of abundance in these ants gut and how these microbial diversity play role in these ants life cycle. And from this ant gut study, which is performed by metagenomic tools, revealed the presence of large diversity of microbes in these ant gut and are from the order and genus of bacteria commonly found are Actinomycetales, Bifidobacteriales, Actinobacteria, Bacteriodales, Flavobacteriales, Caulobacterales, Methanobacteriales, Lactobacillales, Clostridiales, Bradyrhizobacterium, Agrobacterium etc. here, the complete microbial diversity of Carpenter and Weaver ant guts are studied by performing 16S / 18S / ITS rDNA amplicon sequencing procedure, which includes, surface sterilization, dissection, culturing in basic media broth, genomic DNA extraction, quality control, rDNA variable region amplification, library construction, high-throughput sequencing, data analysis and identification of microbiome. This research is done to explore the vital functions of these microorganisms in the host (Ant) and their biotechnological applications in the environment.
Metagenomics,16s/18s/ITS rDNA identifiers, Non culturable, microbes, Microbiome, Weaver ant gut, Carpenter ant gut.
The insects are of a large group of organisms with say about 600,000 to 750,000 species though the exact population study is yet lacking due to lack of their study in unexplored areas like in tropical ecosystems has to be studied1. Insects of all groups are colonized by a hugely diverse group of microorganisms, say present in fore, mid and hindgut; these microbes present are the important part in the life cycle of insects, like as in insects host nutrition, in their physiological behavior, etc. Among these insects, the ants of order Hymenoptera and family Formicidae, have studied to have the most abundant microbiota present in their gut, but presently very little is known about their functions as microbial symbionts in ant host2. Hence, to study these microbial diversity populations present in ant gut, a very useful and advanced technology is used, the NGS (Next-generation-sequencing) technology, this shows the diversified microbiota present in ant gut. Through this previous research3, we understand that these insects of family Formicidae are continuously involved in symbiosis with sap-feeding insects4, plants5 and with microorganisms6-8, like fixing of nitrogen by recycling. Carpenter ant (Camponotus) gut is colonized by Blochmannia species, which helps in getting amino acids as nutrition to host and also fixes nitrogen in plants nutrition by urease9,10. Insect gut has a very vast diversity of symbiotic microbes (bacterial and fungal) expanded by harboring within the host gut, their mode of transmission, and gut microbiota co-evolutionary background with their insects hosts11-13. The presence of these microbiota in hosts body results in different functional behavior of the hosts, like as a act as heritable symbiosis where microbes harbored a million of years ago in aphids and these can’t survive without heritable symbiosis14. And some groups of insects completely relay on Obligate symbiosis of gut microbes where, in a long run many ancestral genes are degraded as in the sap-feeding insects, where two obligate bacterial symbiosis were found15. And effects of many Facultative endosymbionts microbes in the host life cycle has been revealed and resulted in their sensitivity towards their really enemies16-18. Which indirectly interrupts in the insects population size19,20,16. The microbial taxa present in the insects host, differs variedly based on the population size, shape, and habitat and their functional behavior21. Sometimes, the population size of microbes is very less and their taxa level contains genus level microbes, which are generally found in that particular habitat22,23. Many important functions of microbes present in these ant gut are unknown and which is a must to be explored. Thus, to understand this microbial diversity (endo and ecto-symbionts) an advanced research to explore the symbiosis between microbiota and their host insects has to be studied in depth. And this is only possible through the advanced technology Next- generation- sequencing (NGS) technology, where study on genes of important through multiplex illumine sequencing of 16SrRNA amplicons gives a perfect classification of all the endo and ecto-symbionts present. Recently, more study is been carrying on the ants (Hymenoptera: Formicidae), which are attracting researchers due to their eusocial nature. Many important functions of microbes present in these ant guts are unknown and which is a must to be explored. Here, in this research, we study the comparison of microbial diversity between these two ants, of genus Camponotus (Carpenter ant)gut and genus Oceophylla ( Weaver ant) gut, this comparison microbial diversity of ant gut can be determined and hence which also make us understand that how these diversified microbes take part in the ant lifecycle and by studying this microbial diversity between these two ants, gives a way to explore their most dominant microbes present in these ant gut and how they exactly play vital role in ants lifecycle, which indirectly aids useful applications to environment.
Sample Collection
A commonly found ants like Camponotus ants (Carpenter ants) and Oecophylla (Weaver ants), say total of 10 species of each ants were collected from surrounding areas of Biochemistry department, Karnatak University Dharwad, Karnataka, India. The collection was done in the month of July – September 2017. These collected ants each were stored in separate plastic air tight boxes with the lids holed for proper aeration. The colonies of these two ants collected were stored in -20°C for 30 min until further processing.
Sample Culture
The stored both Carpenter ants and Weaver ants in under -20° for 30 min and were then aseptically subjected to surface sterilization in laminar airflow to remove surface microbes from the ants’ external body. Materials used for surface sterilization were distilled H2O, 70% ethanol/isopropyl alcohol (strong sterilizing agent). The ants were then transferred in stopper big test tubes and washed/ treated with 70% ethanol for about 10-15 minutes by continuously shaking and later rinsed with distilled water, this step was performed 5-6 times and at least for 30-35 min. this step was repeated to assure the complete removal of the surface microbes from these two ants external surface. Once done, these washed or cleaned ants are dissected and crushed into fine paste and transferred to nutrient broth tubes aseptically and incubated at 36oc for 24hrs24-26.
DNA Extraction
Materials required: Microcentrifuge, 65°C dry bath, Vortex, Beakers, Conical flask, measuring cylinder, Distilled water, tips, micropipettes, water bath, agarose gel electrophoresis equipment, chloroform-Isoamylalcohol and Ethanol.
Methodology
DNA extraction from nutrient broth containing crushed ant gut microbial cultures was performed. Ten ant guts of same population were collected and were crushed and cultured for gut micro-biome in nutrient broth were taken in triplicates DNA extraction vials tube. To extract the DNA Chromous RKN 80-81 General KIT was followed. The kit demonstrates rapid and simple method to isolate genomic DNA from wide types of samples. The kit uses chemical method to lyse the organism cells and isolate the genomic DNA. Steps Involved in isolation includes suspension of the lyophilised cells with C-TAB followed by lysis of cell wall using salts. Precipitation of the DNA and then running the genomic DNA on Agarose gel with analysis of the results obtained. SafeTKs are available where DNA is detected without using Ethidium Bromide and UV lights.
Library Preparation
Design of PCR primers with multiplexing index and Illumina sequence adapters was done for sequencing purpose. PCR primers for amplification of V3& V4 regions of 16S rRNA gene were designed with appropriate sample barcoding index sequences and Illumina adapter sequences. Care was taken while designing these primers to allow multiplexing of samples but without allowing primer dimer formation or secondary structures that would reduce PCR efficiency. The primer sequences were used as given in Illumina protocol for 16S metagenomic DNAsequencing27, 28.
PCR Amplification
PCR amplification of target region was performed. PCR conditions were optimized for each primer set that is different only by the barcoding indices. V3& V4 regions were amplified from the DNA samples and purified using Agencourt XP beads. The library was then quantified using QUBIT dS DNA HS kit and normalized to10 nMol/l for sequencing. The library QC was done using an Agilent Bioanalyser DNA HS Chip.
Experimental workflow for 16S rDNAamplicon sequencing
16S/18S/ITS rRNA is made out of moderated and hypervariable locales. Though preserved areas are not fundamentally extraordinary crosswise over different microbial strains, the groupings of hypervariable areas are sort or species-explicit, and vary in agreement to phylogenetic contrast. In this manner, 16S/18S/ITS rDNA fill in as identifiers of organic species, and are significant for microbial phylogeny and ordered distinguishing proof.
16S/18S/ITS rDNAamplicon sequencing has turned into a significant instrument for the investigation of the creation of microbial networks in condition. 16S rDNA amplicon sequencing incorporates the library development utilizing explicit preliminaries to enhance the variable district of prokaryotic 16S rDNA and information examination of the 16S rDNA variable area grouping to recognize the creation and bounty of prokaryotic microorganisms in the earth. The restrictive work process adequately enhances the two variable areas of 16S rDNA (V3 and V4) and precisely recognizes different species including archaea. 18S/ITS rDNA amplicon sequencing incorporates the library development utilizing explicit preliminaries to enhance the variable district of eukaryotic 18S/ITS rDNA and information examination to distinguish the piece and plenitude of eukaryotic microorganisms in the earth. Illumina MiSeq sequencing stage is generally utilized for 16S/18S/ITS rDNA amplicon sequencing on account of its profound sequencing profundity, high throughput, short run-time and high sequence exactness just as sensible expense. As of late, pair-end science has empowered MiSeq sequencing stage to peruse as long as 600bp, which further expanded the precision of the results29.
16S/18S/ITS rDNA amplicon sequencing method incorporates genomic DNA extraction, quality control, rDNA variable district enhancement, library preparation, high-throughput sequencing and information examination. Every one of the means is significant for information quality and amount, which in turn influences the resulting information investigation. So as to guarantee information precision and unwavering quality, each step needs to pass severe quality control before pooling the library by altering the volume of each library as per the objective information volume for Illumina MiSeq sequencing. The work process is as mentioned underneath (Fig. 1):
![]()
Fig. 1. Microflora diversity experimental workflow.
The genome sequencing reveals the order of DNA nucleotides (the order of A, C, G and T) base pairs in genome/ organisms. The quality and quantity of the prepared libraries met the Illumina standards required for further sequencing and hence the library was further sequenced on IlluminaMiSeqplaform using 2X300 bp chemistry with generation of more than 0.5 million reads.
Workflow of 16S metagenomic data analysis
To begin with, connectors and low quality information were sifted through from the first information. At that point the delusion groupings were evacuated to acquire the compelling successions for bunch investigation. Each group was called an OTU (Operational Taxonomic Unit). The scientific classification examination of the delegate grouping of each OTU was then performed to acquire species dissemination data. In view of the after effects of OTU investigation, a-assorted variety lists of each example can be determined just as the species extravagance and uniformity. In view of ordered data, factual investigation of network structure can be completed at every arrangement level. UPGMA bunching tree and PCoA plots can be built dependent on Unifrac separation to delineate the distinctions in network structure between various examples or gatherings30.
Following the fundamental examination over, a progression of top to bottom information mining can be done. For instance, analysts can explore the diverse network structure among various gatherings of tests utilizing numerous factual techniques. This could be additionally joined with the ecological components and species decent variety to find the natural variables significant for network structure (Fig. 2).
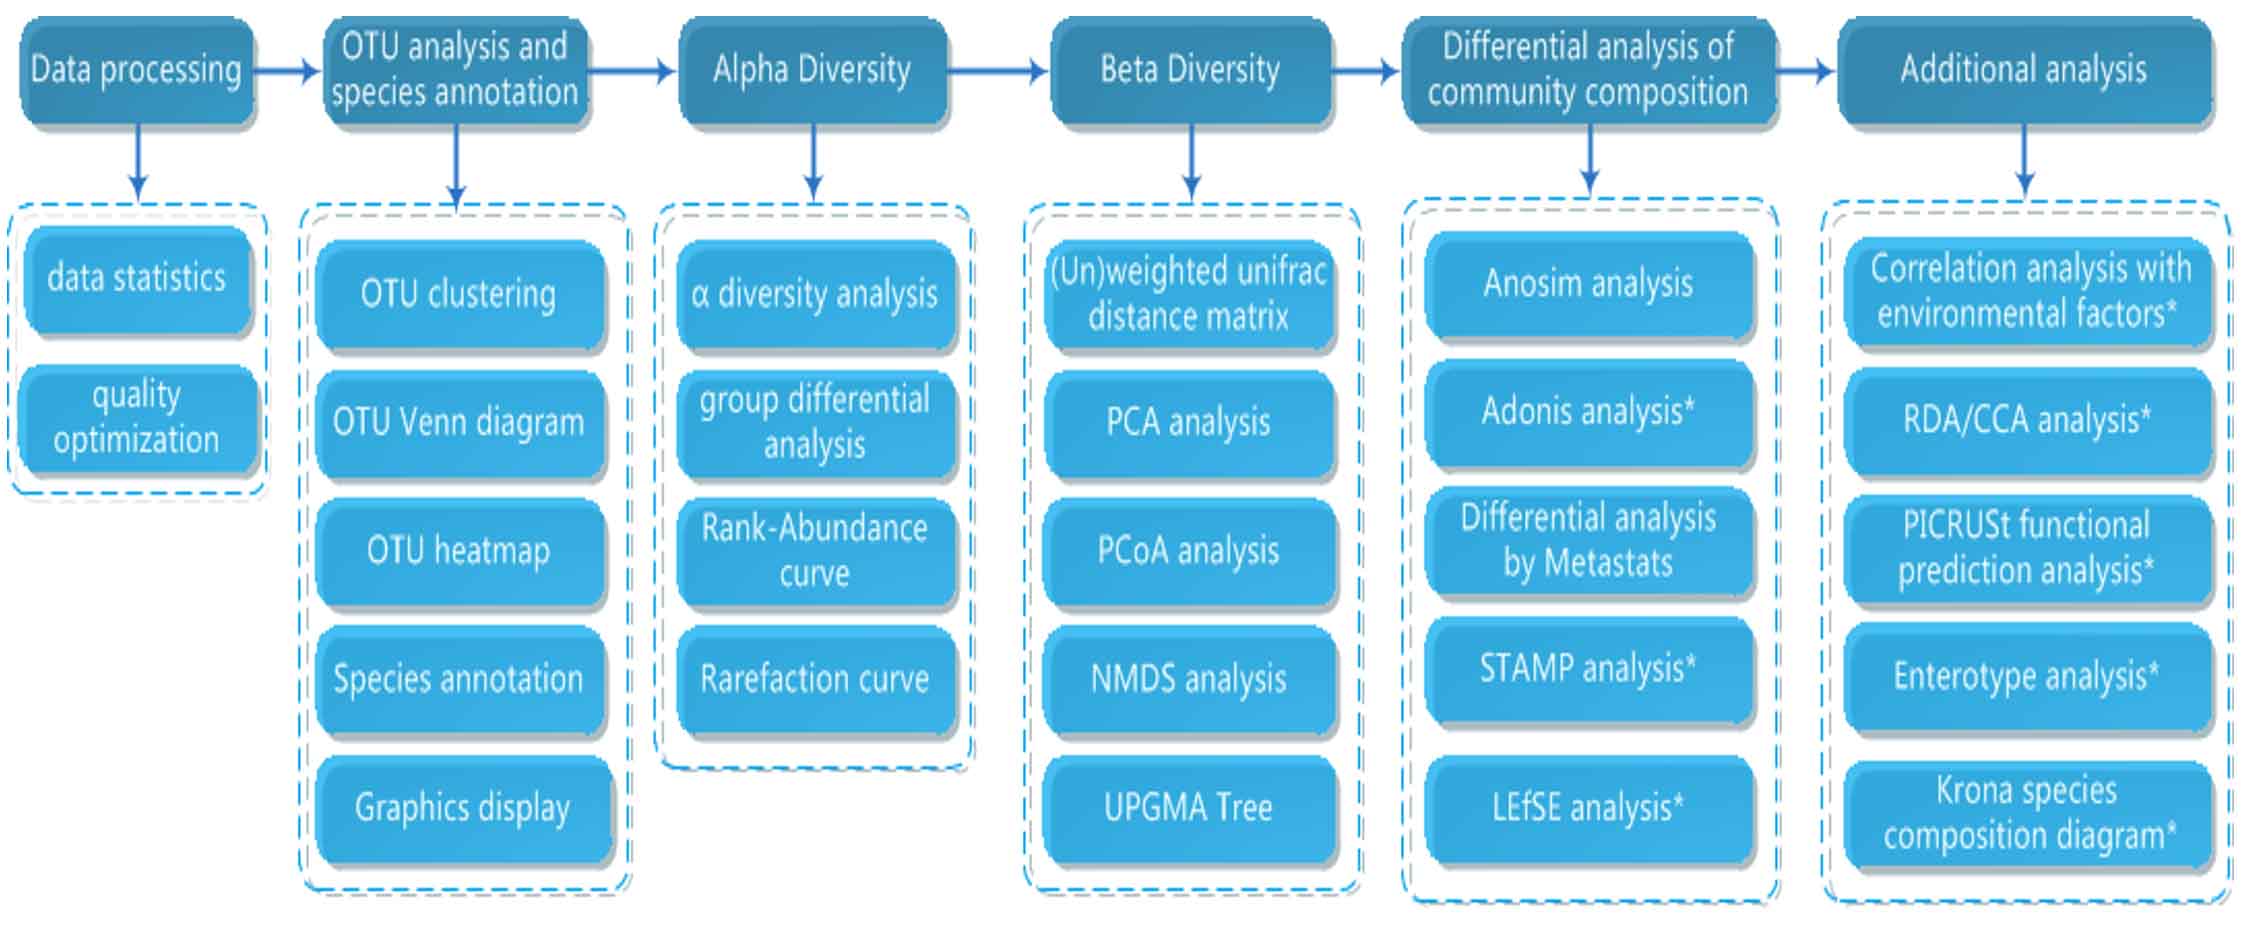
Fig. 2. Microbial diversity data analysis workflow.
Few Important Points to be considered while data analysis
If the quantity of tests is under 3, then examination of decent variety can’t be performed.
- The differential factual investigation is significant just if there are at any rate three recreates in the science gathering.
- Environmental elements are required for relationship examination of network synthesis and natural factors just as for CCA/RDA investigation.
- Intestinal-type investigation just applies to creature or human intestinal or feces tests.
- Analysis with “*” are excluded in the standard examination and can be chosen and dissected by individual example and venture.
Raw sequences were trimmed to remove adapters and low quality data by Trim Galore1. Then the chimera sequences were removed to obtain the effective sequences for cluster analysis. Samples were analyzed using the QIIME (version 1.9.1) with Greengene database3 (ftp://greengenes.microbio.me/greengenes_release/gg_13_5/gg_13_5_otus.tar.gz) to create operational taxonomic units (OTUs, 97% identity). QIIME generated the BIOM table which was used for downstream analyses31.
Diversity Analyses
We calculated the a-diversity and b- diversity indices of each sample in QIIME2 using the BIOM table. At each classification level statistical analysis of community structure was carried out based on the taxonomic information. Also, UPGMA clustering tree and Principal Coordinate Analysis (PCoA) plots were constructed based on Unifrac distance to illustrate the differences in community structure between different samples or groups32,33,34.
Metagenomic Data Analysis result
The original image data were analyzed using Bcl2fastq (v2.17.1.14) for base calling and preliminary quality analysis. During the sequencing process, Illumina built-in software based on each sequencing segment, namely read, the first 25 The quality of the base determines whether the read is retained or discarded. The result is stored in the FASTQ file format and contains the sequencing sequence information (the second row in the FASTQ format) and the corresponding sequencing quality information FASTQ format fourth line).
FASTQ format has four lines of information for each sequence as shown below:
@GWZHISEQ01:289:C3Y96ACXX:6:1101: 1704:2425 1:N:0:GGCTAC
GCTCTTTGCCCTTCTCGTCGAAAATTGTCT-CCTCATTCGAAACTTCTCTGT
+@@CFFFDEHHHHFIJJJ@FHGIIIEH-IIJBHHHIJJEGIIJJIGHIGHCCF
The first and third lines contain sequence identifier information produced by the sequencer (some fastq files omit name information and leaves it empty after the “+”sign on the third line to save space). The second line contains the sequence information. The fourth line depicts the quality information of each corresponding base on the second line. The fourth line contains sequence quality information, and the quality score is the ASCII value of the corresponding character minus 33. For example, the ASCII value of ‘@’is 64, and therefore the corresponding base quality score is 31 (64-33). Starting with Illumina GA Pipeline v1.8 (currently v1.9), base quality scores range from 0 to 41.
Table (1):
Explanation of the elements in sequence identifiers.
Type |
Description |
|---|---|
GWZHISEQ01 |
Unique instrument name |
289 |
Run ID |
C3Y96ACXX |
Flowcell ID |
6 |
Flow cell lane |
1101 |
Tile number within the flowcell lane |
1704 |
‘x’-coordinate of the cluster within the tile |
2424 |
‘y’-coordinate of the cluster within the tile |
1 |
Member of a pair, 1 or 2 (paired-end or mate-pair reads only) |
N |
Y if the read fails filter (read is bad), N otherwise |
0 |
0 when none of the control bits are on, otherwise it is an even number |
GGCTAC |
Index sequence |
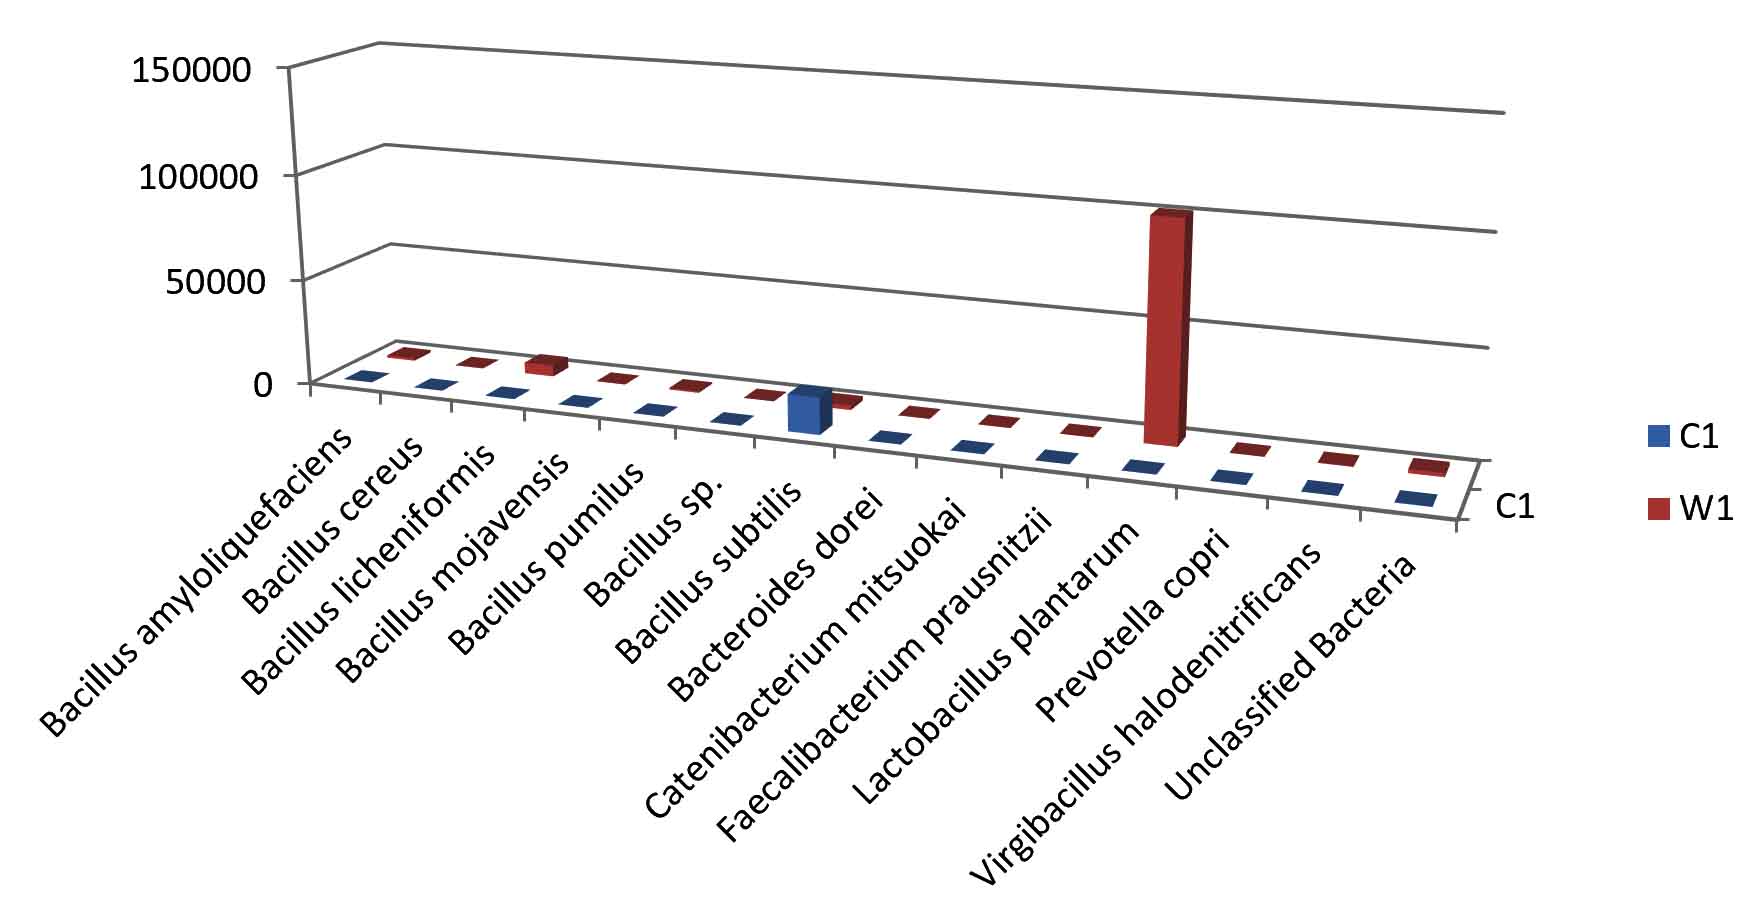
Fig. 3. Bar plot of Species level distribution.
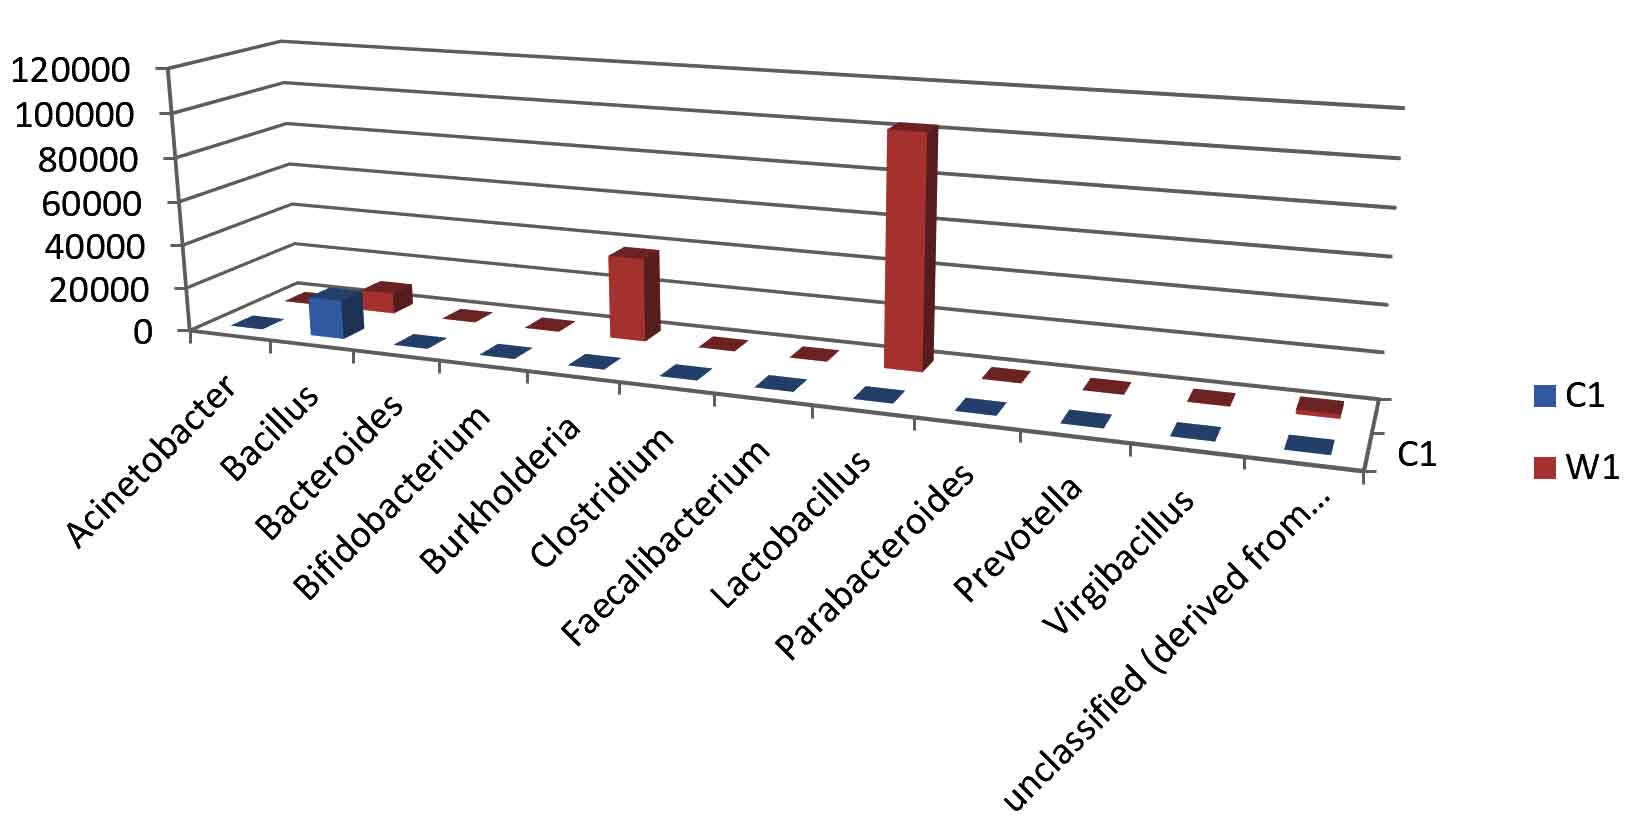
Fig. 4. Bar plot of Genus level distribution.

Fig. 5. Bar plot of Family level distribution.
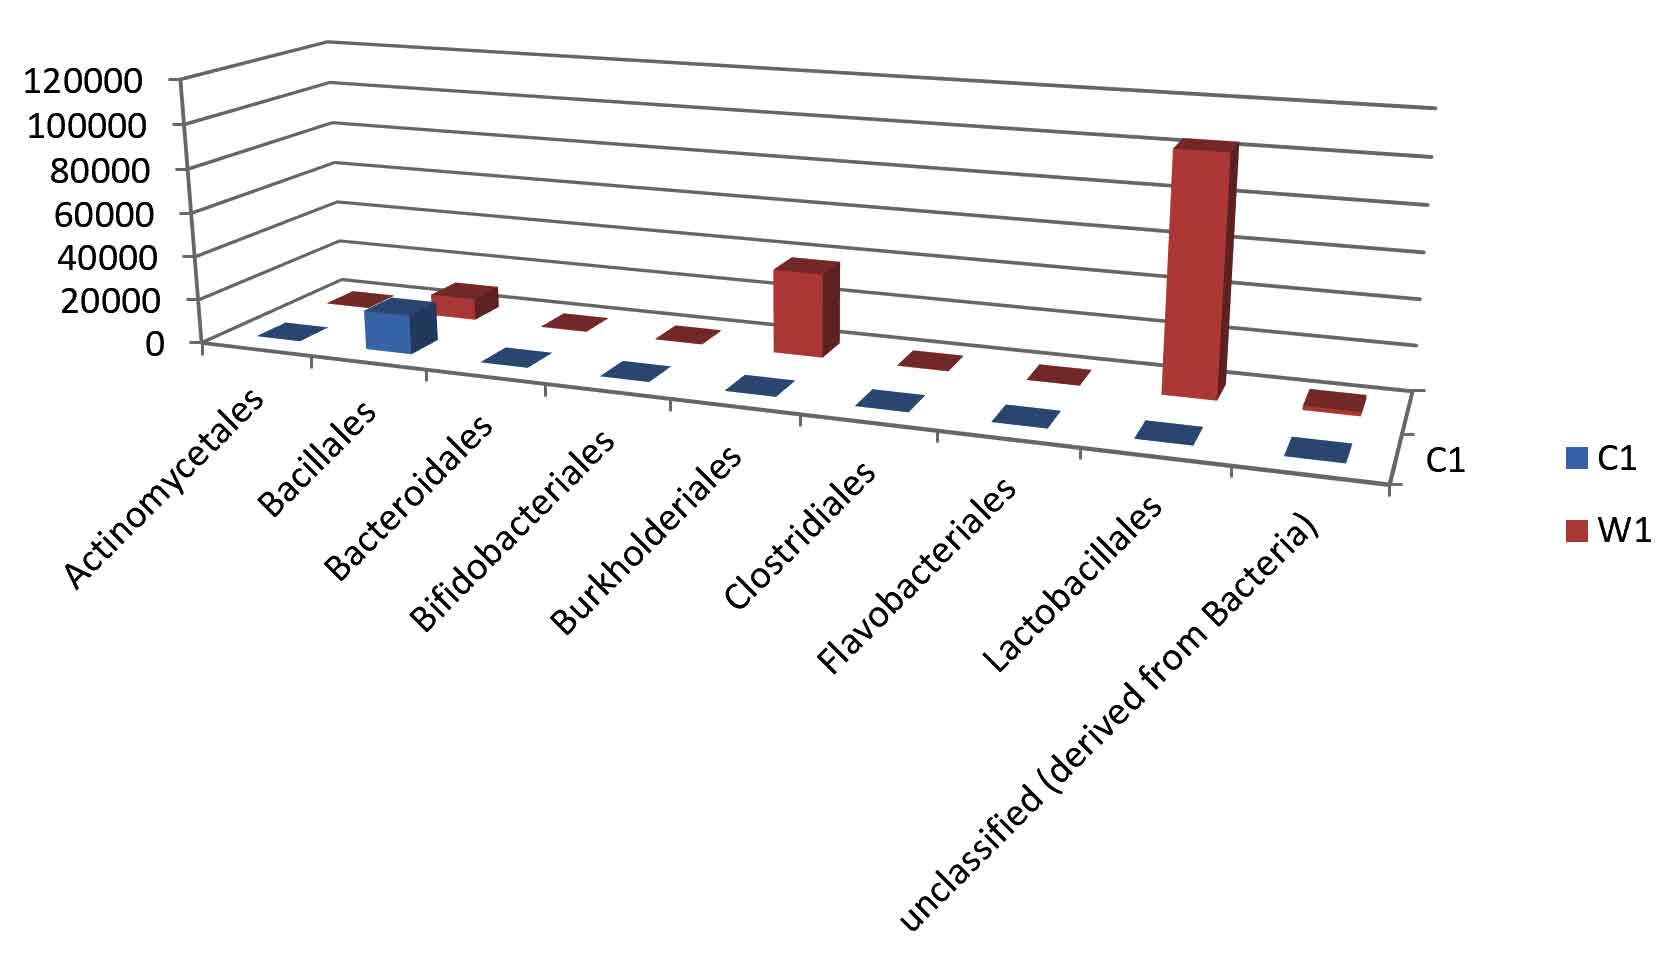
Fig. 6. Bar plot of Order level distribution.
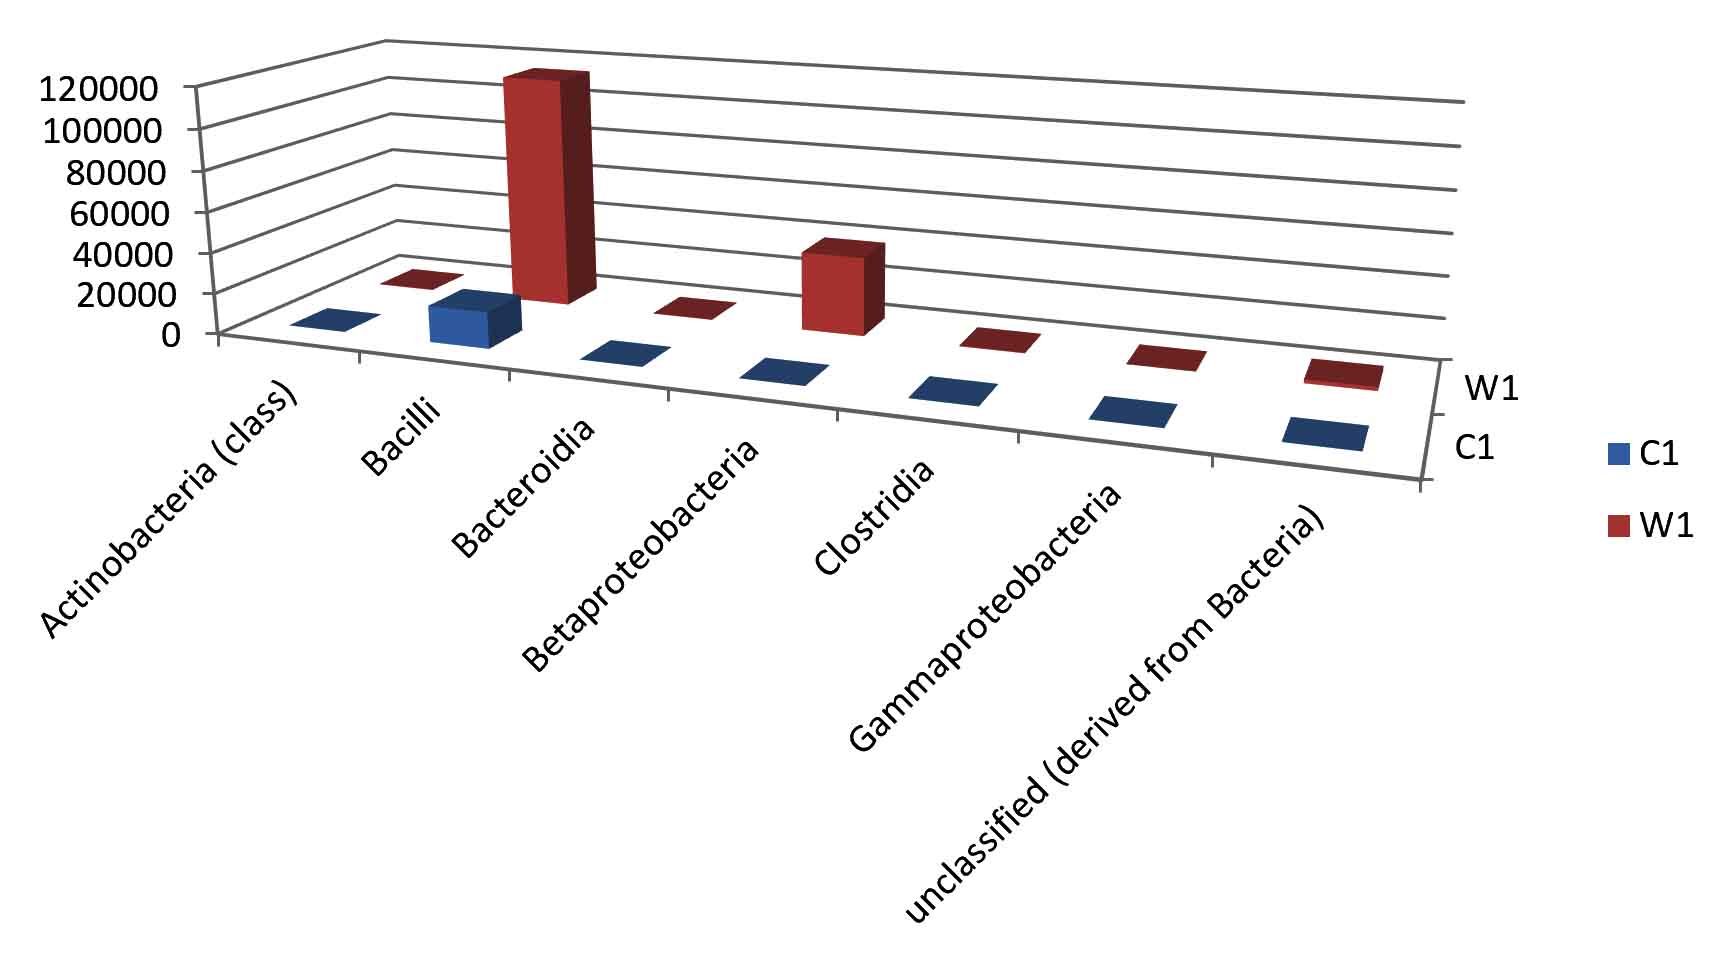
Fig. 7. Krona plot of Class level distribution.
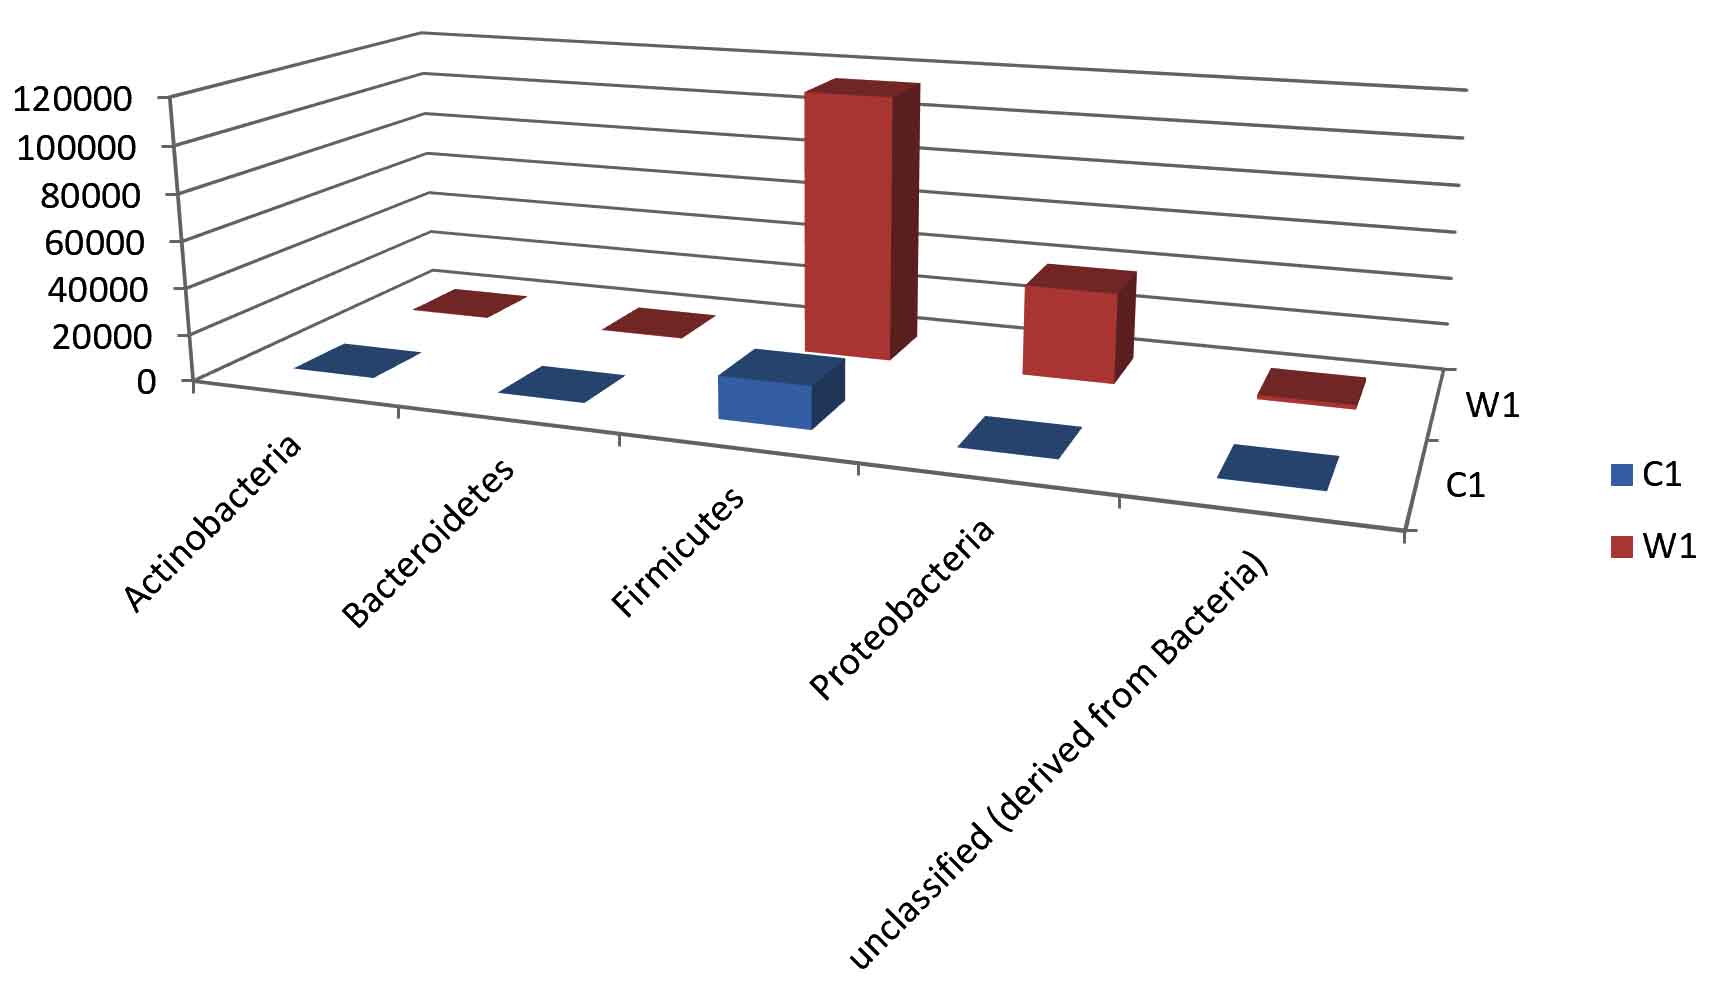
Fig. 8. Krona plot of Phylum level distribution.
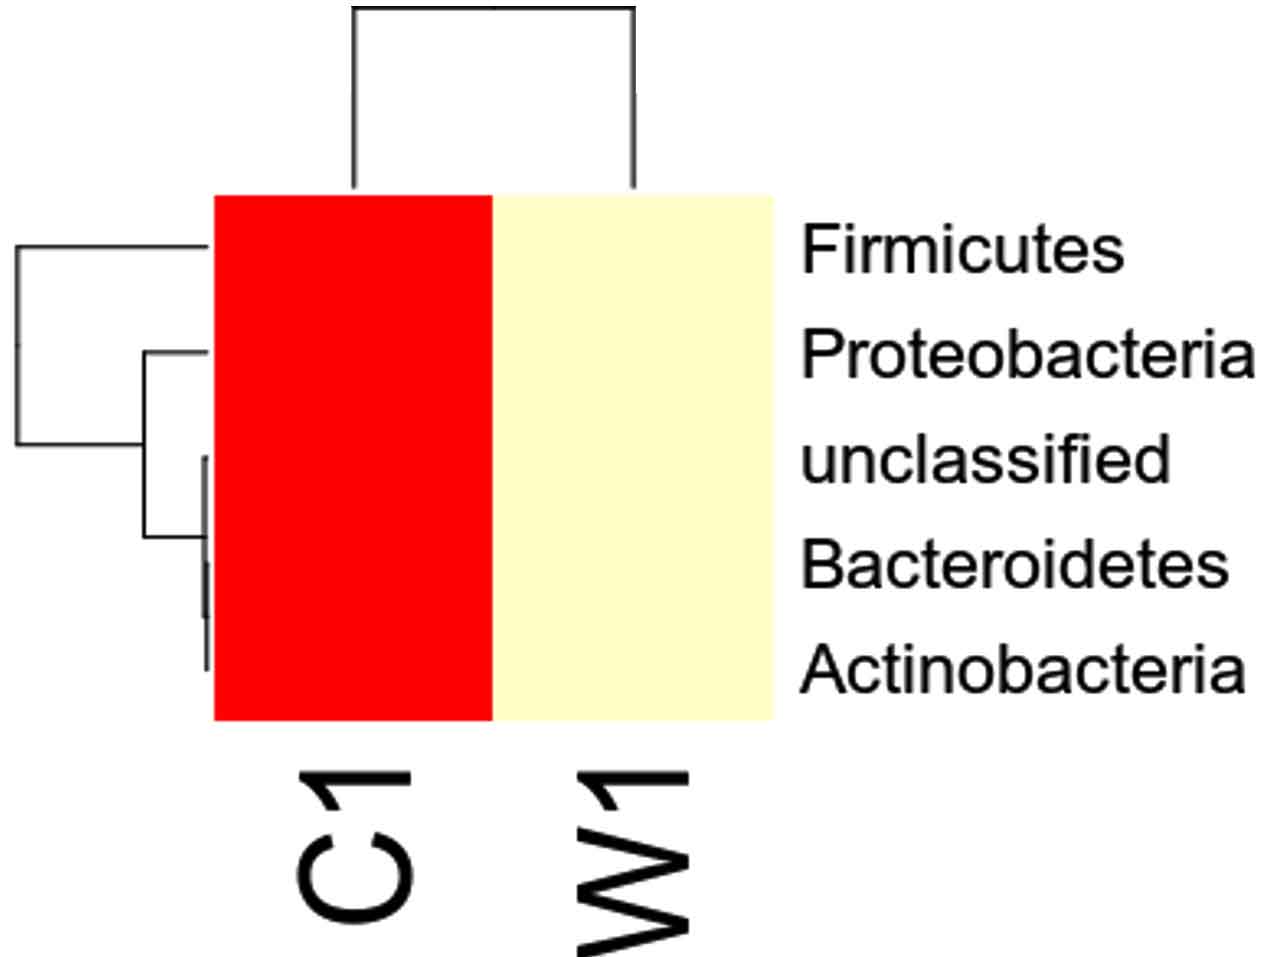
Fig. 9.

Fig. 10.
Sequencing base quality is affected by sequencer, reagents, samples and other factors. The first few bases from the 5′-end are usually of higher error rate and the error rate drops afterward. With long read sequencing platforms (e.g. 150+bp), sequencing error rate might rise again close to the 3’end. This is one of the inherent short-comings/features of high-throughput sequencing (Erlich and Mitra, 2008; Jiang et al.). The first six bases usually have a higher than average error rate. Since this is also the length of the random primer, it is suggested that the high error rate is due to the annealing between not perfectly matched primers and template (Jiang et al.). Statistics of sequencing error rate across all base positions can be used to spot the existence of abnormally high error rates. For example, it would raise a red flag if the base error rate in the middle of the sequence is significantly higher than that of the positions close to the end. In general, the sequencing error rate for each base position is less than 0.5%. An error in the sequence is indicated by letter ‘e’. The base quality scores of IlluminaHiSeq (TM) /MiSeq platforms are expressed in Q Phred. The formula to calculate QPhred based on error rate is:
Formula 1 : Qphred0=0-10log10(e)
Table (2):
The correlation between Illumina 1.8 base call error rate and Qphred scores.
Phred Quality Score |
Probability of Incorrect Base Call |
Base Call Accuracy |
|---|---|---|
10 |
1 in 10 |
90% |
20 |
1 in 100 |
99% |
30 |
1 in 1000 |
99.9% |
40 |
1 in 10000 |
99.99% |
50 |
1 in 100000 |
100% |
OTU analysis and species annotation
OTU clustering
OTU is an operational definition of a classification unit (genus, species, grouping, etc.) commonly used in population genetics to facilitate data analysis. In bioinformatics each sequence obtained from sequencing is assumed to be derived from a single species. All the sequences in a sample are classified to obtain information on species and genus. By classification, the sequences are grouped according to their similarity, and one group is an OTU. Typically, OTU cluster are defined by a 97% identity threshold for data statistics and analysis.
Analysis software used were Qiime (1.9.1) and Vsearch (1.9.6)
Species annotation statistics
In order to obtain the classification information of OTU, a representative sequence was selected for each OTU and annotated using the RDP classifier, thereby to obtain the community composition of each sample. Analysis software used was Qiime (1.9.1) Analysis method: RDP classifier Bayesian algorithm was used to classify the OTU representative sequences of 97% similarity level, and the community composition of each sample was analyzed and summarized at all levels. For each sample, the abundance of each species at different taxonomic levels (Phylum, Class, Order, Families, Genus, and Species) is shown in the table below:
Table (3):
Taxa Statistics at Domain level.
Domain |
C1 |
W1 |
|---|---|---|
Archaea |
22 |
72 |
Bacteria |
18455 |
156217 |
Unclassified sequences |
11 |
43 |
OTU’s under Domain level showing highest in both ants are bacteria.
Most abundant microbiota found in Carpenter ant gut (C) are bacteria = 18455
Most abundant microbiota found in Weaver ant gut (W) are bacteria = 156217
Table (4):
Taxa Statistics at Phylum level.
Phylum |
C1 |
W1 |
|---|---|---|
Actinobacteria |
67 |
305 |
Bacteroidetes |
131 |
301 |
Firmicutes |
17905 |
114751 |
Proteobacteria |
157 |
38867 |
Unclassified (derived from Bacteria) |
162 |
1838 |
OTU’s under phylum level showing highest in both ants are Firmicutes.
Most abundant microbiota found in Carpenter ant gut (C) are Firmicutes = 17905
Most abundant microbiota found in Weaver ant gut (W) are Firmicutes = 114751 and Proteobacteria =38867
Table (5):
Taxa Statistics at Class level.
| Class | C1 | W1 | |
|---|---|---|---|
| Actinobacteria (class) | 67 | 305 | |
| Bacilli | 17788 | 114292 | |
| Bacteroidia | 94 | 216 | |
| Betaproteobacteria | 32 | 38526 | |
| Clostridia | 82 | 330 | |
| Gammaproteobacteria | 73 | 118 | |
| unclassified (derived from Bacteria) | 162 | 1838 |
OTU’s under class level showing highest in both ants are bacilli.
Most abundant microbiota found in Carpenter ant gut (C) are bacilli= 17788
Most abundant microbiota found in Weaver ant gut (W) are bacilli = 114292 and BetaProteobacteria =38526
Table (6):
Taxa Statistics at Order level.
Order |
C1 |
W1 |
|---|---|---|
Actinomycetales |
34 |
121 |
Bacillales |
17748 |
9924 |
Bacteroidales |
94 |
216 |
Bifidobacteriales |
26 |
151 |
Burkholderiales |
31 |
37947 |
Clostridiales |
74 |
286 |
Flavobacteriales |
20 |
49 |
Lactobacillales |
40 |
104368 |
unclassified (derived from Bacteria) |
162 |
1838 |
OTU’s under class level showing highest in both ants are:
Most abundant microbiota found in Carpenter ant gut (C) are Bacillales = 17748
Most abundant microbiota found in Weaver ant gut (W) are Lactobacillales = 104368 Burkholderiales = 37947, Bacillales = 9924
Table (7):
Taxa Statistics at Family level.
Family |
C1 |
W1 |
|---|---|---|
Bacillaceae |
17723 |
9820 |
Bacteroidaceae |
45 |
73 |
Bifidobacteriaceae |
26 |
151 |
Burkholderiaceae |
16 |
37925 |
Clostridiaceae |
31 |
101 |
Erysipelotrichaceae |
29 |
83 |
Flavobacteriaceae |
19 |
49 |
Lactobacillaceae |
35 |
103596 |
Porphyromonadaceae |
17 |
64 |
Prevotellaceae |
25 |
49 |
unclassified (derived from Bacteria) |
162 |
1838 |
OTU’s under Family level showing highest in both ants are:
Most abundant microbiota found in Carpenter ant gut (C) are Bacillaceae = 17723
Most abundant microbiota found in Weaver ant gut (W) are Lactobacillaceae= 103596Burkholderiaceae = 37925, Bacillaceae = 9820
Table (8):
Taxa Statistics at Genus level.
Genus |
C1 |
W1 |
|---|---|---|
Acinetobacter |
29 |
14 |
Bacillus |
17708 |
9601 |
Bacteroides |
45 |
73 |
Bifidobacterium |
25 |
150 |
Burkholderia |
12 |
37890 |
Clostridium |
24 |
77 |
Faecalibacterium |
12 |
12 |
Lactobacillus |
33 |
103549 |
Parabacteroides |
11 |
49 |
Prevotella |
21 |
45 |
Virgibacillus |
7 |
198 |
unclassified (derived from Bacteria) |
160 |
1838 |
OTU’s under Genus level showing highest in both ants are:
Most abundant microbiota found in Carpenter ant gut (C) are Bacillus = 17708
Most abundant microbiota found in Weaver ant gut (W) are Lactobacillus= 103549Burkholderia = 37890, Bacillus = 9601
Table (9):
Taxa Statistics at Species level.
Species |
C1 |
W1 |
|---|---|---|
Bacillus amyloliquefaciens |
131 |
1143 |
Bacillus cereus |
18 |
39 |
Bacillus licheniformis |
112 |
5274 |
Bacillus mojavensis |
31 |
6 |
Bacillus pumilus |
90 |
679 |
Bacillus sp. |
47 |
34 |
Bacillus subtilis |
17200 |
2093 |
Bacteroidesdorei |
20 |
23 |
Catenibacteriummitsuokai |
9 |
34 |
Faecalibacteriumprausnitzii |
12 |
12 |
Lactobacillus plantarum |
14 |
101644 |
Prevotellacopri |
19 |
35 |
Virgibacillushalodenitrificans |
5 |
196 |
Unclassified Bacteria |
156 |
1798 |
OTU’s under Species level showing highest in both ants are:
Most abundant microbiota found in Carpenter ant gut (C) are Bacillus subtilis = 17200
Most abundant microbiota found in Weaver ant gut (W) are Lactobacillus plantarum = 101644, Bacillus licheniformis = 9601, Bacillus subtilis = 2093, Bacillus amyloliquefaciens = 1143
Graphics display of species relative abundance
The distribution of the abundant classifications in each sample or group at different taxonomic levels (Phylum, Class, Order, Families, Genus, species) are shown as follows:
Species distribution heat map
The top 30 species distribution of each sample (or group) on different levels (Phylum, Class, Order, Families, Genus, Species) was clustered and plotted in a heat map. The similarity and difference of each species is visualized by color scheme in the heat map. The heat maps plotted for the distribution of the species in each sample on different levels of classification are shown.
Sample complexity analyses
diversity analysis
In community ecologya, a diversity is mainly used to reflect the diversity of each sample, which estimates the number of species in the microbial community as well as the abundance and diversity of species in environmental communities through a series of statistical indices. Analysis software : Qiime (1.9.1) Analysis method: sequences were randomly extracted and the valid sequences were subject to OTU analysis and a diversity index was calculated for each sample.
a diversity results are summarized in the table below:
Table (10):
Collation of alpha diversity results.
Sample |
Chao1 |
Simpson |
Shannon |
Berger Parker |
Buzas_Gibson |
|---|---|---|---|---|---|
Sample_C1 |
1 |
1 |
0 |
1 |
0.000743 |
Sample_W1 |
15 |
0.416 |
1.25 |
0.585 |
0.000427 |
Here the, alpha diversity explain the more diversified species:
Under Simpson: sample C1 has highest species diversity. Sample W1 has is less diverse compare to sample C1
Under Shannon: Sample C1 has zero diversity. Sample W1 is high species diversity.
Rarefaction curve
The rarefaction curve is a useful tool to characterize the species composition of a sample and predicting the abundance of species in a sample. It efficiently deals with the increase of detected species due to the increase in sample size. It is widely used in biodiversity and community surveys to determine whether the sample size is sufficient and to estimate the species abundance. Therefore, the rarefaction curve can not only determine whether the sample size is sufficient, but also predict the species abundance when the sample size is sufficient. Analysis software used was Qiime (1.9.1) Analysis method considered was: The rarefaction curve was constructed by random sampling. The observed numbers of OTUs were plotted against the number of extracted sequences.
The Rarefaction curve for Carpenter ant (genus Camponotus) gut microbiota shows species abundance of species count = 230, and number of OTU’s =13000 approximate
The Rarefaction curve for Weaver ant (genus Oecophylla) gut microbiota ant (genus Camponotus) gut microbiota showing the difference in species abundance of species count and difference in number of OTU’s.
The comparison of Rarefaction curve between Weaver ant (genus Oecophylla) and gut microbiota shows species abundance of species count = 700 – 800, and number of OTU’s = 80000
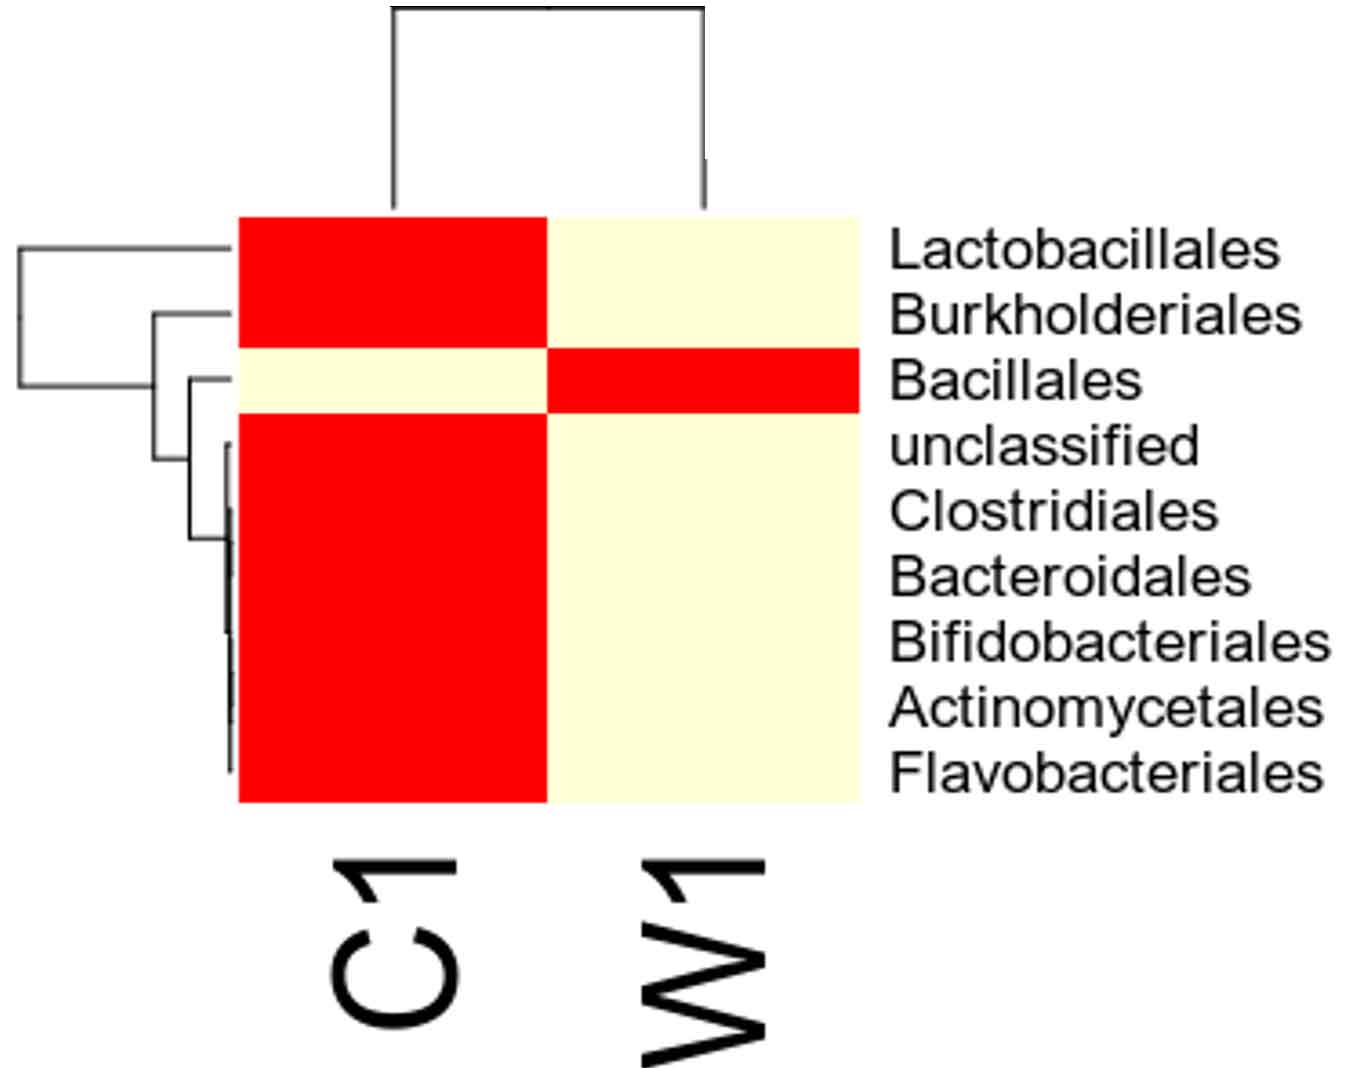
Fig. 11.
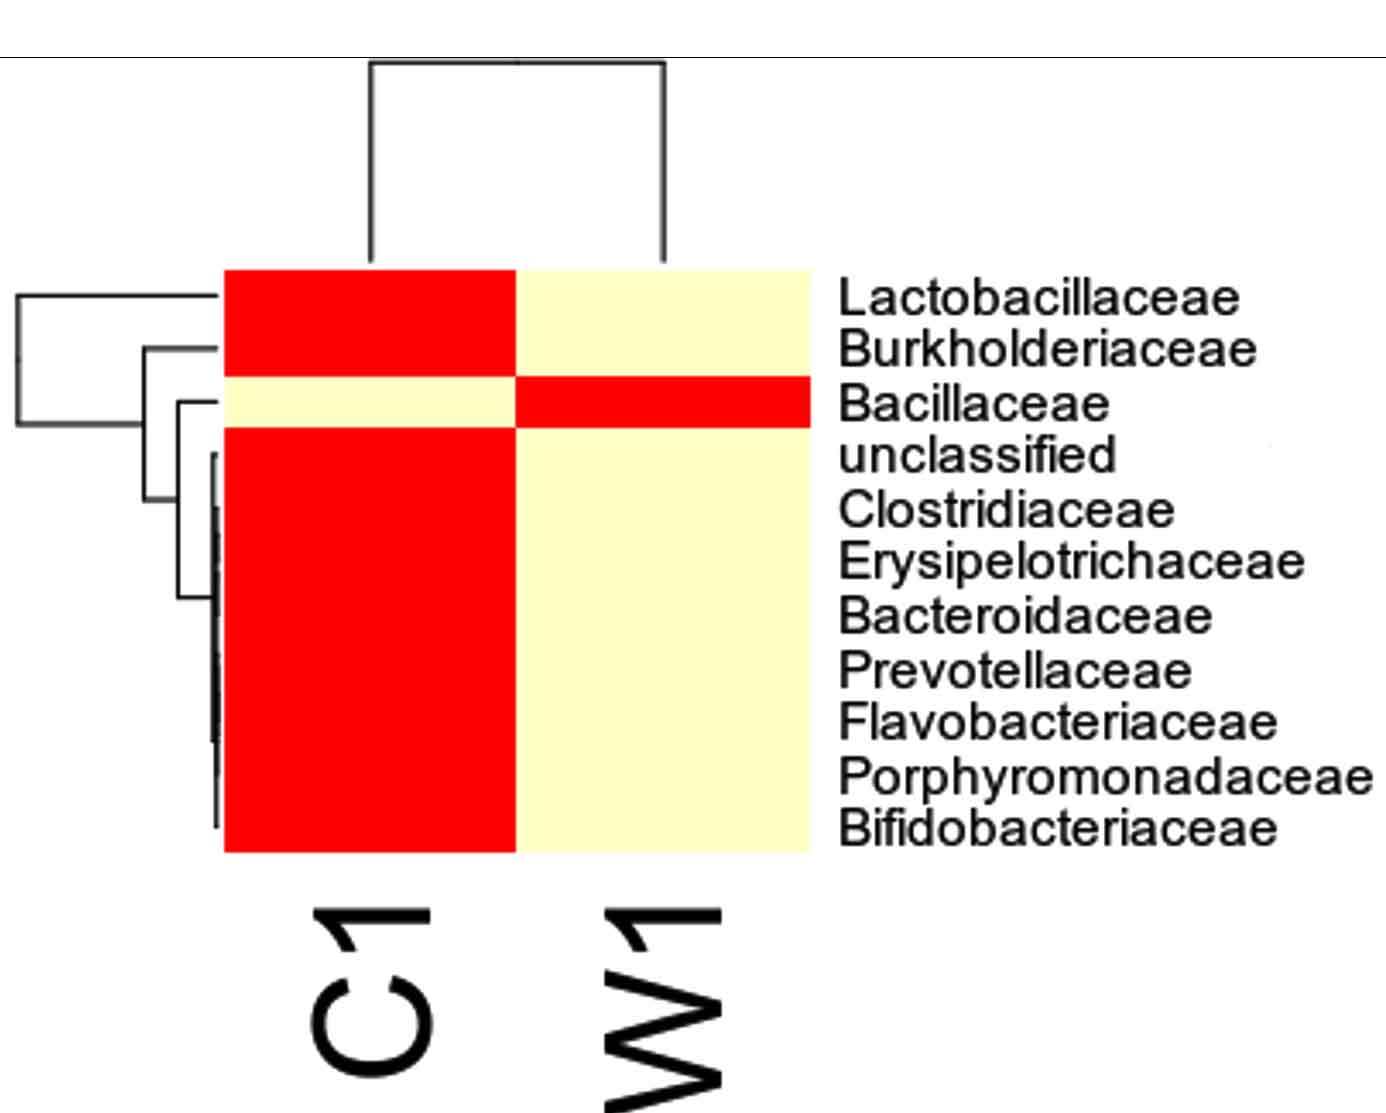
Fig. 12.
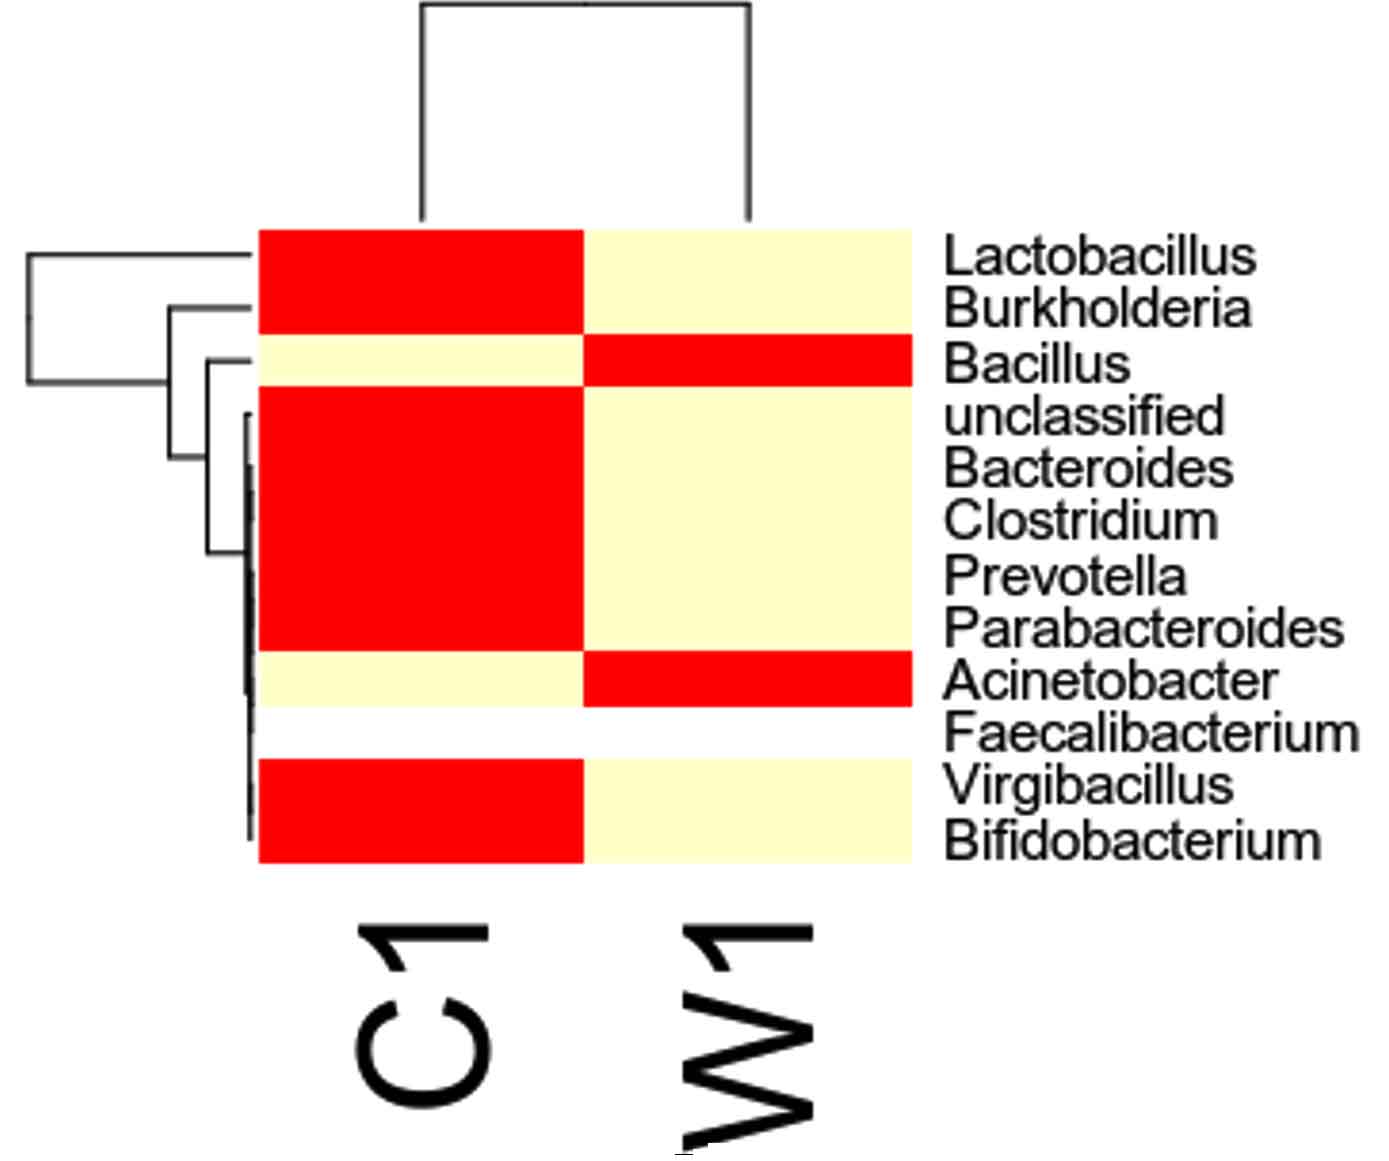
Fig. 13.
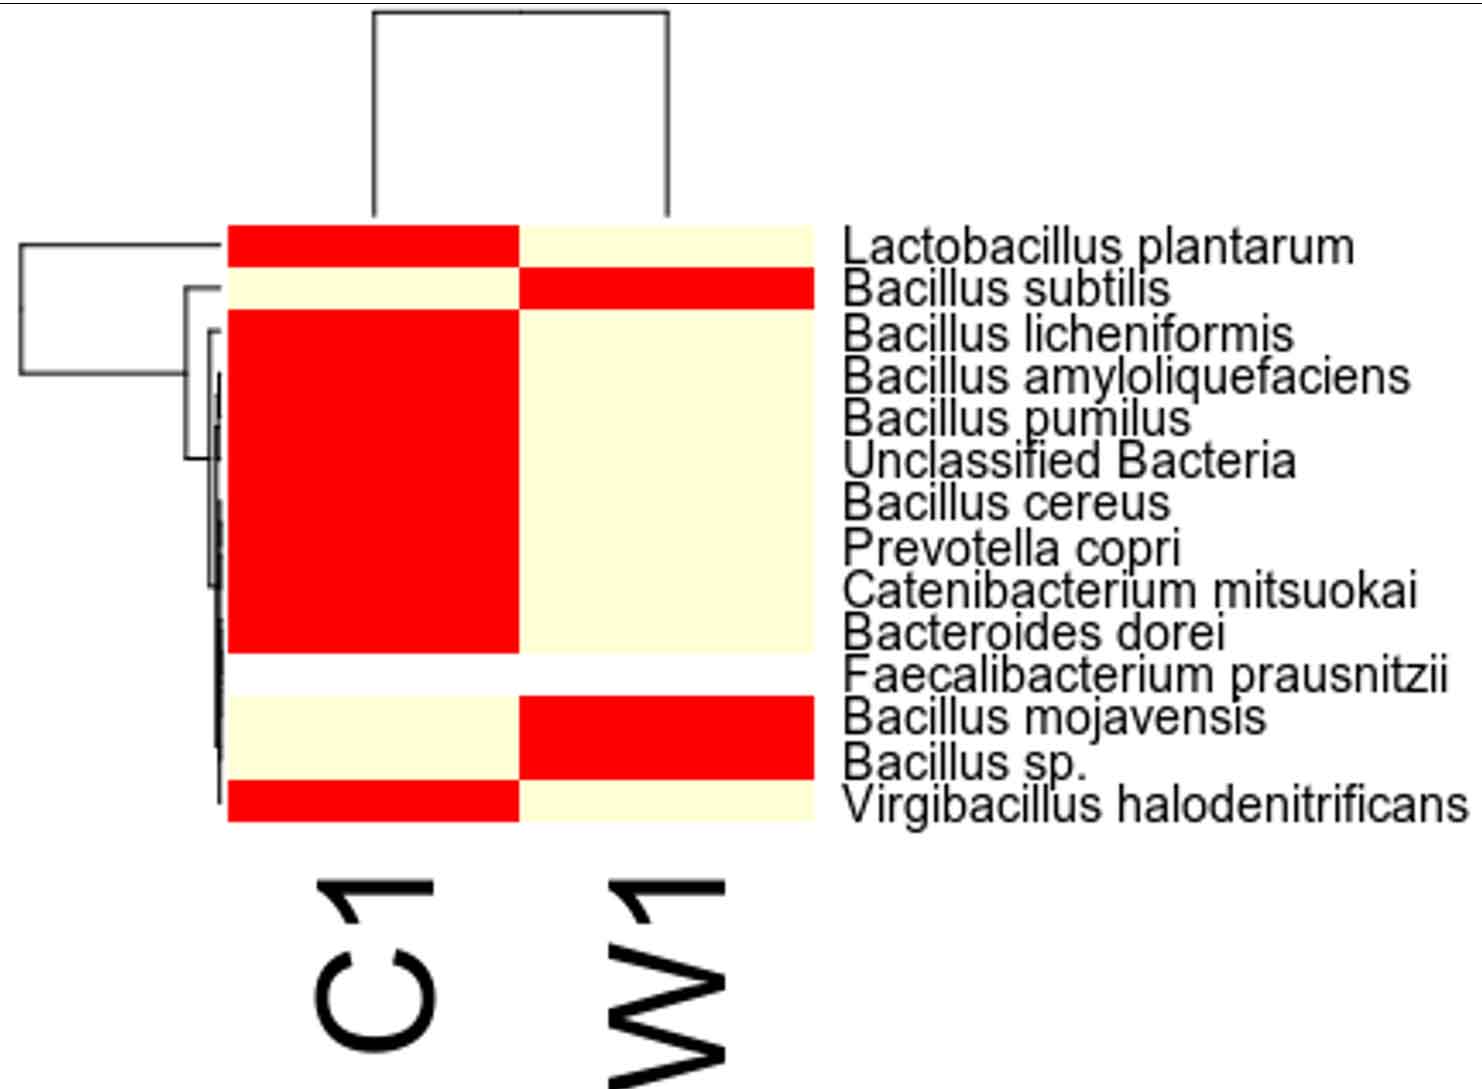
Fig. 14.

Fig. 15.
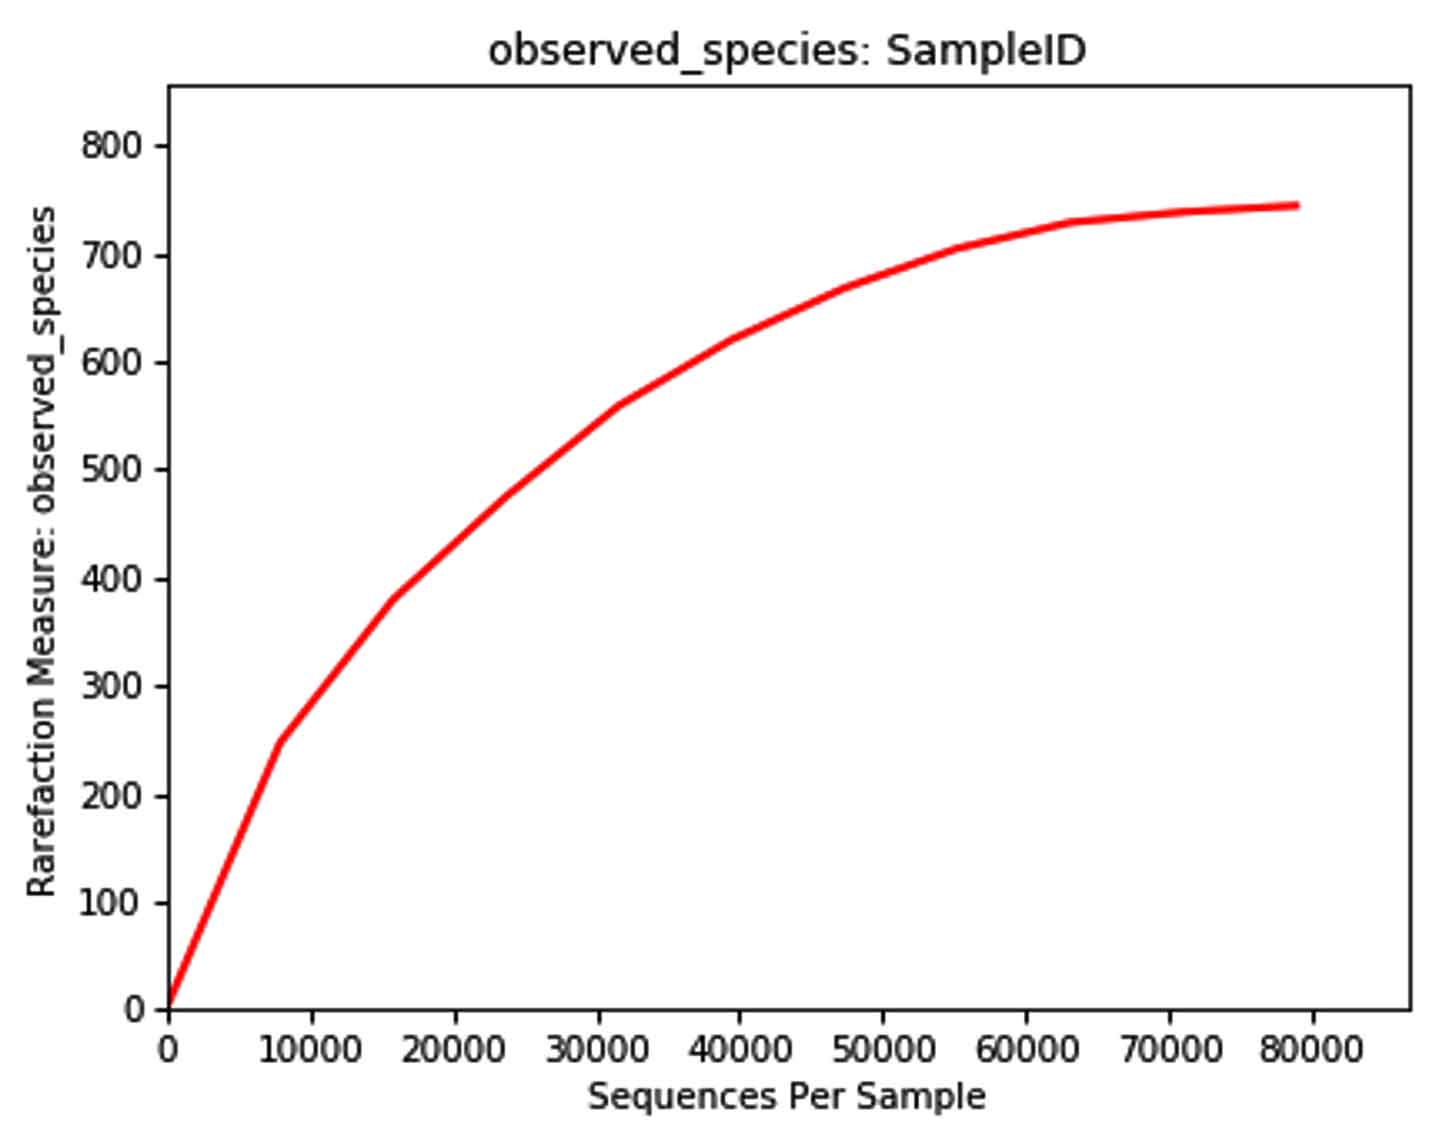
Fig. 16.
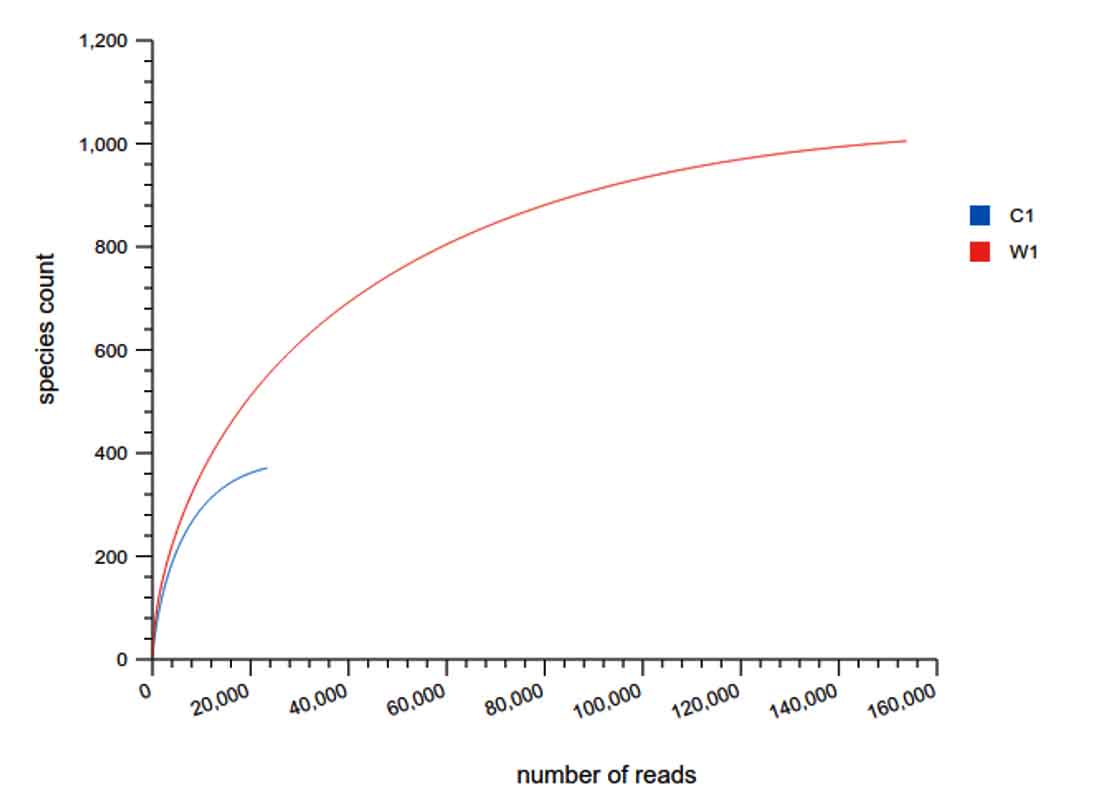
Fig. 17. Rarefaction curves
Note: The X axis is the number of Species, and the Y axis is the number of OUT reads. Each sample is represented by one curve with a unique color.
Our study with this comparison of gut microbiota between Carpenter ant gut and Weaver ant gut, revealed some common bacterial taxa are present in these both ants. The gut microbiota was studied using NGS-tool, the number of gut microbiota in each ants were shown, which infers Carpenter ant (genus Camponotus) gut sequencing, the size of microbial diversity is between 12000 OTUs to 14000 OTUs and in case of Weaver ants (genus Oecophylla) its 80000 OTUs. And the common bacteria found among two ants are from phylum level distribution were Actinobacteria, Bacteriodetes, Firmicutes, Proteobacteria and some bacteria which showed less abundance in these ant guts. In comparison, the abundantly present of these common bacteria were in the range of say in Camponotus gut and Oecophylla gut, firmicutes (75%, and 91%), proteobacteria (16%, and 41%). Under class level distribution was bacilli (70%, and 90%), and betaproteobacteria (40%) was seen only in Weaver ant, further in order level distribution, bacillales (75% and 8%), burkholderiales (41%) and lactobacillales (83%) were only found in Weaver ant, under family level bacillaceae (45%, and 4%), burkholderiaceae (41%) and lactobacillaceae (83%), further under genus and species level distribution, highest abundant bacteria in Camponotus gut was found to be Bacillus. subtilis species (95%), and in Oecophylla gut Lactobacillus.plantarum (85%) dominated these two ant guts. The taxa distribution level it was clearly shown that these bacteria play a vital role in the ant hast life cycle. Further in detailed study is required to know exactly, how these bacteria function the ant life cycle, how are they been acquired in host gut, is it because of host diet, habitats in which ant live etc,. By Previously done research on these bacterial characteristics, it is clear that, B.subtilis species is known to be useful as catalse positive(+ve), and are G+ve bacteria, common resident of soil and gastrointestinal tract of ruminants and humans, and also known to be normal micro flora found in honeybees, which are close relatives of ants and because of this characteristics might have acquired functional gut bacteria of honeybees (B.subtilis, produces a lipopeptide called surfactin, useful in inhibiting insect true pathogens). Thus, B. subtilis, is commericially used as a biocontrol agents of bacteria and fungal and plant pathogens. And the other dominant bacteria was found in Weave ant gut was Lactobacillus.plantarum, is known to often occupy ecological niche in nature, and can be cultured from lactic acid fermented foods, gastro-intestinal tract of humans and animals. And mainly are used as Probiotics and Bacillus. licheniformis, is also found to be the second dominant bacteria in these Weaver ant gut, are commonly soil residents, G+ve, mesophilic bacteria, and these are very useful as feathers degraders (used of waste feathers of dead birds as meal to feed livestock), detergent in laundry (removes dirt made of proteins), used in dental applications (agent to clean), nanotechnology applications (in synthesis of gold nanocubes), is excellent in competent for genetic transformation.
We conclude from above findings that these gut microbial species found in both these ant guts are economically, beneficially very important as biological control or vectors ant species and as pollinators. As these ant are very much diversified groups of insects found on the earth and hence due to their species gut microbial diversity, many encoded bioactive molecules can be used by the help of molecular biology tools to explore their applications in biotechnology and in other words their applications in environment.
ACKNOWLEDGMENTS
This study was supported by the Department of Microbiology and Biotechnology, Karnatak University Dharwad, Karnataka, India. We are thankful to Karnatak University and academic department for financial support through University research fellowship.
CONFLICT OF INTEREST
The authors declare that there is no conflict of interest.
AUTHORS’ CONTRIBUTION
All authors listed have made a substantial, direct and intellectual contribution to the work, and approved it for publication.
FUNDING
This work was supported by grants-Ph.D. Scholarship from Department of Microbiology and Biotechnology, Karnatak university Dharwad. SUBIN-KAKACRSFL0836124341000065Q.
ETHICS STATEMENT
This article does not contain any studies with human participants performed by any of the authors. The study with invertebrates does not need ethical permission.
AVAILABILITY OF DATA
All datasets generated or analyzed during this study are included in the manuscript.
- Vojtech Novotny, Yves Basset, Scott E.Miller, George D.Weiblen. Low host specifi city of herbivorous insects in a tropical forest. Nature, 2002; 416: 841-844.
Crossref - Bosheng Chen, Beng-Soon The, Chao Sun, Sirui Hu. Biodiversity and Activity of the Gut Microbiota across the Life History of the Insect Herbivore Spodoptera littoralis. Scientific Reports., 2016; 6.
Crossref - Jacob A. Russella, Corrie S. Moreaua, Benjamin Goldman-Huertasa, Mikiko Fujiwaraa. Bacterial gut symbionts are tightly linkedwith the evolution of herbivory in ants. PNAS, 2009; 106: 21236-21241.
Crossref - Nancy Moran, Paul Baumann. Phylogenetics of cytoplasmically inherited microorganisms of arthropods. Trends Ecol. Evol., 1994; 9: 15-20.
Crossref - Martin Heil, Doyle McKey.Protective. Ant-Plant Interactions as Model Systems in Ecological and Evolutionary Research. Annu. Rev. Ecol. Evol. Syst., 2003; 34: 425-553.
Crossref - Evelyn Zientz, Heike Feldhaar, Sascha Stoll, Roy Gross.Insights into the microbial world associated with ants. Arch. Microbiol., 2005; 184: 199–206.
Crossref - Ulrich G. Mueller,Stephen A. Rehner, Ted R. Schultz. The Evolution of Agriculture in Ants. Science., 1998; 281: 2034-2038.
Crossref - Cameron R. Currie, James A. Scott, Richard C. Summerbell. Fungus-growing ants use antibiotic-producing bacteria to control garden parasites. Nature,2003; 398: 701–704.
Crossref - Christina Sauer, Erko Stackebrandt, Jurgen Gadau, Bert Holldobler. Systematic relationships and cospeciation of bacterial endosymbionts and their carpenterant host species : proposal of the new taxon Candidatus Blochmannia gen. nov. Int. J. Syst. Evol. Microbiol., 2000; 50: 1877–1886.
Crossref - Heike Feldhaar, Josef Straka, Markus Krischke, Kristina Berthold. Nutritional upgrading for omnivorous carpenter ants by the endosymbiont Blochmannia. BMC Biol., 2007; 5: Article number: 48.
Crossref - Angela E. Douglas. Multiorganismal Insects: Diversity and Function of Resident Microorganisms. Annual Review of Entomology, 2014; 60: 17-34.
Crossref - Allison K. Hansen, Nancy A. Moran. The impact of microbial symbionts on host plant utilization by herbivorous insects. Mol. Ecol., 2014; 23: 1473–1496.
Crossref - Nancy A. Moran, Daniel B. Sloan. The Hologenome Concept: Helpful or Hollow?. PLOS Biology., 2015; 13: e1002311.
Crossref - Gordon M. Bennett and Nancy A. Moran, Heritable symbiosis: The advantages and perils of an evolutionary rabbit hole. Proc. Natl. Acad. Sci. USA., 2015; 112: 10169–10176.
Crossref - Ryuichi Koga,Gordon M. Bennett,Jason R. Cryan,Nancy A. Moran. Evolutionary replacement of obligate symbionts in an ancient and diverse insect lineage. Environ. Microbiol., 2013; 15: 2073-2081.
Crossref - Heike Feldhaar. Bacterial symbionts as mediators of ecologicallyimportant traits of insect hosts. Ecol. Entomol., 2011; 36: 533 – 543.
Crossref - Hauke Koch, Paul Schmid Hempel. Gut microbiota instead of host genotype drive the specificity in the interaction of a natural host parasite system. Ecol. Lett., 2012; 15: 1095-1103.
Crossref - Steven M. Wagner, Adam J. Martinez, Yong-Ming Ruan, Kyungsun L. Kim,Paul A. Facultative endosymbionts mediate dietary breadth in apolyphagous herbivore. Funct. Ecol., 2015; 29: 1402–1410.
Crossref - Keith.clay. Defensive symbiosis: a microbial perspective. Funct. Ecol., 2014; 28: 293–298.
Crossref - Sarah N. Cockburn,Tamara S. Haselkorn,Phineas T. Hamilton,Elizabeth Landzberg. Dynamics of the continent wide spread of a Drosophila defensive symbiont. Ecol. Lett., 2013; 16: 609-616.
Crossref - Philipp Engel, Nancy A.Moran. The gut microbiota of insects – diversity in structure and function. FEMS Microbiol Rev., 2013; 37: 699-735.
Crossref - Nichole A. Broderick. Microbiota-induced changes inDrosophila melanogasterhost gene expression and gut morphology. mBio., 2014; 5: e01117-14.
Crossref - Hubert Herz, Wolfram Beyschlag, Bert Holldobler. Assessing Herbivory Rates of Leaf-Cutting Ant (Atta colombica) Colonies Through Short-Term Refuse Deposition Counts. Biotropica., 2007; 39: 476-481.
Crossref - Christian Pinkalski,Karl Martin V. Jensen, Christian Damgaard,Joachim Offenberg. Foliar uptake of nitrogen from ant faecal droplets: An overlooked service to ant-plants. J Ecol., 2017; 106: 289-295.
Crossref - Philipp Engel, Nancy A. Moran. The gut microbiota of insects – diversity in structure and function. FEMS Microbiol Rev., 2013; 37: 699-735.
Crossref - Muthukalingan Krishnan, Chinnapandi Bharathiraja, Jeyaraj Pandiarajan,Vimalanathan Arun Prasanna,. Insect gut microbiome – An unexploited reserve for biotechnological application. Asian Pac. J. Trop Biomed., 2014; 4: S16-S21.
Crossref - Peipei Zhang,Yan Liu,Wenwen Liu, Sebastien Massart. Simultaneous detection of wheat dwarf virus, northern cereal mosaic virus, barley yellow striate mosaic virus and rice black-streaked dwarf virus in wheat by multiplex RT-PCR. J Virol. Methods., 2017; 249: 170-174.
Crossref - Monica Pichler, Omer K. Coskun, Ana Sofia Ortega Arbulu, Nicola Conci et al. A 16S rRNA gene sequencing and analysis protocol for the Illumina MiniSeq platform. Microbiologyopen., 2018; 7: e00611.
Crossref - Quail M A, Swerdlow H, Turner D J. Improved Protocols for Illumina Sequencing. Curr. Protoc. Hum Genet., 2013; 79: 18.2.1-18.2.42.
Crossref - Sijun Liu, Diveena Vijayendran, and Bryony C. Bonning.. Next Generation Sequencing Technologies for Insect Virus Discovery. Viruses, 2011; 3: 1849-1869.
Crossref - Daniel McDonald,Morgan N Price, Julia Goodrich, Eric P Nawrocki,. An improved Greengenes taxonomy with explicit ranks for ecological and evolutionary analyses of bacteria and archaea. ISME J., 2011; 6: 610-618.
Crossref - Na-Na Li, Feng Shi, Xiao-Hui Niu, Jing-Bo Xia. A novel method to reconstruct phylogeny tree based on thechaos game representation. J Biomed Sci Eng., 2009; 02: 582-586.
Crossref - Aileen Berasategui, Karolin Axelsson, Goran Nordlander, Axel Schmidt. The gut microbiota of the pine weevil is similar across Europe and resembles that of other conifer-feeding beetles. Mol. Ecol., 2016; 25:4014-4031.
Crossref - Donovan H.Parks, Gene W.Tyson, Philip Hugenholtz, Robert G.Beiko.STAMP: statistical analysis of taxonomic and functional profiles. Bioinformatics, 2014; 30: 3123-3124.
Crossref
© The Author(s) 2019. Open Access. This article is distributed under the terms of the Creative Commons Attribution 4.0 International License which permits unrestricted use, sharing, distribution, and reproduction in any medium, provided you give appropriate credit to the original author(s) and the source, provide a link to the Creative Commons license, and indicate if changes were made.