

ISSN: 0973-7510
E-ISSN: 2581-690X
The aim of this study was to compare the antibiotic potency of Cyanthillium cinereum and Moringa oleifera (natural antibiotics) against Ampicillin and Erythromycin (synthetic antibiotics) using zone of inhibition and both the natural and synthetic antibiotic was treated against Staphylococcus aureus, Klebsiella. pneumoniae and Pseudomonas aeruginosa. The extracts from the natural agents were obtained by the use of methanol (polar) and hexane (non-polar). The bacteria were treated with six different conc. (100%, 75%, 50%, 25%, 10% and 5%) of the extracts, where the largest zone of inhibition was observed with C. cinereum extract at 5% concentration against S. aureus with mean and standard deviation of 22.1±2.1. S. aureus followed by P. aeruginosa was most susceptible towards the treatments. The correlation (Pearson) indicated that the conc. of the extract was indirectly proportional to the zone of inhibition. The phytochemical analysis revealed that C. cinereum contained alkaloids, catecholic tannins, saponins, flavones, volatile oils phenols and steroids and M. oleifera only contained Alkaloid, tannins and steroids.
Synthetic, antbiotic potency, natural drugs, Synthetic antibiotics,zone of inhibition.
Bacteria are single-cell organisms that have been in existence for millions of years (Encyclopedia Britannica, 2017). Since their existence they have adapted the ability to inhabit virtually everywhere; from the harshest of climates to the most suitable of environments (including the human body); thus resulting in the formation of several bacterial species (Rogers and Kadner, 2017). Bacteria are classed based on their difference shapes, sizes and even method of locomotion (Vidyasagar, 2015). Bacteria could be either spiral, spherical or rod-shaped, and could be transmitted through several sources; some are airborne while others are found either in water or soil (Cox, 2016).
The human body poses a suitable environment that is rich in nutrients, thus it attracts both good and bad bacteria. Not all bacteria are bad; there are good bacteria or otherwise called beneficial bacteria that lurk in, on the surface of the human body and even aids in making some of the desiring foods for humans, for example, Lactobacillus johnsonii is a beneficial bacteria that is found in the gut and makes digestion of milk smoother (Devault, 2017).
Infections are responsible for several diseases that compromises the health of human beings; especially humans with weak immune systems. Infectious diseases such as (cold, flu and AIDS), (malaria), (urinary tract infection, meningitis and tuberculosis) and (ringworm and athlete’s foot) can be caused by viruses, parasites, bacteria and fungi respectively; however, bacterial disease infections are mostly common (Explorable, 2010). With the exception to infections caused by viral diseases (such as AIDS, flu and bronchitis); infections can be averted, managed and treated through several antimicrobial compounds, which is collectively referred to as antibiotics (Explorable, 2010). Most of the antibiotics are referred to “microbicins”, substances (medicines) which cause one microorganism to manage or kill another and in the same process causes a minute or no harm to normal body cells (VIHA, 2014). The word antibiotic is more so related to bacteria (i.e. substances that manage/kill bacteria). With that said, there are several mechanisms by which antibiotics can complete such tasks; there are the inhibition of the cell wall synthesis, inhibition of protein synthesis, inhibition of folate synthesis or binding DNA gyrase (VIHA, 2014).
As Antibiotics are classified into two board groups; bactericidal and bacteriostatic antibiotics, first basically impedes with the bacterium’s cell wall formation or its cell contents, thus killing the bacterium and the other inhibits protein production, DNA replication and several other cellular metabolism, thus the bacteria loses the ability to multiple1. Penicillin, daptomycin, metronidazole, nitrofurantoin are all bactericidal antibiotics, whereas, the bacteriostatic antibiotics are tetracyclines, spectinomycin, chloramphenicol and trimethoprim. However, these are all substances that have been synthesized over the years and must be taken at the right lengths of time or used for the appropriate bacterial infection to avoid the bacteria from becoming resistant to the antibiotics, but the indiscriminate use and easy accessibility of such antibiotics to date, is causing an significant increase to the problem which is the rapid development and multiplication of antibiotic resistant bacteria3. There are several mechanisms adapted by bacteria which allows them to withstand the effects of the synthetic antibiotics; mechanisms such as the inactivation of the antibiotic, alteration of the target sites and membranes, and efflux pumps2. The aim of the work will be to compare the antibiotic potency of Cyanthillium cinereum and Moringa oleifera (natural antibiotics) against Ampicillin and Erythromycin (synthetic antibiotics) using zone of inhibition. The Objectives of this will be to investigate the potency of Cyanthillium cinereum as a natural antibiotic agent against Klebsiella pneumoniae, Pseudomonas aeruginosa and Staphylococcus aureus, to see the potency of Moringa oleifera as a natural antibiotic agent against Klebsiella pneumoniae, Pseudomonas aeruginosa and Staphylococcus aureus and finally to compare the antibiotic potency of the natural agents (Cyanthillium cinereum and Moringa oleifera) against that of the selected synthetic antibiotics (Ampicillin and Erythromycin).
As we have a decrease in the antibiotic properties of synthetic drugs and Guyana is filled with a rich diversity of fauna one has to tap into this filed for alternate forms of cure for diseases. This will enable locals to use more of natural crops or use plants with medicinal properties for consumption on a regular basis.
This project (comparative study of the antimicrobial effectiveness of natural and synthetic antibiotics) was carried out at the University of Guyana Turkeyen Campus, in the Department Biology laboratory.
Collection of Plant specimens
The Whole Cyanthillium cinereum (Inflammation bush) and Moringa oleifera (Saijan plant); with the exception of the roots and fruits, were hand-picked during the month of June, 2017. The plants were collected from various Regions around Guyana. The Cyanthillium cinereum (Inflammation bush) was collect from Region 3 (La Grange West Bank Demerara) and Region 4 (Beterverwagting East Coast Demerara/Demerara-Mahaica). The Moringa oleifera (Saijan plant) was collected from Region 4 (Turkeyen East Coast Demerara/Demerara-Mahaica) and Region 3 (Tuschen Essequibo-West Demerara).
Ms. Kaslyn Collins (Scientific Officer -Botanist) of the Center for the Study of Biological Diversity (CSBD) had Identified and confirmed the plant Cyanthillium cinereum and Moringa oleifera to carry out the work.
Preparation of Extracts
Healthy plants were collected, they were cleaned and washed thoroughly to ensure the removal, of pests or eggs. The plants were then placed into the oven at 45-50°C for 1-2 weeks to be dried. The dried plants were powdered by a mill, for the preparation of extracts. Both polar (methanol) and non-polar (hexane) solvents were incorporated in the extract process. Approximately, 1320g and 110g of the powdered Cyanthillium cinereum were soaked in 1500mL and 1250mL of 95% methanol and hexane respectively and 46.82g of the powdered Moringa oleifera was soaked in 750mL of 95% methanol and hexane. After the 24 hours soaking period, the extracts were shaken vigorously and then strained. They were placed into glass containers and kept at room temperature.
The extracts were placed into the rotary evaporator to remove the solvents used. The rotary evaporator reduced the extracts down to a semi solid state. By reducing the extract to a semi solid state, most if not all of the extracting solvents used were allowed to evaporate from the samples and a very concentrated product remained inclusive of the various phytoconstituents which is known as the crude extract. The hexane (alkane) extracts evaporated at a much faster rate than the methanol (alcohol) extracts since it has a lower boiling point (69°C) than methanol which has a slight higher boiling point of 78°C. After the crudes were obtained, they were collected and stored in tightly capped glass vials.
Preparation of plates using Mueller Hinton Agar
Procedure
27g of Muller-Hinton agar was added into a conical flask to which there after 700mL of water was added. The mixture was swirled gently and then placed onto the hot plate for approximately ½ hour, which allowed the agar to dissolve further. At timely intervals, the flask was swirled and the pressure build-up within the flask was lowered by removing the cap. As bubbles emerge from the bottom of the flask, the solution was removed from the hot plate and placed into an autoclave at 121°C for fifteen minutes at 12psi to be sterilized.
After the solution was autoclaved, it was cooled under running tap water to around 55°C before being poured into the petri dishes. To reduce the risk of contamination, the agar was poured inside a biosafety laminar air-flow cabinet. After pouring, the plates were left to sit at room temperature for under an hour to solidify. After solidification, they were UV sterilized a second time for 20 minutes so as to ensure that there were no possible contamination. The plates were then inverted and placed into the refrigerator were they stood overnight. After such, the plates were placed inside an incubator in an effort to remove any excess moisture that may have accumulated from the fridge, then they were labeled and there after the respective organism was streaked on to the plates.
Bacteria was obtained from the Faculty of Health Sciences at the University of Guyana based on their pharmacological and clinical importance and the other was obtained from the Department of Natural Sciences at the University of Guyana. NB. Microbes were maintained at 15°C on nutrient plates. Viz: Klebsiella pneumoniae (K. pneumoniae),Pseudomonas aeruginosa (P. aeruginosa),Staphylococcus aureus (S. aureus)
Preparation of McFarland standard (Turbidity)
In an effort to ensure that the appropriate among of microbial organisms were allocated to the agar Conical flask
Approximately 85ml of 1% sulphuric acid was poured into a conical flask. With the use of a volumetric pipette 0.5ml of 1.1175% barium chloride was then added to the conical flask. Soon after 1% sulphuric acid was poured into the conical flask to bring the volume up to 100ml and it was stirred until there were no clumps present. 10ml of the barium sulphate precipitate was poured into two test tubes and they were capped using paper caps. The test tubes were securely wrapped in aluminum foil and kept at room temperature.
Disc Diffusion Test
Procedure
Under good aseptic conditions, the prepared standard the test tubes containing 10ml sterilized water were placed into the cabinet. An inoculating loop was flamed red hot and allowed to cool. It was used to gently remove a small amount of bacteria culture from the sub-cultures (either Klebsiella pneumoniae, Pseudomonas aeruginosa or Staphylococcus aureus) and was placed into one of the test-tubes containing 10mL sterilized water. The tube was flamed after the stopper was removed and before it was recapped.
The test tube was shaken gently in a side to side manner, thus allowing the bacteria to better diffuse throughout the solution. It was then compared with the McFarland turbidity solution. As long as the content of the prepared tube appeared similar to that of the McFarland solution the appropriate label was placed onto the tube. This above steps were done for the two other bacteria species. On removal of the cotton stopper, the tube was flamed and the sterile cotton applicator was dipped into the test tube containing the bacterial culture of known and then swabbed uniformly onto the surface of the agar and was allowed to dry for 5 minutes.
5mm discs were punched from Whatman no 1 filter paper using a paper puncher after which they were sterilized in a petri plate under ultra violet light provided by the laminar air-flow cabinet for 20 minutes. The discs were then placed into petri dishes containing the 100% concentrations of methanol and hexane extracts of the selected plants. In a similar manner negative controls were prepared; they were allowed to soak in the pure extraction solvents (methanol and hexane). The positive control for the bacteria being the both the 500mg Ampicillin and 500mg Erythromycin in 20ml sterilized water, the filter paper disks were soaked in both the Ampicillin and Erythromycin solutions.
The soaked disks along with the negative control and the positive controls, the ampicillin and erythromycin antibiotic discs were arranged on the agar plate with equal spacing between each disc via the use of sterile tweezers. This was repeated for each bacteria with 100%, 75%, 50%, 25%, 10% and 5% concentrations of methanol and hexane extract of Cyanthillium cinereum and Moringa oleifera. The plates were kept for incubation at 37°C for 24 hrs. At the end of incubation period, inhibition zones formed around the disk were measured with transparent ruler in millimeter. NB. These studies were done in triplicates.
Phytochemical analysis
Phytochemical analysis were carried out on all extracts to note its content within each plant.
Alkaloids
2 ml of extract was measured in a test tube to which picric acid solution was added. An orange coloration indicated the presence of alkaloids (Wadood, 2013).
Tannins
To a portion of the extract diluted with water, 3-4 drops of 10% ferric chloride solution is added. A green colour indicates for catecholic tannins (Wadood, 2013).
Saponins
0.5 ml of extract was measured in a test tube and was shaken with 2 ml of water. If foam produced persists for ten minutes it indicates the presence of Saponins (Wadood, 2013).
Flavonoids
4ml of extract solution was treated with 1.5 ml of 50% methanol solution. The solution was warmed and magnesium ribbon was added. To this solution, 5-6 drops of concentrated hydrochloric acid was added and an orange colour for flavones (Wadood, 2013).
Volatile oils
2ml of extract was shaken with 0.1ml dilute NaOH and a small quantity of dilute HCl. A white precipitate is formed if volatile oils are present (Wadood, 2013).
Phenols
1ml of extracts was treated with 3-4 drops of ferric chloride solution. Formation of bluish-black colour indicates the presence of phenols (Wadood, 2013).
Steroids
1ml of extract was treated with 0.5 ml of acetic anhydride and 0.5 ml of chloroform. Then concentrated solution of sulphuric acid was added slowly. A green bluish colour indicated positive for steroids (Wadood, 2013).
It can be seen that the C. cinereum extract of the methanol showed positive for all the phytochemicals (alkaloids, catecholic tannins, saponins, flavones, volatile oils phenols and steroids) as compared to the other extracts (Table 1).
Table (1):
Shows the results obtained during phytochemical analysis of the various extracts.
Phytochemical test |
Sample 1: C. cinereum + Methanol |
Sample 2: M. oleifera + Methanol |
Sample 3: C. cinereum + Hexane |
Sample 4: M. oleifera + Hexane |
|---|---|---|---|---|
Alkaloids |
Present |
Present |
Absent |
Absent |
Tannins (Catecholic-green) |
Present |
Absent |
Present |
Present |
Saponins |
Present |
Absent |
Present |
Absent |
Flavones (orange) |
Present |
Absent |
Present |
Absent |
Volatile oils |
Present |
Absent |
Absent |
Absent |
Phenols |
Present |
Absent |
Absent |
Absent |
Steroids |
Present |
Present |
Present |
Present |
The methanol and hexane extracts from Cyanthillium cinereum (Inflammation bush) and Moringa oleifera (Saijan plant) were tested against selected bacteria to observe their inhibitory effect on the growth of the bacteria colonies. The mean and standard deviation for each extract was calculated in addition to ANOVA two-factor without replication analysis was conducted on each extrac using the Microsoft Excel 2013.
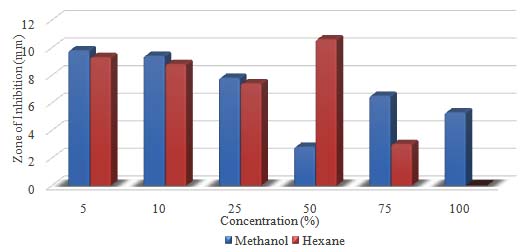
The largest zone was obtained with the hexane extract with a mean of 22.1mm at 5% concentration and the smallest zone was 6.9mm at 75%. However, the largest zone for methanol extract was 14.8mm at 5% and the smallest was 10.6mm at 25% (Table 2). The P-value obtained from the ANOVA two-factor without replication analysis was 0.47, which means that the extracts of the C. cinereum were not statistically significant in zones observed for the S. aureus (Table 3).
Table (2):
Shows the Mean and Standard deviation for methanol and hexane extracts for C. cinereumat 100%, 75%, 50%, 25%, 10% and 5% concentration against S.aureus.
| Concentration % | zone of inhibition (mm) | |
|---|---|---|
| Methanol | Hexane | |
| 5 | 14.8±1.8 | 22.1±2.1 |
| 10 | 13.3±1.2 | 13.0±5.2 |
| 25 | 10.6±1.6 | 16.0±3.4 |
| 50 | 12.3±2.0 | 11.4±4.4 |
| 75 | 14.2±0.9 | 6.9±5.1 |
| 100 | 13.1±3.8 | 9.8±3.3 |
Table (3):
Shows the results obtained from the ANOVA analysis for methanol and hexane extracts for C. cinereumat 100%, 75%, 50%, 25%, 10% and 5% concentration against S.aureus.
ANOVA |
||||||
|---|---|---|---|---|---|---|
Source of Variation |
SS |
df |
MS |
F |
P-value |
F crit |
Between groups |
78.8975 |
5 |
15.7795 |
1.070559 |
0.471091 |
5.050329 |
Within group |
0.0675 |
1 |
0.0675 |
0.00458 |
0.948669 |
6.607891 |
Error |
73.6975 |
5 |
14.7395 |
|||
Total |
152.6625 |
11 |
Table (4):
Shows the Mean and Standard deviation for methanol and hexane extracts for M. oleifera at 100%, 75%, 50%, 25%, 10% and 5% concentration against S.aureus.
| Concentration % | zone of inhibition (mm) | |
|---|---|---|
| Methanol | Hexane | |
| 5 | 14.9±0.9 | 14.4±3.8 |
| 10 | 13.2±2.0 | 13.2±1.9 |
| 25 | 1.3±2.4 | 12.3±1.4 |
| 50 | 1.9±2.8 | 9.4±4.6 |
| 75 | 1.9±2.8 | 3.8±4.1 |
| 100 | 4.5±2.9 | 5.6±5.0 |
The largest zone was obtained with the methanol extract with a mean of 14.9mm at 5 % concentration and the smallest zone for methanol was 1.3mm at 25%. The hexane’s largest zone was 14.4mm at 5%. The smallest for the hexane was 3.8mm at 75% (Table 4). The P-value obtained from the ANOVA two-factor without replication analysis was 0.05, which means that the extracts of the M. oleifera were statistically significant in zones observed for the S. aureus (Table 5).
Table (5):
Shows the results obtained from the ANOVA analysis for methanol and hexane extracts for M. oleifera at 100%, 75%, 50%, 25%, 10% and 5% concentration against S.aureus.
ANOVA |
||||||
|---|---|---|---|---|---|---|
Source of Variation |
SS |
df |
MS |
F |
P-value |
F crit |
Between groups |
118.8942 |
5 |
23.77883 |
4.815966 |
0.054747 |
5.050329 |
Within group |
29.7675 |
1 |
29.7675 |
6.028861 |
0.057555 |
6.607891 |
Error |
24.6875 |
5 |
4.9375 |
|||
Total |
173.3492 |
11 |
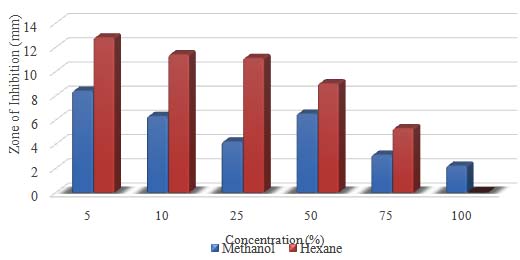
The largest zone was observed with the hexane extract with a mean of 14.6mm at 10% concentration where the smallest being 0.0mm at 50, 75 and 100%. However, the largest zone for the methanol was 11.3mm at 5% conc. and the smallest being 3.6mm at 75% conc. (Table 6). The P-value obtained from the ANOVA two-factor without replication analysis was 0.14, which means that the extracts of the C. cinereum were not statistically significant in zones observed for the P. aeruginosa (Table 7).
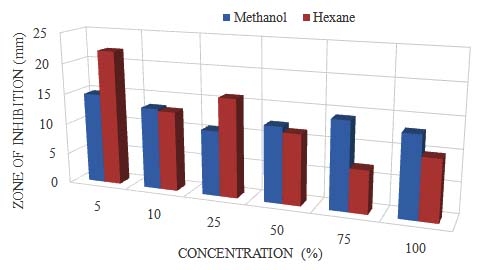
Graph 1. Showing the difference in zone of inhibition at different conc. for methanol and hexane extracts of C.cinereum Anova: P-value= 0.47, no stat sig.
Table (6):
Specific growth rate of microalgae in normal medium and nitrogen enriched medium.
| Concentration % | zone of inhibition (mm) | |
|---|---|---|
| Methanol | Hexane | |
| 5 | 11.3±3.1 | 12.9±3.2 |
| 10 | 10.6±2.4 | 14.6±3.3 |
| 25 | 11±2.5 | 12.9±3.9 |
| 50 | 10.4±1.2 | 0.0±0.0 |
| 75 | 3.6±3.8 | 0.0±0.0 |
| 100 | 7.8±4.1 | 0.0±0.0 |
Table (7):
shows the results obtained from the ANOVA analysis for methanol and hexane extracts for C. cinereum at 100%, 75%, 50%, 25%, 10% and 5% concentration against P. aeruginosa.
ANOVA |
||||||
|---|---|---|---|---|---|---|
Source of Variation |
SS |
df |
MS |
F |
P-value |
F crit |
Between groups |
233.2575 |
5 |
46.6515 |
2.743426 |
0.146116 |
5.050329 |
Within groups |
17.04083 |
1 |
17.04083 |
1.002117 |
0.362753 |
6.607891 |
Error |
85.02417 |
5 |
17.00483 |
|||
Total |
335.3225 |
11 |
Table (8):
Shows the Mean and Standard deviation for methanol and hexane extracts for M. oleifera at 100%, 75%, 50%, 25%, 10% and 5% concentration against P. aeruginosa.
| Concentration % | zone of inhibition (mm) | |
|---|---|---|
| Methanol | Hexane | |
| 5 | 13.3±3.2 | 13.1±2.8 |
| 10 | 13.3±3.5 | 11.1±3.8 |
| 25 | 9.2±3.4 | 12.1±2.1 |
| 50 | 8.8±3.4 | 0.0±0.0 |
| 75 | 5.9±5.2 | 0.0±0.0 |
| 100 | 1.0±2.3 | 0.0±0.0 |
The largest zone was obtained with the methanol extract with a mean of 13.3mm at 5% conc., where the smallest zone for methanol was 1.0mm at 100% conc. The hexane’s extract had a zone of 13.1mm at 5%. (Table 8). The P-value obtained from the ANOVA two-factor without replication analysis was 0.03, which means that the extracts of the M. oleifera were statistically significant in zones observed for the P. aeruginosa (Table 9).
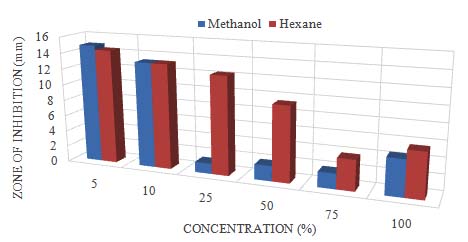
Graph 2. Showing the difference in zone of inhibition at different conc. for methanol and hexane extracts of M. oleifera. Anova: P-value= 0.05, stat sig.
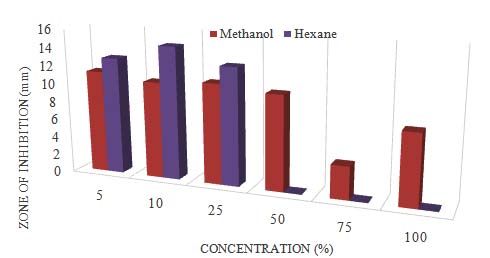
Graph 3. Showing the difference in zone of inhibition at different conc. for methanol and hexane of C. cinereum ANOVA: P-value= 0.14, no stat sig.
Table (9):
Shows the results obtained from the ANOVA analysis for methanol and hexane extracts for M. oleifera at 100%, 75%, 50%, 25%, 10% and 5% concentration against P. aeruginosa.
ANOVA |
||||||
|---|---|---|---|---|---|---|
Source of Variation |
SS |
df |
MS |
F |
P-value |
F crit |
Between groups |
287.2267 |
5 |
57.44533 |
6.525407 |
0.030121 |
5.050329 |
Within groups |
19.25333 |
1 |
19.25333 |
2.18705 |
0.199236 |
6.607891 |
Error |
44.01667 |
5 |
8.803333 |
|||
Total |
350.4967 |
11 |
The largest zone was observed with the hexane extract with a mean of 10.6mm at 50% concentration with 9.3mm at 5% and the smallest for the extract was 0.0mm at 100% conc. the methanol extract had zone of 9.8% at 5% conc. and 5.3% at the 100% conc. (Table 10). The P-value obtained from the ANOVA two-factor without replication analysis was 0.36, which means that the extracts of the C. cinereum were not statistically significant in zones observed for the K. pneumoniae (Table 11).

Graph 4. Showing the difference in zone of inhibition at different conc. for methanol and hexane extracts of M. Oleifera ANOVA: P-value= 0.03, stat sig.
Graph 5. Showing the difference in Zone of Inhibition at different conc. for methanol and hexane extracts of C.cinereum ANOVA: P-value= 0.36, no stat sig.
Table (10):
Shows the Mean and Standard deviation for methanol and hexane extracts for C. cinereum at 100%, 75%, 50%, 25%, 10% and 5% concentration against K. pneumoniae.
| Concentration % | zone of inhibition (mm) | |
|---|---|---|
| Methanol | Hexane | |
| 5 | 9.8±3.0 | 9.3±3.9 |
| 10 | 9.4±2.3 | 8.8±5.6 |
| 25 | 7.8±3.1 | 7.4±4.6 |
| 50 | 2.8±5.0 | 10.6±3.4 |
| 75 | 6.5±5.5 | 3.0±3.1 |
| 100 | 5.3±5.9 | 0.0±0.0 |
Table (11):
Shows the results obtained from the ANOVA analysis for methanol and hexane extracts for C. cinereum at 100%, 75%, 50%, 25%, 10% and 5% concentration againstK. pneumoniae.
ANOVA |
||||||
|---|---|---|---|---|---|---|
Source of Variation |
SS |
df |
MS |
F |
P-value |
F crit |
Between groups |
69.7875 |
5 |
13.9575 |
1.383186 |
0.365277 |
5.050329 |
Within groups |
0.520833 |
1 |
0.520833 |
0.051615 |
0.829274 |
6.607891 |
Error |
50.45417 |
5 |
10.09083 |
|||
Total |
120.7625 |
11 |
The largest zone was observed with the hexane extract with a mean of 12.8mm at 5% concentration and the smallest for that extract was 0.0mm at 100% conc. The largest and smallest zone for methanol were 8.4mm and 2.2mm respectively for 5% and 100% conc. (Table 12). The P-value obtained from the ANOVA two-factor without replication analysis was 0.05, which means that the extracts of the M. oleifera were statistically significant in zones observed for the K. pneumoniae (Table 13).
Graph 6. Showing the difference in zone of inhibition at different conc. for methanol and hexane extracts of M. oleifera ANOVA: P-value= 0.05, stat sig.
Table (12):
Shows the Mean and Standard deviation for methanol and hexane extracts for M. oleifera at 100%, 75%, 50%, 25%, 10% and 5% concentration against K. pneumoniae.
| Concentration % | zone of inhibition (mm) | |
|---|---|---|
| Methanol | Hexane | |
| 5 | 8.4±3.0 | 12.8±4.3 |
| 10 | 6.3±4.3 | 11.4±3.9 |
| 25 | 4.2±5.4 | 11.1±2.6 |
| 50 | 6.5±3.8 | 9.0±2.4 |
| 75 | 3.1±3.0 | 5.3±2.0 |
| 100 | 2.2±4.0 | 0.0±0.0 |
Table (13):
Shows the results obtained from the ANOVA analysis for methanol and hexane extracts for M. oleifera at 100%, 75%, 50%, 25%, 10% and 5% concentration againstK. pneumoniae.
ANOVA |
||||||
|---|---|---|---|---|---|---|
Source of Variation |
SS |
df |
MS |
F |
P-value |
F crit |
Between groups |
118.8942 |
5 |
23.77883 |
4.815966 |
0.054747 |
5.050329 |
Within groups |
29.7675 |
1 |
29.7675 |
6.028861 |
0.057555 |
6.607891 |
Error |
24.6875 |
5 |
4.9375 |
|||
Total |
173.3492 |
11 |
Table (14):
showing the correlation (Pearson) between the solvents and the concentration.
Bacteria |
Plant |
Solvent |
Correlation |
Significance (0.707) |
|---|---|---|---|---|
S. aureus |
C. cinereum |
Methanol |
0.0133 |
No stat. sign. |
Hexane |
-0.7840 |
Stat. sign |
||
M. oleifera |
Methanol |
-0.6351 |
No stat. sign. |
|
Hexane |
-0.9393 |
Stat. sign. |
||
P. aeruginosa |
C. cinereum |
Methanol |
-0.7244 |
Stat. sign. |
Hexane |
-0.8928 |
Stat. sign. |
||
M. oleifera |
Methanol |
-0.9729 |
Stat. sign. |
|
Hexane |
-0.8918 |
Stat. sign. |
||
K. pneumoniae |
C. cinereum |
Methanol |
-0.6824 |
No stat. sign. |
Hexane |
-0.8344 |
Stat. sign. |
||
M. oleifera |
Methanol |
-0.8295 |
Stat. sign. |
|
Hexane |
-0.9730 |
Stat. sign. |
The analysis in Table 14 which shows the correlation (Pearson) between the solvents and the concentration was analyze using the Microsoft Excel 2013 and Statistix 10.0 (2013). Where the hexane extracts for both plants showed significant correlation with the zone of inhibition against all three bacteria. However, the methanol extracts showed significant correlation with the zone of inhibition against only P. aeruginosa for both plants and K. pneumoniae for M. oleifera. The values for the zone of inhibition in the three Bar graphs below is the mean values of the four treatments.

Graph 7. Showing the difference in zone of inhibition for natural and synthetic antibiotics against S.aureus
Bar graph 7 indicates that the Ampicillin was more significantly effectiveness against S. aureus then the rest of treatments, followed by Erythromycin, then C. cinereum and the least effective being M. oleifera.
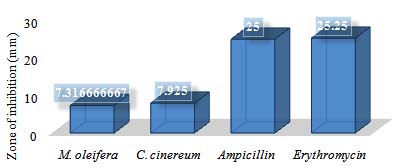
Graph 8. Showing the difference in zone of inhibition for the natural and synthetic antibiotics against P. aeruginosa
Bar graph 8 indicates that Ampicillin and Erythromycin showed a more significant effectiveness against P. aeruginosa with inhibitory zones of 25mm and 25.25mm respectively. The C. cinereum and M. oleifera showed 7.925mm and 7.316mm respectively.
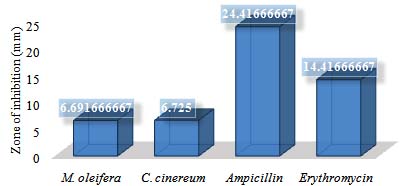
Graph 9. Showing the difference in zone of inhibition for natural and synthetic antibiotics against K. pneumoniae
Bar graph 9 indicates that Ampicillin treatment showed a greater effect against K. pneumoniae with 24.416mm zone of inhibition compared to that of erythromycin, C. cinereum and M. oleifera with 14.416mm, 6.725mm and 6.691mm respectively.
Plants with medicinal properties have the ability to heal and to cure many human associated diseases due to the presence of bioactive compounds, which is better known as phytochemical compounds/constituents (Wadood, et al., 2013). These phytochemicals add no nutrition value to the plant, in which it is found; thus it’s also termed non-nutritive chemicals (Berardi, 2017). Phytochemicals occur naturally leaves, stem, roots, fruits and flowers of many plants; which when used individually or combined may safe guard the body against harmful bacteria (Wadood, et al., 2013). These phytochemicals are divided into primary and secondary compounds; such as (chlorophyll, proteins and sugar) and (alkaloids phenolic saponins). The various phytochemical compounds whether primary or secondary exhibits important pharmacological abilities such as anti-viral, anti-inflammatory, anti-bacterial and even anti-cancer (Wadood, et al., 2013). However, plants are more so enriched with the secondary compounds (Cowan, 1999), thus the reason why the secondary metabolites are more focused on for this research. So as this experiment was conducted, the first thing that was done, was figuring out if C. cinereum and M. oleifera have any phytochemicals. So the phytochemical analysis was done. The methanol extract of C. cinereum showed presence of alkaloids, catecholic tannins, saponins, flavones, volatile oils phenols and steroids; all of which have many beneficial properties including anti-bacterial properties. This would account for the inhibitory effect seen in the extracts. These findings supports the research done by Cowan in 1999; where it was mentioned that plants are enriched with a variety of secondary metabolites such as those found above. It also corresponds to the findings of Guha et al., 2009. Where they focused on “Therapeutic Potential of Polar and Non-Polar Extracts of Cyanthillium cinereum In Vitro.”
However, the methanol extract of M. oleifera only had alkaloids and steroids. The hexane extract of C. cinereum showed presence of Catecholic-tannins, saponins, flavones and steroids. However, the hexane extract of M. oleifera showed presence of only catecholic-tannins and steroids. They all have unique ways that aids in the destruction of microorganisms; some like saponins may affect the bacterial cell wall permeability, which in turn allow other phytochemicals such as flavones or flavonoids which have anti-inflammatory, antimicrobial to destroy the cell or it constituents (Jacob et al., 2009) and (Havesteen et al., 1983). Other phytochemicals; phenol among others, target the DNA of gram negative bacteria such as K. pneumoniae and P. aeruginosa thus destroying the cell/s (Cueva, 2010).
Antibiotics are medicines which has the ability to hinder the growth of or destroy microorganisms/microbes (Davis, 2017). The providence of antibiotics from phytochemicals such as those mentioned above, are obtained from natural sources and as such they are referred to as natural antibiotics. And as mentioned before they can be obtained from various plant parts (Chan, 2011). However, the phytochemicals along with other microorganisms are manufacture synthetically to be used as antibiotics and are referred to synthetic antibiotics. In other words they are laboratory-based chemical synthesis of natural sources (Chan, 2011). They are highly active, thus overuse and misuse can cause many serious side effects; such as antibiotic resistance, allergies and damage to vital organs. The natural antibiotics on the other hand, are safer as it relates to short and long term effects on the human body (Chan, 2011). Also the human body is inhibited with what is referred to as “good bacteria”. Such bacteria have a mutualistic relationship our body. An example of such bacteria are Lactobacillus johnsonii, found in the gut and makes the process of milk digestion smoother. And such bacteria among others are constantly being harmed with the use of synthetic antibiotics, because as the antibiotics is administered either by rubs, oral, or injection, it has no regards as to whether the bacteria is beneficial or non-beneficial (Chan, 2011). In addition to the benefits of natural antibiotics, it not only kill or hinder the growth of the bacteria but they also enhancing the body’s natural capacity to fight off such bacterial infections in the future (Chan, 2011).
This research project took the form of a comparative study that incorporated the “Multi-factorial design”, reason being the number of factors and parameters investigated. Such factors; three bacteria (K. pneumoniae, P. aeruginosa and S. aureus) treated with six concentrations (100%, 75%, 50%, 25%, 10% and 5%) extracted by two solvents (methanol and hexane) from the two selected plants (Cyanthillium cinereum and Moringa oleifera). To facilitate main effect, interaction, and graph and statistical comparsion of the multi-factor design (Piper, 2012), analysis such as ANOVA two-factor without replication, regression and correlation were done.
The effects of extracts from C. cinereum and M. oleifera were conducted using disk diffusion susceptibility method (Hudzicki, 2009). Comparison of the P-values of the extracts indicated that the extracts of M. oleifera had greater variation among the zones of inhibition compared to the extracts of C. cinereum. However, the C. cinereum hexane extract showed the largest zone of 22.1mm at 5% concentration against S. aureus as compared to the M. oleifera extracts that also showed the most effectiveness against S. aureus than the other two bacteria; this may be due to the presence of the phytochemicals found from the previous phytochemical analysis. The M. oleifera, on the other hand, was also most effective against the bacterium S. aureus than the other bacteria but only achieved an inhibitory zone of 14.9mm in diameter at 5% concentration.
It was indicated that as the concentration increase (5%-100%) the effectiveness of the extracts seems to decrease. This is due to three factors concentration (viscosity), solubility and particle size (Hudzicki, 2009). After the soaked disks were placed onto the selected agar (Mueller-Hinton is preferred for this type of experiment because it is not selective; any microorganism can grow) water moves from the agar into the disks (this maybe as a result of osmosis) and the antibiotics that is embedded in the disk diffuses through the agar (Hudzicki, 2009). However, the rate at which the antibiotic moves through the agar decreases as it moves further away from the source (disk); thus the concentration highest in close proximity to the disk, this being due to the diffusion and molecular/particle size of the extract (Hudzicki, 2009). The third factor being the solubility properties of the extract also affects the zone of inhibition (Hudzicki, 2009). This explains not only the decrease in zone sizes but also explains why some hexane extracts showed not result at the higher concentrations (50%, 75% and 100%). The hexane evaporates very rapidly causing the extract to become thick thus decreasing the rate of diffusion at the higher concentrations of the crude extract.
The (Pearson) correlation analysis also supported the increase in concentration with the rate of diffusion. The purpose of running a correlation analysis is basically to outline the relationship between two continuous variables (Zou et al., 2003). In this case the two variables are the concentration and zone of inhibition. Based on the correlation analysis, the results indicates that the concentration of the extract is indirectly proportional to the zone of inhibition. This is as a result of the correlation coefficient values obtained from the analysis being larger than that of the reference value which is 0.707. As long as the correlation coefficient value is larger than the reference/standard value (0.707) the more significantly correlated the values are and the difference in signs (positive or negative) indicates direction of the relationship (Zou et al., 2003).
This study provides evidence that both C. cinereum and M. oleifera have antibiotic properties that can be used to hinder the growth of bacteria. The hexane extracts of C. cinereum had a statistically significant effect against the gram positive bacterium (S. aureus) than K. pneumoniae, P. aeruginosa (gram negative bacteria). Similarly, M. oleifera extracts was most effectiveness against S. aureus than the other two bacteria. As related to the potency of natural antibiotics, the C. cinereum was more effective against all three bacteria than the M. oleifera. However, based on overall susceptibility of the bacteria, Ampicillin followed by Erythromycin showed a significant potency against S. aureus, K. pneumoniae and P. aeruginosa compared to the potency of C. cinereum and M. oleifera.
ACKNOWLEDGMENTS
I would like to extend words of gratitude to GOD for the wisdom, strength and the provision of the many medicinal plants that was made available for us. I would also like to thank my family, Mrs. Ruth Daniel (Supervisor), Mr. Elford Liverpool, Prof. Abdullah Ansari, Mr. Yugraj Crepaul, Mr. Seon Homer, Mr. Randy (IAST/Food and Drug), and my friends.
CONFLICT OF INTEREST
The authors declare that there is no conflict of interest.
AUTHORS’ CONTRIBUTION
All authors listed have made a substantial, direct and intellectual contribution to the work, and approved it for publication.
FUNDING
None.
ETHICS STATEMENT
Not Applicable.
AVAILABILITY OF DATA
All datasets generated or analyzed during this study are included in the manuscript.
- American Chemical Society International Historic Chemical Landmarks., Discovery and Development of Penicillin, 2015 . http://www.acs.org/content/acs/en/education/whatischemistry/landmarks/flemingpenicillin.html, on August 11, 2017.
- Berardi J PhD. The power of the phytochemicals, 2017. Retrieved from http://www.precisionnutrition.com/phytochemicals, on September 5, 2017.
- Bhalodia NR and Shukla VJ. Antibacterial and antifungal activities from leaf extracts of Cassia fistula l.: An ethnomedicinal plant, 2011. Retrieved November 27, 2016 from https://www.ncbi.nlm.nih.gov/pmc/articles/PMC3217694/ .
- Bonev B, Hooper J and Parisot J. Principles of assessing bacterial susceptibility to antibiotics using the agar diffusion method, 2008. Retrieved from https://academic.oup.com/jac/article-lookup/doi/10.1093/jac/dkn090, on September 16, 2017.
- Chan LM. Natural Antibiotics Versus Synthetic Antibiotics, 2011. Retrieved from http://ezinearticles.com/?Natural-Antibiotics-Versus-Synthetic-Antibiotics&id=5715709, on July 28, 2017.
- Cox R. Bacteria infection 101, 2016. Retrieved from http://www.onhealth.com/content/1/bacterial_infections, on August 3, 2017.
- Cueva C, Moreno-Arribas MV, Martin-Alvarez PJ, Bills G, Vicente MF, Basilio A, Rivas CL, Requena T, Rodriguez JM, Bartolome B. “Antimicrobial activity of phenolic acids against commensal, probiotic and pathogenic bacteria” Pudmed.gov., 2010.
Crossref - Davis V. Natural Antibiotics vs Synthetic Antibiotics, 2017. Retrieved from http://www.betterhealthfacts.com/2017/02/natural-vs-synthetic-antibiotics.html, on August 4, 2017.
- Devault N. What Is the Difference Between Good Bacteria & Bad Bacteria?, 2017. Retrieved from http://www.livestrong.com/article/29090-good-uses-bacteria/, on August 3, 2017.
- Dr Knott L, Whitehall J and Dr Huins H. Antibiotics. 2014. Retrieved November 26, 2016.
- Dr Desai R. Antimicrobial Resistance (AMR), 2016. Retrieved from http://drrajivdesaimd.com/2016/11/20/antimicrobial-resistance-amr/, on August 20, 2017.
- Encyclopedia Britannica, Evolution of bacteria, 2017. Retrieved from https://www.britannica.com/science/bacteria/Evolution-of-bacteria, on August 3, 2017.
- Explorable, History of Antibiotics, 2010. Retrieved Nov 26, 2016 from Explorable.com:
Crossref - Guyana Chronicle, treating bacterial infection, 2015. Retrieved from https://guyanachronicle.com/2015/12/13/treating-bacterial-infection, on September 14, 2017.
- Havsteen B. “Flavonoids, a class of natural products of high pharmacological potency”. Biochem. Pharmacol., 1983; 32: 1141–8.
Crossref - Hudzicki J. Kirby-Bauer Disk Diffusion Susceptibility Test Protocol, 2009. Retrieved from http://www.asmscience.org/content/education/protocol/protocol.3189, on September 10, 2017.
- Jacob MC, Favre M and Bensa JC. “Membrane cell permeabilisation with saponin and multiparametric analysis by flow cytometry,” Cytometry, 1991; 12(6) pp. 550–558, 1991.
Crossref - Kohanshi M, Dwyer D and Collins J. How antibiotics kill bacteria: from targets to networks, 2010. Retrieved from https://www.ncbi.nlm.nih.gov/pmc/articles/PMC2896384/, on September 17, 2017.
- Martinez JL. Natural Antibiotic Resistance and Contamination by Antibiotic Resistance Determinants: The Two Ages in the Evolution of Resistance to Antimicrobials, 2012.
Crossref - Piper BJ. Factorial design, 2012. Retrieved from https://www.slideshare.net/bpiper74/research-methods-multifactorial-design, on August 8, 2017.
- Rikki K. Pathogenic bacteria and infectious diseases, 2016. Retrieved form https://www.microbiologyinpictures.com/introduction.html, on August 11, 2017.
- Rogers K and Kadner RJ. Bacteria, 2017. Retrieved from https://www.britannica.com/science/bacteria, on August 3, 2017.
- Sydney S, Lacy RW and Bakhtiar M. “In: The Betalactam antibiotics Penicillin and Cephalosporin in perspective”. Hodder and stongton, London, 1980; pp. 224.
- Vancouver Island Health Authority, InfectionNet, Introduction to Antibiotics, 2014. Retrieved November 26, 2016.
- Vermani K and Garg S. “Herbal medicine for sexually transmitted diseases and AIDS” J. Ethnopharmacol., 2002; 80: 49-66.
Crossref - Vidyasagar A. What are bacteria?, 2015. Retrieved from https://www.livescience.com/51641-bacteria.html, on August 3, 2017.
- Vinel A and Pialoux J. Ancient Egyptian Medicine and traditional Chinese medicine, 2005; pp 6-20
- Wadood A, Ghufran M, Jamal SB, Naeem M, Khan A. Phytochemical Analysis of Medical Plants Occurring in local Area of Maedan. Biochem Anal Biochem., 2013; 2: 144.
Crossref - World Health Organization (WHO), World Antibiotic Awareness week, 2015. Retrieved from http://www.paho.org/guy/index.php?option=com_content&view=article&id=262:antibiotic&Itemid=0, on September 3, 2017.
- Zou KH (PhD), Tuncali K (MD), Silverman SG (MD). Correlation and Simple Linear Regression, 2003.
© The Author(s) 2020. Open Access. This article is distributed under the terms of the Creative Commons Attribution 4.0 International License which permits unrestricted use, sharing, distribution, and reproduction in any medium, provided you give appropriate credit to the original author(s) and the source, provide a link to the Creative Commons license, and indicate if changes were made.