

ISSN: 0973-7510
E-ISSN: 2581-690X
Coronavirus disease 2019 (COVID-19), caused by severe acute respiratory syndrome coronavirus – 2 (SARS-CoV-2), was declared a global pandemic on 11th March, 2020 by World Health Organization. As of now,27th May,2020, there are about 54,88,825 infected cases and 3,49,095 deaths globally. Coronavirus samples collected from all the countries have been sequenced for advanced studies in a bid to understand the structure and functioning of the virus. In our study we have tried working on every available sequence to setup both comparisons and co-relations. There is no such available study as of now for reference and hence it can become a pioneer stone in this direction. The mortality rate calculated turns out to be 9.19%,34.37% and 6.29% for SARS-2003, MERS-2012 and COVID-19 respectively. The basic reproduction rate R0 was 2-5 for SARS-2003, 0.3-0.8 for MERS-2012 and 1.4-5.7 for COVID-19. We found out the relation between number of mutations and mortality as well as phylogenetic relations. High number of mutations corresponded to higher mortality rate as in countries like Italy and Spain. Alpha and Beta-coronaviruses show a common ancestor from which they descended. Brazil and Iran have shown similar phylogenetic descent explaining their mortality rate. India however showed a distant relation from the common ancestor of other genome sequences. This study highlights the mutations of the SARS-CoV2 virus as well as sets up a comparison with the previous outbreaks. Similar type of studies should be conducted when more genome samples are present. These results can also contribute towards making an effective anti-viral therapy and vaccines.
COVID-19, Coronavirus, Genome Sequence, Mutations, Phylogeny
SARS-Cov2 is the causative organism of Coronavirus disease 2019 (COVID-19) which was declared a global pandemic on 11th March,2020 by World Health Organization As of now, 27th May,2020, there are about 54,88,825 infected cases and 3,49,095 deaths globally1. The exorbitant loss to humanity is still being faced and without any potential treatment or vaccine, it can cause further losses as well. Virus samples collected from all the countries have been sequenced for advanced study in a bid to understand the structure and functioning of the virus. Amino acid lysine Lys417 helps in salt-bridge formation between receptor-binding domain of spike glycoprotein of SARS-CoV2 and angiotensin converting enzyme 2 ACE2 receptor and is believed to be the reason for strong binding affinity of SARS-CoV2 as this was absent in SARS-CoV11. This can explain its high infectivity making genome studies more important.
Knowledge of mutations and phylogeny helps to understand the variations and its effects. Comparing genome sequences of the current virus to its previous outbreaks, can provide important changes which account for its high infectivity. Genome sequence which was difficult on large sequences has now become easier because of computational software. In our study we have tried working on every available sequence to setup both comparisons and co-relations. There is no such available study as of now for reference and hence it can become a pioneer stone in this direction. The aim of this study is to highlight the relations between the genome sequences collected so far from all over the world and answer questions regarding variable effects caused by its infections in different countries. These results can be used to modify vaccine studies as a single vaccine cannot target various variable genome sequences at a time. These genome differences ultimately show changes in protein sequences which might help understanding mechanisms to weaken the virus a or reduce its infectivity.
The genome sequences in this entire study were downloaded on 13th April,2020 from GenBank [2] which is produced and maintained by the National Center for Biotechnology Information as part of the International Nucleotide Sequence Database Collaboration. Software used were Unipro Ugene [3]. The genomes included in this study along with their accession number are listed as follows:
DQ182595 |SARS coronavirus ZJ0301 from China (2003) [SARS-CoV1]
KF600652 |Middle East respiratory syndrome coronavirus isolate RIYADH_2_2012 [MERS-CoV]
MT259228 |Severe acute respiratory syndrome coronavirus 2 isolate SARS-CoV-2/human/CHINA [Wuhan]
MT012098 |Severe acute respiratory syndrome coronavirus 2 isolate SARS-CoV-2/human/INDIA/29/2020 [India]
MT320891 |Severe acute respiratory syndrome coronavirus 2 isolate SARS-CoV-2/human/IRAN [Iran]
MT072688 |Severe acute respiratory syndrome coronavirus 2 isolate SARS-CoV-2/human/NEPAL [Nepal]
MT262993 |Severe acute respiratory syndrome coronavirus 2 isolate SARS-Cov-2/human/PAKISTAN [Pakistan]
MT304475 |Severe acute respiratory syndrome coronavirus 2 isolate SARS-CoV-2/human/SOUTH_KOREA [South Korea]
MT325611 |Severe acute respiratory syndrome coronavirus 2 isolate SARS-CoV-2/human/USA [USA]
MT328035 |Severe acute respiratory syndrome coronavirus 2 isolate SARS-CoV-2/human/GREECE [Greece]
MT077125 |Severe acute respiratory syndrome coronavirus 2 isolate SARS-CoV-2/human/ITALY [Italy]
MT292574 |Severe acute respiratory syndrome coronavirus 2 isolate SARS-CoV-2/human/SPAIN [Spain]
MT126808 |Severe acute respiratory syndrome coronavirus 2 isolate SARS-CoV-2/human/BRAZIL [Brazil]
NC_028752.1 Camel alphacoronavirus isolate camel/Riyadh/Ry141/2015 [Alpha]
NC_045512.2 Severe acute respiratory syndrome betacoronavirus 2 isolate Wuhan [Beta]
NC_039208.1 Porcine deltacoronavirus HKU15 strain HKU15-155 [Delta]
EU714029.1 Infectious bronchitis gammacoronavirus isolate SC021202 [Gamma]
For COVID-19 study, only one genome sequences from each region were chosen to avoid complexity of analysis. Genome sequences 14-17 were downloaded on 13th April,2020 from the website of GenBank, National Institute of Biotechnology Information (NCBI) [2] maintained by National Institute of Health (NIH), USA.
These genome sequences were divided into sets for comparison:
- Genome sequence 1,2 and 3
- Genome sequence 3-13
- Genome sequence 14-17
Sequences in each set were aligned using Unipro Ugene’s MUSCLE plugin [3] and gaps were excluded while checking for dissimilarity. Phylogenetic tree was constructed by using PHYLIP Neighbour Joining plugin [3] in Unipro Ugene.
Every genome sequence was translated into amino acid sequence which were then compared in the same way:
- Translation of genome sequence 1,2 and 3
- Translation of genome sequence 3-13
- Translation of genome sequence 14-17
Sequences in these sets were also aligned using Unipro Ugene. Phylogenetic tree was constructed by using PHYLIP Neighbour Joining plugin [3] in Unipro Ugene. Mutations in genome sequences 4-13 were also deduced with comparison to genome sequence 3. For comparison requiring reference, genome sequence 3 and 15 were chosen because of their origin from Wuhan, China.
Set A
- Genome sequence 1,2 and 3
- Dis-similarity between genomes 1,2 and 3 with reference sequence as genome 3(Fig. 1):
- SARS-CoV1 and SARS-CoV2 = 20%
- MERS-CoV and SARS-CoV2=38%
- Phylogenetic tree was built using PHYLIP Neighbour Joining plugin in Unipro Ugene (Fig. 2).
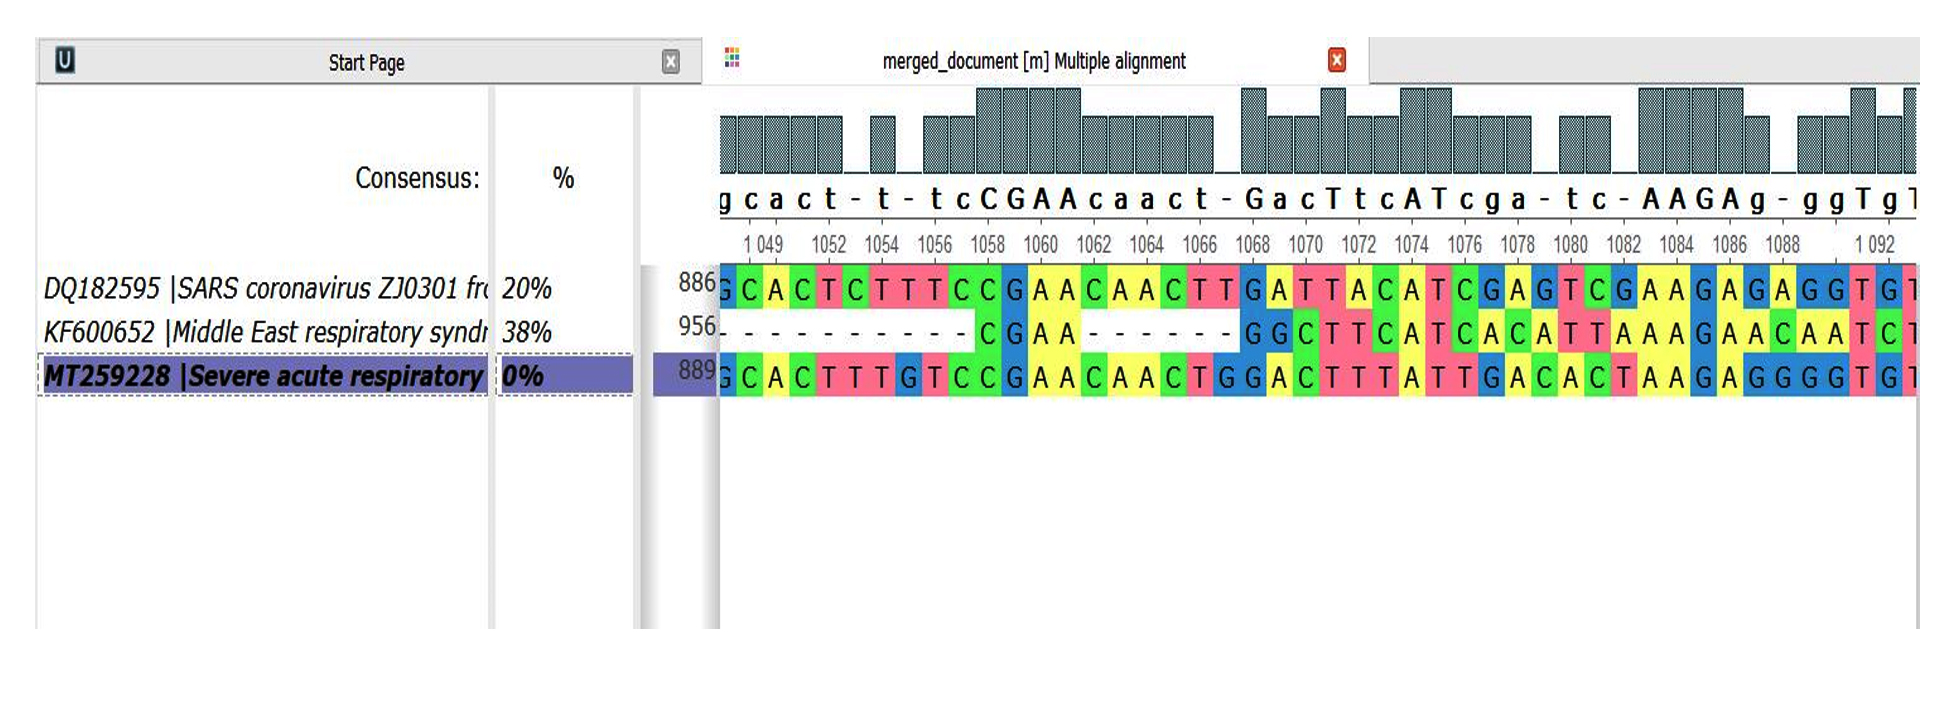
Fig. 1. Genome Comparison sequence 1,2 and 3
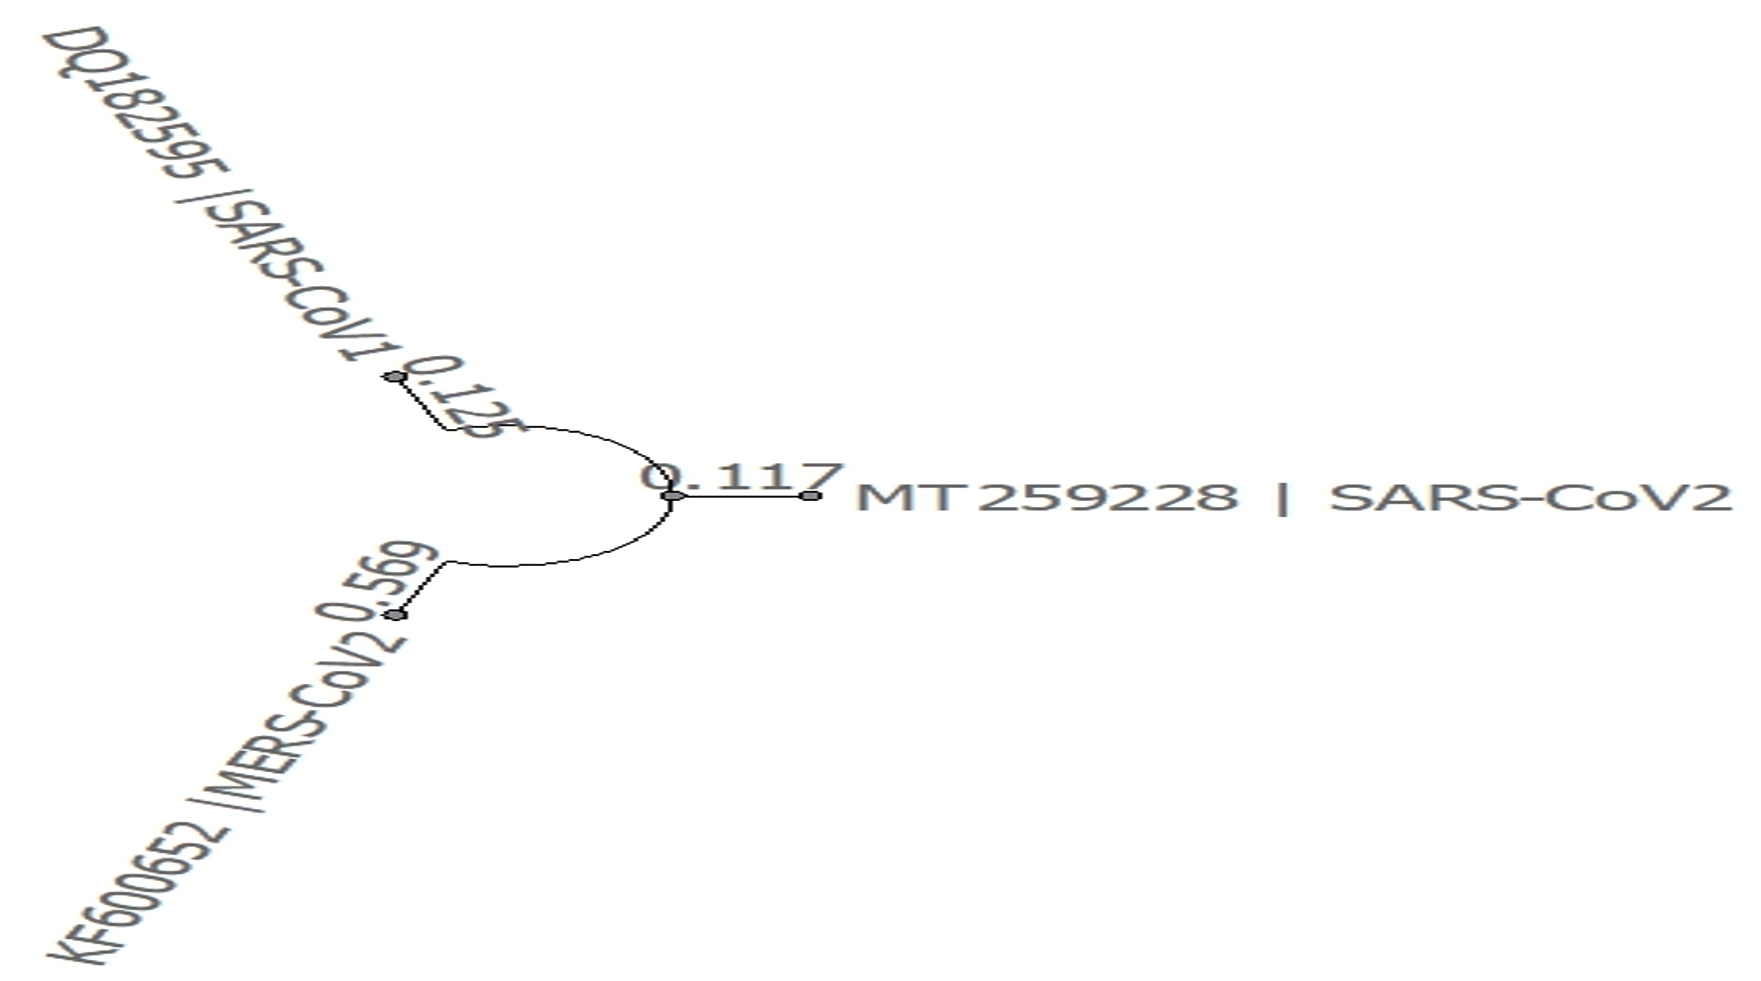
Fig. 2. Phylogeny tree of set A
Set B
- Genome sequence 3-13
- Dis-similarity between genomes 3-13 with reference sequence as genome 3(Fig. 3).
- India and Wuhan= 0%
- Iran and Wuhan=0%
- Nepal and Wuhan=0%
- Pakistan and Wuhan=0%
- South Korea and Wuhan=0%
- USA and Wuhan=0%
- Greece and Wuhan=0%
- Italy and Wuhan=0%
- Spain and Wuhan=0%
- Brazil and Wuhan=0%
- Phylogenetic tree was built using PHYLIP Neighbour Joining plugin in Unipro Ugene (Fig. 4).
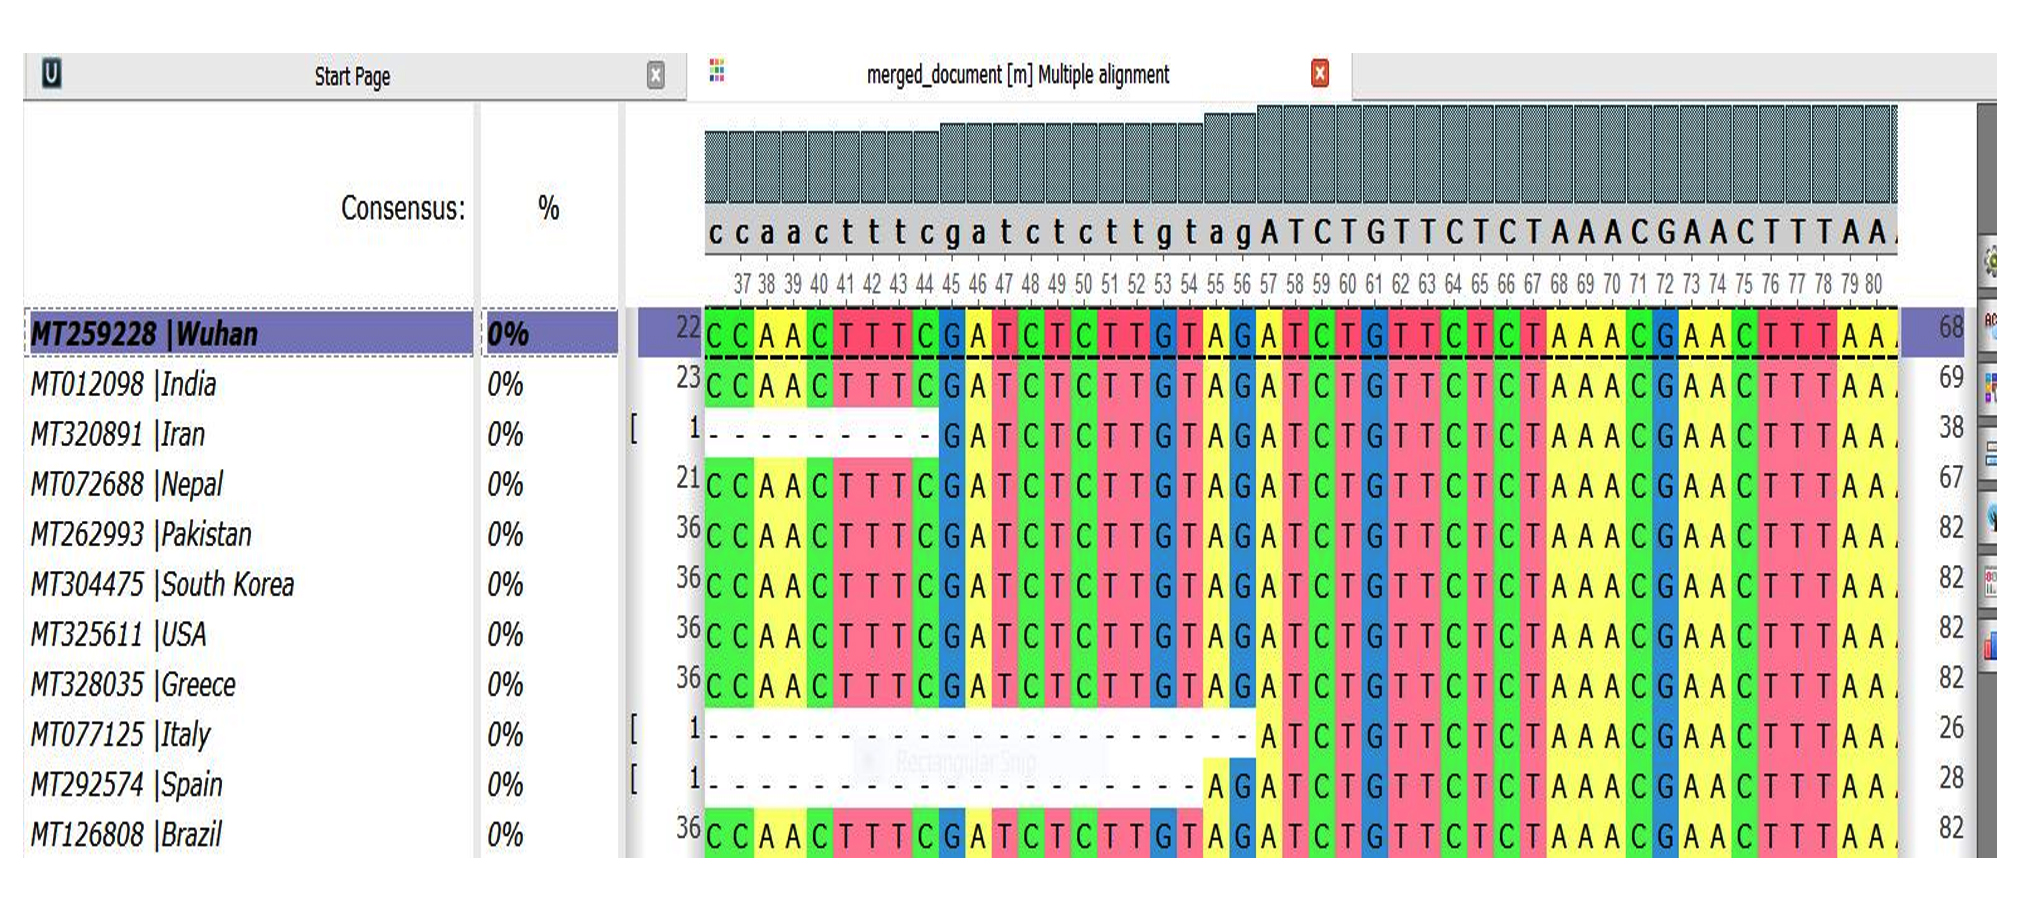
Fig. 3. Genome Comparison Sequence 3-13
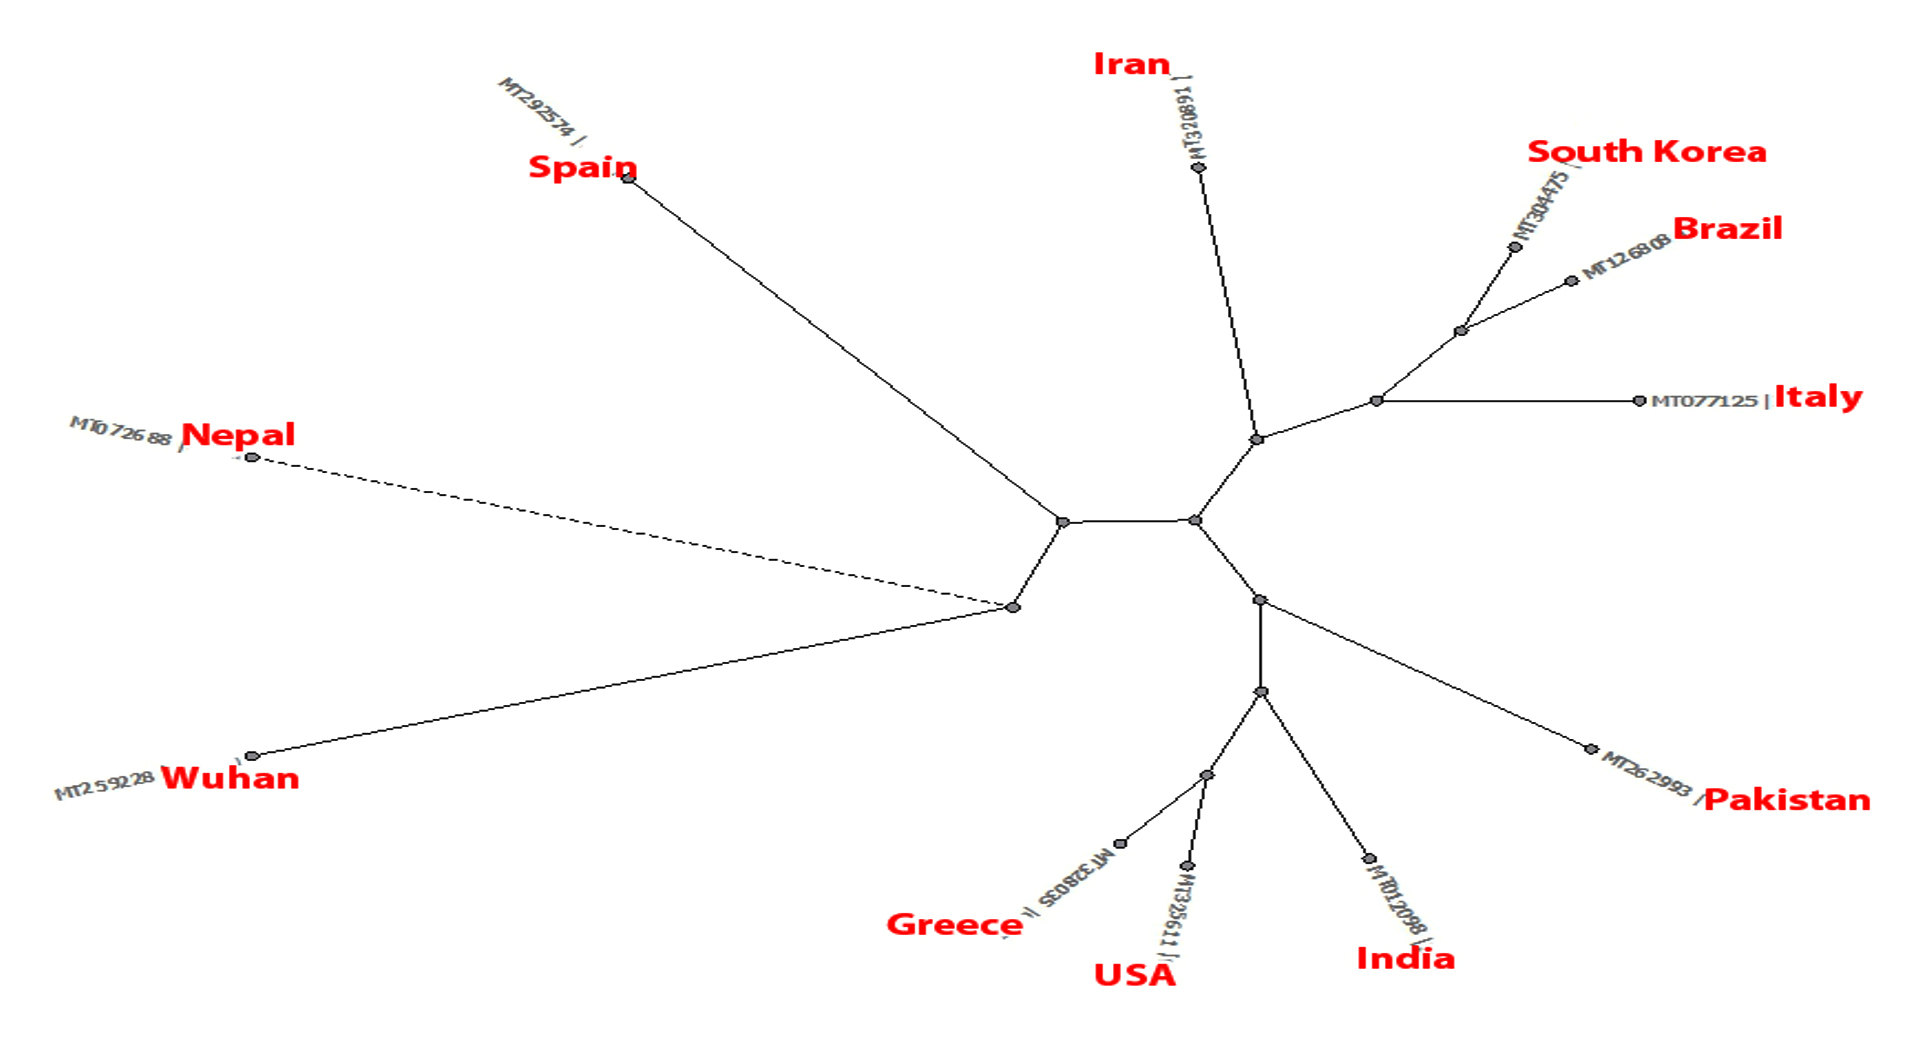
Fig. 4. Phylogeny tree of set B.
Set C
- Genome sequence 14-17
- Dis-similarity between genomes 14-17 with reference sequence as genome 15(Fig. 5).
- Alpha and Beta=38%
- Delta and Beta=38%
- Gamma and Beta=39%
- Phylogenetic tree was built using PHYLIP Neighbour Joining plugin in Unipro Ugene (Fig. 6).
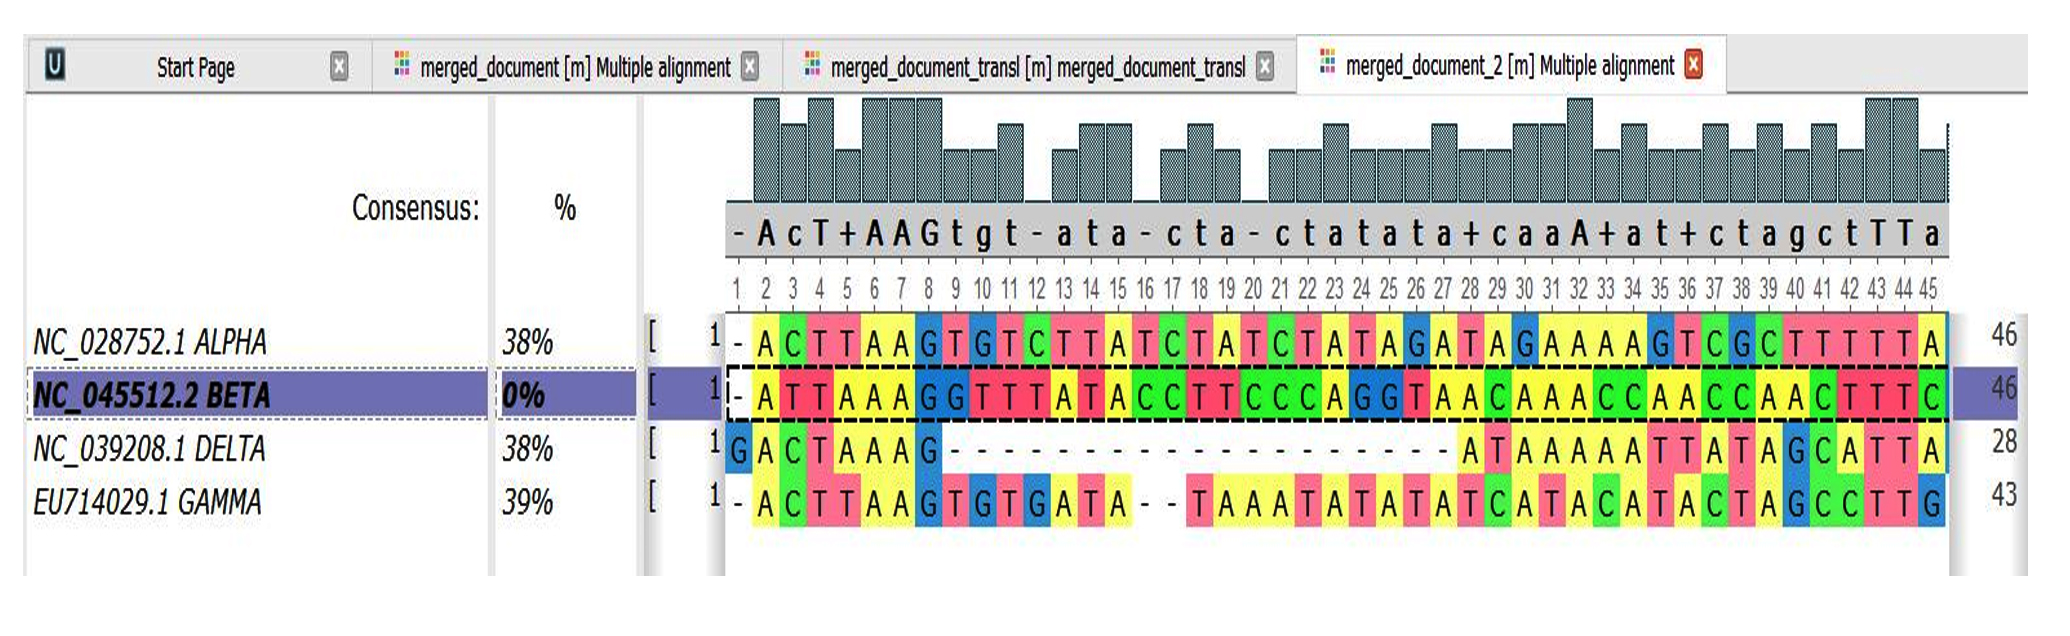
Fig. 5. Genome Comparison Sequence 14-17
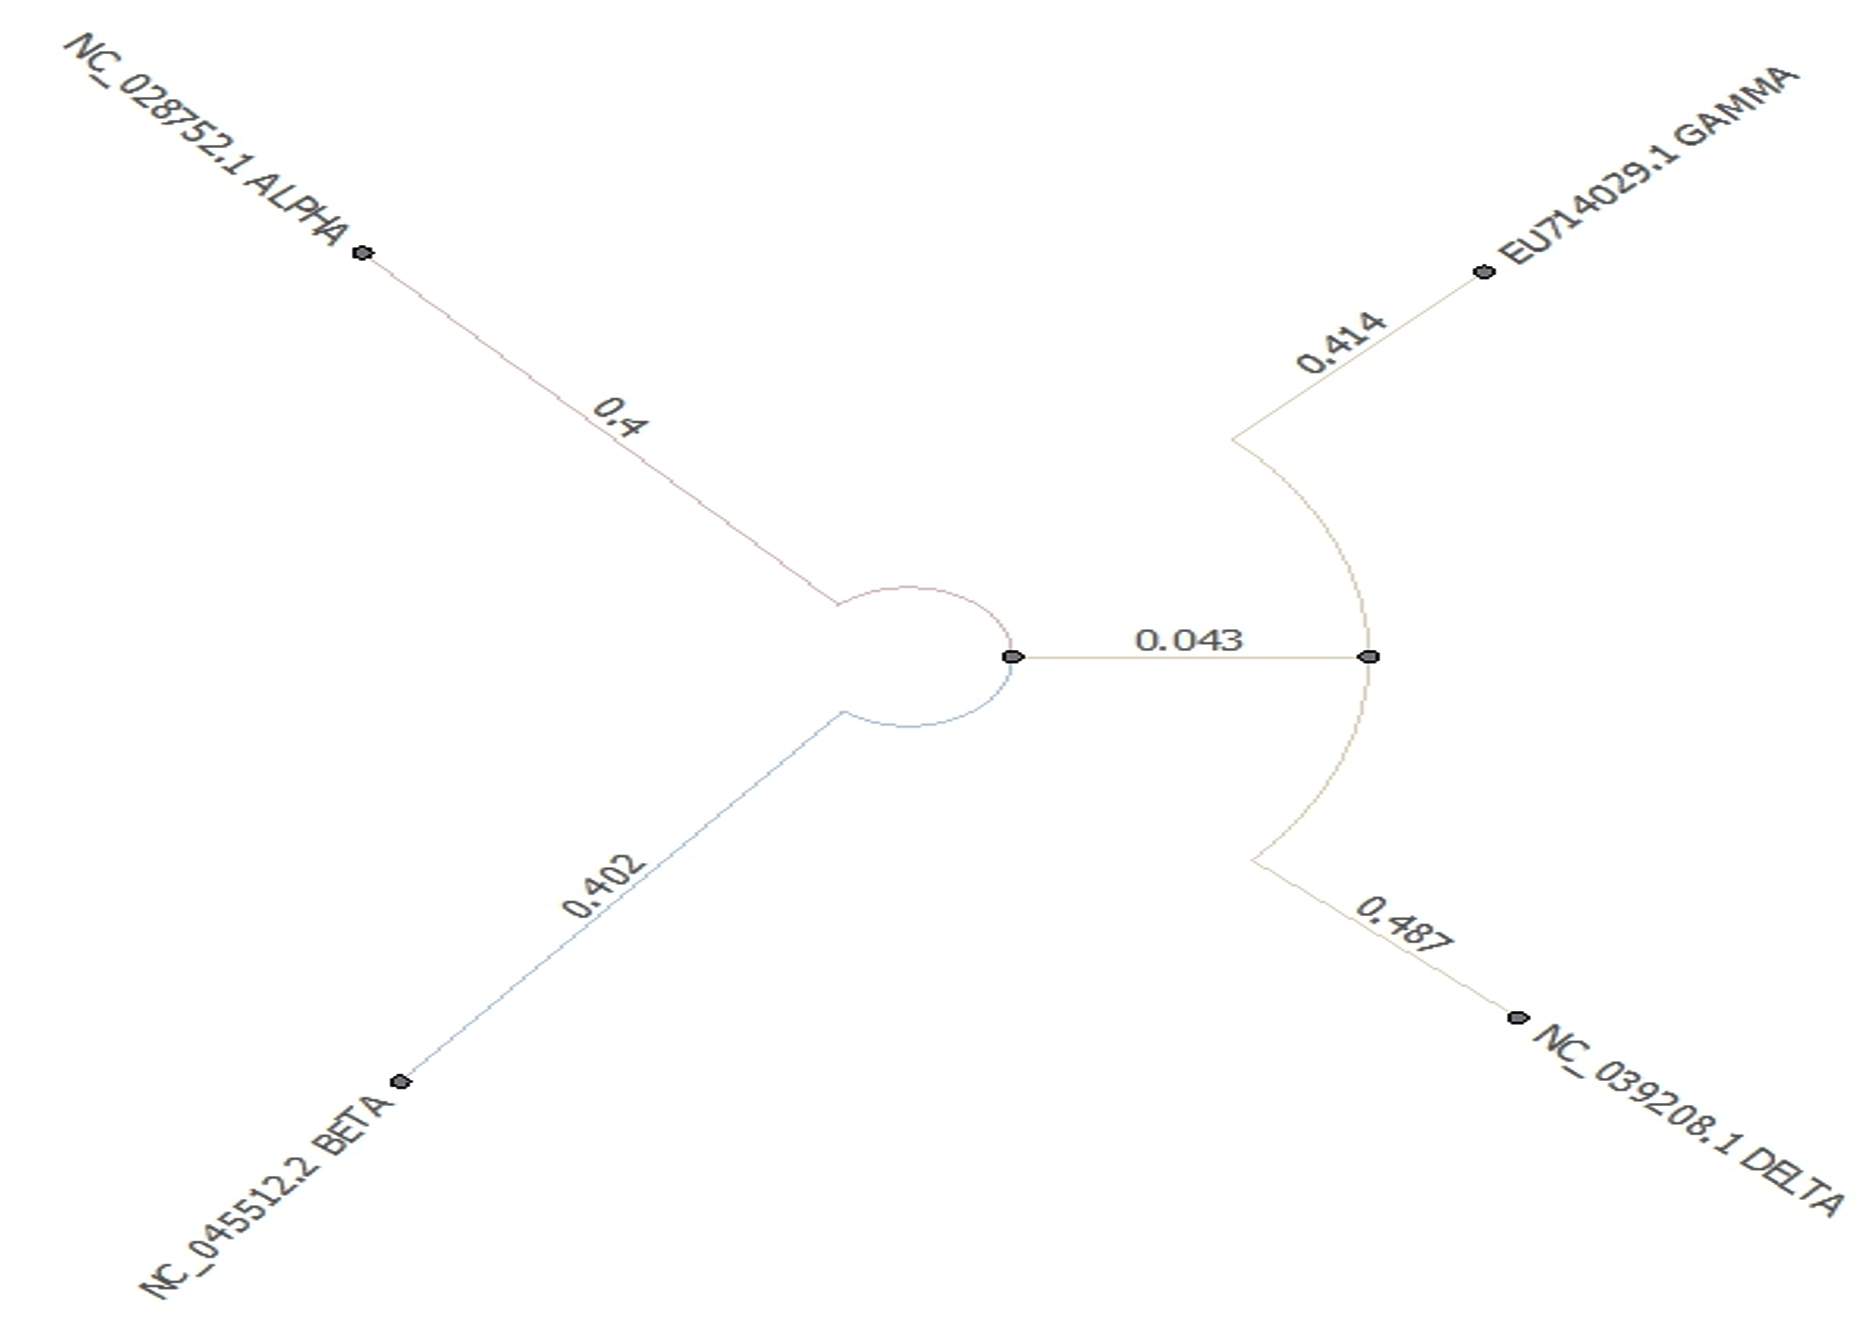
Fig. 6. Phylogeny tree of set C
Set D
- Translation of genome sequence 1,2 and 3
- Dis-similarity between translated genomes 1,2 and 3 with reference sequence as genome 3 (Fig. 7):
- SARS-CoV1 and SARS-CoV2 = 20%
- MERS-CoV and SARS-CoV2=38%
- Phylogenetic tree was built using PHYLIP Neighbour Joining plugin in Unipro Ugene (Fig. 8).
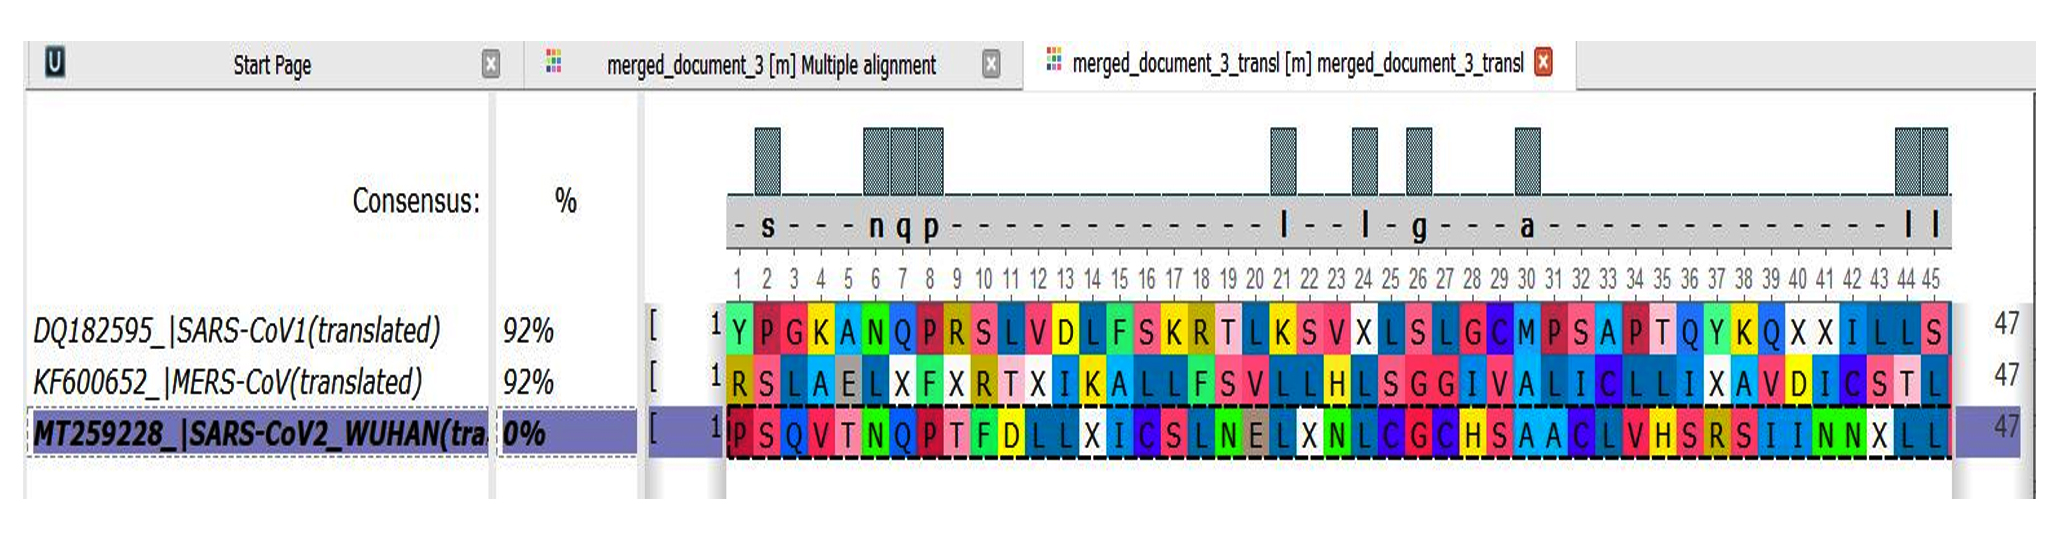
Fig. 7. Translated Genome Comparison Sequence 1, 2 and 3
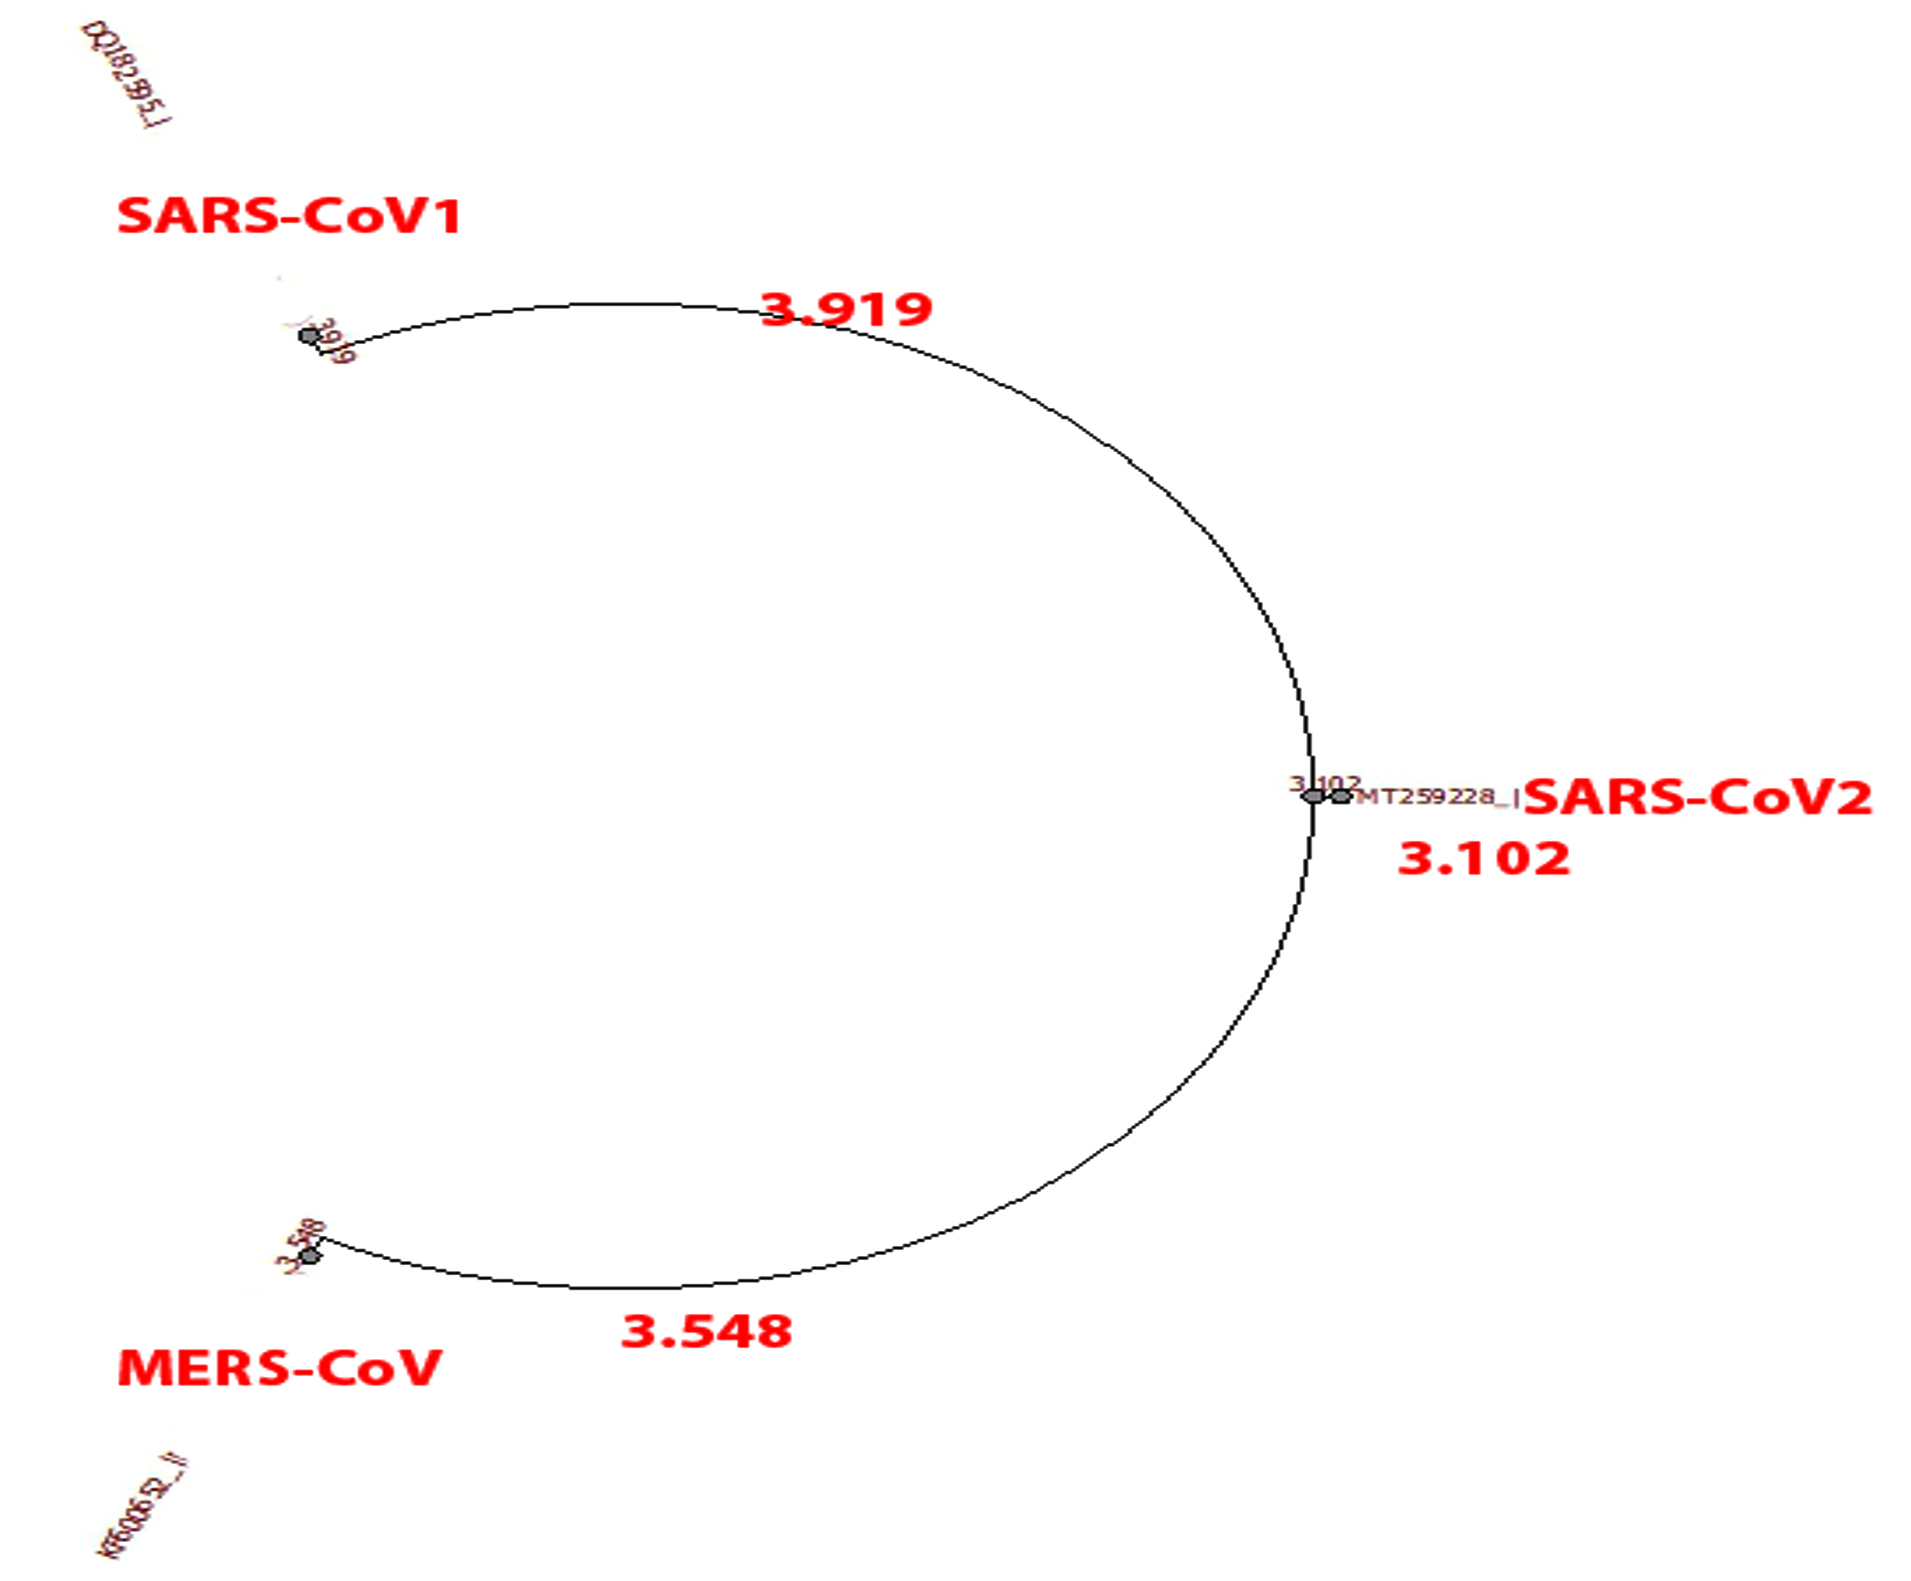
Fig. 8. Phylogeny tree of set D.
Set E
- Translation of genome sequence 3-13
- Dis-similarity between translated genomes 3-13 with reference sequence as genome 3 (Fig. 9).
- India and Wuhan= 94%
- Iran and Wuhan=92%
- Nepal and Wuhan=95%
- Pakistan and Wuhan=94%
- South Korea and Wuhan=94%
- USA and Wuhan=94%
- Greece and Wuhan=94%
- Italy and Wuhan=92%
- Spain and Wuhan=94%
- Brazil and Wuhan=94%
- Phylogenetic tree was built using PHYLIP Neighbour Joining plugin in Unipro Ugene (Fig. 10).
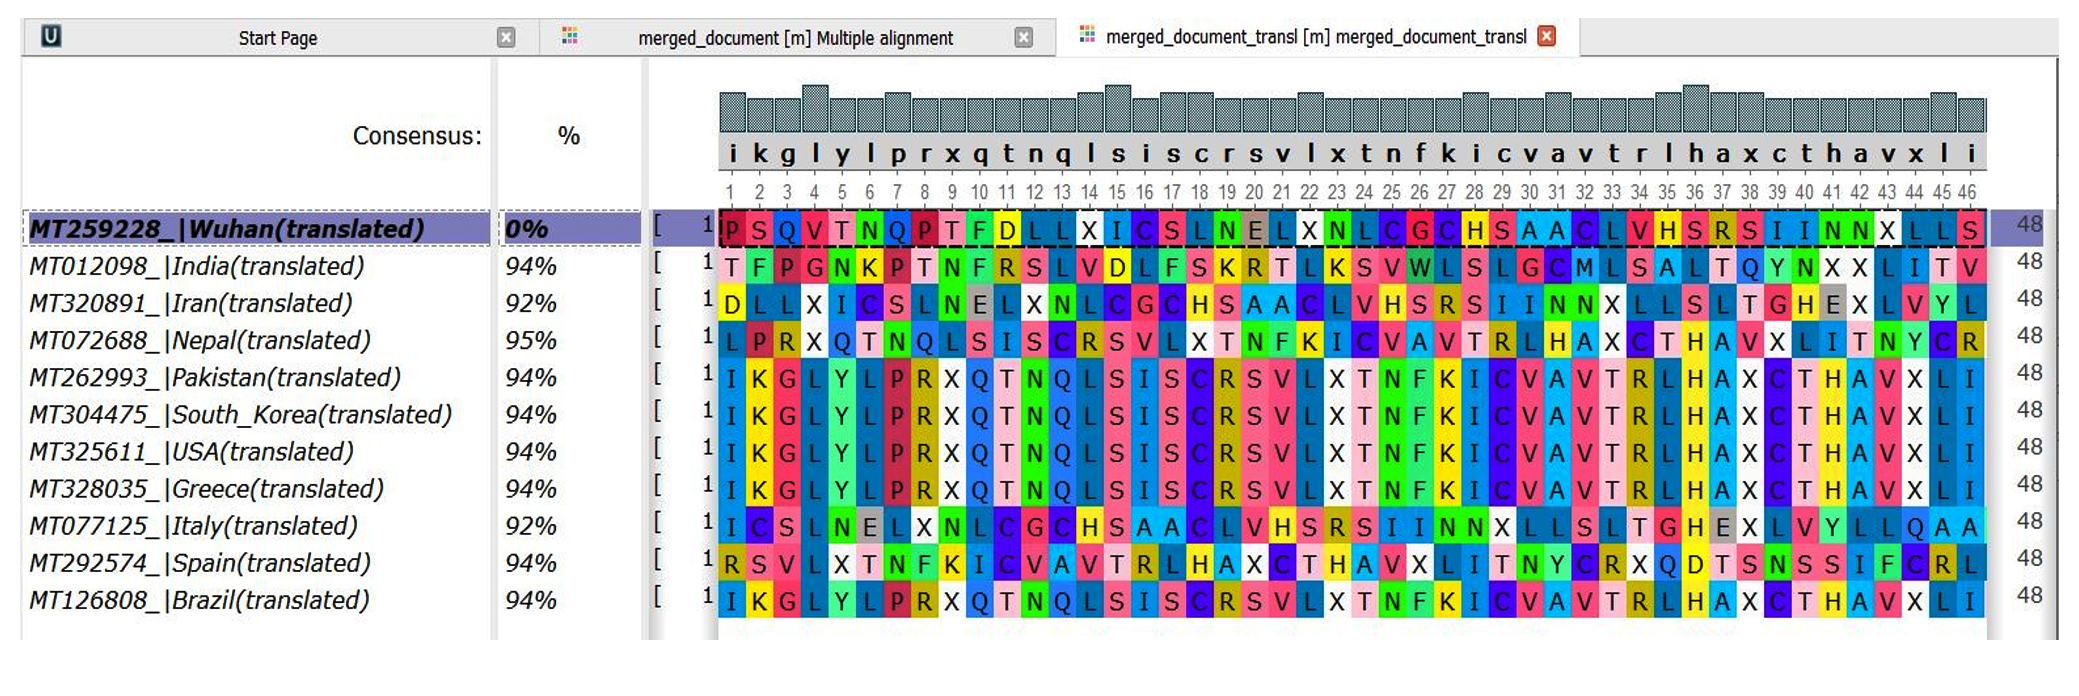
Fig. 9. Translated Genome Comparison Sequence 3-13
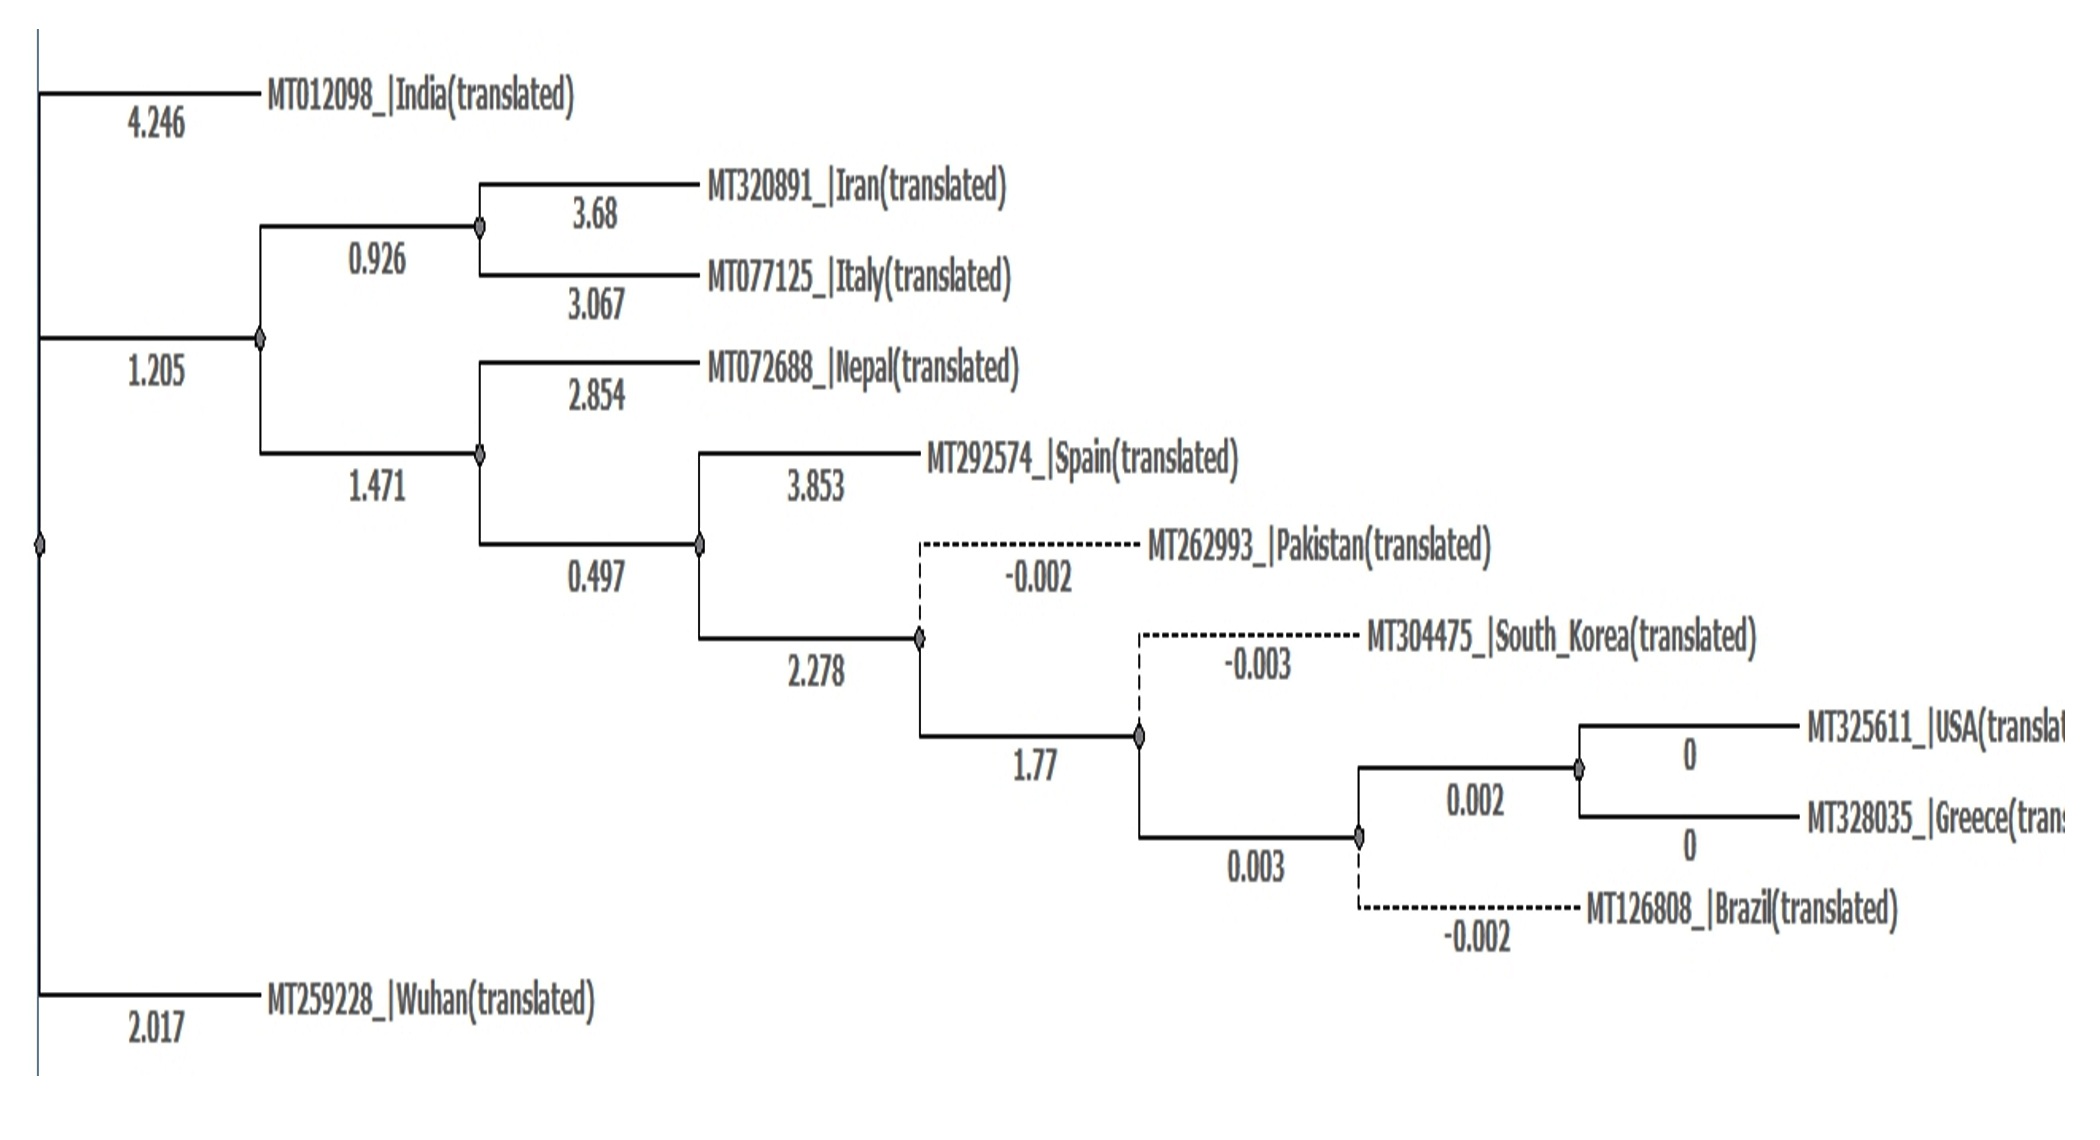
Fig. 10. Phylogeny tree of set E.
Set F
- Translation of genome sequence 14-17
- Dis-similarity between genomes 14-17 with reference sequence as genome 15(Fig. 11).
- Alpha and Beta=95%
- Delta and Beta=95%
- Gamma and Beta=95%
- Phylogenetic tree was built using PHYLIP Neighbour Joining plugin in Unipro Ugene (Fig. 12).
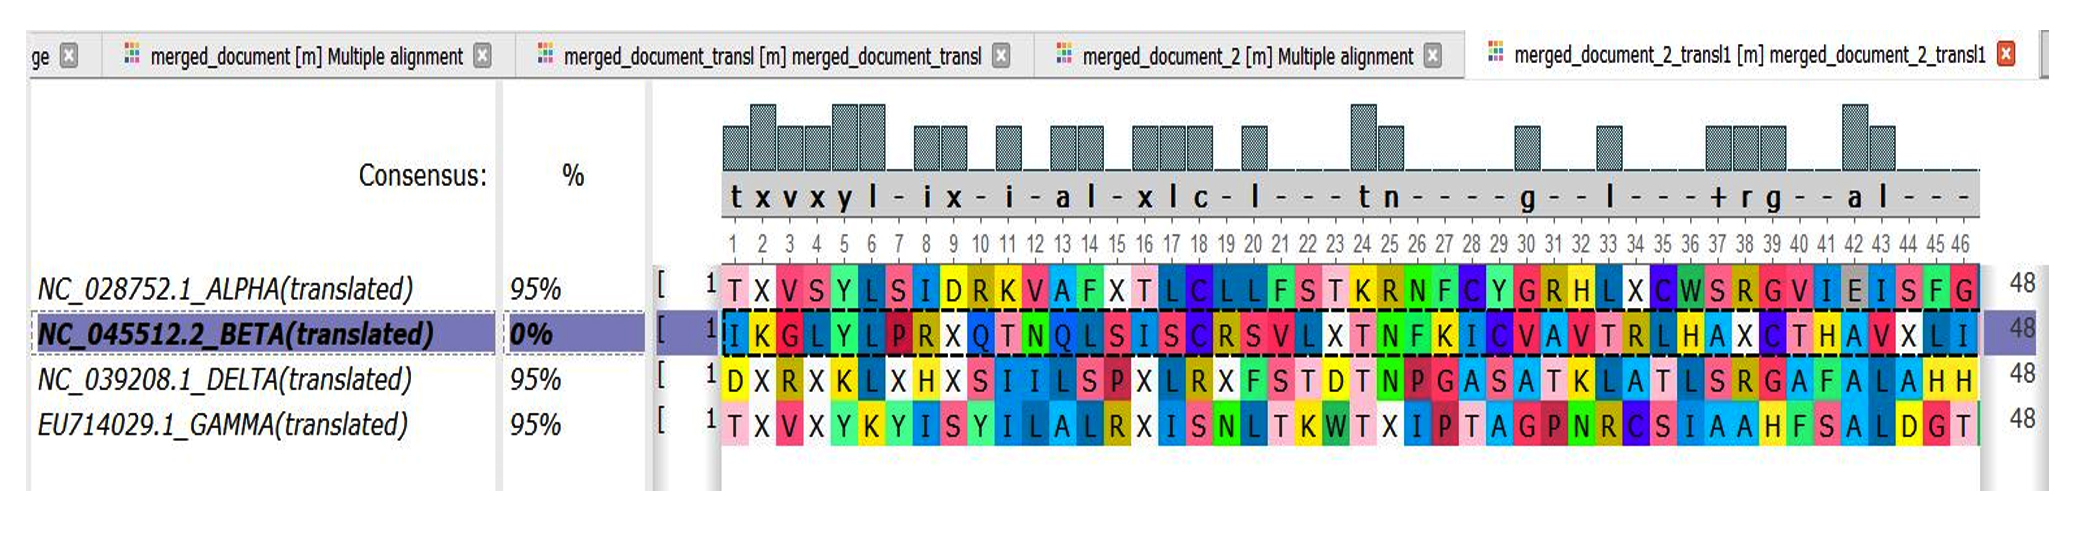
Fig. 11. Translated Genome Comparison Sequence 14-17

Fig. 12. Phylogeny tree of set F
Mutation results
All sequences of SARS-CoV-2(genome 4-13) were checked for mutations one by one against sequence 3 from Wuhan, China. The number denotes the position of in genome. The first column of data containing nucleotide denotes Wuhan sequence 3 and the next column denotes the compared region sequence.
Abbreviations used in the result below are as follows: (blank denotes absent nucleotide)
A-Adenine, N-non-templated nucleotides
G-Guanine, C-Cytosine, T-Thymine
| India | ||
|---|---|---|
| 1 | – | A |
| 2264 | T | C |
| 6682 | C | T |
| 14644 | C | T |
| 17360 | C | T |
| 20679 | T | C |
| 21978 | T | – |
| 21979 | T | – |
| 21980 | A | – |
| 22772 | G | T |
| 29832 | G | T |
| 29833 | A | T |
| 29848 | A | G |
| 29855 | C | G |
| 29858 | A | – |
| 29859 | A | – |
| 29860 | A | – |
| 29861 | A | – |
| 29862 | A | – |
| Iran | ||
| 1 | C | – |
| 2 | C | – |
| 3 | T | – |
| 4 | T | – |
| 5 | C | – |
| 6 | C | – |
| 7 | C | – |
| 8 | A | – |
| 9 | G | – |
| 10 | G | – |
| 11 | T | – |
| 12 | A | – |
| 13 | A | – |
| 14 | C | – |
| 15 | A | – |
| 16 | A | – |
| 17 | A | – |
| 18 | C | – |
| 19 | C | – |
| 20 | A | – |
| 21 | A | – |
| 22 | C | – |
| 23 | C | – |
| 24 | A | – |
| 25 | A | – |
| 26 | C | – |
| 27 | T | – |
| 28 | T | – |
| 29 | T | – |
| 30 | C | – |
| 1383 | G | A |
| 11069 | G | T |
| 14592 | – | T |
| 14593 | – | C |
| 14594 | – | C |
| 14595 | – | T |
| 14596 | – | T |
| 14597 | – | A |
| 18369 | C | T |
| 20684 | T | C |
| 29366 | G | A |
| 29734 | G | T |
| 29837 | G | T |
| 29838 | A | T |
| 29853 | A | G |
| 29859 | T | – |
| 29860 | C | – |
| 29861 | A | – |
| 29862 | C | – |
| 29863 | A | – |
| 29864 | A | – |
| 29865 | A | – |
| 29866 | A | – |
| 29867 | A | – |
| Nepal | ||
| 1 | C | – |
| 20678 | T | C |
| 24020 | C | T |
| 29813 | A | – |
| 29814 | G | – |
| 29815 | T | – |
| 29816 | G | – |
| 29817 | C | – |
| 29818 | T | – |
| 29819 | A | – |
| 29820 | T | – |
| 29821 | C | – |
| 29822 | C | – |
| 29823 | C | – |
| 29824 | C | – |
| 29825 | A | – |
| 29826 | T | – |
| 29827 | G | – |
| 29828 | T | – |
| 29829 | G | – |
| 29830 | A | – |
| 29831 | G | – |
| 29832 | A | – |
| 29833 | T | – |
| 29834 | T | – |
| 29835 | A | – |
| 29836 | A | – |
| 29837 | T | – |
| 29838 | A | – |
| 29839 | G | – |
| 29840 | C | – |
| 29841 | T | – |
| 29842 | T | – |
| 29843 | C | – |
| 29844 | T | – |
| 29845 | T | – |
| 29846 | A | – |
| 29847 | A | – |
| 29848 | G | – |
| 29849 | A | – |
| 29850 | G | – |
| 29851 | A | – |
| 29852 | A | – |
| 29853 | T | – |
| 29854 | C | – |
| 29855 | A | – |
| 29856 | C | – |
| 29857 | A | – |
| 29858 | A | – |
| 29859 | A | – |
| 29860 | A | – |
| 29861 | A | – |
| South Korea | ||
| 1 | – | A |
| 2 | – | T |
| 3 | – | T |
| 4 | – | A |
| 5 | – | A |
| 6 | – | A |
| 7 | – | G |
| 8 | – | G |
| 9 | – | T |
| 10 | – | T |
| 11 | – | T |
| 12 | – | A |
| 13 | – | T |
| 14 | – | A |
| 5572 | G | T |
| 11083 | G | T |
| 14805 | C | T |
| 20692 | T | C |
| 26144 | G | T |
| 28311 | C | T |
| 29845 | G | T |
| 29846 | A | T |
| 29861 | A | G |
| 29868 | C | G |
| 29876 | – | A |
| 29877 | – | A |
| 29878 | – | A |
| 29879 | – | A |
| 29880 | – | A |
| 29881 | – | A |
| 29882 | – | A |
| Pakistan | ||
| 1 | – | A |
| 2 | – | T |
| 3 | – | T |
| 4 | – | A |
| 5 | – | A |
| 6 | – | A |
| 7 | – | G |
| 8 | – | G |
| 9 | – | T |
| 10 | – | T |
| 11 | – | T |
| 12 | – | A |
| 13 | – | T |
| 14 | – | A |
| 9721 | T | – |
| 9722 | T | – |
| 9723 | T | – |
| 9724 | C | – |
| 9725 | T | – |
| 9726 | A | – |
| 9727 | T | – |
| 9728 | T | – |
| 9729 | G | – |
| 9730 | G | – |
| 9731 | T | – |
| 9732 | T | – |
| 9733 | C | – |
| 9734 | T | – |
| 9735 | T | – |
| 19516 | T | – |
| 19517 | T | – |
| 19518 | G | – |
| 19519 | T | – |
| 19520 | A | – |
| 19521 | T | – |
| 19522 | C | – |
| 19523 | T | – |
| 19524 | C | – |
| 19525 | G | – |
| 19526 | A | – |
| 19527 | T | – |
| 19528 | G | – |
| 19529 | C | – |
| 19530 | T | – |
| 19531 | T | – |
| 19532 | A | – |
| 19533 | T | – |
| 19534 | A | – |
| 19536 | C | – |
| 20692 | T | C |
| 29845 | G | T |
| 29846 | A | T |
| 29861 | A | G |
| 29868 | C | G |
| 29873 | A | – |
| 29874 | A | – |
| USA | ||
| 1 | – | A |
| 2 | – | T |
| 3 | – | T |
| 4 | – | A |
| 5 | – | A |
| 6 | – | A |
| 7 | – | G |
| 8 | – | G |
| 9 | – | T |
| 10 | – | T |
| 11 | – | T |
| 12 | – | A |
| 13 | – | T |
| 14 | – | A |
| 241 | C | T |
| 3037 | C | T |
| 14408 | C | T |
| 18877 | C | T |
| 20692 | T | C |
| 23403 | A | G |
| 25563 | G | T |
| 29845 | G | T |
| 29846 | A | T |
| 29861 | A | G |
| 29868 | C | G |
| 29876 | – | A |
| 29877 | – | A |
| 29878 | – | A |
| 29879 | – | A |
| 29880 | – | A |
| 29881 | – | A |
| 29882 | – | A |
| Greece | ||
| 1 | – | A |
| 2 | – | T |
| 3 | – | T |
| 4 | – | A |
| 5 | – | A |
| 6 | – | A |
| 7 | – | G |
| 8 | – | G |
| 9 | – | T |
| 10 | – | T |
| 11 | – | T |
| 12 | – | A |
| 13 | – | T |
| 14 | – | A |
| 241 | C | T |
| 3037 | C | T |
| 14408 | C | T |
| 20692 | T | C |
| 23403 | A | G |
| 28881 | G | A |
| 28882 | G | A |
| 28883 | G | C |
| 28887 | C | T |
| 29845 | G | T |
| 29861 | A | G |
| 29868 | C | G |
| 29876 | – | A |
| 29877 | – | A |
| 29878 | – | A |
| 29879 | – | A |
| 29880 | – | A |
| 29881 | – | A |
| 29882 | – | A |
| 29883 | – | A |
| 29884 | – | A |
| 29885 | – | A |
| 29886 | – | A |
| 29887 | – | A |
| 29888 | – | A |
| 29889 | – | A |
| 29890 | – | A |
| 29891 | – | A |
| 29892 | – | A |
| 29893 | – | A |
| 29894 | – | A |
| 29895 | – | A |
| 29896 | – | A |
| 29897 | – | A |
| 29898 | – | A |
| 29899 | – | A |
| 29900 | – | A |
| 29901 | – | A |
| 29902 | – | A |
| 29903 | – | A |
| Italy | ||
| 15 | C | – |
| 16 | C | – |
| 17 | T | – |
| 18 | T | – |
| 19 | C | – |
| 20 | C | – |
| 21 | C | – |
| 22 | A | – |
| 23 | G | – |
| 24 | G | – |
| 25 | T | – |
| 26 | A | – |
| 27 | A | – |
| 28 | C | – |
| 29 | A | – |
| 30 | A | – |
| 31 | A | – |
| 32 | C | – |
| 33 | C | – |
| 34 | A | – |
| 35 | A | – |
| 36 | C | – |
| 37 | C | – |
| 38 | A | – |
| 39 | A | – |
| 40 | C | – |
| 41 | T | – |
| 42 | T | – |
| 43 | T | – |
| 44 | C | – |
| 45 | G | – |
| 46 | A | – |
| 47 | T | – |
| 48 | C | – |
| 49 | T | – |
| 50 | C | – |
| 51 | T | – |
| 52 | T | – |
| 53 | G | – |
| 54 | T | – |
| 55 | A | – |
| 56 | G | – |
| 11083 | G | T |
| 20692 | T | C |
| 26144 | G | T |
| 29842 | T | – |
| 29843 | G | – |
| 29844 | A | – |
| 29845 | G | – |
| 29846 | A | – |
| 29847 | T | – |
| 29848 | T | – |
| 29849 | A | – |
| 29850 | A | – |
| 29851 | T | – |
| 29852 | A | – |
| 29853 | G | – |
| 29854 | C | – |
| 29855 | T | – |
| 29856 | T | – |
| 29857 | C | – |
| 29858 | T | – |
| 29859 | T | – |
| 29860 | A | – |
| 29861 | A | – |
| 29862 | G | – |
| 29863 | A | – |
| 29864 | G | – |
| 29865 | A | – |
| 29866 | A | – |
| 29867 | T | – |
| 29868 | C | – |
| 29869 | A | – |
| 29870 | C | – |
| 29871 | A | – |
| 29872 | A | – |
| 29873 | A | – |
| 29874 | A | – |
| 29875 | A | – |
| Spain | ||
| 15 | C | – |
| 16 | C | – |
| 17 | T | – |
| 18 | T | – |
| 19 | C | – |
| 20 | C | – |
| 21 | C | – |
| 22 | A | – |
| 23 | G | – |
| 24 | G | – |
| 25 | T | – |
| 26 | A | – |
| 27 | A | – |
| 28 | C | – |
| 29 | A | – |
| 30 | A | – |
| 31 | A | – |
| 32 | C | – |
| 33 | C | – |
| 34 | A | – |
| 35 | A | – |
| 36 | C | – |
| 37 | C | – |
| 38 | A | – |
| 39 | A | – |
| 40 | C | – |
| 41 | T | – |
| 42 | T | – |
| 43 | T | – |
| 44 | C | – |
| 45 | G | – |
| 47 | T | – |
| 48 | C | – |
| 49 | T | – |
| 50 | C | – |
| 51 | T | – |
| 52 | T | – |
| 53 | G | – |
| 54 | T | – |
| 8782 | C | T |
| 14805 | C | T |
| 20692 | T | C |
| 21691 | C | T |
| 25798 | A | N |
| 25979 | G | T |
| 28144 | T | C |
| 28657 | C | T |
| 28863 | C | T |
| 29837 | C | – |
| 29838 | C | – |
| 29839 | A | – |
| 29840 | T | – |
| 29841 | G | – |
| 29842 | T | – |
| 29843 | G | – |
| 29844 | A | – |
| 29845 | G | – |
| 29846 | A | – |
| 29847 | T | – |
| 29848 | T | – |
| 29849 | A | – |
| 29850 | A | – |
| 29851 | T | – |
| 29852 | A | – |
| 29853 | G | – |
| 29854 | C | – |
| 29855 | T | – |
| 29856 | T | – |
| 29857 | C | – |
| 29858 | T | – |
| 29859 | T | – |
| 29860 | A | – |
| 29861 | A | – |
| 29862 | G | – |
| 29863 | A | – |
| 29864 | G | – |
| 29865 | A | – |
| 29866 | A | – |
| 29867 | T | – |
| 29868 | C | – |
| 29869 | A | – |
| 29870 | C | – |
| 29871 | A | – |
| 29872 | A | – |
| 29873 | A | – |
| 29874 | A | – |
| 29875 | A | – |
| Brazil | ||
| 1 | – | A |
| 2 | – | T |
| 3 | – | T |
| 4 | – | A |
| 5 | – | A |
| 6 | – | A |
| 7 | – | G |
| 8 | – | G |
| 9 | – | T |
| 10 | – | T |
| 11 | – | T |
| 12 | – | A |
| 13 | – | T |
| 14 | – | A |
| 11083 | G | T |
| 14805 | C | T |
| 17247 | T | C |
| 20692 | T | C |
| 26144 | G | T |
| 29845 | G | T |
| 29846 | A | T |
| 29861 | A | G |
| 29868 | C | G |
| 29876 | – | A |
Comparing the coronavirus outbreaks which have occurred in the past classifies them in to three outbreaks: SARS 2002-2003 outbreak; MERS 2012 outbreak and the present COVID-19. The causative organism of all three outbreaks has been the beta-coronavirus group4. These outbreaks differ in various aspects. Total number of cases reported were 8422 cases of SARS-20035, 2519 cases of MERS-20126 and currently 54,88,825 cases of COVID-191. Total number of fatalities reported were 774 dues to SARS-2003[7], 866 dues to MERS-20126 and currently 3,49,095 due to COVID-191. The mortality rate calculated turns out to be 9.19%,34.37%and 6.29% for SARS-2003, MERS-2012 and COVID-19 respectively. However, neither SARS-2003 and MERS-2012 became a pandemic like COVID-19. The basic reproduction rate R08 was 2-5 for SARS-2003, 0.3-0.8 for MERS-2012 and 1.4-5.7 for COVID-19. Among the symptoms9 like fever, dry cough, dyspnoea, diarrhoea and sore throat, COVID-19 patients10 showed diarrhoea in only 3.7% cases compared to 20-25% in SARS-2003 and MERS-2012. Dyspnoea was seen in only 18.6% COVID-19 patients while 40-42% cases were seen in SARS-2003 and 72% cases were seen in MERS-2012. Dry cough was seen in 67.7% COVID-19 patients while 29-75% cases were seen in SARS-2003 and 47% cases were seen in MERS-2012.
Genome sequence comparisons has brought out in front of us astonishing results. Mortality rate from all nations were calculated (as of Situation report 86 of WHO dated 15th April,2020) and the following mutations were looked for: transition, transversion, insertion and deletion. The analysis is summarised in the table (Table 1) below. Mortality rate in China was 4%. High, moderate and mild refers on the number of the mutations counted from the above results.
Table (1):
Mutation Comparison table as per region.
| Region | Total no. of mutations | Mortality% | Transition | Transversion | Insertion | Deletion |
|---|---|---|---|---|---|---|
| High mutation | ||||||
| Italy | 79 | 12.96% | 1 | 2 | 0 | 76 |
| Spain | 89 | 10.46% | 7 | 2 | 0 | 79 |
| Moderate mutation | ||||||
| Nepal | 52 | 0% | 2 | 0 | 0 | 50 |
| Iran | 54 | 6.25% | 5 | 4 | 6 | 39 |
| Pakistan | 57 | 1.78% | 2 | 3 | 14 | 38 |
| Greece | 55 | 4.65% | 9 | 4 | 42 | 0 |
| Mild mutation | ||||||
| India | 19 | 3% | 6 | 4 | 1 | 8 |
| South Korea | 31 | 2.12% | 4 | 6 | 21 | 0 |
| USA | 27 | 4% | 2 | 4 | 21 | 0 |
| Brazil | 24 | 5.67% | 4 | 5 | 15 | 0 |
From the above table it can easily be deduced that genome showing high number of mutations like Italy and Spain have a higher mortality rate. In regions showing moderate number of mutations, mortality rate was higher than China like Iran and Greece. Nepal and Pakistan too have moderate number of mutations but infected cases were reported late or are too less as of now. Regions with mild number of mutations have either same like USA or lower mortality rate like India and South Korea. Brazil shows 5.67% mortality rate which makes it more resembling toward genome sequences of Iran and Greece.
Shifting focus toward phylogenetic comparison, Set A and D which compares SARS-CoV, MERS-CoV and SARS-CoV2 viruses in genome and translation respectively. SARS-CoV and MERS-CoV genome and amino acid sequence shows dis-similarity of 20% and 38% respectively from SARS-CoV2. SARS-CoV and SARS-CoV2 are more closely related to the common ancestor than MERS-CoV as seen in phylogeny tree of set A. If related using amino acid sequence, all three are distantly related to the common ancestor as seen in phylogeny tree of set D.
Set C and F which compares the four types of coronaviruses alpha, beta, delta and gamma. Phylogeny tree of Set C shows alpha and beta coronaviruses originate from the common ancestor while gamma and delta coronavirus descend from another ancestor. Alpha and beta-coronaviruses infect humans and gamma and delta primarily affect birds. Phylogeny tree of set F however shows a distant relationship between them.
Set B phylogeny tree is unrooted but shows important close relations between Brazil and Iran which can explain Brazil’s high mortality rate despite mild number of mutations as discussed earlier. Set E phylogeny tree related to amino acid sequences of every region shows the close relation between Spain, Pakistan, South Korea, Brazil, USA and Greece all of which showed dis-similarity of 94% from Wuhan sequence. Nepal showed a dis-similarity of 95% and thus descended differently. Iran and Italy showed dis-similarity of 92% and showed a common descent. India however showed a distant relation from the common ancestor compared to others with a dis-similarity of 94%.
The above analysis highlights the mutations of the SARS-CoV2 virus as well as sets up a comparison with the previous outbreaks. Mortality rate was justifiable with the number and the type of mutations. Phylogeny trees showed significant relation among different genome sequences. These results can contribute a lot towards the ongoing fight against the COVID-19 pandemic. Similar type of studies should be conducted when more genome samples are present. These results can also contribute towards making an effective anti-viral therapy and vaccines.
ACKNOWLEDGMENTS
None.
CONFLICT OF INTEREST
The authors declare that there is no conflict of interest.
AUTHORS’ CONTRIBUTION
All authors listed have made a substantial, direct and intellectual contribution to the work, and approved it for publication.
FUNDING
None.
ETHICS STATEMENT
This article does not contain any studies with human participants or animals performed by any of the authors.
DATA AVAILABILITYY
All datasets generated or analyzed during this study are included in the manuscript and/or the Supplementary Files
- Situation Report-128 on COVID-19 dated 27th May,2020 by World Health Organization.
- GenBank. Https Accessed on 13th April,2020.
- Unipro UGENE: a unified bioinformatics toolkit Konstantin Okonechnikov, Olga Golosova, Mikhail Fursov, the UGENE team Bioinformatics 2012 28: 1166-1167
Crossref - Wertheim Joel O, Chu Daniel KW, Peiris Joseph SM, Kosakovsky Pond Sergei L, Poon Leo LM. “A Case for the Ancient Origin of Coronaviruses” (https://www.nc bi.nlm.nih.gov/pmc/articles/PMC3676139/). Journal of Virology. 2013;87(12):7039–7045. https://pubmed.ncbi.nlm.nih.gov/23596293.
Crossref - “SARS (severe acute respiratory syndrome)” (https://www.nhs.uk/conditions/sars/). nhs.uk. 2017. Accessed on 13th April,2020.
- Middle East Respiratory Syndromehttps://en.wikipedia.org/wiki/Middle_East_respiratory_syndrome Accessed on 13th April,2020.
- Severe Acute Respiratory Syndromehttps://en.wikipedia.org/wiki/Severe_acute_respiratory_syndrome Accessed on 13th April,2020.
- Basic Reproduction Numberhttps://en.m.wikipedia.org/wiki/Basic_reproduction_number Accessed on 13th April,2020.
- Coronavirus https://en.m.wikipedia.org/wiki/Coronavirus Accessed on 13th April,2020.
- “Report of the WHO-China Joint Mission on Coronavirus Disease 2019 (COVID-19)” (https://w ww.who.int/docs/default-source/coronaviruse/who-china-joint-mission-on-covid-19-final-report. pdf) (PDF). World Health Organization. February 2020.
- Lan J, Ge J, Yu J, et al. Structure of the SARS-CoV-2 spike receptor-binding domain bound to the ACE2 receptor. Nature. 2020;30:1-6.
Crossref
© The Author(s) 2020. Open Access. This article is distributed under the terms of the Creative Commons Attribution 4.0 International License which permits unrestricted use, sharing, distribution, and reproduction in any medium, provided you give appropriate credit to the original author(s) and the source, provide a link to the Creative Commons license, and indicate if changes were made.