

ISSN: 0973-7510
E-ISSN: 2581-690X
Soil microbial community structure is influenced by both biotic and abiotic factors prevailing in the soil milieu. The pH is one of the noticeable abiotic factors that affect soil microbial community. Different species prefer different range of pH for their optimal growth; however they can tolerate a wide range around acidic, neutral or alkaline pH. Microbes with broad range of pH tolerance i.e. from acidic to alkaline soil have better survival rate or opportunity as compared to other microbes which have narrow range of pH tolerance. So, in the present study growth response of plant growth promoting bacteria (PGPB) from rhizosphere and rhizoplane of different groups of plant has been characterized at broad range of pH (3.0-13.0) and hence can be applied in soils of different pH range to enhance plant growth and yield. Ten bacterial isolates, which exhibited in-vitro plant growth promoting traits i.e. phosphate solubilisation, biological nitrogen fixation, Indole acetic acid (IAA) production and siderophore production, revealed differential growth response to pH. Some isolates showed good response in broad pH range from acidic to alkaline (~3.5 to ~12.5). These plant growth promoting bacterial groups therefore can be potentially used as bacterial consortium for application in agricultural fields to enhance crop productivity.
pH, growth, response, PGPB, consortium, tolerance.
India has wide range features including climate, vegetation types and landforms and variety of soil forms. Soil is an important part of terrestrial ecosystem which holds various life forms and is influenced by both biotic (animals, plants, fungi, and bacteria) and abiotic (moisture, aeration, gases, minerals, organic/inorganic compounds, salinity, temperature and pH) factors1. Among the various categories of abiotic factors, soil pH affects physical, chemical and biological properties of soil. Acidic soil has pH less than 7 where as basic or alkaline soil has pH greater than 72. Various categories of soil with particular pH range are found on Earth such as alluvial soil whose pH ranges from 6.5- 8.4, red soil having pH range below 5.5- 7.5, black soil which has pH range from 6.5- 8.4, laterite soil has pH below 5.5, mountain soil which has pH range from 5.0-6.5 and desert soil having pH range from 7.6- 8.41. Soil provides growth medium and habitat for diverse group of flora and fauna such as plants, bacteria, fungi, actinomycetes, algae, small animals etc3,4. These soil microflora are predominantly responsible for nutrient availability and recycling, decomposition of organic matter and regeneration of minerals, pesticide degradation and plant productivity3,5. Amongst soil microbial community, bacterial population predominates as compared to other microbial groups and hence plays key role in influencing soil bionetwork. There exists a special group of bacterial population called plant growth promoting bacteria (PGPB) which are mostly found as: free living in soil, rhizospheric, rhizoplanic, phylospheric, endophytic or ectophytic and has a special task of stimulating plant growth by various mechanisms such as helping plants in uptake of inaccessible nutrient (nitrogen, phosphorus, iron) from the environment, production of phytohormones (Auxin, Gibberellic acid etc), deterring phytopathogens, inducing systemic resistance in plants etc6. Soil pH is one of the most influential factors affecting microbial community in soil7,8. Bacteria mostly prefer near neutral pH value i.e. 6.5-7.0 and are sensitive to change in pH because, their proteins and enzymes changes their conformation and converts into dysfunctional form. Hence extreme changes in soil pH will alter the bacterial composition including PGPB ultimately leading to poor soil quality and deterioration of plant growth. Development of bioinoculants as plant biostimulants is emerging tool to replace traditional use of chemical fertilizers and pesticides9. However, success of these bioinoculants may be affected by the various factors at the place of their application such as temperature, pH, toxic contaminants etc. So, evaluation of these factors on individual PGPR or a consortium is inevitable.
Taking this standpoint in mind, the present study has explored the PGPB isolates which can tolerate different range of pH stress so that they possess broad range of applicability in various types of soil of different pH.
Sample collection and isolation of bacterial cultures
Sample collection and isolation of bacteria were performed as reported earlier10. Standing plants of tomato, rice, eggplant, arhar and pea growing in fields in two different locations were aseptically collected from agricultural fields of Brambe and Mandar, Ranchi, Jharkhand, India. Plants were collected separately in sterilized polythene bags and brought immediately to laboratory for sample processing and isolation of bacteria. Bacteria were isolated and purified in LB agar (HiMedia Laboratories Pvt. Ltd, India) media using standard pure culture techniques such as serial dilution, spread plate and streak plate11. Bacteria were assigned isolates name with an initial alphabet of source plant followed by Arabic numeral on the basis of colony, form, margin, colour, size, opacity, elevation and texture. PGPR isolates kept in our lab, Dept. of Life Science, CUJ, were also used in this current study.
Morphological and biochemical characterization of bacterial isolates
The morphological and biochemical characterization of all the bacterial isolates were done by Gram staining, bacterial motility test, catalase test, citrate utilization test and Methyl Red- Voges Proskauer (MR-VP) test and nitrate reduction test12.
In-vitro screening of plant growth promoting characters
Four different plant growth promoting traits were selected in this study i.e. nitrogen fixation, phosphate mobilization, indole acetic acid production and siderophore production. In-vitro screening of plant growth promoting characters of isolated bacteria were done as per the method of Swarupa and Kumar10.
Nitrogen fixation test
Nitrogen fixation by bacteria was done as per the method adopted from Swarupa and Kumar10; Boddey and Dobereiner13.
Phosphate solubilisation
Phosphate solubilisation character was done as per the method of Swarupa and Kumar10; Pikovskaya14.
Indole acetic acid production
Production of indole acetic acid (IAA) by bacteria was tested by method adopted from Swarupa and Kumar10; Gordon and Weber15.
Siderophore assay
Siderophore production by bacteria was done on CAS (Chrome Azurol S) agar plate as per the method of Swarupa and Kumar10; Schwyne and Neilands16.
Growth response of bacterial isolates at different pH
LB broth was prepared in buffers of different pH ranges (Table 1). Bacterial isolates were inoculated in 10 ml LB broth and incubated overnight at 37°C with shaking at 170 rpm. 1 ml of overnight grown bacterial cultures were taken in Eppendorf tubes and centrifuged at 10,000 rpm for 5 minutes at room temperature. Pellet was washed twice and suspended in sterile LB broth prepared in buffers of different pH and maintaining O.D. 1 at l600 nm. Then 200 µl of cultures were inoculated in 20 ml LB broth prepared in respective buffers of different pH and incubated for 24 hours at 37°C with shaking at 170 rpm. Optical density (O.D. at l600 nm) of the bacterial cultures was recorded against respective media without inoculation. A graph of bacterial growth response (O.D.) at different pH graph was plotted in Microsoft Excel 2010.
Table (1):
Buffer system for different pH range 17
pH |
Buffers |
|---|---|
3.0- 6.0 |
Citrate buffer- Citric acid monohydrate (C6H8O7.H2O) and trisodium citrate dihydrate C6H5O7Na3.2H2O) |
6.5 |
Phosphate hydroxide buffer- potassium dihydrogen phosphate (KH2PO4) and sodium hydroxide (NaOH) |
7.0- 9.0 |
Tris- HCl buffer- Tris (C4H11NO3) and Hydrochloric acid (HCl) |
9.5- 11.0 |
Carbonate-hydroxide buffer- Sodium bicarbonate (NaHCO3) and sodium hydroxide (NaOH) |
11.5- 12.0 |
Phosphate-hydroxide buffer- Disodium hydrogen phosphate (Na2HPO4) and sodium hydroxide (NaOH) |
12.5- 13.0 |
Chloride-hydroxide buffer- Potassium chloride (KCl) and sodium hydroxide (NaOH) |
Total thirty three isolates were purified from rhizoplane and rhizosphere of rice, tomato, eggplant, okra, arhar and pea plant. Respective source of isolates is given in table 2.
Table (2):
General information about sources of bacterial isolates
S. No. |
Plant/variety |
Date of Collection |
Place/Location* |
Bacteria isolated |
|---|---|---|---|---|
1 |
Nursery rice (Oryza sativa variety- Arize 6444) |
05/08/2014 |
Mandar, Ranchi, Jharkhand
23° 27′ 31.31”N 85° 5′ 31.793”E |
R-1, R-2 |
2 |
Tomato (Solanum lycopersicum variety- Sangita) |
08/10/2014 |
Brambe, Ranchi, Jharkhand
23° 26′ 32.9568”N 85° 8′ 58.5996”E |
T-1, T-2, T-3, T-4, T-5 |
3 |
*Okra (Abelmoschus esculentus) |
25/08/2015 |
Brambe, Ranchi, Jharkhand,
23° 25′ 45.462” N 85° 9′ 2.0412” E |
O-1, O-2, O-3 |
5 |
Eggplant (Solanum melongena) |
8/12/2015 |
Brambe, Ranchi Jharkhand
23° 26′ 35.4048” N 85° 8′ 57.3396” E |
E-1, E-2, E-3, E-4, E-5 |
6 |
Arhar (Cajanus cajan) |
30/12/2015 |
Brambe, Ranchi
Jharkhand 23° 26′ 37.249” N 85° 8′ 56.528” E |
MA-1, MA-2, MA-3, MA-4, MA-5, MA-6, MA-7, MA-8, MA-9 |
7 |
Pea (Pisum sativum) |
18/12/2015 |
CUJ Brambe field,
Ranchi, Jharkhand 23° 26′ 37.536” N 85° 8′ 56.5404” E |
RP-1, RP-2, RP-3, RP-4, RP-5, RP-6, RP-7, RP-8, RP-9 |
*GPS coordinates (degree, minutes and seconds) were determined by using an android GPS app (My Location, 12.0.1), * isolates already reported by Swarupa and Kumar10.
The isolates showed different activity with respect to plant growth promoting microbial activities such as phosphate mobilization, biological nitrogen fixation (BNF), siderophore production and IAA production (Table 3). All the isolates, except E-1, E-5 and T-3, showed either or combination of selected plant growth promoting characteristics. Ten isolates i.e. E-2, T-2, T-1, O-2, R-1, MA-4, MA-5, MA-6, MA-9 and RP-9 were revealed all the four activities of plant growth promotion i.e. BNF, phosphate mobilization, IAA production and siderophore production. All the isolates were found growing at the top of semisolid media except isolate T-4, MA8 and MA9 which moved 5 mm, 4 mm, 2 mm deep into column of semisolid growth medium respectively and grew in the form of pellicle.
Ten bacterial isolates T-1, T-2, O-2, E-2, R-1, MA-4, MA-5, MA-6, MA-9 and RP-9 were subjected to growth response at different pH. Almost no growth of any tested bacterial isolates was seen at pH 3 (Fig. 1 and Table 4). Growth ensued rapidly at: pH 3.5 by isolates T-1, T-2, E-2 and MA-5, at pH 5.5 by isolates MA-4 and MA-9, and pH 7 by isolates O-2, R-1, MA-6 and RP-9. Isolates O-2 and RP-9 exhibited narrow pH range 7-9.5 (2.5, neutral –very strongly alkaline) for its growth, whereas others revealed moderate to broad pH range 3.5-10 (6.5, Extremely acid-Very strongly alkaline), 3.5-11 (7.5, Extremely acid-Very strongly alkaline), 4-12.5 (8.5, Extremely acid-Very strongly alkaline), 5.5-9 (3.5, Strongly acid-Strongly alkaline), 6-11.5 (5.5, Moderately acid-Very strongly alkaline), 7-12.5 (5.5, Neutral-Very strongly alkaline) for their average (50% of highest growth O.D.) growth (Fig. 2 and Table 5)18.
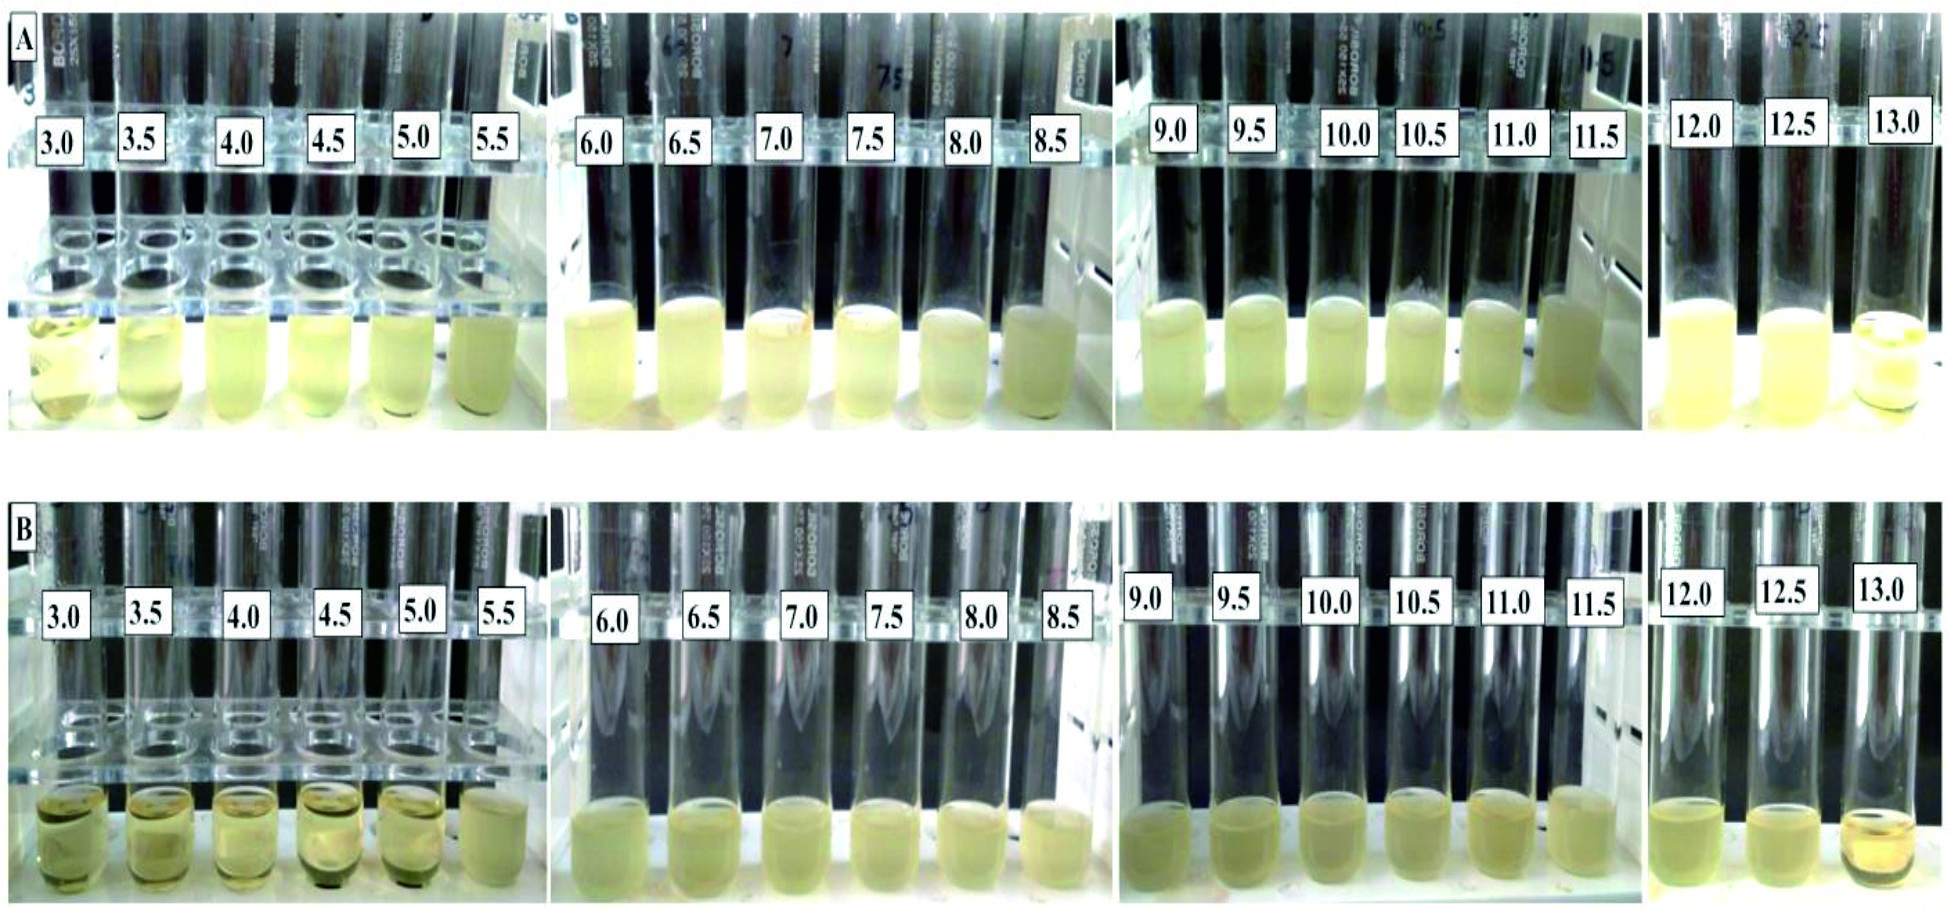
Fig. 1. Growth of A. T-2 isolate and B. MA-4 isolate on LB broth prepared in buffers of different pH range (3.0-13.0)
Table (3):
In-vitro plant growth promoting activity of isolates
| Isolates | Tests | ||||
|---|---|---|---|---|---|
| Phosphate solubilization | Nitrogen Fixation | Pellicle formation +/- (position in mm) | Siderophore production | IAA production | |
| E-1 | – | – | – | – | – |
| E-2 | + | + | – | + | + |
| E-3 | – | – | – | – | + |
| E-4 | – | – | – | + | + |
| E-5 | – | – | – | – | – |
| T-1 | + | + | – | + | + |
| T-2 | + | + | – | + | + |
| T-3 | – | – | – | – | – |
| T-4 | + | + | + (5) | – | + |
| T-5 | + | + | – | – | + |
| R-1 | + | + | – | – | + |
| R-2 | + | + | – | – | + |
| *O-1 | + | + | + (<1) | – | + |
| *O-2 | + | + | + (<1) | + | + |
| *O-3 | – | + | – | – | – |
| MA-1 | + | – | – | + | – |
| MA-2 | + | – | – | + | + |
| MA-3 | + | – | + | + | + |
| MA-4 | + | + | +(<1) | + | + |
| MA-5 | + | + | – | + | + |
| MA-6 | + | + | – | + | + |
| MA-7 | – | + | + (<1) | + | + |
| MA-8 | + | + | + (4) | + | – |
| MA-9 | + | + | + (2) | + | + |
| RP-1 | – | + | + 1 | + | – |
| RP-2 | + | – | – | + | – |
| RP-3 | + | – | – | + | – |
| RP-4 | + | – | – | + | – |
| RP-5 | + | – | – | + | + |
| RP-6 | + | – | – | + | – |
| RP-7 | + | – | – | + | + |
| RP-8 | + | – | – | + | + |
| RP-9 | + | + | +(2) | + | + |
(-) indicates not showing phosphate solubilization, nitrogen fixation, siderophore production, auxin production activity, (+) indicates showing phosphate solubilization, nitrogen fixation, siderophore production, auxin production activity. Nitrogen fixation is based on appearance of blue colour as an indicator of change of pH to alkaline.* isolates already reported by Swarupa and Kumar11. # position of pellicle from top-surface of growth medium.
Table (4):
Growth response of bacterial isolates recorded as O.D. at different pH
T-1 |
T-2 |
O-2 |
E-2 |
R-1 |
MA-4 |
MA-5 |
MA-6 |
MA-9 |
RP-9 |
|
|---|---|---|---|---|---|---|---|---|---|---|
pH |
Avg. O.D ± SD |
Avg. O.D ± SD |
Avg. O.D ± SD |
Avg. O.D ± SD |
Avg. O.D ± SD |
Avg. O.D ± SD |
Avg. O.D ± SD |
Avg. O.D ± SD |
Avg. O.D ± SD |
Avg. O.D ± SD |
3 |
0.02 ± 0.002 |
0.022 ± 0.001 |
0.026 ± 0.003 |
0.017 ± 0.000 |
0.038 ± 0.006 |
0.007 ±0.001 |
0.043 ± 0.002 |
0.039 ± 0.004 |
0.014 ± 0.0005 |
0.015 ± 0.003 |
3.5 |
0.697 ± 0.014 |
0.481 ± 0.009 |
0.017 ± 0.001 |
1.023 ± 0.015 |
0.026 ± 0.002 |
0.014 ± 0.001 |
0.478 ± 0.019 |
0.035 ± 0.003 |
0.016 ± 0.0005 |
0.016 ± 0.003 |
4 |
1.936 ± 0.047 |
1.000 ± 0.010 |
0.011 ± 0.002 |
2.183 ± 0.055 |
0.033 ±0.001 |
0.017 ± 0.001 |
0.478 ± 0.014 |
0.036 ± 0.001 |
0.016 ± 0.001 |
0.015 ± 0.003 |
4.5 |
1.136 ± 0.055 |
1.000 ± 0.020 |
0.009 ± 0.001 |
1.276 ± 0.045 |
0.023 ± 0.004 |
0.021 ± 0.001 |
0.478 ± 0.012 |
0.035 ± 0.001 |
0.020 ± 0.001 |
0.021 ± 0.003 |
5 |
1.336 ± 0.095 |
1.266 ± 0.025 |
0.012 ± 0.004 |
1.506 ± 0.119 |
0.026 ± 0.004 |
0.046 ± 0.001 |
0.478 ± 0.010 |
0.035 ± 0.001 |
0.031 ± 0.006 |
0.022 ± 0.003 |
5.5 |
1.660 ± 0.060 |
1.426 ± 0.109 |
0.038 ± 0.006 |
1.903 ± 0.635 |
0.033 ± 0.013 |
0.792 ± 0.053 |
0.478 ± 0.012 |
0.035 ± 0.001 |
0.503 ± 0.017 |
0.022 ± 0.001 |
6 |
1.636 ± 0.072 |
1.889 ± 0.093 |
0.015 ± 0.003 |
2.586 ± 0.060 |
0.047 ± 0.005 |
1.062 ± 0.024 |
0.478 ± 0.008 |
0.035 ± 0.002 |
0.778 ± 0.024 |
0.026 ± 0.002 |
6.5 |
1.840 ± 0.095 |
2.277 ± 0.620 |
0.075 ± 0.012 |
2.496 ± 0.101 |
0.035 ± 0.002 |
1.148 ± 0.019 |
0.478 ± 0.137 |
0.035 ± 0.002 |
0.811 ± 0.157 |
0.031 ± 0.003 |
7 |
1.263 ± 0.136 |
2.342 ± 0.720 |
1.514 ± 0.067 |
2.496 ± 0.087 |
2.530 ± 0.041 |
1.316 ± 0.045 |
0.478 ± 0.044 |
0.035 ± 0.008 |
1.272 ± 0.080 |
0.860 ± 0.013 |
7.5 |
1.640 ± 0.165 |
2.568 ± 1.131 |
1.473 ± 0.032 |
2.490 ± 0.398 |
1.718 ± 0.098 |
1.412 ± 0.123 |
0.478 ± 1.361 |
0.035 ± 0.006 |
1.381 ± 0.061 |
0.960 ± 0.111 |
8 |
1.533 ± 0.100 |
2.652 ± 0.020 |
1.670 ± 0.055 |
2.696 ± 0.143 |
2.306 ± 0.056 |
1.110 ± 0.273 |
0.478 ± 1.019 |
0.035 ± 0.018 |
1.487 ± 0.048 |
0.797 ± 0.256 |
8.5 |
1.600 ± 0.157 |
2.482 ± 0.063 |
1.803 ± 0.075 |
2.636 ± 0.143 |
2.533 ± 0.061 |
0.845 ± 0.044 |
0.478 ± 0.319 |
0.035 ± 0.040 |
1.487 ± 0.079 |
0.585 ± 0.104 |
9 |
1.490 ± 0.126 |
1.996 ± 0.024 |
1.699 ± 0.031 |
2.573 ± 0.020 |
2.121 ± 0.082 |
0.802 ± 0.025 |
0.478 ± 0.069 |
0.035 ± 0.022 |
1.487 ± 0.105 |
0.375 ± 0.092 |
9.5 |
1.176 ± 0.032 |
2.160 ± 0.609 |
1.373 ± 0.457 |
2.503 ± 0.035 |
1.567 ± 0.184 |
0.606 ± 0.019 |
0.478 ± 0.061 |
0.035 ± 0.062 |
1.487 ± 0.195 |
0.014 ± 0.005 |
10 |
1.180 ± 0.158 |
2.468 ± 0.030 |
0.004 ± 0.0005 |
2.283 ± 0.145 |
1.513 ± 0.032 |
0.231 ± 0.004 |
0.478 ± 0.090 |
0.035 ± 0.030 |
1.487 ± 0.193 |
0.007 ± 0.001 |
10.5 |
0.183 ± 0.011 |
2.120 ± 0.159 |
0.003 ± 0.0005 |
1.983 ± 0.130 |
1.376 ± 0.157 |
0.208 ± 0.004 |
0.478 ± 0.048 |
0.035 ± 0.055 |
1.487 ± 0.270 |
0.008 ± 0.001 |
11 |
0.070 ± 0.002 |
2.108 ± 0.259 |
0.006 ±0.001 |
1.523 ± 0.205 |
1.577 ± 0.006 |
0.169 ± 0.006 |
0.478 ± 0.203 |
0.035 ± 0.162 |
1.487 ± 0.245 |
0.007 ± 0.001 |
11.5 |
0.059 ± 0.007 |
2.261 ± 0.047 |
0.004 ± 0.003 |
0.983 ± 0.188 |
1.546 ± 0.011 |
0.138 ± 0.003 |
0.478 ± 0.078 |
0.035 ± 0.204 |
1.487 ± 0.127 |
0.006 ± 0.001 |
12 |
0.043 ± 0.005 |
1.733 ± 0.065 |
0.003 ± 0.002 |
0.446 ± 0.045 |
1.502 ± 0.011 |
0.115 ± 0.036 |
0.478 ± 0.060 |
0.035 ± 0.063 |
1.487 ± 0.117 |
0.006 ± 0.001 |
12.5 |
0.033 ± 0.006 |
1.668 ± 0.038 |
0.005 ± 0.0005 |
0.310 ± 0.017 |
1.448 ± 0.096 |
0.025 ± 0.002 |
0.478 ± 0.060 |
0.035 ± 0.018 |
1.487 ± 0.008 |
0.003 ± 0.016 |
13 |
0.021 ± 0.000 |
0.046 ± 0.002 |
0.001 ±0.0005 |
0.230 ± 0.000 |
0.046 ± 0.015 |
0.020 ± 0.001 |
0.478 ± 0.002 |
0.035 ± 0.004 |
1.487 ± 0.013 |
0.003 ± 0.001 |
Avg.- Average of three O.D. readings of bacterial culture in respective pH growth medium. SD- Standard deviation of O.D. O.D. was measured at wavelength 600 nm.
Table (5):
Reaction class range classification of PGPB isolates
Isolates |
Range of pH# |
Reaction Class Range18 |
|---|---|---|
T-1 |
3.5-10.0 |
Extremely acid-Very strongly alkaline |
E-2 |
3.5-11.0 |
Extremely acid-Very strongly alkaline |
MA-5 |
4.0-12.5 |
Extremely acid-Very strongly alkaline |
T-2 |
5.0-12.5 |
Strongly acid- Very strongly alkaline |
MA-4 |
5.5-9.0 |
Strongly acid-Strongly alkaline |
MA-9 |
6.0-11.5 |
Moderately acid-Very strongly alkaline |
RP-9 |
7.0-9.0 |
Neutral-Strongly alkaline |
O-2 |
7.0-9.5 |
Neutral –Very strongly alkaline |
R-1, MA-6 |
7.0-12.5 |
Neutral-Very strongly alkaline |
# The pH range in which the growth (O.D.) of isolates remain at or above the 50% of the highest growth O.D. of respective isolates.
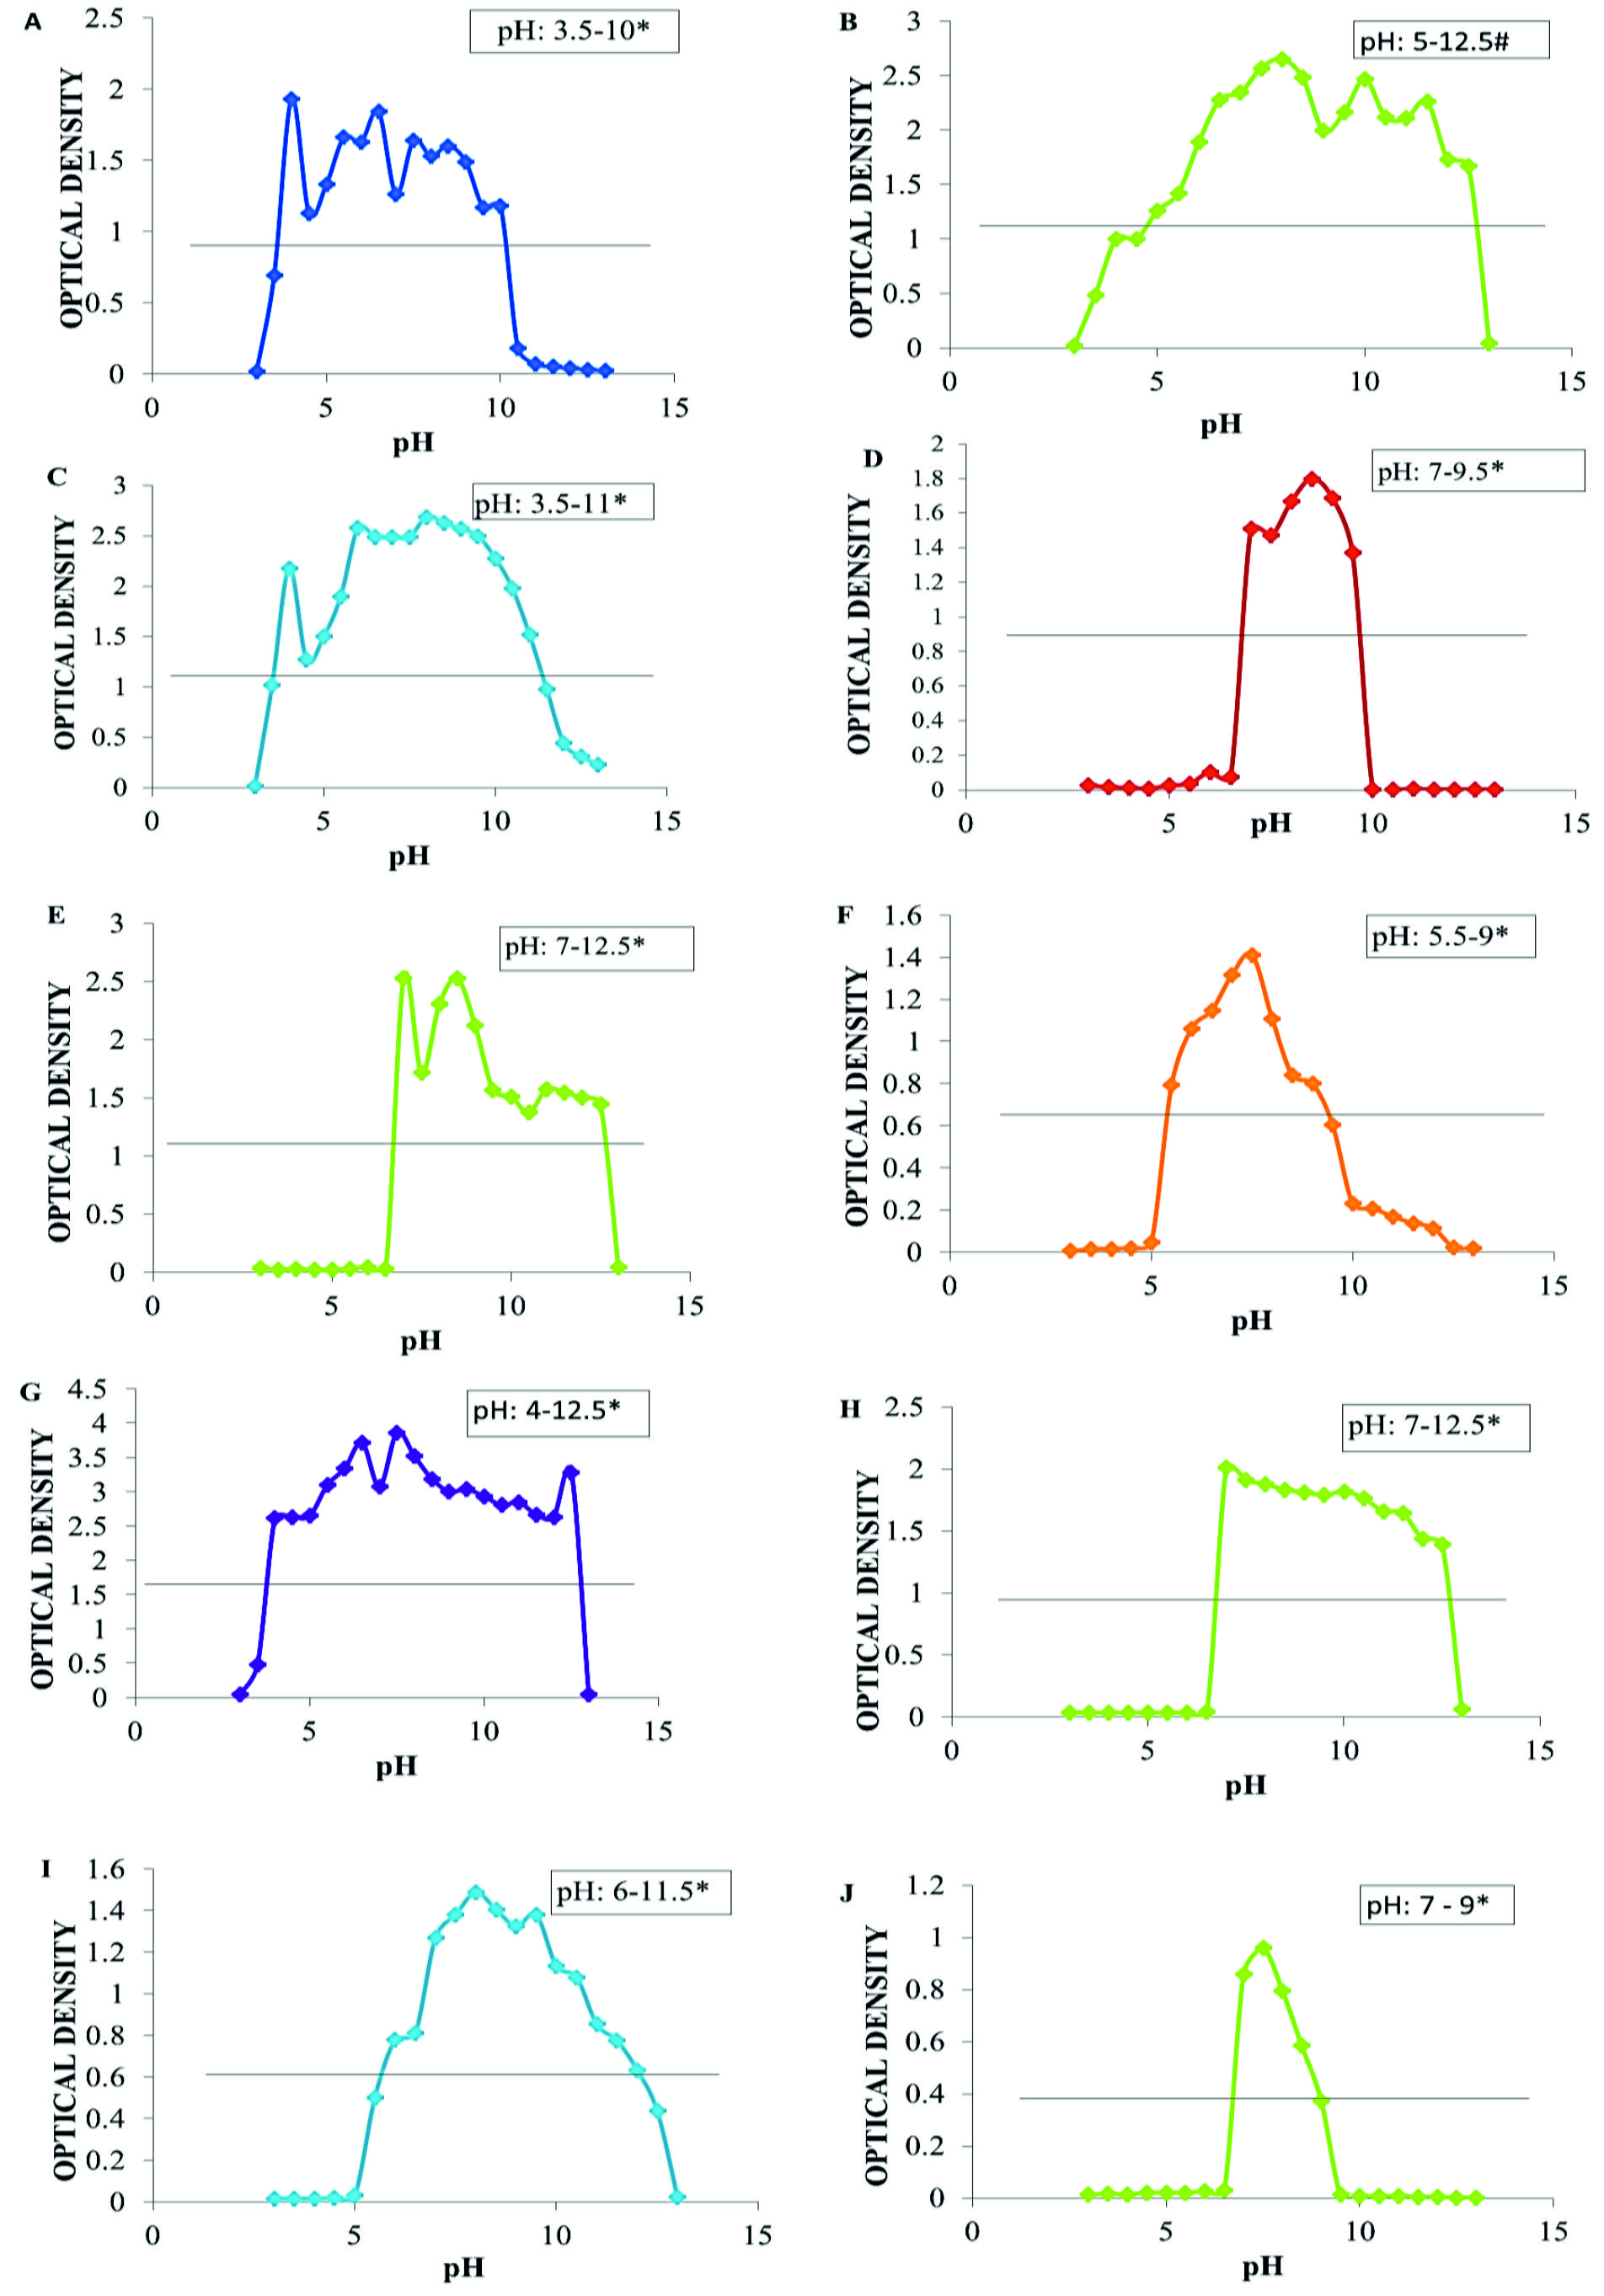
Fig. 2. Graph showing growth curve at different pH of A. T-1 isolate; B. T-2 isolate; C. E-2 isolate; D. O-2 isolate; E. R-1 isolate; F. MA-4 isolate; G. MA-5 isolate; H. MA-6 isolate; I. MA-9 isolate and J. RP-9 isolate. * indicates pH range of avg. growth (The pH range in which the growth (O.D.) of isolates remain at or above the 50% of the highest growth O.D. of respective isolates). Horizontal lines represent O.D. at 50% of the highest growth O.D of respective isolate.
Bacterial isolates T-1, T-2, O-2, E-2, R-1, MA-4, MA-5, MA-6, MA-9 and RP-9 besides revealing all the PGP activity tested also exhibited average growth over a wide range of pH except O-2 and RP-9 which showed growth in narrow range of pH 7-9.5. pH dependent growth response curves of selected ten PGP isolates (Table 4-5 and Fig. 2 ) revealed that a consortium of these PGP bacterial isolates may be formulated for their application as biofertilizer and/or biostimulants in agricultural fields of acidic, neutral, alkaline as well as wide pH range 3.5-12.5. This finding is also useful in helping the plants to manage for tolerance to abiotic (pH) stress as reported by Chari et al., 201819 who characterized PGP Bacillus spp. under different abiotic stress. O-2 and RP-9 has viability in narrow range of pH and hence limited applicability but is very suitable in fields or the geographical location of pH range 7-9.5 where pH variation has not been evident for long. R-1 and MA-6 isolates had growth range in neutral to slightly alkaline pH and has greater applicability in neutral to highly alkaline soil. MA-4 and MA-9 isolates have growth range in the pH of slightly acidic to highly alkaline condition and hence can be applied in slightly acidic to highly alkaline soils. Chari et al., 201819 reported high pH tolerance range of isolated PGPR i.e. 4.0-12.0. There are other reports19 which also reported that PGPR can tolerate pH range of 5-9 and enhanced the rate of seed germination. Bacterial isolates which have same range of pH tolerance may show compatibility with each other and can be applied as bacterial consortium in agricultural fields20,21. T-2, E-2, T-1 and MA-5 isolates have almost same range of pH tolerance as well as grow over broad range of pH 3.5-10 and hence can be used as bacterial consortium which will enhance plant growth and yield through multiple plant growth promoting mechanisms in soil of different pH. Use of consortium has more advantages as compared to single isolate in efficiency, viability, modularity and robustness when applied in agricultural fields to increase plant productivity22. These bacterial consortia can be used as bioinoculants to increase the plant growth and ultimately crop yield under extreme pH stress. However other parameters like co-culture compatibility and performance under other environmental conditions have yet to be evaluated for successful formulation of consortium using these isolates.
Acknowledgments
This study was supported by CSIR (09/1126(0001)/2014-EMR-1) and DBT Builder program [BT/PR9028/INF/22/193/2013] and work station provided by Central University of Jharkhand, Brambe (Ranchi), Jharkhand, India
Conflicts Of Interest
The author declare that there are no conflicts of interest.
Authors’ Contributions
AK designed the experiments. PS, MK and SH performed the experiments. AK analyzed the data. AK, PS, MK and SH wrote and reviewed the manuscript.
Funding
This study was supported by grants 09/1126(0001)/2014-EMR-1 and Builder program BT/PR9028/INF/22/193/2013 from the CSIR and DBT-GoI respectively. The funders had no role on study design, data collection and analysis, decision to publish or preparation of the manuscript.
Data Availability
All datasets generated or analyzed during this study are included in the manuscript.
Ethics Statement
This article does not contain any studies with human participants or animals performed by any of the authors.
- Siddiqui S.A., Fatima N. Indian Soils: Identification and Classification. Earth Science India, 2017; 10: 1-14.
- Miller J.O. Soil pH affects nutrient availability. University of Maryland Extension. Fact sheet. 2016; 1054.
- Tilak K.V.B.R., Ranganayaki N., Pal K.K., De R., Saxena AK, Nautiyal CS, Mittal S, Johri BN. Diversity of plant growth and soil health supporting bacteria. Current Science, 2005; 89: 136-150.
- Schoonover J.E., Crim J.F. An Introduction to Soil Concepts and the Role of Soils in Watershed Management. Journal of Contemporary Water Research & Education, 2015; 154(1): 21-47.
- Chowdhury A., Pradhan S., Saha M., Sanyal N. Impact of pesticides on soil microbiological parameters and possible bioremediation strategies. Indian Journal of microbiology, 2008; 48(1): 114-127.
- Kloepper J.W., Schroth M.N. Plant growth-promoting rhizobacteria and plant growth under gnotobiotic conditions. Phytopathology, 1981; 71(6): 642-644.
- Rousk J., Brookes P.C., Baath E. Contrasting soil pH effects on fungal and bacterial growth suggest functional redundancy in carbon mineralization. Applied and Environmental Microbiology, 2009; 75(6): 1589–1596.
- Fierer N., Jackson R.B. The diversity and bio-geography of soil bacterial communities. Proceedings of the National Academy of Sciences of the United States of America, 2006; 103: 626–631
- Calvo P., Nelson L., Kloepper J.W. Agricultural uses of plant biostimulants. Plant and soil, 2014; 383(1-2): 3-41.
- Swarupa P., Kumar A. Impact of Chlorpyrifos on Plant Growth Promoting Rhizobacteria Isolated from Abelmoschus esculentus. Journal of Pure and Applied Microbiology, 2018; 12(4): 2149-2158.
- Prescott L.M., Harley J.P., Klein D.A. Micro-organisms in aquatic environments In Micro-biology, 2002, pp. 632-663. 5th Ed. Mc Gram-Hill Companies Inc, New York.
- Aneja K.R. Experiments in Microbiology, Plant pathology and Biotechnology., 2003, pp. 102-105. 4th Ed. New Age International (P) Ltd. New Delhi.
- Boddey R.M., Dobereiner J. Nitrogen fixation associated with grasses and cereals: recent progress and perspectives for the future, in Nitrogen Economy in Tropical Soils. Springer, 2003 1995; 241-250.
- Pikovskaya R.I. Mobilization of phosphorus in soil in connection with vital activity of some microbial species. Mikrobiologiya, 2003 1948; 17: 362-370.
- Gordon S.A., Weber R.P. Colorimetric estimation of indoleacetic acid. Plant physiology, 1951; 26(1): 192.
- Schwyn B., Neilands J.B. Universal chemical assay for the detection and determination of siderophores. Analytical biochemistry, 1987; 160(1): 47-56.
- http://delloyd.50megs.com/moreinfo/buffers2.html
- Soil Science Division Staff. Soil survey manual, USDA Handbook 18. Government Printing Office, Washington, D.C. 2017.
- Chari K.D., Reddy R.S., Triveni S., Trimurtulu N., Rani C.V., Sreedhar M. Isolation and Characterization of Abiotic Stress Tolerant Plant Growth Promoting Bacillus Spp. from Different Rhizospheric Soils of Telangana. Biosciences Biotechnology Research Asia, 2018; 15(2): 485-94.
- Sundaramoorthy S., Raguchander T., Ragupathi N., Samiyappan R. Combinatorial effect of endophytic and plant growth promoting rhizobacteria against wilt disease of Capsicum annum L. caused by Fusarium solani.Biological Control, 2012; 60(1): 59-67.
- Singh A., Jain A., Sarma B.K., Upadhyay R.S., Singh H.B. Rhizosphere competent microbial consortium mediates rapid changes in phenolic profiles in chickpea during Sclerotium rolfsii infection. Microbiological research, 2014; 169(5-6): 353-360.
- Kumar K.H., Jagadeesh K.S. Microbial consortia-mediated plant defense against phytopathogens and growth benefits. South Indian Journal of Biological Sciences, 2016; 2(4): 395-403.
© The Author(s) 2019. Open Access. This article is distributed under the terms of the Creative Commons Attribution 4.0 International License which permits unrestricted use, sharing, distribution, and reproduction in any medium, provided you give appropriate credit to the original author(s) and the source, provide a link to the Creative Commons license, and indicate if changes were made.