


ISSN: 0973-7510
E-ISSN: 2581-690X
and Muthukalingan Krishnan1,4
In the present study, clarification of apple juice with tannase from S. marcescens IMBL5 produced using various agro-waste materials was carried out. Sugarcane bagasse was found to be the most suitable source for the augmented production of tannase enzyme by response surface methodology with the temperature at 40 °C, pH 4.5 and the incubation period of 96 hrs. The enzyme was quantified and partially purified through protein precipitation. The partially purified tannase with gelatin clarified about 62% of the apple juice in 3 hr of incubation at room temperature and it was gently increased with the incubation period. The detannification was characterized by estimating tannin content of the clarified juice. The amount of total reducing sugar in the juice was increased almost 50 % after 5 hours of incubation period. FTIR spectrum of the clarified juice revealed that the conformational changes that occurred in the functional groups. The spectrum absorptions between 500 and 1700 cm-1 mainly reflected the C=O stretch of the pectins and acids and C–O modes of the carbohydrates that correspond to the absorption zones of the sugars. The HPLC analysis of the clarified apple juice indicate the presence of phenolic compounds and sugar derivatives such as gallic acid, catechin, caffeic acid, epicatechin, glucose and sucrose which confirms the quality and clarity of the apple juice using the tannase enzyme.
Tannase, Agro-industrial wastes, Sugarcane bagasse, Response surface methodology, Apple juice clarification, High performance liquid chromatography
The growing human population builds a high demand for food products and consequently agro-industrial wastes are elevated. All over the world, it has been reported that millions of tons of agricultural wastes are produced yearly.1 Most of the agro-industrial wastes are left unused or disposed into environment without proper disposal process which affects human and animal health. It also causes environmental pollution and climate change by generating greenhouse gases.2 Generally, agro-industrial wastes contain high carbon and nitrogen content and are the better alternative for many hydrolytic enzyme productions at a lower cost.3 Number of various agro-industrial wastes such as coconut powder, rice bran, coffee husk, sugarcane bagasse, rice straw, groundnut waste, wheat bran, cashew apple bagasse, fruit, and vegetable pulps are utilized by bacteria and fungi as a substrate for the production of industrially important enzymes like tannase, cellulase, amylase, endoglucanase, and exoglucanase.4,5 Among these enzymes, tannase is the most exploited enzymes which holds a significant role in feed, food, beverage and pharmaceutical and cosmetics production industries. The enzyme tannase is an extracellular enzyme that produced from bacteria and fungi using most of the agro-industrial residues.6 Fruits may have astringency and bitter taste due to the presence of tannins and so tannase was highly utilized in fruit juice clarification process since they have effective tannin degradation and polyphenol stabilization properties.7,8
Apple juice is the highly consuming and revenue generating fruit juice in the global market. The raw apple juice is brown in color and contains turbid due to the presence of different tannins, proteins, and polysaccharides which are tend to settle down during storage. The production of clear apple juice is a challenging factor and the removal of suspended materials prevents turbidity development during storage.9 The conventional apple juice clarification process consists of vast time-consuming methods and also expensive compared with the novel clarification methods using microbial enzymes. The removal of tannin, pectin and starch and elimination of haze formation is the key process of juice clarification, which can be achieved effectively only through enzymatic degradation.10,11 In this study, enhanced tannase production from the gut microbe S. marcescens IMBL5 was attempted using different agro-industrial waste materials, and its efficiency in apple juice clarification was perceived through validating multiple analysis.
Materials
Tannic acid, Sodium acetate and Ammonium sulphate were obtained from sigma. All the solutions were prepared using deionized water.
Maintenance of microbial strains
S. marcescens IMBL5 a potent tannase producer isolated previously from the gut of Onthophagus babirussa IMBL, a dung beetle was used for tannase production.12 The culture was stored with glycerol (15 % v/v) in a deep-freezer (−80 °C).
Tannin containing agro-waste materials
Different Tannin-containing agro-waste materials were co-utilized in this study as a sole carbon source for the growth of the S. marcescens IMBL5 and as the inducer for tannase as well. Agro-industrial wastes used in this study included wheat bran, rice bran, sawdust, corn waste, sugarcane bagasse, orange pulp and coffee husk collected from various agro fields. The ground substrates were washed with purified water then dried in hot air oven at 60 °C for about 48 hr and stored in vials at room temperature before their incorporation into the fermentation broth.
Selection of agro-industrial waste through one-factor-at-a-time (OFAT) method
The influence of different agro waste material on tannase production was primarily studied through the traditional OFAT method. The agro-industrial wastes such as rice bran, wheat bran, sugarcane bagasse, sawdust, corn straw, coffee husk were used as sole carbon sources in the basal medium to find the tannase activity. The tannase enzyme was quantified using a method prescribed by Pan et al.13 The optimized concentration of the chosen agro-waste material was used as a key ingredient for further experiments to optimize the culture condition factors by RSM. The origin software (ver. 2018) was used to analyze the experimental data.
Optimization of the factors using Central composite design (CCD)
RSM was employed to achieve optimized tannase production using an independent variables, such as sugarcane bagasse (A), temperature (B), pH (C), and incubation time (D) at five coded levels (Table 1). All experiments were performed in triplicate, and the results were analyzed in Design Expert 11.0 software (Stat-Ease Inc., Minneapolis, USA). The experimental results of CCD were fitted into the following regression equation.
Y = β0 + Σ βiXi + Σ βiiXi2 + Σ βijXiXj
Where Y is the predicted response, Xi and Xj are coded input variables of tannase production. The intercept is β0, and βi & βii denotes the linear and quadratic coefficient respectively. The interaction coefficient is termed by βij. The significance and adequacy of the obtained model were tested through F-test (Fisher’s test) and ANOVA (analysis of variance). The relationship between responses are illustrated by the two-dimensional contour plots.
Apple juice preparation and clarification
Two kilogram apples obtained from the local market for the juice preparation were washed thoroughly with water and surface sterilized with 150 ppm sodium hypochlorite solution. Then they were cut into small pieces and the juice was extracted from the apples using a juice extractor. Then the raw, unclarified juice was filtered using cheesecloth and the filtered juice was stored at 4 °C.
The clarification of the apple juice was done as described by Andrade et al.14 with minor modifications. Five milligram of gelatin was pre-swelled in 500 µl of distilled water and melted in microwave oven. The prepared gelatin was mixed in 1:1 ratio with tannase enzyme just before the treatment. A volume of 50 mL of apple juice was taken in a flask and 5.0 mL of tannase mixture was added and then kept for incubation. One ml aliquot of fruit juice sample was taken from flask at 1 h interval. After incubation, the samples were kept in a water bath at 90 °C for 1 min for enzyme denaturation and then centrifuged at 10,000×g for 8 min. Apple juice with water instead of the enzyme was used as control. The transmittance of the supernatant was analyzed using UV-Vis spectrophotometer at 600 nm (Ultraspec pro 2100). Juice clarification was calculated by using the formula
Percentage of juice Clarification = Tr.t – Tr. c /Tr. c x100
Where, Tr. t = Transmittance of Test, Tr. c = Transmittance of control
Determination of tannin content in apple juice
The total tannin content of the clarified apple juice was estimated by the protein precipitation procedure previously described by Makkar et al.15
Estimation of reducing sugars
The amount of reducing sugars in the juice was determined using the Di-nitrosalicylic acid method as demonstrated by Lanza et al.16 Here glucose is used as standard and untreated apple juice is used as control. The absorbance was noted after one hour of incubation of juice with enzyme gelatin mixture at 40 °C.
(2, 2-diphenyl-1-picrylhydrazyl) DPPH antioxidant assay
The antioxidant property of the clarified apple juice was measured as described by Rydzak et al.17 Four milliliters methanol containing DPPH radicles was added to 0.5 mL of clarified juice. Then it was vigorously shaken and incubated in the dark chamber for 30 minutes. Then the absorbance was noted at 517 nm and of methanol was used as blank. The anti-radical activity of the apple juice was calculated by
DPPH free radical scavenging ability % = (1- OD of sample / OD of control) x 100
Characterization of juice clarification through spectral analysis
Infrared spectroscopic analysis was employed to identify the major phenolic groups and sugar derivatives present in the apple juice clarified through tannase of S. marcescens IMBL5 following the methodology of Dhaulaniya et al.18 The infra-red spectrum was obtained between 500 – 4000 cm-1 frequency range using Fourier-transform infrared spectrometer (Perkin Elmer, Inc., Llantrisant, UK).
Chromatographic characterization of clarified apple juice
The tannase clarified apple juice was centrifuged and then the supernatant was used for the analysis. The occurrence of phenolic compounds and sugar derivatives were determined by HPLC according to the procedure by Onsekizoglu et al.19 The C18 column was used for the separation at a flow rate of 1 mL/min at 25 °C.
Effect of agro waste raw materials as carbon source in tannase production
The key ingredients from the agro-industrial waste materials which influence the biosynthesis of tannase were identified using traditional OFAT method. The production of tannase evaluated by employing diverse agro-industrial waste materials as sole carbon source and sugarcane bagasse exhibited the highest tannase production amongst the others (Fig. 1) followed by wheat bran and coffee husk at 3% (w/v) concentration. Tannase production observed in sugarcane bagasse, wheat bran and coffee husk were calculated as 34.81 U/ml, 23.87 U/ml and 19.69 U/ml respectively.
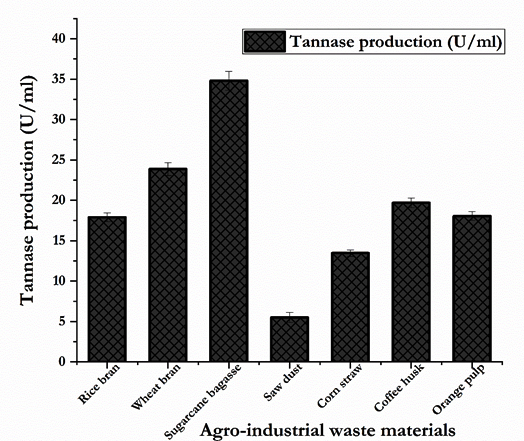
Fig. 1. Effect of agro-industrial waste materials for the optimization of tannase production from S. marcescens IMBL5 using OFAT approach.
There are some reports fairly agreed with the present observations that the wheat bran, pomegranate rind, oil mill waste and palm kernel powder as best substrates for tannase production.3,20-22 Paranthaman et al.23 stated that the agro-industrial wastes sugarcane bagasse and rice straw were the better alternatives for the enhanced tannase production.
Table (1):
A four factor variables and levels of the CCD experiment.
| Variables | Units | Coded values | Range of levels | ||||
|---|---|---|---|---|---|---|---|
| –α | –1 | 0 | +1 | +α | |||
| Sugar bagasse | g/l | A | 1.0 | 1. 5 | 2.0 | 2.5 | 3.0 |
| Temperature | °C | B | 30 | 35 | 40 | 45 | 50 |
| pH | – | C | 3.5 | 4 | 4.5 | 5 | 5.5 |
| Incubation time | h | D | 46 | 72 | 96 | 120 | 144 |
Table (2):
Experimental design and corresponding responses of the RSM analysis.
| Run | Sugarcane bagasse (g/l) | Temp (ºC) | pH | Incubation time (h) | Response Tannase activity (U/mL) | |
|---|---|---|---|---|---|---|
| Actual values | Predicted values | |||||
| 1 | 25 (+1) | 30 (-α) | 4 (-1) | 120 (+1) | 93.40 | 92.76 |
| 2 | 25 (+1) | 35 (-1) | 5 (+1) | 72 (-1) | 82.60 | 84.21 |
| 3 | 15 (-1) | 35(-1) | 5 (+1) | 72 (-1) | 79.60 | 79.08 |
| 4 | 15 (-1) | 45 (+1) | 5 (+1) | 72 (-1) | 89.80 | 88.47 |
| 5 | 20 (0) | 40 (0) | 4 (-1) | 96 (0) | 100.30 | 101.08 |
| 6 | 30 (+α) | 40 (0) | 4.5 (0) | 96 (0) | 87.40 | 87.50 |
| 7 | 10 (- α) | 40 (0) | 4.5 (0) | 96 (0) | 87.40 | 89.25 |
| 8 | 15 (-1) | 45 (+1) | 4 (-1) | 120 (+1) | 96.40 | 93.02 |
| 9 | 20 (0) | 30 (- α) | 4.5 (0) | 96 (0) | 81.10 | 81.04 |
| 10 | 20 (0) | 40 (0) | 5.5 (+ α) | 96 (0) | 92.20 | 92.97 |
| 11 | 20 (0) | 40 (0) | 4.5 (0) | 48 (-α) | 80.90 | 81.99 |
| 12 | 15 (-1) | 35 (-1) | 3.5 (- α) | 120 (+1) | 86.20 | 87.38 |
| 13 | 20 (0) | 40 (0) | 4.5 (0) | 96 (0) | 102.70 | 103.13 |
| 14 | 25 (+1) | 45 (+1) | 5 (+1) | 120 (+1) | 91.10 | 91.46 |
| 15 | 15 (-1) | 45 (+1) | 4 (-1) | 120 (+1) | 92.20 | 93.02 |
| 16 | 25 (+1) | 45 (+1) | 4 (-1) | 120 (+1) | 85.40 | 86.04 |
| 17 | 25(+1) | 35 (-1) | 4 (-1) | 72 (-1) | 83.60 | 83.40 |
| 18 | 15 (-1) | 35 (-1) | 4 (-1) | 72 (-1) | 87.80 | 85.79 |
| 19 | 25 (+1) | 45 (+1) | 5 (+1) | 72 (-1) | 90.70 | 88.73 |
| 20 | 20 (0) | 40 (0) | 4.5 (0) | 96 (0) | 103.10 | 103.13 |
| 21 | 15 (-1) | 35 (-1) | 5 (+1) | 120 (+1) | 87.30 | 86.78 |
| 22 | 25 (+1) | 45(+1) | 4 (-1) | 72 (-1) | 85.40 | 84.86 |
| 23 | 15 (-1) | 45 (+1) | 4 (-1) | 72 (-1) | 91.20 | 92.12 |
| 24 | 20 (0) | 40 (0) | 4.5 (0) | 144 (+ α) | 90.10 | 90.86 |
| 25 | 25 (+1) | 35 (-1) | 5 (+1) | 120 (+1) | 93.30 | 92.18 |
| 26 | 20 (0) | 50 (+ α) | 4.5 (0) | 96 (0) | 84.90 | 86.64 |
RSM analysis
To determine the optimal value of the factors that affects tannase production, experiments were designed using uniform design method, which include the experiment with four factors (sugarcane bagasse, temperature, pH and incubation time) and the experimental design is given in Table 1. The tannase production was enhanced after the analysis of CCD data (102.7 U/ml and 103.1 U/ml at run 13 and 20 respectively, Table 2) when all the four factors were remained the same as of preliminary experiments (center point values). When the pH was lower and all the other factors i.e., sugarcane concentration, temperature and incubation time were maintained at 0 levels, augmented tannase production was observed more or less same as that of center point values (100.3 U/ml, run 5, Table 2). Similarly, when temperature and incubation time were retained at +1 with pH at -1 level, increased tannase production was detected (96.4 U/ml, run 8, Table 2) which indicates that the lower pH favored tannase production. When we compared the runs where sugarcane concentrations were maintained at levels +1 and +α with varying pH, temperature (-1 and +1), it was found that the tannase production was lower (87.4 U/ml, 85.4 U/ml and 83.6 U/ml, run 6, 16 and 17 respectively. Table 2) which denotes that higher concentration of carbon source may affect the enzyme production. Similarly reduction in tannase production i.e., 81.1 U/ml and 84.9 U/ml were observed at – α and + α levels of temperature and with other three parameters at 0 levels which described the dependence of tannase production on temperature. The effects of the four variables on tannase production using ‘Design Expert11’ software was described below.
Y = 103.1 – 0.462*A + 1.40*B – 0.323*C – 2.217*D – 3.701*A2 – 4.822*B2 – 2.379*C2 – 4.176* D2 – 1.216*AB + 1.879*AC + 0.069*AD + 0.764 *BC – 1.311*BD + 0.386*CD
Where Y is the tannase production from S. marcescens IMBL5 and A, B, C and D are the values of the four independent factors such as sugarcane bagasse, temperature, pH, and incubation time respectively. The significance and competence of the regression model was verified by ANOVA (Table 3) authenticate that the model is significant for tannase production using agro waste material. In this study, B, D, AB, AC, BD, A², B², C² and D² are predicted as a significant model terms.
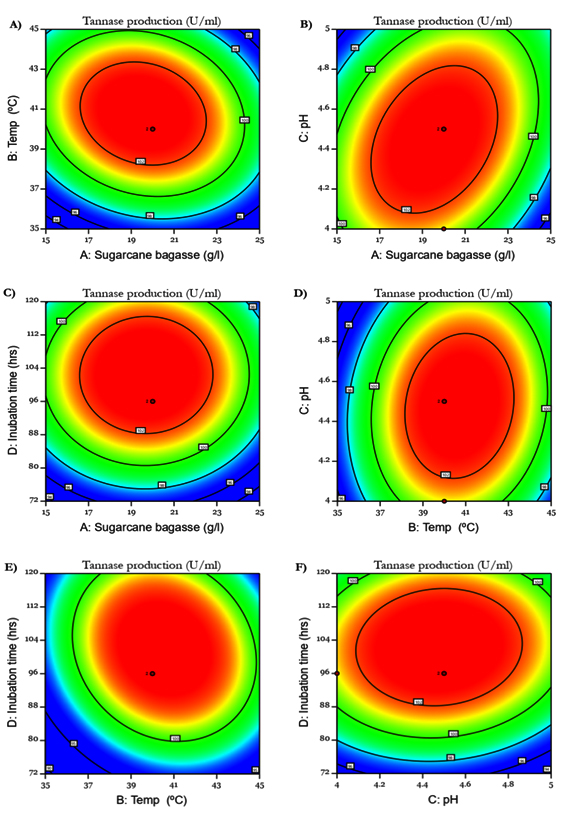
Fig. 2. Optimization of sugarcane bagasse and physical parameters on the production of tannase by RSM using CCD. (a) Influence of temperature and sugarcane bagasse on tannase production, (b) Influence of pH and sugarcane bagasse on tannase production, (c) Influence of incubation time and sugarcane bagasse on tannase production, (d) Influence of pH and temperature on tannase production, (e) Influence of incubation time and temperature on tannase production, (f) Influence of incubation time and pH on tannase production.
Table (3):
ANOVA results for the response surface quadratic model for tannase production.
Term |
Values |
|---|---|
Standard deviation |
1.87 |
Mean |
89.49 |
CV% |
2.09 |
R2 |
0.9608 |
Adjusted R2 |
0.911 |
Predicted R2 |
0.714 |
Adeq Precision |
16.89 |
Model F- value |
19.27 |
Lack of fit F- value |
1.16 |
PRESS |
282.02 |
The two dimensional contour plots showed in the Fig. 2A- 2F are the graphical representations of the analytic model showing the four factor interaction effect of tannase production. The contour lines characterize the interaction of any two variables upon the response when the remaining variables are maintained at optimum. The smallest ellipse region is known to be the vital response area and the intersection point of the minor and major axes of the ellipse is described as the optimal point. Fig. 2A demonstrate the effect of pH (x1) and incubation time (x2) on enzyme production while sugarcane bagasse and temperature are maintained at their optimal value. The elliptical contours in Fig. 2A designate the interface between two variables x1(pH) and x2 (incubation time) on tannase production. The perfect elliptical contours in Fig. 2B, 2D and 2F states the ample interaction on the responses where the effect of sugarcane bagasse (x1) and pH (x2), temperature (x1) and pH (x2), pH (x1) and incubation time (x2) were analyzed respectively.24 Virtually a circular plot in Fig. 2C implies that the interaction between the represented variables, sugarcane bagasse (x1) and incubation time (x2) are less.25 In Fig. 2E, the interaction effect of temperature and incubation time on tannase production was measured and the elliptical plot indicate the substantial interaction among the factors. RSM was effectively utilized to optimize the tannase production by A. oryzae using agro-waste pomegranate rind extract.22
Validation of the analysis model
The predicted values obtained from the analytical model were 19.2 g/l, 40°C, 4.3 and 96 for x1, x2, x3 and x4 with the tannase production of 102.98 U/ml. This was correspond to the response obtained from experimental value of 100.72 U/ml with <2 % error which was 3.3 fold higher than that of the enzyme production through OFAT analysis.

Fig. 3. Apple juice clarification using tannase enzyme from S. marcescens IMBL5 along with gelatin.
Apple juice clarification
Microbial enzymes with stability in acidic pH range are suitable candidates for fruit juice clarification as most of the fruit juices are acidic.26 The effect of tannase on the clarification of apple juice is shown in Fig. 3, here 1 ml (253 U/ml) of tannase enzyme was used for the clarification of 10 ml apple juice. Apple juice clarification up to 60% was observed in 3 hours of incubation with tannase enzyme and gelatin mixture. The enzyme mixture gave up to 80% juice clarification with five more incubation hours. The yield of clarified juice was also increased about 5% and visually the enzyme treated juice showed maximum clearance. The pectin present in fruits leads to colloid formation, which decreases the commercial value of juices. During the enzymatic clarification process, removal of the colloidal materials occur and this leads to the presence of more soluble materials.27 The reduction of turbidity can be related to the degradation of cell wall components such as tannins and pectin which indicate the efficiency of the clarification process.14
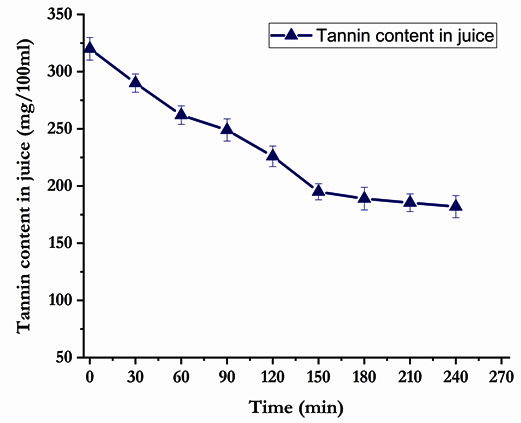
Fig. 4. Estimation of tannin content in the clarified apple juice.
Detannification of apple juice
Tannins like plant polyphenols are astringent compounds and bitter in taste. The eco-friendly and healthy method of detannification by using the microbial tannase was showed in Fig. 4. About 45% of tannin content decrease was observed within 3 hr of incubation with enzyme-gelatin mixture. A gradual decrease in total tannin content represented the effective tannin degradation by tannase which evidenced the active clarification. Then, the tannin concentration was further decreased slowly with extending the incubation hours. Generally, addition of tannase into fruit juice could aid the tannin degradation but the addition of gelatin along with tannase gives commendable result. The tannase-gelatin treatment may be attributed the precipitation of tannins, which in turn the bitterness of the juice was reduced. The results were most consistent with previous reports.28,29
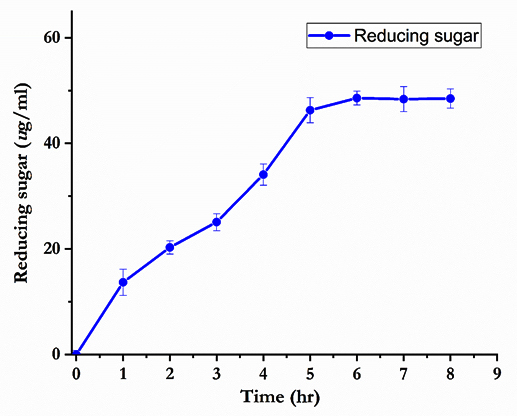
Fig. 5. Estimation of total reducing sugar in the clarified apple juice.
Determination of reducing sugar in juice
The reducing sugar level in juices are the best indicative of the quality juices, and monitoring their levels during juice preparation could aid to improve the market quality. In the Fig. 5, the amount of reducing sugar was exponential and significantly increased by nearly 50 µg/ml after 5 h of incubation time. This may lead to increase the sweetness of the clarified juice. The percentage of reducing sugar observed was higher than that of the juice clarified using enzyme alone. Suryawanshi et al.30 stated that fruit juice treated with mixture of enzymes increased the reducing sugar level.
Antiradical scavenging assay
The antiradical scavenging activity is a very significant characteristic feature of fruit juices and it is measured by DPPH scavenging assay which is a standard method to estimate the stable radicals. The scavenging activity of tannase clarified apple juice was presented in Fig. 6. Tannase from S. marcesens IMBL5 significantly enhanced the clarification and maximum scavenging activity was obtained for the tannase treated apple juice with 74.16 % and 83.67 % for ascorbic acid. Compared with the treated one, lower level of scavenging activity was noticed in the commercial apple juice with 66.08 %. Generally, the cloudy juices show greater ability to scavenge free radicals might be attributed to its high tannin content and so neutralizing the free radicals through transferring the hydrogen atom or an electron. Due to the free radical scavenging capacity, the phenolic compounds like flavonoids and tannins are denoted as the main group of antioxidant phytochemicals with remarkable properties.31 The results supports the findings of Abdullah et al.29 and Jana et al.7 that the tannase treated fruit juices showed 78.44 % and 87.7 % of DPPH radical scavenging activity respectively.
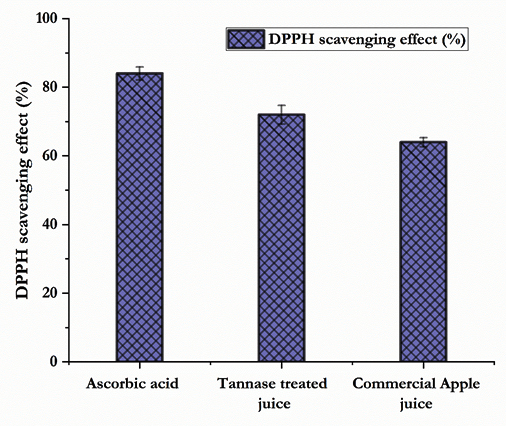
Fig. 6. DPPH radical scavenging activity of tannase on the clarified apple juice.
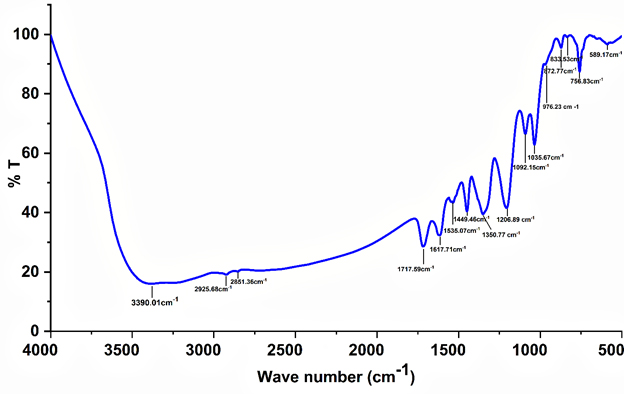
Fig. 7. FT-IR spectrum of clarified apple juice using tannase enzyme from S. marcescens strain IMBL5.
Infrared spectra of a clarified apple juice
FTIR spectroscopy is a cost-effective more rapid method for the investigation of phenolic derivatives and carbohydrates in fruit juices and it can potentially provide facts about their presence and proportions. The IR spectrum of tannase clarified apple juice exhibited a diverse absorption peak patterns from 3390 to 590 cm-1 was presented in Fig. 7. The presence of intermolecular bonded hydroxyl groups (OH) was identified by means of broad and deeply stretched peak at 3390.01 cm-1 confirming the existence of a tannins polymerization.32 The region of aliphatic stretching is diagnosed as a methylation of hydrolysable and condensed tannins. The CH2 stretching of a peak at 2925.68 cm-1 provide information about the methylene substituents.33 A specific, strong peak at 1717 cm-1 denotes the C=O — H bond interaction of catechin occurring in polymers include condensed tannins.34 An aromatic – C = C – stretching are also detected in the spectral region of 1449.46 cm-1 which is typically characterized by an envelope of strong bands with the combinations of C-O stretching, C-H aromatic bending and C-OH deformations. Generally, bands of main carbohydrates were spotted between 900 and 1400 cm-1 spectral range. The absorption peaks patterned at 1092.15 and 1035.67 cm-1 represented C–C stretching C–O modes may be ascribed to the band of glucose. The presence of minor peak at 976.23 cm-1 revealed by the C–O–H bending vibrational mode of fructose.35 The FT-IR result exhibited that tannin present in the apple juice was degraded efficiently by the tannase of S. marcescens strain IMBL5 with varied modification pattern and also the fruit juice quality and authenticity was firmly evaluated.
Chromatographic characterization of apple juice
HPLC system is an ample technique used to detect the presence of phenolic compounds and the rapid characterization of many nutritionally significant polyalcohol and major sugars found in food products. The chromatogram of tannase clarified apple juice was presented in Fig. 8. Phenolic compounds and sugar derivatives in the clarified juice were identified as gallic acid, catechin, caffeic acid, epicatechin, quercetin, sucrose, fructose and sorbitol in C18 column. The compounds spotted in the spectrum were identified through retention time and confirmed by the spectral data of the resultant peaks of previously reported chromatographic investigations of apples juices. The major peak was detected at the retention time of 2.6 min on a chromatogram indicates the presence of gallic acid, an important derivative of tannin degradation and it is also present in apple juice. This peak observation evidently designates the metabolic reaction of tannase on the juice clarification. The peak detected at the retention time of 6.43 min and 12.71 min are indicating the occurrence of phenolic compounds like quercetin and catechin respectively.36,37 These peaks also confirms the presence of carbohydrates such as sucrose and fructose in the clarified apple juice.38 A mild peak observation shown at retention time 15.19 min confirms the presence of the sugar derivative sorbitol. Another peak detected at 17.947 min indicating that the presence of caffeic acid.39 Du et al.40 stated that the caffeic acid, catechin and epicatechin are the leading polyphenols present in apple juice. A peak attained at 20.01 min evidently demonstrating the presence of epicatechin, the predominant byproduct of tannin degradation.41 Similar to our investigation, many other researchers have reported the study of polyphenols in apple juice in various centuries.17,42-44 The chromatogram study indicate the occurrence of polyphenols and sugar molecules were identified evidently and the significance of tannase in apple juice clarification was also proved.
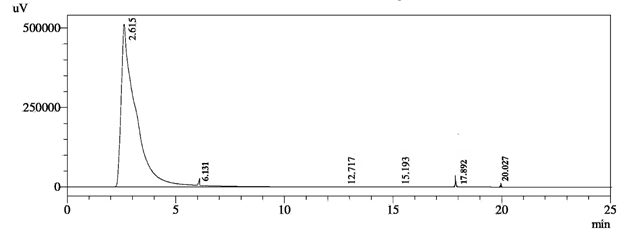
Fig. 8. HPLC analysis of sugar derivatives and phenolic compounds from the tannase treated apple juice.
A key concern in the food industry is the cost-effective production and utilization of microbial enzymes. In this context, the use of agro-industrial wastes and RSM technology provides the augmented production of tannase and also encourage their consumption on industrial applications. Generally the bacterial enzymatic clarification has an edge over the other methods. The present investigation inferred that the tannase along with gelatin clarified apple juice fruitfully. This clarification method was effective, less expensive and we can employ this method for large scale juice production in industrial level.
ACKNOWLEDGMENTS
The authors would like to express their heartfelt thanks to the Head, Department of Environmental Biotechnology, Bharathidasan University, India for providing necessary facilities for this work. The authors are thankful to the Department of Biotechnology, University Grant Commission, Department of Science and Technology-FIST for all the support.
CONFLICT OF INTEREST
The authors declare that there is no conflict of interest.
AUTHORS’ CONTRIBUTION
BT and MK designed the experiments and prepared the manuscript. BT and RA performed the experiments. MK supervised and reviewed the manuscript. All authors read and approved the final manuscript for publication.
FUNDING
None.
ETHICS STATEMENT
Not applicable.
AVAILABILITY OF DATA
The datasets analyzed during the current study are available from the corresponding author on reasonable request.
- Mojumdar A, Deka J. Recycling agro-industrial waste to produce amylase and characterizing amylase-gold nanoparticle composite. Int J Recycl Org Waste Agric. 2019;8(1):263-269.
Crossref - Sadh PK, Duhan S, Duhan JS. Agro-industrial wastes and their utilization using solid state fermentation: a review. Bioresour Bioprocess. 2018;5:1.
Crossref - Mansor A, Ramli MS, Abdul Rashid NY, et al. Evaluation of selected agri-industrial residues as potential substrates for enhanced tannase production via solid-state fermentation. Biocatal Agric Biotechnol. 2019;20:101216.
Crossref - Bharathiraja S, Suriya J, Krishnan M, Manivasagan P, Kim SK. Production of Enzymes From Agricultural Wastes and Their Potential Industrial Applications. Advances in Food and Nutrition Research. 2017;80:125-148.
Crossref - Wu C, Zhang F, Li L, Jiang Z, Ni H, Xiao A. Novel optimization strategy for tannase production through a modified solid-state fermentation system. Biotechnol Biofuels. 2018;11:92.
Crossref - Kumar M, Singh A, Beniwal V, Salar RK. Improved production of tannase by Klebsiella pneumoniae using Indian gooseberry leaves under submerged fermentation using Taguchi approach. AMB Express. 2016;6:46.
Crossref - Jana A, Halder SK, Ghosh K, et al. Tannase Immobilization by Chitin-Alginate Based Adsorption-Entrapment Technique and Its Exploitation in Fruit Juice Clarification. Food Bioprocess Technol. 2015;8(11):2319-2329.
Crossref - Silva VMAD, Cruz R, Fonseca JC, Souza-Motta CMD, Sena ARD, Moreira KA. Juice clarification with tannases from Aspergillus carneus URM5577 produced by solid-state fermentation using Terminalia catappa L. leaves. African J Biotechnol. 2017;16(19):1131-1141.
Crossref - Dey TB, Banerjee R. Application of decolourized and partially purified polygalacturonase and α-amylase in apple juice clarification. Brazilian J Microbiol. 2014;45(1):97-104.
Crossref - Carrin ME, Ceci LN, Lozano JE. Characterization of starch in apple juice and its degradation by amylases. Food Chem. 2004;87(2):173-178.
Crossref - Sachko A, Kobasa I, Moysyura O, Vorobets M. Efficiency of apple juice clarification with using of nano-sized mineral oxides. Ukr Food J. 2020;9(2):361-480.
Crossref - Thiyonila B, Kannan M, Paulin Reneeta N, Ramya T, Kayalvizhi N, Krishnan M. Influence of tannase from Serratia marcescens strain IMBL5 on enhancing antioxidant properties of green tea. Biocatal Agric Biotechnol. 2020;27:101675.
Crossref - Pan J, Wang NN, Yin XJ, Liang XL, Wang ZP. Characterization of a robust and pH-stable tannase from mangrove-derived yeast rhodosporidium diobovatum Q95. Mar Drugs. 2020;18(11):546.
Crossref - Andrade PML, Baptista L, Bezerra CO, et al. Immobilization and characterization of tannase from Penicillium rolfsii CCMB 714 and its efficiency in apple juice clarification. J Food Meas Charact. 2021;15(2):1005-13.
Crossref - Makkar HPS, Dawra RK, Singh B. Protein precipitation assay for quantitation of tannins: Determination of protein in tannin-protein complex. Anal Biochem. 1987;166(2):435-439.
Crossref - Lanza E, LI BW. Application for Near Infrared Spectroscopy for Predicting the Sugar Content of Fruit Juices. J Food Sci. 1984, 49(4):995-998.
Crossref - Rydzak L, Kobus Z, Nadulski R, et al. Analysis of selected physicochemical properties of commercial apple juices. Processes. 2020;8(11):1457.
Crossref - Dhaulaniya AS, Balan B, Yadav A, et al. Development of an FTIR based chemometric model for the qualitative and quantitative evaluation of cane sugar as an added sugar adulterant in apple fruit juices. Food Addit Contam – Part A. 2020;37(4):539-51.
Crossref - Onsekizoglu P, Bahceci KS, Acar MJ. Clarification and the concentration of apple juice using membrane processes: A comparative quality assessment. J Memb Sci. 2010;352(1-2):160-165.
Crossref - Aissam H, Errachidi F, Penninckx MJ, Merzouki M, Benlemlih M. Production of tannase by Aspergillus niger HA37 growing on tannic acid and Olive Mill Waste Waters. World J Microbiol Biotechnol. 2005;21(4):609-614.
Crossref - Murad HA, Abd El Tawab AM, Kholif AM, et al. Production of tannase by Aspergillus niger from palm kernel. Biotechnology. 2014;13(2):68-73.
Crossref - Varadharajan V, Vadivel SS, Ramaswamy A, Sundharamurthy V, Chandrasekar P. Modeling and verification of process parameters for the production of tannase by Aspergillus oryzae under submerged fermentation using agro-wastes. Biotechnol Appl Biochem. 2017;64(1):100-109.
Crossref - Paranthaman R, Vidyalakshmi R, Murugesh S, Singaravadivel K. Optimisation of Fermentation Conditions for Production of Tannase Enzyme by Aspergillus oryzae Using Sugarcane Baggasse and Rice Straw. Glob J Biotechnol Biochem. 2008;3:105-110.
- Retnadhas S. Optimization of Process Conditions for Biotransformation of Caffeine to Theobromine using Induced Whole Cells of Pseudomonas sp. J Bioprocess Biotech. 2014;4:6.
Crossref - Vinothini G, Latha S, Arulmozhi M, Dhanasekaran D. Statistical optimization, physio-chemical and bio-functional attributes of a novel exopolysaccharide from probiotic Streptomyces griseorubens GD5. Int J Biol Macromol. 2019;134:575-587.
Crossref - Ladeira Azar RIS, da Luz Morales M, Piccolo Maitan-Alfenas G, Falkoski DL, Ferreira Alfenas R, Guimaraes VM. Apple juice clarification by a purified polygalacturonase from Calonectria pteridis. Food Bioprod Process. 2020;119:238-245.
Crossref - Alvarez S, Alvarez R, Riera FA, Coca J. Influence of depectinization on apple juice ultrafiltration. Colloids and Surfaces A: Physicochemical and Engineering Aspects. 1998;138(2-3):377-382.
Crossref - Prommajak T, Leksawasdi N, Rattanapanone N. Tannins in fruit juices and their removal. Chiang Mai Univ J Nat Sci. 2020;19(1):76-90.
Crossref - Abdullah S, Pradhan RC, Aflah M, Mishra S. Efficiency of tannase enzyme for degradation of tannin from cashew apple juice: Modeling and optimization of process using artificial neural network and response surface methodology. J Food Process Eng. 2020;43(10):e13499.
Crossref - Suryawanshi RK, Jana UK, Prajapati BP, Kango N. Immobilization of Aspergillus quadrilineatus RSNK-1 multi-enzymatic system for fruit juice treatment and mannooligosaccharide generation. Food Chem. 2019;289:95-102.
Crossref - Elfalleh W, Hannachi H, Tlili N, Yahia Y, Nasri N, Ferchichi A. Total phenolic contents and antioxidant activities of pomegranate peel, seed, leaf and flower. J Med Plants Res. 2012;6(32):4724-4730.
Crossref - Wahyono T, Astuti DA, Komang Gede Wiryawan I, Sugoro I, Jayanegara A. Fourier Transform Mid-Infrared (FTIR) Spectroscopy to Identify Tannin Compounds in the Panicle of Sorghum Mutant Lines. IOP Conference Series: Materials Science and Engineering. 2019, 546(4): 042045.
Crossref - Ricci A, Olejar KJ, Parpinello GP, Kilmartin PA, Versari A. Application of Fourier transform infrared (FTIR) spectroscopy in the characterization of tannins. Appl Spectrosc Rev. 2015;50(5):407-442.
Crossref - Zhu B, Li J, He Y, et al. Effect of steric hindrance on hydrogen-bonding interaction between polyesters and natural polyphenol catechin. J Appl Polym Sci. 2004;91(6):3565-3573.
Crossref - Leopold LF, Leopold N, Diehl HA, Socaciu C. Quantification of carbohydrates in fruit juices using FTIR spectroscopy and multivariate analysis. Spectroscopy. 2011;26(2):93-104.
Crossref - Gokmen V, Acar J, Kahraman N. Influence of conventional clarification and ultrafiltration on the phenolic composition of golden delicious apple juice. J Food Qual. 2003;26(3):257-266.
Crossref - De Dias FS, David JM, David JP. Determination of phenolic acids and quercetin in Brazilian red wines from vale do Sao Francisco region using liquid-liquid ultrasound-assisted extraction and HPLC-DAD-MS. J Braz Chem Soc. 2016;27:1055-1059.
Crossref - Blanco Gomis D, Gutierrez Alvarez MD, Mangas Alonso JJ, Noval Vallina A. Determination of sugars and alcohols in apple juice and cider by high performance liquid chromatography. Chromatographia. 1988;25(8):701-706.
Crossref - Bremner TD, Blacklock CJ, Paganga G, Mullen W, Rice-Evans CA, Crozier A. Comparison of the phenolic composition of fruit juices by single step gradient HPLC analysis of multiple components versus multiple chromatographic runs optimised for individual families. Free Radic Res. 2000;32(6):549-559.
Crossref - Du G, Zhu Y, Wang X, et al. Phenolic composition of apple products and by-products based on cold pressing technology. J Food Sci Technol. 2019;56(3):1389-1397.
Crossref - Rha CS, Kim SW, Byoun KH, Hong YD, Kim DO. Simultaneous optimal production of flavonol aglycones and degalloylated catechins from green tea using a multi-function food-grade enzyme. Catalysts. 2019;9(10):861.
Crossref - Kahle K, Kraus M, Richling E. Polyphenol profiles of apple juices. Mol Nutr Food Res. 2005;49(8):797-806.
Crossref - Wruss J, Lanzerstorfer P, Huemer S, et al. Differences in pharmacokinetics of apple polyphenols after standardized oral consumption of unprocessed apple juice. Nutr J. 2015;14:32.
Crossref - Aadil RM, Khalil AA, Rehman A, et al. Assessing the impact of ultra-sonication and thermo-ultrasound on antioxidant indices and polyphenolic profile of apple-grape juice blend. J Food Process Preserv. 2020;44(5):e14406.
Crossref
© The Author(s) 2022. Open Access. This article is distributed under the terms of the Creative Commons Attribution 4.0 International License which permits unrestricted use, sharing, distribution, and reproduction in any medium, provided you give appropriate credit to the original author(s) and the source, provide a link to the Creative Commons license, and indicate if changes were made.