

ISSN: 0973-7510
E-ISSN: 2581-690X
Siti Nur Izzati Saiful Anuar1![]() , Farhana Othman1
, Farhana Othman1![]() , Tay Chia Chay2
, Tay Chia Chay2![]()
and Nor Atikah Husna Ahmad Nasir1 ![]()
Mercury ions (Hg2+) are usually being discharged into water bodies without proper treatment. It is toxic, non-biodegradable and persistent naturally which leads to serious environmental problems. Through microbial approach, this study compares the efficiency of two types of fungi: R. oryzae and A. niger of common biosorption fungi in absorbing Hg2+ based on FTIR analysis, kinetic and isotherm studies. Both fungi were prepared into two forms which are live and dead biomass; and the Hg2+ was prepared at 10 and 100 ppm. FTIR analysis has identified existing functional group of hydroxyl, carboxylic and amino functional groups from both fungi, which are important in attracting Hg2+ ion. On average, 60-90% of Hg2+ was removed by both live and dead biomass of R. oryzae and A. niger at 10 and 100 ppm. Meanwhile, the highest sorption was achieved by dead cells of R. oryzae which is up to 90.38% at 100 ppm. In terms of kinetic studies, experimental data fitted to the Pseudo-second-order kinetic model, with correlation coefficient, R2 (0.9997), and Langmuir isotherm, which means the absorption process occurs on the homogenous surface that corresponds to the monolayer formation. Through these findings, the dead cells of A. niger and R. oryzae are better in sorption of Hg2+ compared to the live cells. Meanwhile, the rate of biosorption by R. oryzae is higher compared to A. niger. However, both fungi are excellent in biosorption of Hg2+ ions and could be an alternative to current physico-chemical methods used.
A. niger, dead cell, live cell, mercury ions, R. oryzae
Heavy metal pollution can prompt serious water contamination and endangered aquatic life if untreated (Taloin et al., 2018). These metals ions are non-degradable and are persistent in the environment (Fu and Wang., 2011). Mercury ions (Hg2+) is an example of the recalcitrant and toxic metal ions found in water bodies and could cause gingivitis, congenital malformations, spontaneous abortion and damage to central nervous system (CNS) and brain in human (Gupta et al., 2016).
At present, regular strategies have been applied to utilize for expelling metal particles from wastewater such as synthetic precipitation, adsorptions on the actuated carbon, dissolvable extraction, solidify partition, and invert assimilation, particle trade and electrolytic techniques. Nevertheless, these procedures have limitations because of high capital and operational costs (Agarwal et al., 2006). Thus, as an alternative, biological removal techniques such as using microorganisms in biosorption is introduced.
In the current work, the biosorption of Hg2+ ions in aqueous solution has been conducted using fungi, R. oryzae and A. niger. These fungi were chosen due to their potential in a previous study (Taloin et al., 2018) on their absorption capacity and high effectiveness to absorb the metal ions. These microorganisms have negative cell membranes or cell walls that are able to attract the positive charged ions of metals in the solution (Taloin et al., 2018; Nakbanpote et al., 2007). However, different microbial species and viability might offer different rates of biosorption and offer dependent or independent metabolism (Abbas et al., 2014). Therefore, the aim of this research is to compare the biosorption potential using live and dead R. oryzae and A. niger on different Hg2+ concentrations.
Culture Preparation
R. oryzae was obtained from Universiti Teknologi Malaysia (UTM), Johor and A. niger was obtained from Universiti Teknologi MARA (UiTM), Perlis. The inoculum was grown on plates and was cut into triangular shaped and transferred into the new Potato-Dextrose Agar (PDA) for culture and incubated for seven (7) days at 30°C.
Cultivating in Liquid Medium Yeast-Peptone-Glucose (YPG)
The spores and mycelium of R. oryzae and A. niger were scrapped and transferred into YPG medium (2 g/L peptone, 1g/L glucose1 and g/L yeast extract) before be incubated at 25°C, 130 rpm for 72 hours (Ahmad., 2005).
Filtration of Live Cells of R. oryzae and A. niger
R. oryzae and A. niger were filtered using 150 μm sieve after 72 hours of cultivation. The cells were washed using sterilized distilled water to remove any remaining growth media and kept at 4°C until further use (Ahmad., 2005).
Preparation of Dead Cells of R. oryzae and A. niger
The dead cells of R. oryzae and A. niger were pre-treated with 0.5 N NaOH for 30 minutes. Then, the cells were washed using sterile distilled water and adjusted to pH 6.8 – 7.2. After being autoclaved at 121°C for 15 minutes, the cells were dried in oven at 60°C until constant weight is achieved. Next, the substrates were powdered and kept until further use (Ahmad., 2005).
Microscopic Analysis
The morphology of both live and dead fungus, R. oryzae and A. niger were analyzed at 400X magnification using a light microscope to identify the differences on their morphology structures that role in biosorption of Hg2+ ions.
Preparation of Hg2+ solution
A standard of Hg2+ solution on 100 mg/L and 10 mg/L were diluted and adjusted using nitric acid. The solutions were than filtered through 0.45 μm membrane filters for further analyses (Martinez-Juarez et al. 2012).
Biosorbents Characterization using FTIR
Fourier- Transform Infrared Spectroscopy (FTIR) were recorded in Perkin-Elmer FTIR spectrometer to determine functional groups in relation to binding of Hg2+. R. oryzae and A. niger of both live and dead fungi were collected before and after the absorption period (Chen et al., 2012). FTIR was measured at wavenumber from 400 to 4000 cm-1.
Biosorption Kinetics
0.1 g of live and dead cells were added to 10 and 100 ppm concentration of Hg2+ samples in 100 mL Erlenmeyer flasks. The samples were placed in an incubator shaker at fixed conditions; 130 rpm and room temperature. The supernatant was collected at every hour (for 8 hours) and filtered through 0.45 μm membrane filters (Kapoor et al., 1999). The filtered samples were analyzed for dissolve metals concentration using ICP-OES. The experimental data were analyzed by two model kinetics, which are the Langergren’s model, Pseudo-first-order reaction (Eq. 1) and the Ho’s model, Pseudo second-order reaction (Eq. 2) (Chen et al., 2012)
![]()
![]()
Where,
Qe is an adsorbed amount (mg/g) per unit adsorbent at equilibrium (min)
Qt is an adsorbed amount (mg/g) per unit adsorbent at any time (min)
k1 is the pseudo first-order rate constant for the adsorption process (min-1 )
k2 is the pseudo second-order rate constant for adsorption process (g mg-1 .min-1 )
Biosorption Isotherms
Equilibrium data from this analysis were used to explain the adsorption of Hg2+ with the Langmuir and Freundlich isotherm models. The form of the Langmuir model (Eq. 3) and Freundlich model (Eq. 4) were expressed in the following equation (Tan et al., 2008).
![]()
![]()
Where,
Qe is the sorption capacity at equilibrium (mg/g)
Qm is the maximum sorption capacity (mg/g)
Ce is the equilibrium concentration of metal ion (mg/L)
b is Langmuir model constant (L/mg)
K and n is Freundlich model constants (dimensionless)
Metals Absorption Analysis using ICP-OES
The supernatant from each flask of R. oryzae and A. niger (live and dead cells) were analysed using Inductively Coupled Plasma-Optical Emission Spectrometry (ICP-OES) after digestion and dilution. Nitric acid (HNO3) was used for the acid digestion process to destroy matrix and deactivate the absorption process. The value from this analysis was compared with the value from before adding the biomass. Distilled water was used as a blank. The heavy metals absorbed per unit mass of R. oryzae and A. niger (live and dead cells) and the removal efficiency of the sorbent were calculated Eq. 5 and Eq.6 (Lakhdhar et al., 2016).
![]()
![]()
Where,
C0 is the initial concentration of the stock sample (mg/L)
C is the final concentration of stock sample after adsorption (mg/L)
Q is the amount of heavy metal adsorbed onto the fungus (mg/g)
V is the volume of the medium (mL)
m is the amount of the fungus (g)
E is the removal efficiency (%)
Microscopic Analysis
Fig. 1 illustrates the morphological structure of the R. oryzae and A. niger cells under 400x magnification.
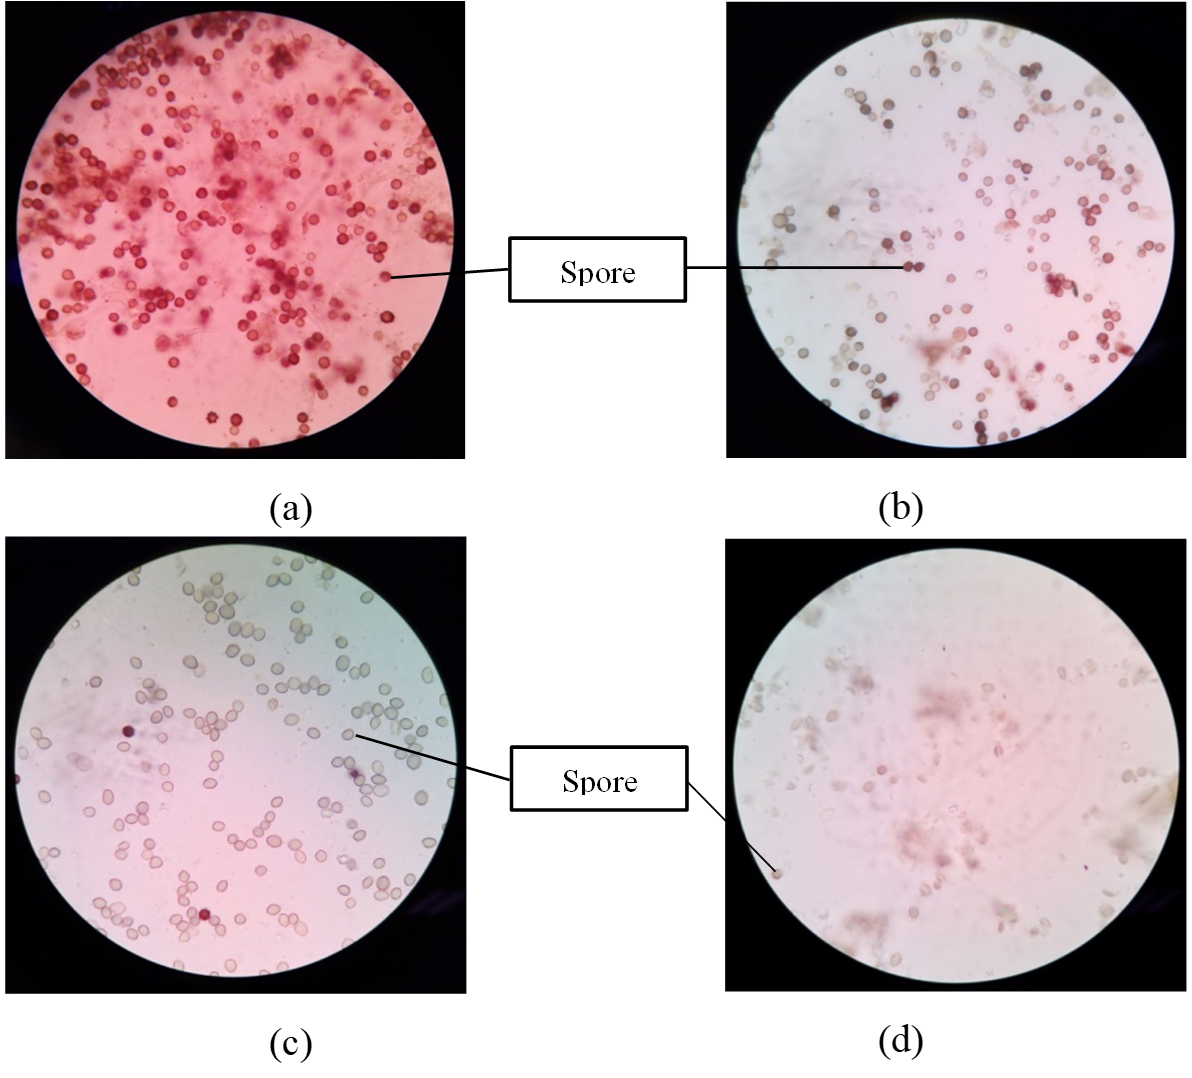
Fig. 1. Morphological structure of (a) live cells of A.niger, (b) dead cells of A. niger, (c) live cells of R. oryzae and (d) dead cells of R.oryzae under 400x magnification of light microscope
In Fig. 1, the spores of the live cell of R. oryzae and A. niger are abundant compared to the dead cells. This is because dead cells have no active metabolism activity thus; the cells or spores shown are less compared to live cells (Abbas et al., 2014).
FTIR Analysis
Fig. 2 – 7 show the changes of functional groups of live and dead cells of R. oryzae and A. niger after biosorption of Hg2+ in 10 and 100 ppm.

Fig. 2. FTIR data of dead cells of A. niger before and after the absorption in 10 ppm Hg2+
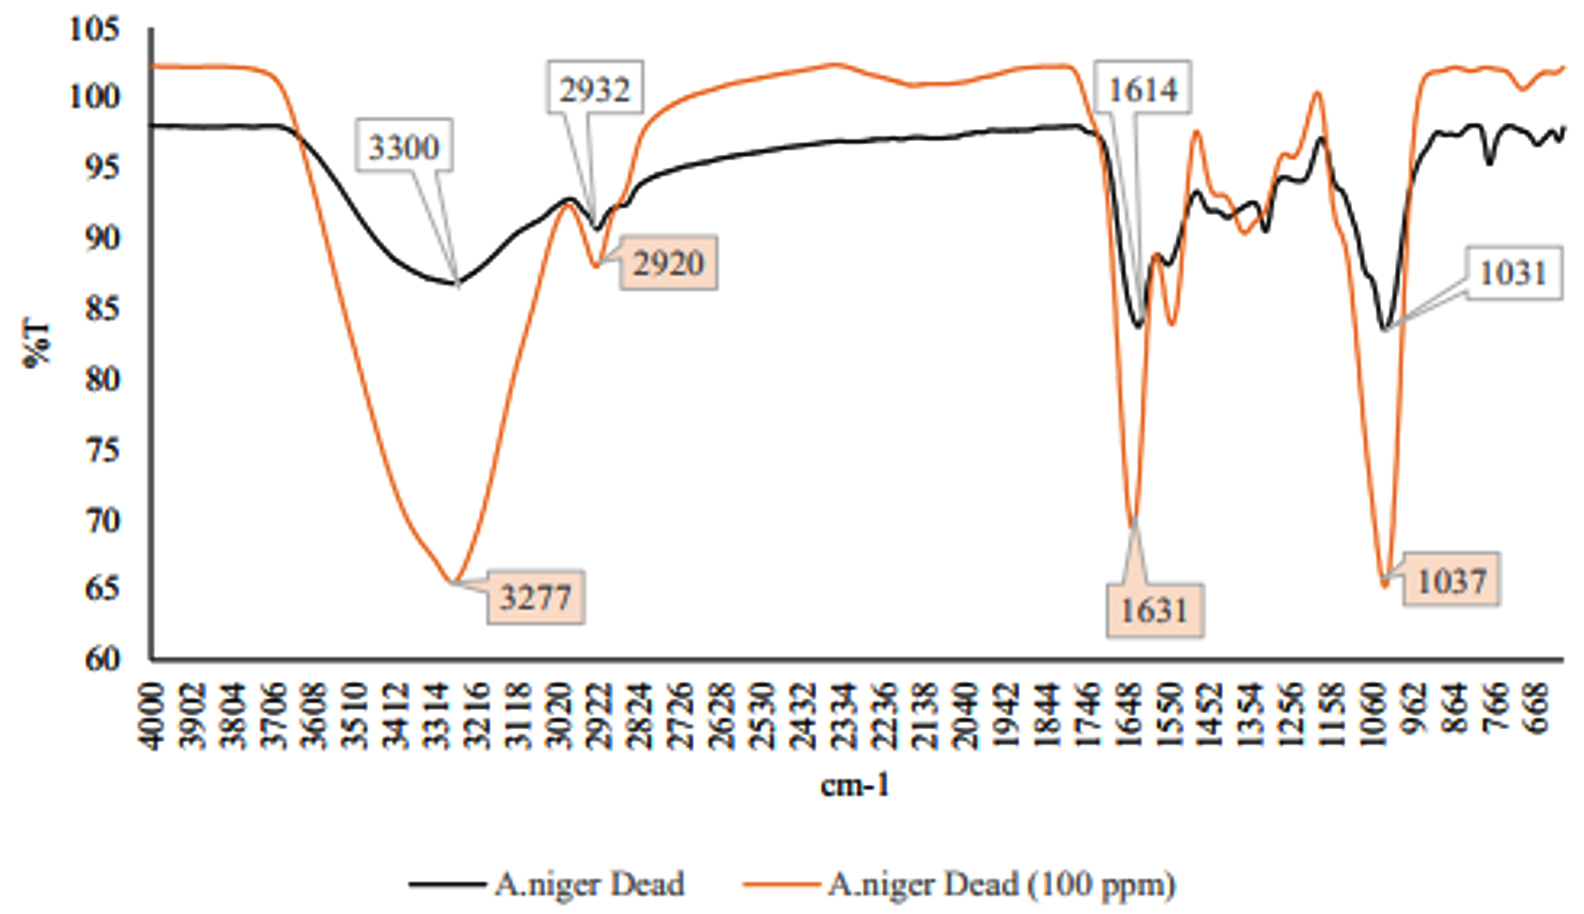
Fig. 3. FTIR data of dead cells of A. niger before and after the absorption in 100 ppm Hg2+
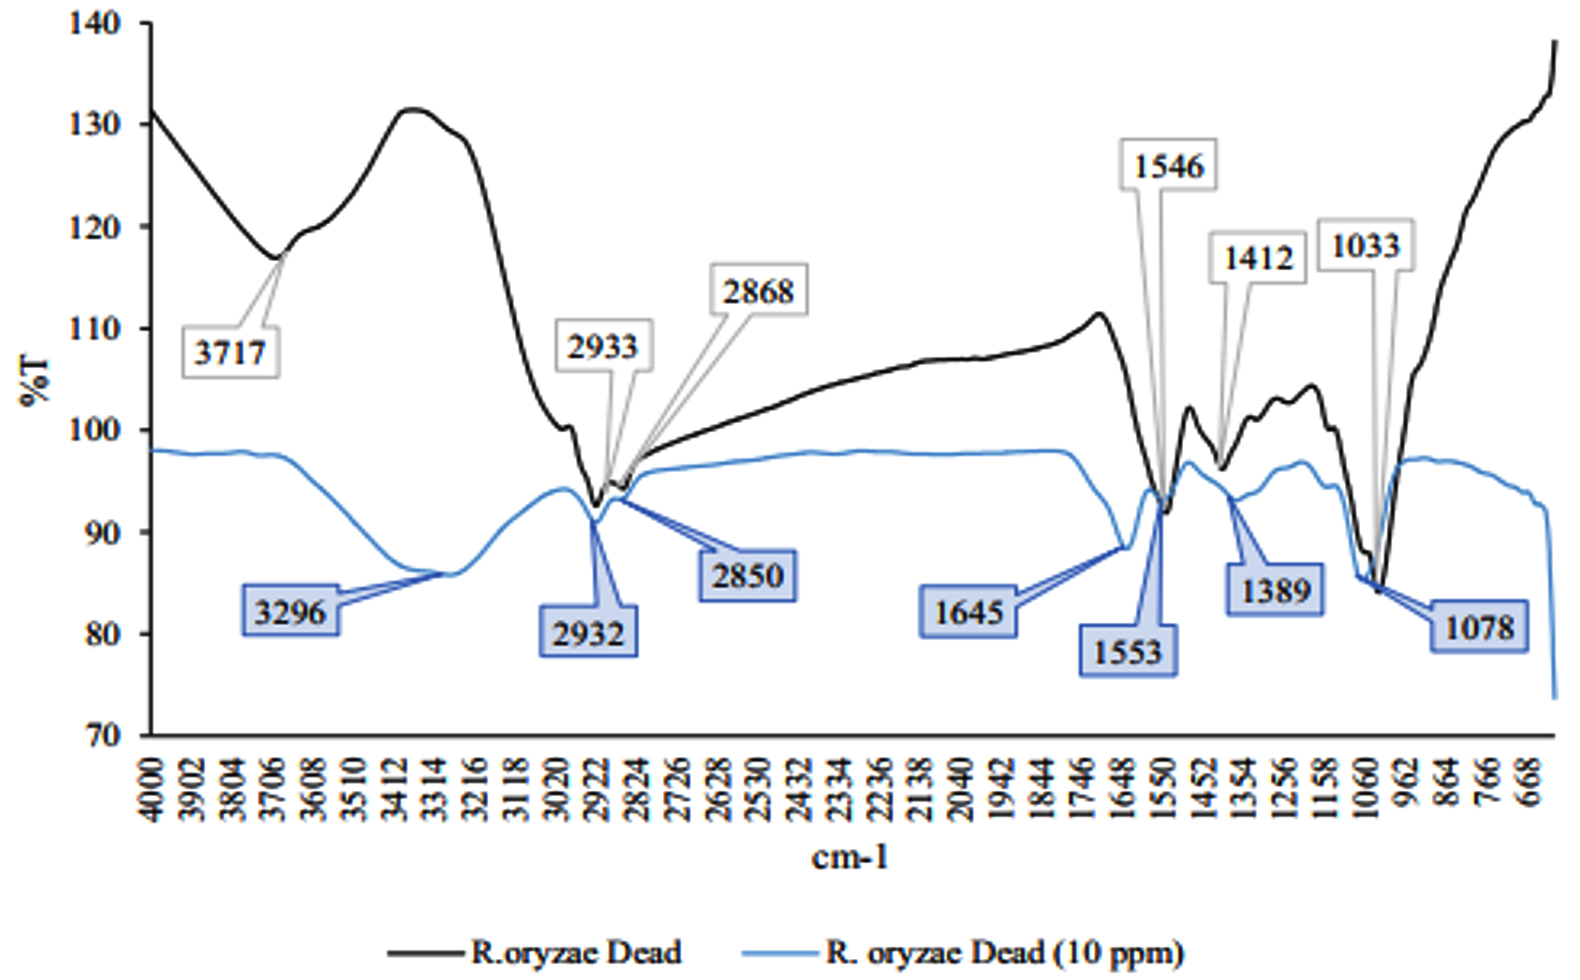
Fig. 4. FTIR data of dead cells of R. oryzae before and after the absorption in 10 ppm Hg2+

Fig. 5. FTIR data of dead cells of R. oryzae before and after the absorption in 100 ppm Hg2+
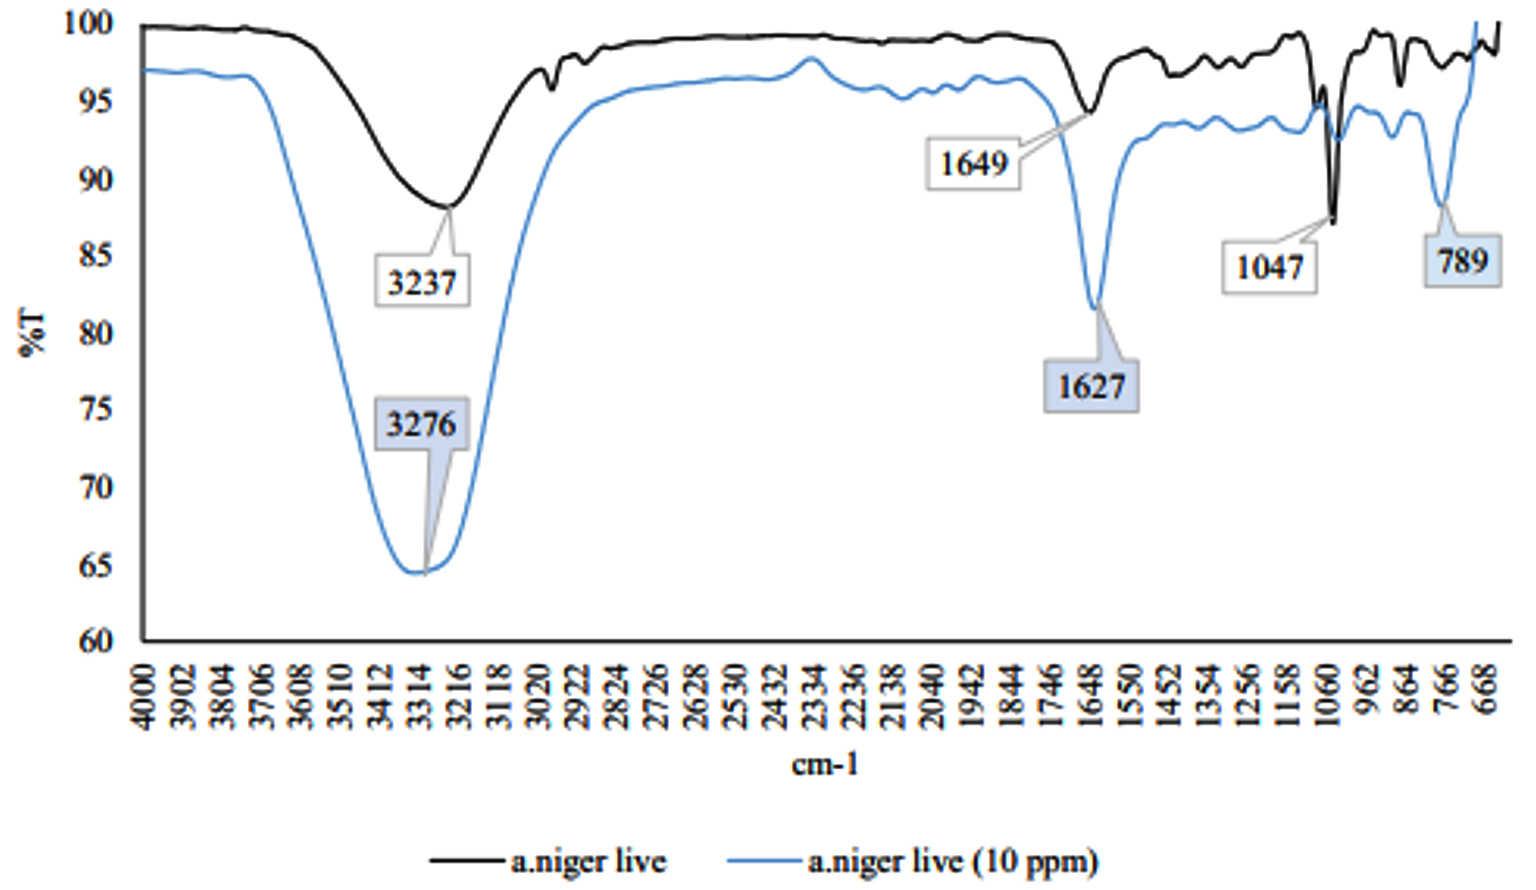
Fig. 6. FTIR data of live cells of A. niger before and after the absorption in 10 ppm Hg2+
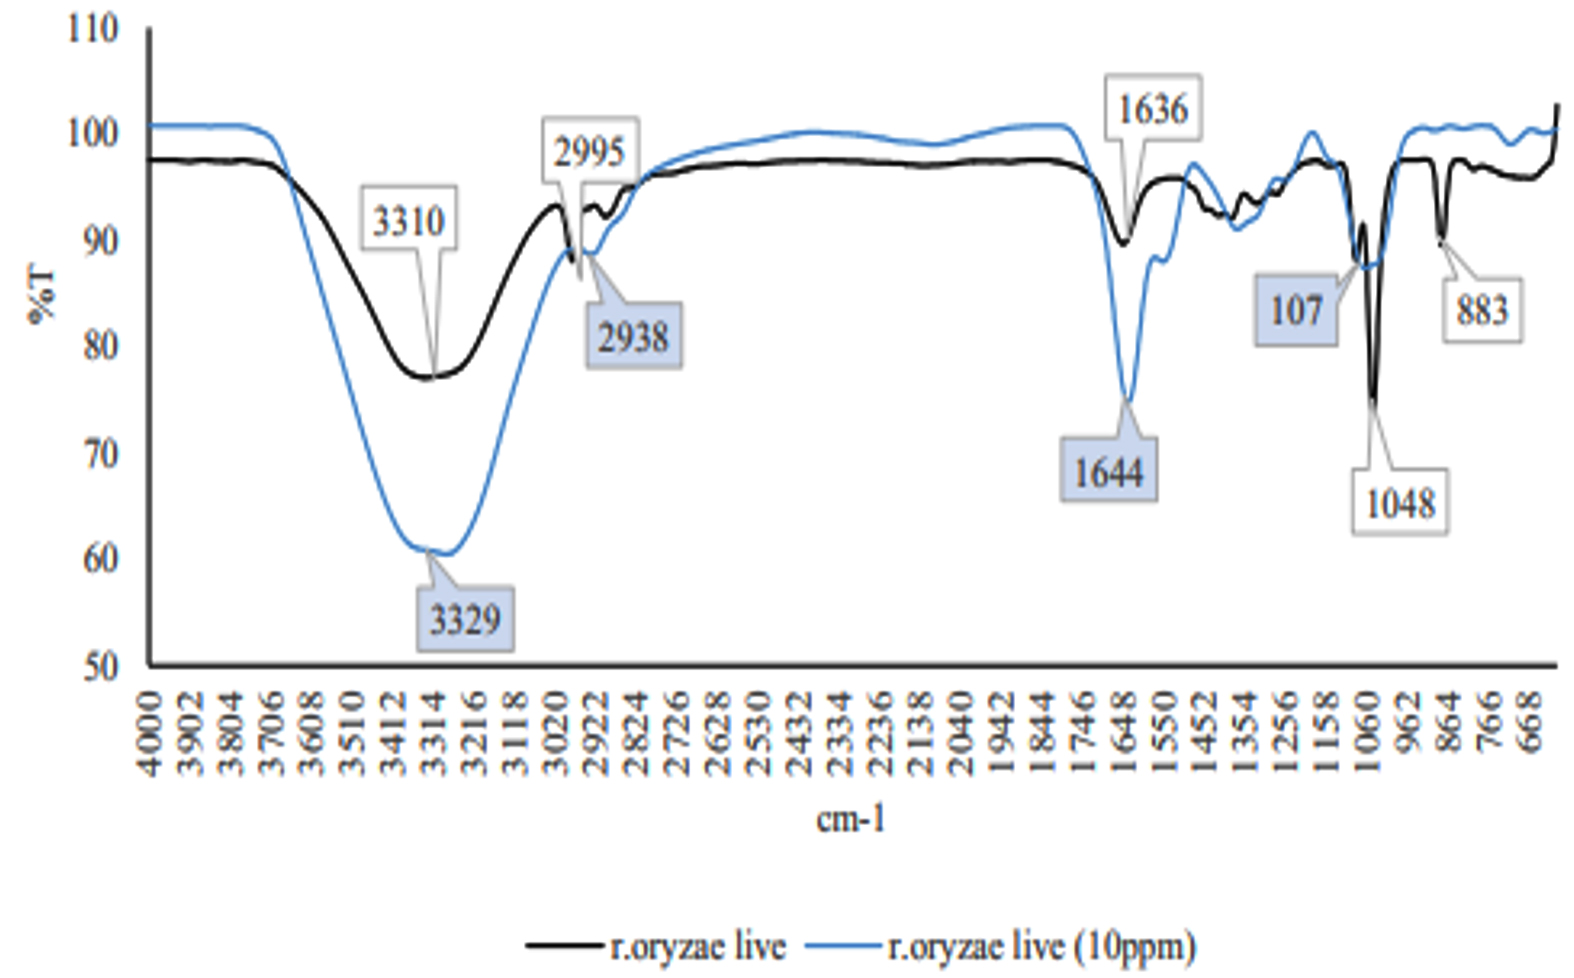
Fig. 7. FTIR data of live cells of R.oryzae before and after the absorption in 10 ppm Hg2+
Overall, all the biosorption bands of Hg2+ were shifted downward, and the functional group position remained unchanged. The biosorption of Hg2+ before and after have shown the spectra peaks is either decreased or even disappeared in intensity might be due to metal adsorption (Malkoc and Nuhoglu, 2005). The shifts in the absorption bands showed that there was an adsorption of Hg2+ ions on the live and dead cells of R. oryzae and A. niger. The presence of hydroxyl, carboxylic and amino functional groups was an important interaction with Hg2+ ions. Referring to Fig. 2 to 7, the characteristics of the biosorption bands of OH and NH were identified between 3200-3600 cm-1, and the carboxylic and phenolic stretching bands appeared at 2800-2900 cm-1. The strong peak of C=O stretching showed at 1600-1700 cm-1. The fungal cell walls have a variety of ligands such as carboxyl, amine, hydroxyl, phosphate and sulfhydryl groups that are involved in metal chelation. Thus lead positive metal ion (Hg2+) being absorbed by negative charges on the cell (Gupta et al., 2000).
Metal Uptake Analysis ICP-OES
Fig. 8 illustrates the proportion of removal efficiency of metal uptake activity in live and dead cells of R. oryzae and A. niger at 10 and 100 ppm of Hg2+ ions were analyzed using ICP-OES.

Fig. 8. Metal uptake activities by (a) dead cells of A. niger, (b) live cells of A. niger, (c) dead cells of R. oryzae and (d) live cells of R. oryzae
Fig. 8 illustrates the most outstanding removal of Hg2+ metal is by dead R. oryzae at 100 ppm (90.38%) and 10 ppm (78.78%). Meanwhile for others, the biosorption capacity is better at a lower concentration of 10 ppm, which indicates the overall range from 72.82 to 61.93%. At high concentration of heavy metals, the rate of biosorption for both fungi is less effective compared to low concentration of Hg2+, due to limited free sites of the cells and saturation of the adsorption sites (Oves et al., 2013). Meanwhile, at lower concentration, metals ions in the solutions could bind with the binding sites of the cells and caused increasing biosorption (Oves et al., 2013).
In both fungi, the highest absorbent was achieved by using dead cells compared to live fungal biomass. The dead biomass offers greater metal binding capability because the presence of active cellular metabolism in the cell will hinder the biosorption efficiency (Velizar et al., 2010).
Biosorption Kinetics
The kinetic studies were performed to evaluate the biosorption reached equilibrium contact time. Fig. 9 shows the Hg2+ biosorption with dead and live cells of R. oryzae and A. niger at 10 ppm, meanwhile, Fig. 10 shows the Hg2+ sorption at 100 ppm.
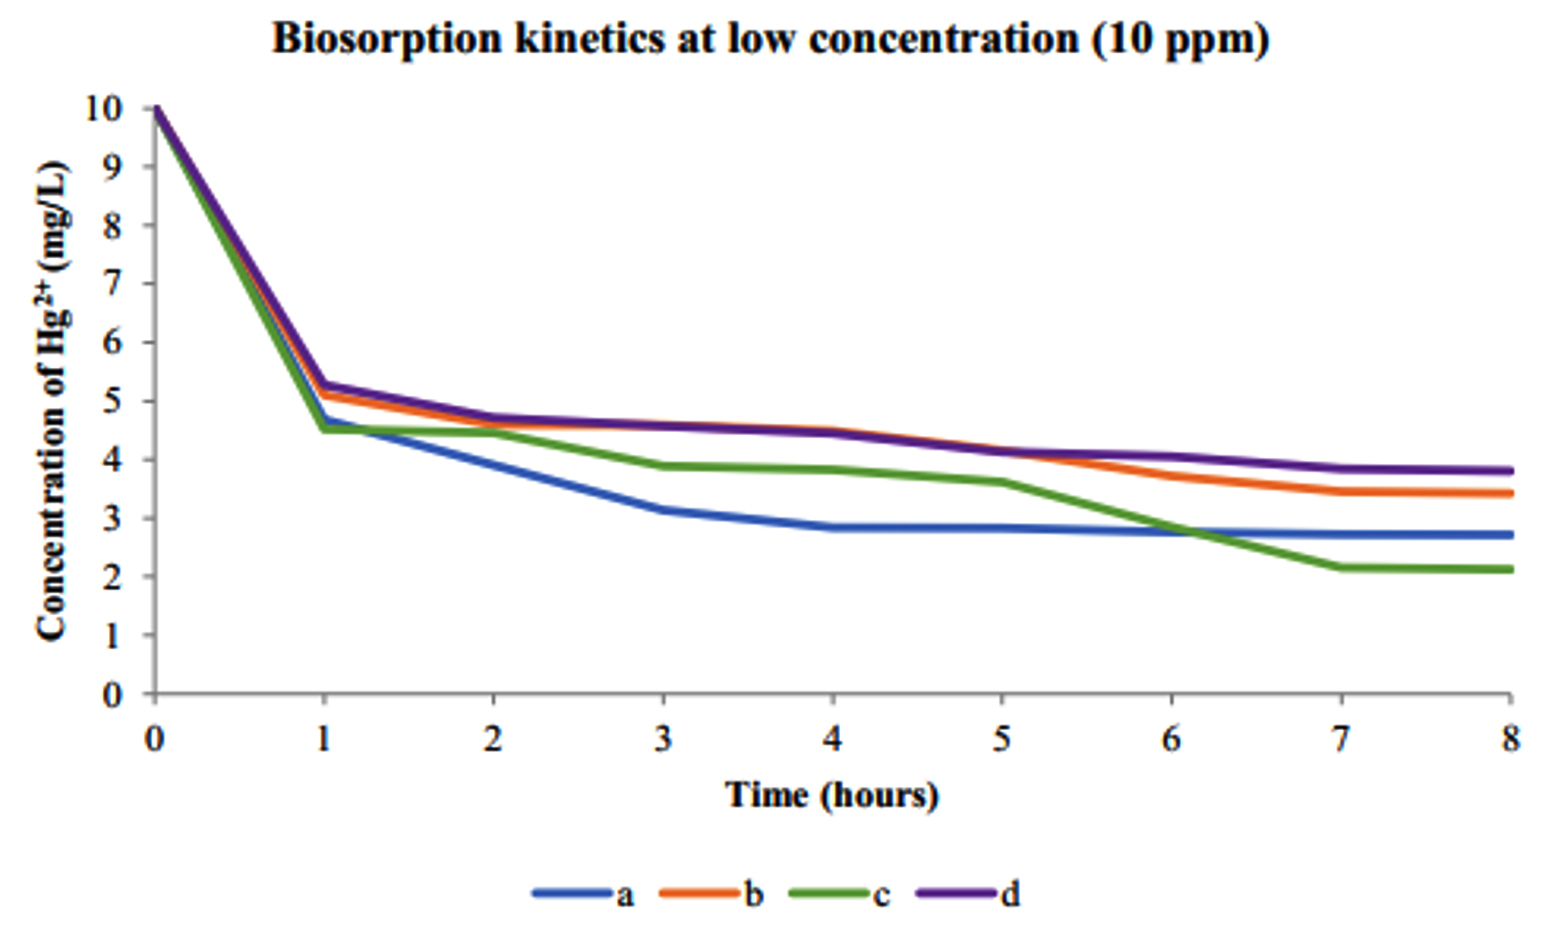
Fig. 9. Kinetics of biosorption of Hg2+ at low concentration (10 ppm) by (a) dead cells of A. niger, (b) live cells of A. niger, (c) dead cells of R. oryzae and (d) live cells of R. oryzae
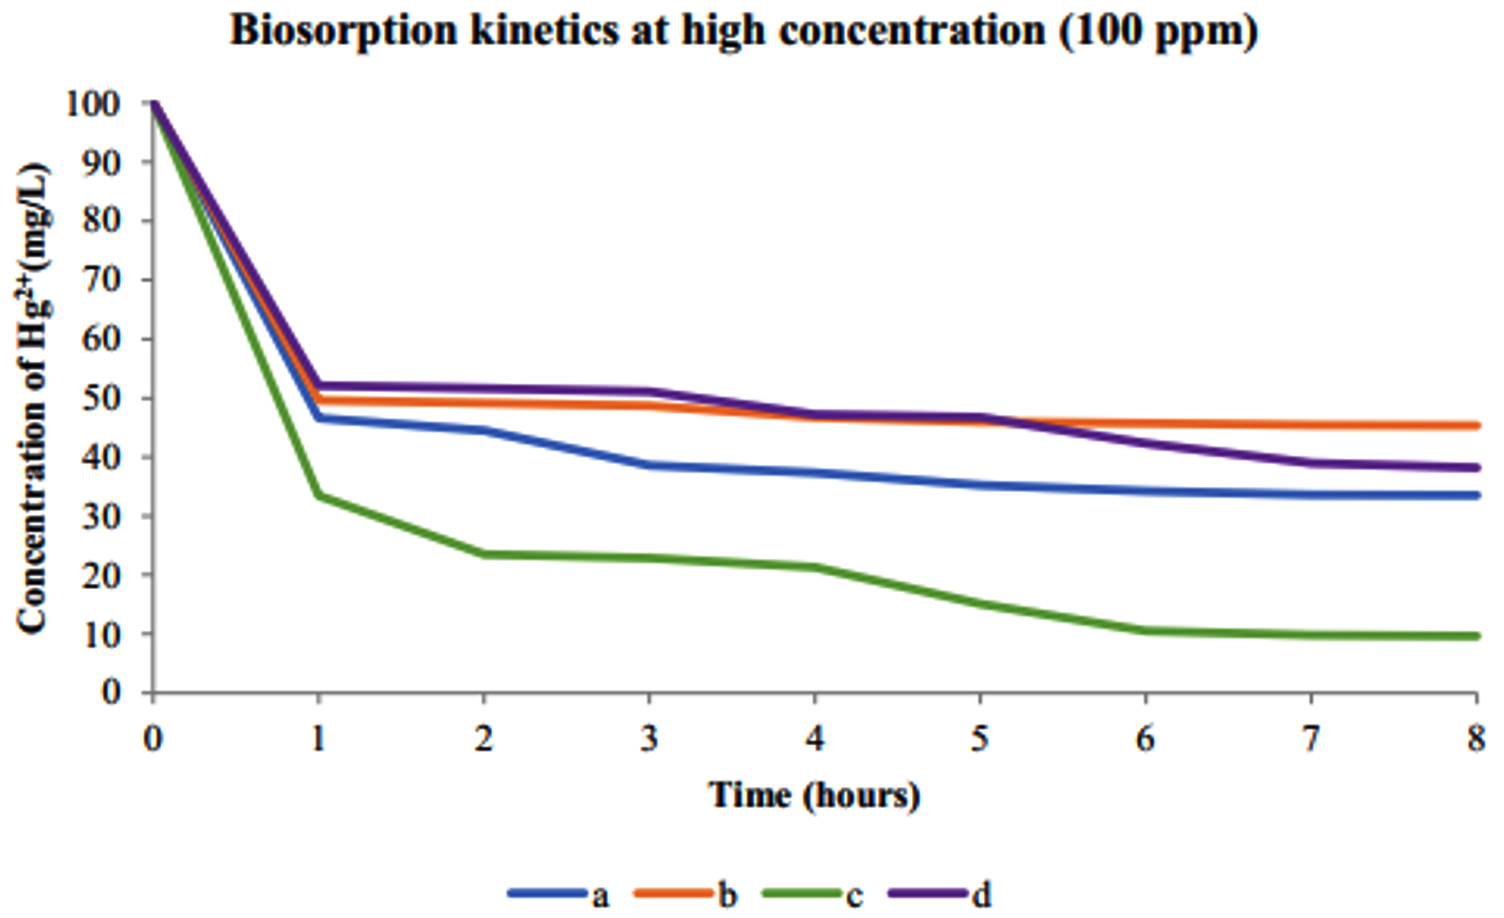
Fig. 10. Kinetics of biosorption of Hg2+ at high concentration (100 ppm) by (a) dead cells of A. niger, (b) live cells of A. niger, (c) dead cells of R. oryzae and (d) live cells of R. oryzae
Fig. 9 and 10 show the concentration of Hg2+ ions adsorbed decreased dramatically with increasing contact time, then its reached equilibrium or constant biosorption after seven (7) hours. From the plot, there are two phases of the biosorption which are initial rapid phase (0-1 hour) and slower second phase (6-8 hour).
At 0-1 hour, the biosorption was fast and drop up to 50% of equilibrium uptake of its saturation capacity in both dead and live cells of R. oryzae and A. niger. Meanwhile at 6-8 hour, the total metal biosorption of Hg2+ were plateau, indicating the absorption has reached its limit.
Pseudo-First-Order Reaction Analysis
In Pseudo-first-order, the plot of log (Qe-Qt) vs time enumerate the value of Qe, adsorbed amounts (mg/g) per unit adsorbent at equilibrium (min), and rate constants of Pseudo-first-order (K1), as shown in Fig. 11 and 12. The kinetic data of Pseudo-first-order reactions for live and dead fungi of this experiment are presented in Table 1.
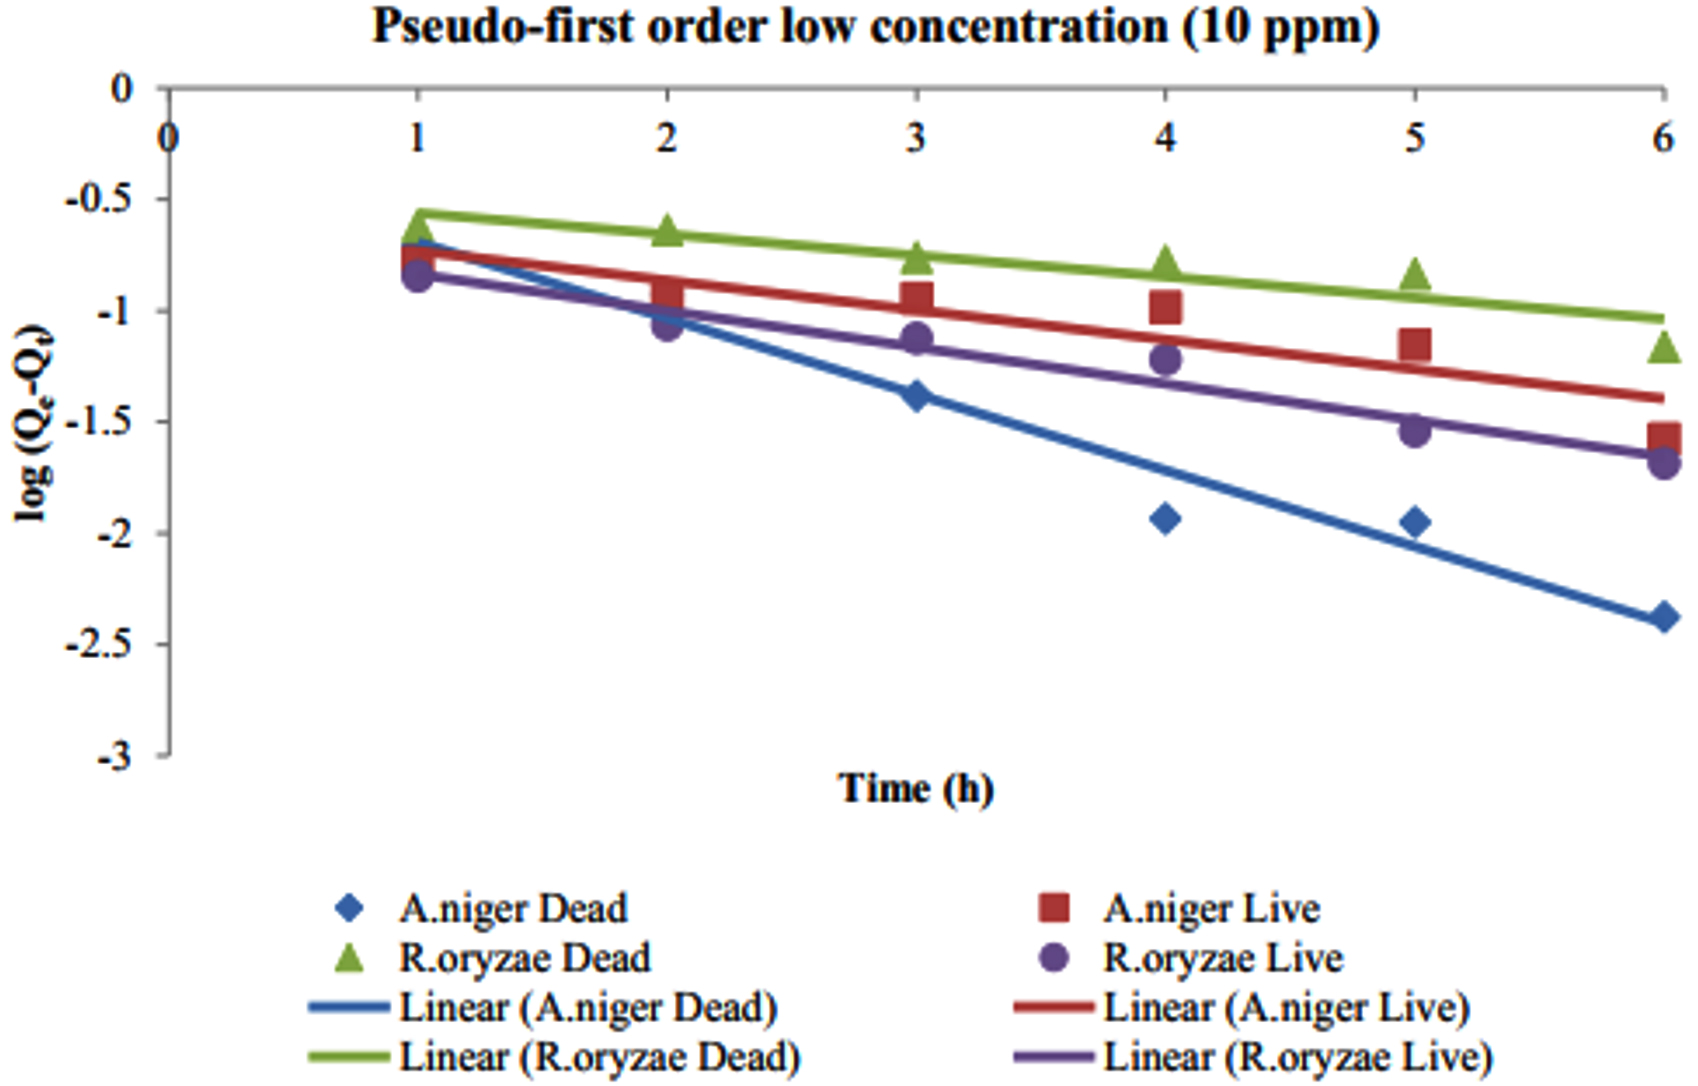
Fig. 11. The Pseudo-first order at low concentration (10 ppm)
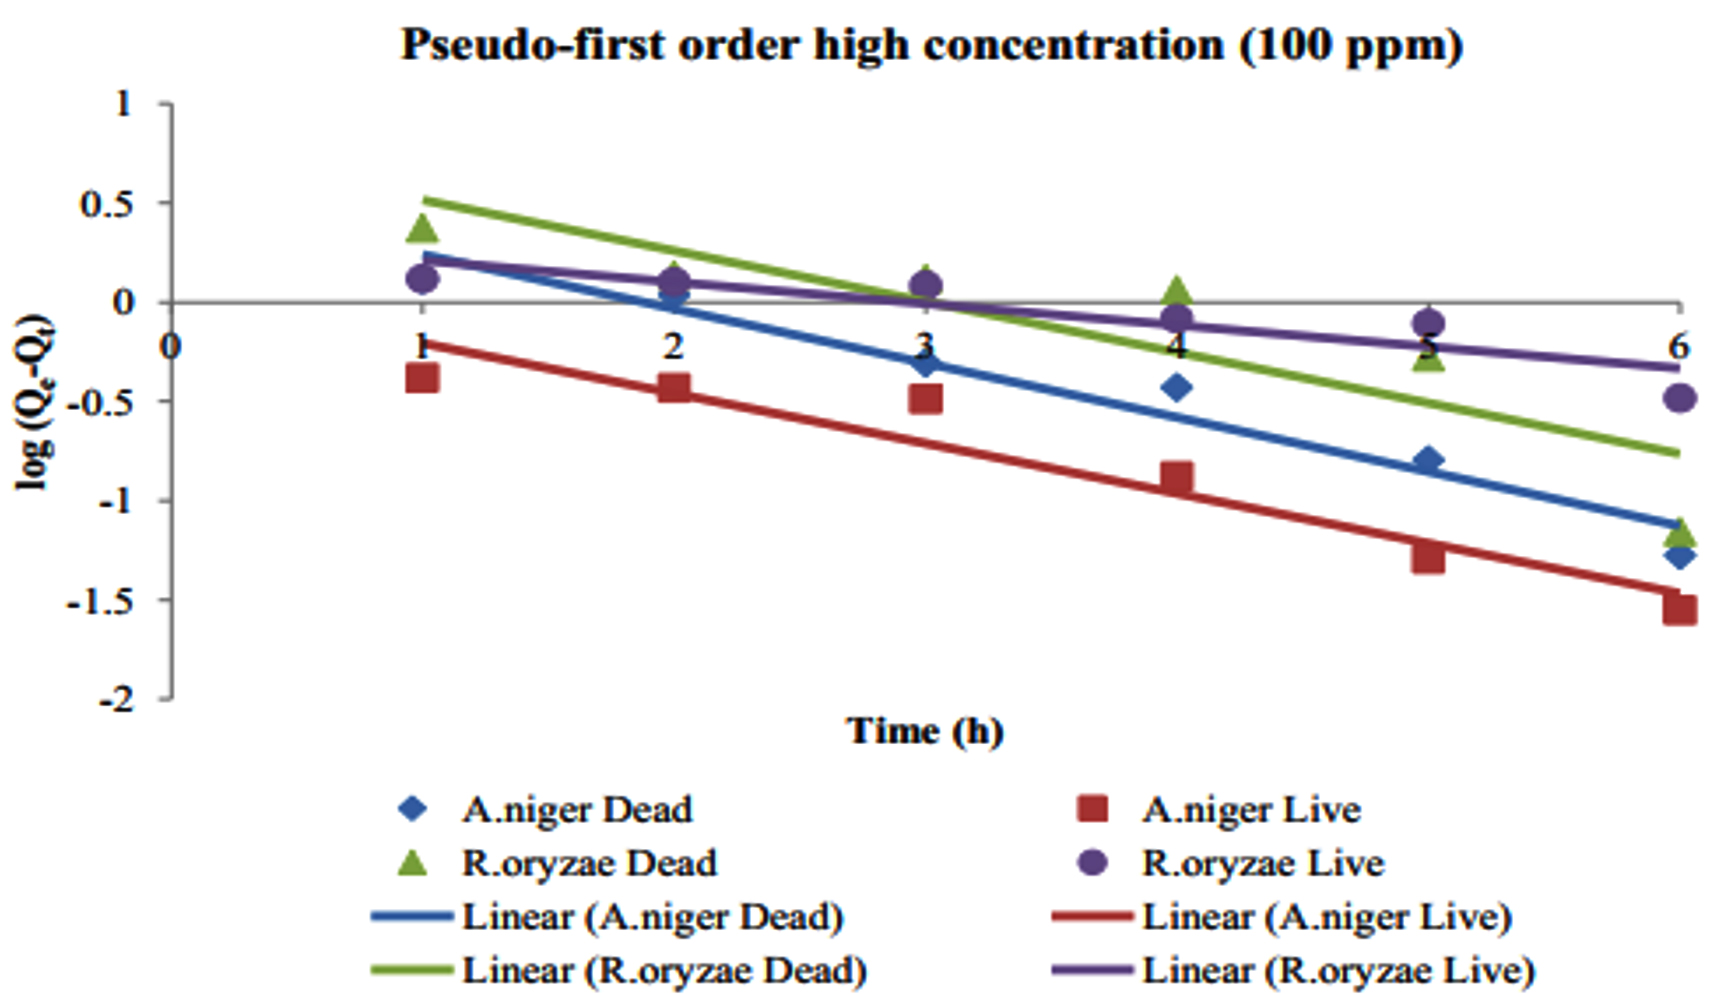
Fig. 12. The Pseudo-first order at high concentration (100 ppm)
According to Table 1, the correlation coefficients, R2, that are closer to 1 in both low and high concentration of Hg2+ is the dead cells of A. niger. Meanwhile, R. oryzae live and dead are all not fit to Pseudo-first-order model because the correlation coefficients are farther to value 1. The values of K1 are in range 0.3365- 0.9347 for both concentrations.
Table (1):
The kinetic data of Pseudo-first-order reaction for live and dead R.oryzae and A. niger.
Intial concentration of Hg2+ (ppm) |
Biosorbent |
K1 |
Qe (mg/g) |
R2 |
|---|---|---|---|---|
A. niger Dead |
0.8349 |
0.7277 |
0.9662 |
|
10 |
A. niger Live |
0.4475 |
0.6548 |
0.8015 |
R. oryzae Dead |
0.3365 |
0.7841 |
0.8186 |
|
R. oryzae Live |
0.6125 |
0.6155 |
0.9577 |
|
A. niger Dead |
0.7453 |
6.6410 |
0.9499 |
|
100 |
A. niger Live |
0.9347 |
5.4560 |
0.9160 |
R. oryzae Dead |
0.5667 |
9.0217 |
0.7633 |
|
R. oryzae Live |
0.4118 |
6.1040 |
0.7947 |
Pseudo-Second-Order Reaction Analysis
The plot of t/Qt vs time gives the value of Qe, adsorbed amounts (mg/g) and rate constants of Pseudo-second-order (K2), in Fig. 13 and 14. Table 2 shows the kinetic data of Pseudo-second-order reaction.
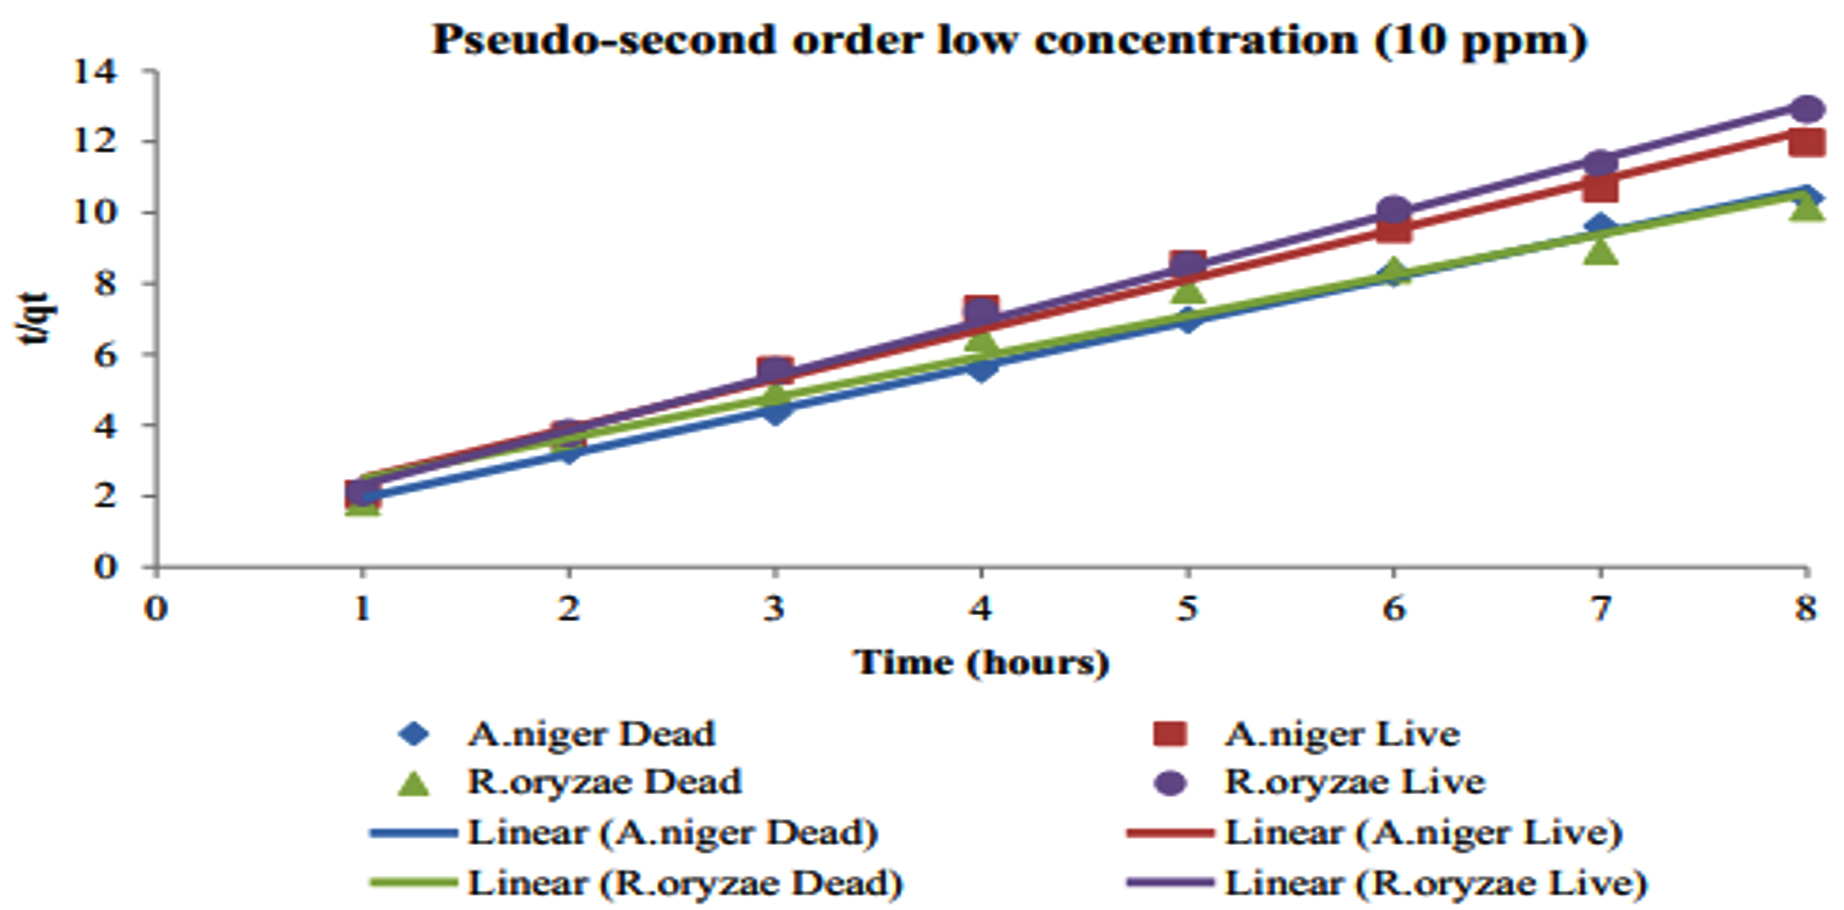
Fig. 13. The Pseudo-second-order at low concentration (10 ppm)
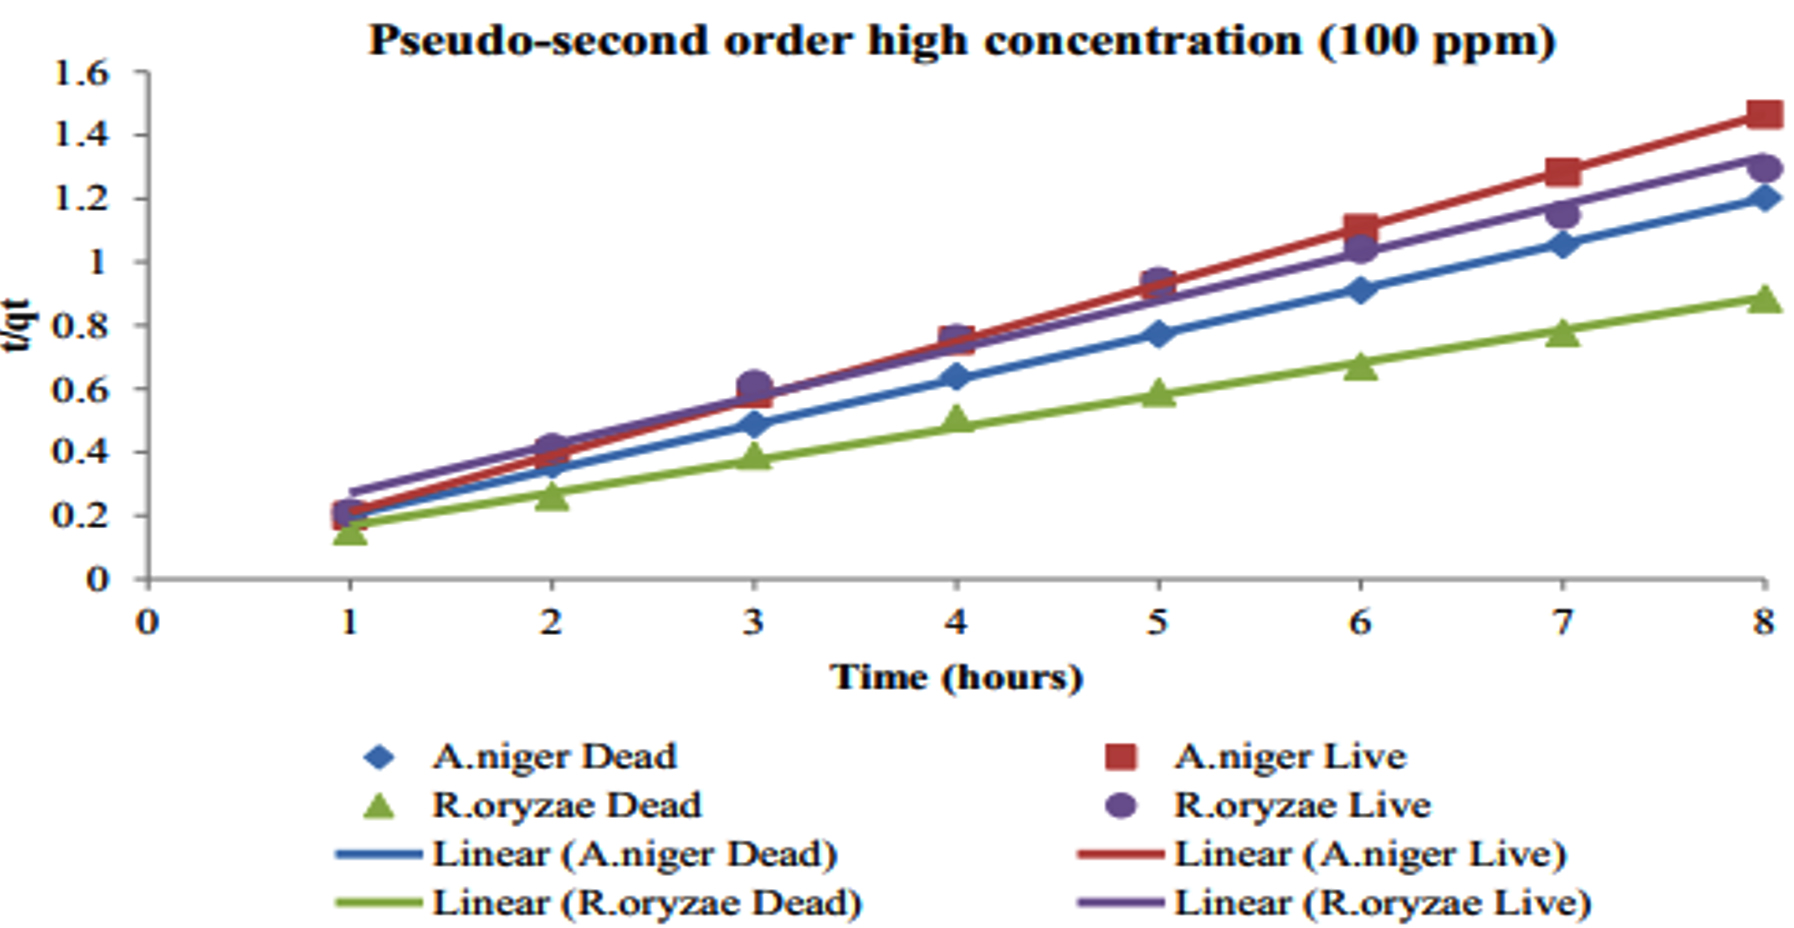
Fig. 14. The Pseudo-second-order at high concentration (100 ppm)
Based on Table 2, the R2 values for all cells is closer to 1, indicating it fits well with the Pseudo-second-order reaction. In fact, the graph also shows the constant rate between adsorbed amounts at the equilibrium is increased when the contact time is increased. Since the biosorption occur followed by the Pseudo-second-order mechanisms, the rate was proportional to the square of the number of remaining sites. According to this model, it is assumed if a divalent ion binds to the two monovalent negatively charged sites, the rate should be proportional to the square of the free surface sites.
Table (2):
The kinetic data of Pseudo-second-order reaction for live and dead R.oryzae and A.niger.
Intial concentration of Hg2+ (ppm) |
Biosorbent |
K2 |
Qe (mg/g) |
R2 |
|---|---|---|---|---|
A. niger Dead |
0.1364 |
0.7227 |
0.9978 |
|
10 |
A. niger Live |
0.1441 |
0.6548 |
0.9884 |
R. oryzae Dead |
0.1145 |
0.7841 |
0.9706 |
|
R. oryzae Live |
0.1586 |
0.6155 |
0.9979 |
|
|
A. niger Dead |
0.01487 |
6.6410 |
0.9993 |
100 |
A. niger Live |
0.01824 |
5.4560 |
0.9997 |
R. oryzae Dead |
0.01075 |
9.0217 |
0.9956 |
|
R. oryzae Live |
0.01526 |
6.1040 |
0.9867 |
It is also suggested the biosorption process is depend on the concentration of the biosorbent and absorbate which means chemical sorption involving sharing and exchanging of electron might occur (Iram et al., 2010). Additionally, the K2 values are much smaller than K1 values, which means that the absorption rate increased in time and the absorption rate was proportional to number of unoccupied sites.
Biosorption Isotherm Analysis
The parameters obtained from Langmuir and Freundlich models for the removal of Hg2+ ions are represented in Table 3.
Table (3):
Parameters of biosorption model isotherms for Hg2+ at low (10 ppm) and high concentration (100 ppm).
| Concentration | Isotherm | Parameters | R2 | |||
|---|---|---|---|---|---|---|
| KL (L/mg) | Qm (mg/g) | KF (mg/g) | 1/n | |||
| 10 ppm 100 ppm |
Langmuir | 0.0195 | 0.9809 0.9960 |
|||
| 0.1019 | ||||||
| 0.2068 | ||||||
| 0.1793 | ||||||
| 10 ppm 100 ppm |
Freundlich |
0.4172 | 0.9884 0.9578 |
|||
| 1.0378 | ||||||
| 0.3003 | ||||||
| 2.2577 | ||||||
In Table 3, the values of maximum monolayer adsorption capacity (Qm) and Langmuir constant (KL) for 10 and 100 ppm are 0.1019 mg/g, 0.1793 mg/g and 0.0195 L/mg, 0.2068 L/mg respectively. Low KL values indicate the weak interactions between Hg2+ ions and the fungus cells.
For Freundlich isotherm, the constant values of KF and 1/n are 0.4172 mg/g, 0.3003 mg/g and 1.0378, 2.2577. Generally, the value of n < 1 indicates the adsorption intensity was favourable over the whole range of concentrations, while n > 1 implies that the adsorption intensity was favourable at high concentrations but less favourable at lower concentrations (Degs et al., 2003). A value of 1/n below one (1) indicates a normal Freundlich isotherm while 1/n above one (1) is an indicative of cooperative adsorption (Amin, 2008). The correlation coefficient, R2, the Freundlich isotherm are 0.9884 and 0.9578, is slightly lower than the Langmuir model (0.9809 and 0.9960), indicating that the experimental data best fitted with Langmuir isotherm. Thus, the adsorption between Hg2+ and dead and live biomass of R. oryzae and A.niger was assumed to occur on a homogenous surface of adsorbent via chemisorption and physiosorption.
Both live and dead cells of R. oryzae and A. niger have the ability to remove Hg2+ because of hydroxyl, carboxyl and amino on their cell wall. Through Langmuir isotherm, the absorption occurs on the homogenous surface. This study also represents the Pseudo-second-order, suggesting chemisorption occurred. However, the dead cells of R. oryzae and A. niger are better in removing Hg2+ compared to live cells.
ACKNOWLEDGMENTS
We thank University Teknologi Mara, Perlis Branch for providing the facilities for the research and University Teknologi Malaysia for Rhizopus oryzae.
CONFLICT OF INTEREST
The authors declare that there is no conflict of interest.
AUTHORS’ CONTRIBUTION
All authors have made a substantial, direct, and intellectual contribution to the work and approve it for publication.
FUNDING
All equipment, chemical & facilities Supported by Faculty of Applied Sciences, UiTM Perlis Branch.
ETHICS STATEMENT
This article does not contain any studies with human participants or animals performed by any of the authors
AVAILABILITY OF DATA
All datasets generated or analyzed during this study are included in the manuscript.
- Ahmad F. Heavy Metal Biosorption potential of Aspergillus and Rhizopus sp. isolated from Wastewater treated soil. Journal of Applied Sciences and Environmental Management. 2005;9(1):9. (ISSN: 1119-8362).
- Al-Degs Y, Tutunji M, Baker H. Isothermal and kinetic adsorption behaviour of Pb2+ ions on natural silicate minerals. Clay Minerals – Clay Miner. 2003.38(4):501-509.
Crossref - Chen G, Fan J, Liu R, Zeng G, Chen A, Zou Z. Removal of Cd(II), Cu(II) and Zn(II) from aqueous solutions by live Phanerochaete chrysosporium. Environmental Technology. 2012;33(23):2653-2659.
Crossref - Fu F, Wang Q. Removal of Heavy Metal Ions from Wastewaters: A Review. J Environ Manage. 2011;92:407-418.
Crossref - Gochev VK, Velkova ZI, Stoytcheva MS. Hexavalent chromium removal by waste mycelium of Aspergillus awamori. Journal of the Serbian Chemical Society. 2010;75(4):551-564.
Crossref - Gupta A, Joia J. Microbes as Potential Tool for Remediation of Heavy Metals: A Review. Journal of Microbial & Biochemical Technology. 2016;8(4):364-372.
Crossref - Gupta R, Ahuja P, Khan S, Saxena RK, Mohapatra H. Microbial biosorbents: Meeting challenges of heavy metal pollution in aqueous solutions. Current Science. 2000;78(8):967-973. Retrieved from http://www.jstor.org/stable/24103732
- Iram M, Guo C, Guan Y, Ishfaq A, Liu H. Adsorption and magnetic removal of neutral red dye from aqueous solution using Fe3O4 hollow nanospheres. J Hazard Mater. 2010;181(1-3):1039-1050.
Crossref - Ismail I, Mostafa T, Sulaymon A, Abbas S. Bisorption of heavy metals: A review. Journal of Chemical Science and Technology. 2014;3:74.
- Kapoor A, Viraraghavan T. Biosorption of heavy metals on Aspergillus niger: Effect of pretreatment. Bioresour Technol. 1998;63(2):109-113.
Crossref - Lakhdhar I, Belosinschi D, Mangin P, Chabot B. Development of a bio-based sorbent media for the removal of nickel ions from aqueous solutions. J Environ Chem Eng. 2016;4(3):2607-3706.
Crossref - Malkoc E, Nuhoglu Y. Investigations of nickel (II) removal from aqueous solutions using tea factory waste. J Hazard Mater. 2005;127(1-3):120-128.
Crossref - Martinez-Juarez VM, Cardenas-Gonzalez JF, Torre-Bouscoulet ME, Acosta-Rodriguez I. Biosorption of Mercury (II) from Aqueous Solutions onto Fungal Biomass. Bioinorganic Chemistry and Applications, 2012;2012:156190.
Crossref - Nakbanpote W, Goodman B, Thiravetyan P. Copper adsorption on rice husk derived materials studied by EPR and FTIR. Colloids and Surfaces A: Physicochemical and Engineering Aspects. 2007;304(1-3):7-13.
Crossref - Oves M, Khan MS, Zaidi A. Biosorption of heavy metals by Bacillus thuringiensis strain OSM29 originating from industrial effluent contaminated north Indian soil. Saudi J Biol Sci. 2013;20(2):121-129.
Crossref - Taloin R, Safitri A, Prasetyawan S. Biosorption of Pb2+ using Trichoderma viride as Alternative Solution for Heavy Metal Pollution in the Waters. The Journal of Pure and Applied Chemistry Research. 2018;7:70-78.
Crossref
© The Author(s) 2020. Open Access. This article is distributed under the terms of the Creative Commons Attribution 4.0 International License which permits unrestricted use, sharing, distribution, and reproduction in any medium, provided you give appropriate credit to the original author(s) and the source, provide a link to the Creative Commons license, and indicate if changes were made.