

ISSN: 0973-7510
E-ISSN: 2581-690X
Glucose Oxidase (GOX) is naturally produced by several microorganisms. In this article, the enzymes isolated from Pseudomonas and Actinomyces species were studied for enzyme characteristics, activity, stability and kinetic parameters. Enzyme extracted from Strain 1 (ES1), has shown optimum activity at 27°C and pH 5, half-life at 30°C. The enzyme was highly tolerant to AgNO3 (1.4mM) and less tolerant to NaCl; but was stable at 2.4mM of NaCl. 96% of activity was observed at 1.7mmol of Mg2+. 94% and 83% of activity were seen for Co and Cu when used as chelating agents. Denaturation of the enzyme occurred when DTAB was tested for its denaturing effect. 92% of enzyme activity was recorded by D-glucose when used as a substrate. The activation energy of 23.95 kJmol/l, 27°C, Vmax of 1.2U and Km of 6.91mM were recorded. Whereas Enzyme extracted from Strain 2 (ES2), reported optimum activity at 30°C and 5 pH, attained half-life after 30 minutes at 45°C. ES2 exhibited tolerance CoCl2 at 1.6mM and HgCl2 at 0.6mM. Stability of the enzyme observed at 3mM concentration for all salts used in experimentation. Enzyme activity of 98% for Mg2+ and 0% for Fe2+ were recorded among other metal ions. Enzyme activity of 87% for Co and 78% for Cu when used as chelating agents. Denaturation of the enzyme occurred when urea was used. 96% for D-glucose and 20% for sucrose were calculated as enzyme activity. Activation energy of 39.5 kJmol, 30°C, Vmax of 0.7U and Km of 72mM were recorded.
GOX, Glucose oxidase, Vmax, Substrates, Kinetic, Chemical, Thermodynamic.
In the past few decades, usage of enzymes in numerous industries like paper, textile, food, organic compound synthesis and others have increased gradually as they are highly efficient along with being environmentally friendly. Currently biotechnological enzyme usage in industries has established a global market projected to reach 6.3 billion USD by 20212. These enzymes, that can be used in production processes retain optimum activity at ambient or at elevated temperatures due to which they can be deactivated by thermal inactivation whenever required. Due to this reason, there has been a relentless search of enzymes that can deliver better performance at moderate temperature mainly from microbial sources that can survive in harsh environments. The most studied enzymes that can be activated at frigid temperatures used in industries like textile, food, brewing and biofuel are proteases, amylases, cellulases and lipases.
One such industrially essential enzyme is glucose oxidase. Latterly glucose oxidase is taken up with invigorating interest in industrial sector as it has promising applications in various fields like medical, chemical, pharmaceutical, biotechnological, beverage and food industries. Glucose oxidase catalyzes the oxidation reaction of b-D-glucose to gluconic acid producing hydrogen peroxide by consuming molecular oxygen as an electron acceptor3. This enzyme has novel application in biosensors, due to this potential the search of GOXs from various microbial sources is exponentially increasing; the most studied GOX that has been commercialized was from Aspergillus niger; as it is stable at a broad range of temperature and pH along with possessing high substrate specificity.
It has been accepted universally that the sustainability of an enzyme for industrial and practical usage depends upon its stability in various media, pH, and temperature3. Thermodynamic parameters remain a fundamental aspect for inactivation studies. There is much attention around enhancement of properties of GOX mostly due to its extensive applications in various fields.
It is significant to investigate GOX from novel microbial strains by studying structure and stability relationships of the enzyme to exploit the emerging industrial potentials. In previous report1 two microorganisms were isolated from sustainable sources and tested for their enzyme producing capably in several media conditions, GOXs were extracted, purified for more testing. In this paper, the enzymes produced by earlier isolated stains1 were tested for its stability and activity at a range of temperature, pH, metal ions, substrates, along with its kinetic parameters. The results obtained are expected to compute further information on the profile of GOXs isolated.
Glucose oxidase activity
Activity of glucose oxidase was determined at temperature of 30°C3. The reaction mixture contains 100 mM D-glucose, 50 mM sodium phosphate, 0.01% phenol red, 0.03mg horseradish peroxidase along with the enzyme aliquots making the total reaction volume up to 3 ml. The reaction was halted with the addition of 4M NaOH. The enzyme activity (mU/mL) was then assayed at 610nm.
Effect of pH and temperature on activity and stability of GOX
The optimum level of pH for extracted GOXs were estimated by monitoring its activity at a pH range of 2-12 composed of various buffers like phosphate buffer, Tris–HCl buffer, glycine-NaOH, Acetate buffer, MES, BES, and Bicine4.
pH stability was determined by incubating the enzyme at 25°C for 12 hours, sample was tested for stability every one hour at a pH range of 2-12 and the residual activity percentage was measured5.
The optimum temperature for enzyme activity was measured at a range of 10°C to 100°C with 5°C increment.
Thermal stability was performed by incubating the sample from 10°C to 70°C with an increment of 10°C for a time range of 30 minutes to 5 hours with an increment of 30 minutes, followed by cooling on ice. Their residual activity percentage was determined6.
Effect of salt concentrations on stability of enzyme
Stability of enzyme purified were tested by individually incubating the enzyme with various salts like MgCl2, CaCl2, BaCl2, CoCl2, NaCl2, MnCl2, ZnSO2, FeCl2, NiCl2, CuSO4, AgNO3, HgCl2 at concentrations ranging from 0.2 mmol to 3 mmol at optimum temperature of 42°C in 100mM Glycine –NaOH buffer with a pH of 10.5 and incubated for two hours. The stability of the enzyme was calculated by measuring the remaining activity after the incubation time7,8.
Effect of metal ions on enzyme activity
Influence of various metal ions was tested on the extracted and purified GOXs. The enzymes were treated with K-PB buffer with pH of 6 and incubated for 2 hours at 25°C.
Effect of chelating agents on enzyme activity
Aqueous solutions were prepared that contains Cu (II) or Co (II) ions at a range of 100 to 1200 ppm with an increment of 100ppm pH of these solutions were altered starting from 2 ending at 10 with the help of suitable acid and base mixtures. These solutions were then incubated overnight with a gel mixture for GOX adsorption studies. GOX was dissolved in 20 ml 0.02 M phosphate buffer solution and a notable amount of gel particles was added. After the incubation period the free enzyme and amount of enzyme absorbed are estimated by placing samples in a flask and oxygenated continuously followed by adding 1 mM of D-glucose as substrate. Horseradish peroxidase was included to the sample after incubation of 30 minutes. The development of color is observed and read at 500nm spectrophotometrically. GOX activity was calculated from the absorbance value9,10.
Effect of denaturing agents on enzyme activity
Purified glucose oxidases were added at a concentration of 0.1% to 1 % in 10mm tris-HCL buffer, denaturing gents like SDS, Urea, DTAB, SHS and Guanidine hydrochloride were added at a concentration range of 0.5% to 2%, pH was altered to be in the range of 4-8 and incubated at room temperature for 48 hours. The samples were then assayed at an interval of 10 min for first 4 hours and then the testing interval was broadened to 5 hours. The activity was measured after diluting enzyme solutions 500 times with 10 mm phosphate buffer at pH 7.011-13.
Effect of substrates and concentrations on enzyme activity
The substrate specificity of purified GOX was tested on D-glucose, trehalose, D-galactose, melibiose, raffinose, L-mannomethylose, D-fructose, D-xylose at different concentration range of 0.1M to 1M for each sugar. The enzyme assay was performed under conditions of optimum pH and temperature.
Activation Energy
Stability of GOX thermally in the presence of the substrate at various concentrations can be determined by the rate constant (K) at a range of temperature. Dependence of temperature on rate constant was calculated from Arrhenius plot from which activation energy Ea can be obtained from the slope. The equation for determining activation energy is described below:
Ea = -RT ln K;
Where K=rate constant, Ea = activation energy, R = Gas constant (8.3145 J/K mol) and T = Temperature in Kelvin.
Activation energy was assayed at 5.5 pH and temperature of 20°C to 50°C for the reaction mixtures that contain glucose at range of 1-40 mM and was determined from Arrhenius plot.
Kinetic parameters
Vmax and Km values were calculated by using Lineweaver-Burk plot. The plot was plotted between enzyme activity and concentration of the substrate, from this plot Vmax and Km values are calculated. Where Vmax is the velocity of the reaction and Km is half of the substrate concentration at which the enzyme exhibited maximum activity.
Enzymes extracted previously were tested for glucose activity at optimum temperature and pH spectrometric ally for enzyme confirmation. Enzyme activity was measured at 610nm and plotted to reveal that the enzymes extracted were positively identified as glucose oxidase.
Optimum temperature and pH for GOX activity
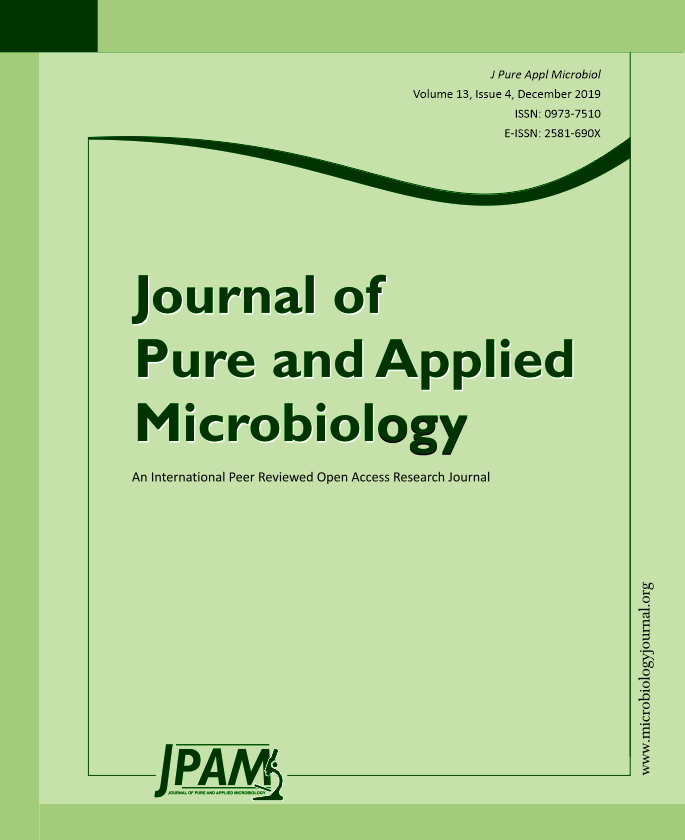
GOX from Pseudomonas species exhibited optimal activity at 27°C and exhibited more than 83% of maximum activity between 20°C to 30°C but a decrease in activity was observed after 40°C. GOX from Pseudomonas maintained nearly 89% of activity at 32°C when compared to its optimal activity between 20°C and 30°C that indicates that this extracted enzyme can be used after stabilization at such temperatures.(Fig. 1).
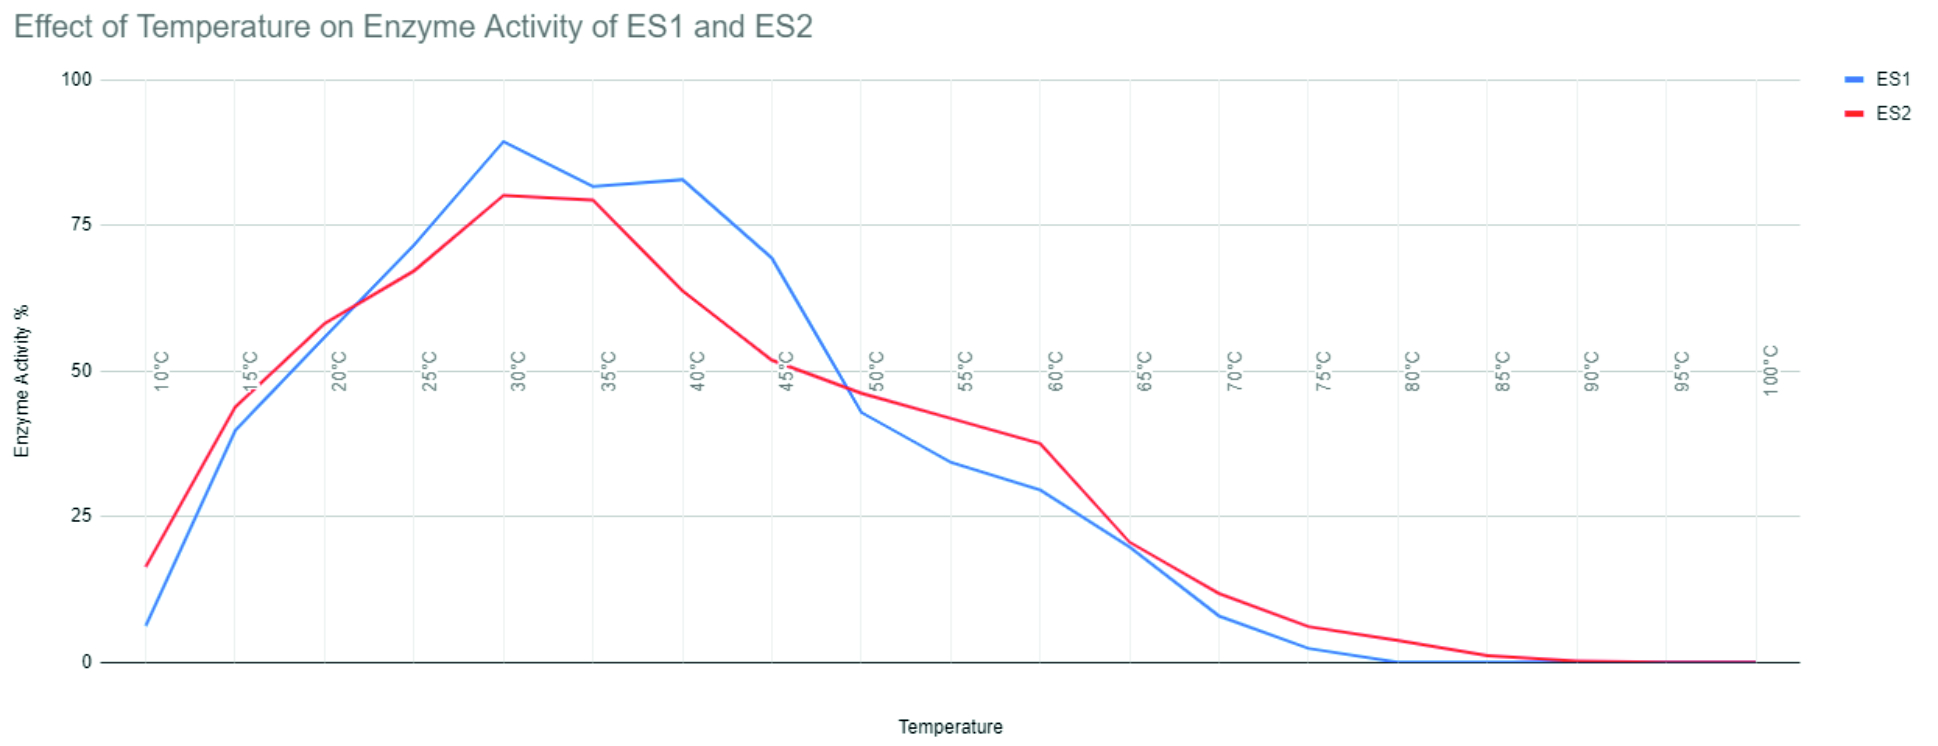
Fig. 1. Effect of temperature on enzyme activity of ES1 and ES2.
GOX from Actinomyces species indicated optimal activity at 30°C showing maximum activity of 80% at temperatures between 20°C and 35°C. There was a decrease observed in activity after 50°C. The enzyme extracted from this species maintained 85% of its activity at 28°C as compared to its activity between the temperatures 20°C and 40°C indicating that this enzyme could be used at a range of temperatures after stabilization. (Fig. 1).
ES1 was active at an optimum pH of 5; under a narrow pH profile of 4-6 pH. After crossing 6 pH there has been a decrease in the enzyme activity when phosphate buffer was used as a medium. Enzyme activity was recorded to be at 90% for phosphate buffer, while in glycine-NaOH buffer and in acetate buffer was reported to be relatively 89% and 76% respectively at a pH of 6 and 4. There was a steep decrease in activity after 6 pH for all buffers used (Fig. 2).
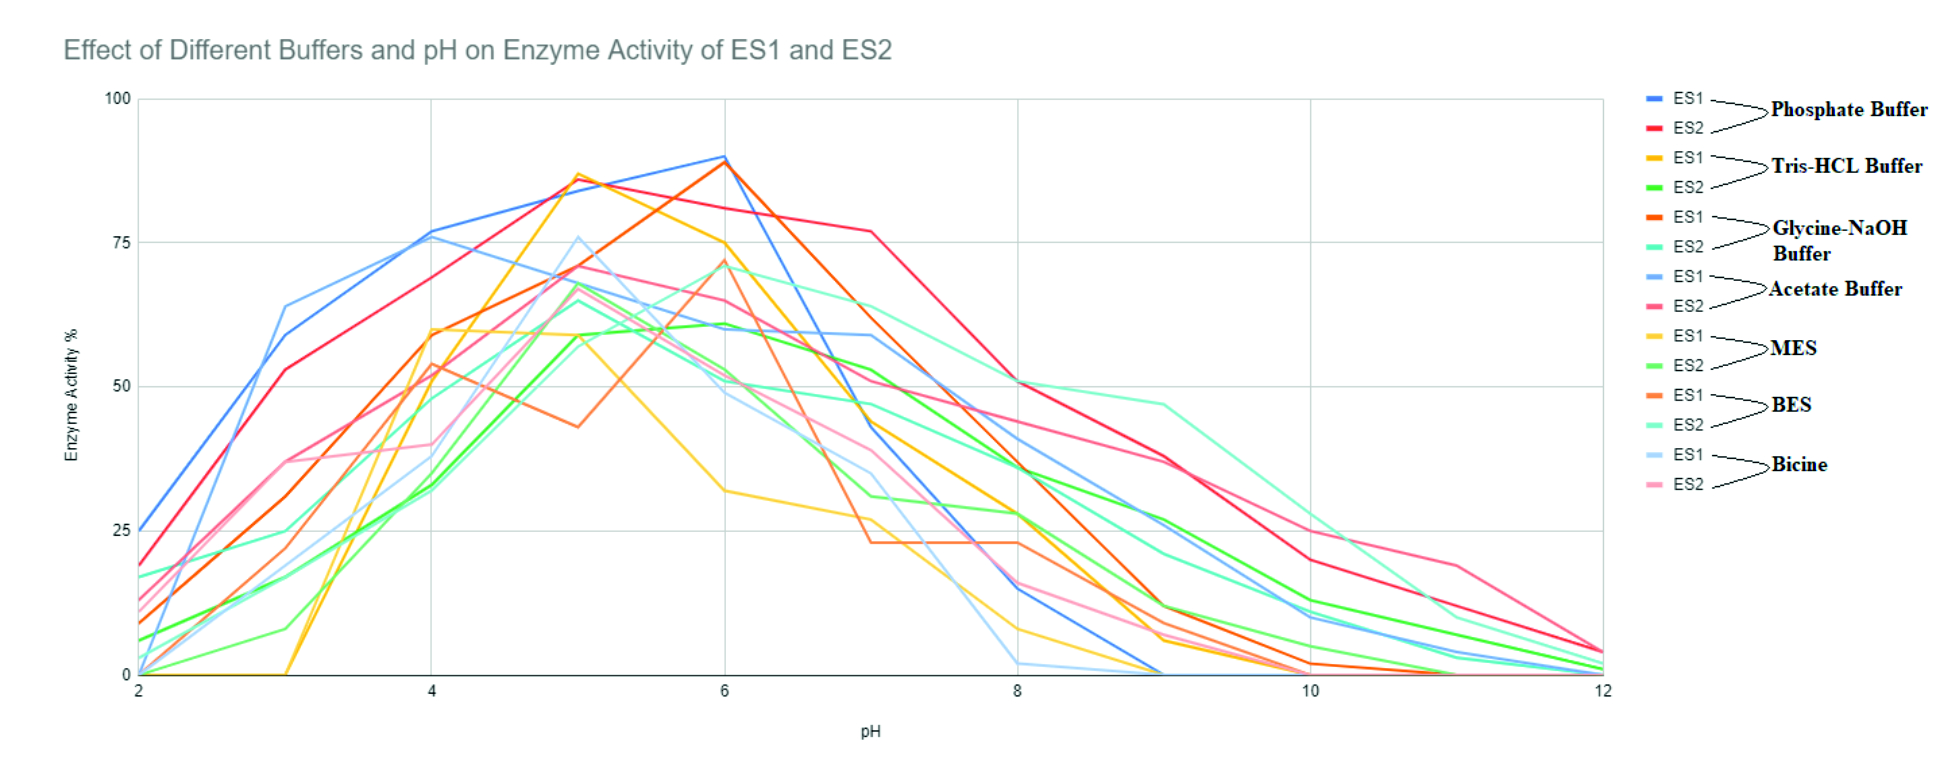
Fig. 2. Effect of different buffers and pH on enzyme activity of ES1 and ES2.
ES2 was screened for its activity at similar conditions as ES1. The enzyme was active at optimum pH of 5 under a profile of 4-7 pH. There was a decrease in the activity recorded when pH crossed 6. Maximum enzyme activity of 86% was recorded for phosphate buffer, 65% for glycine-NaOH, and 71% for acetate buffer when the pH was 5 for all buffers. There was a decrease in activity for the rest of the buffers. After 6 pH, enzyme activity decreased exponentially (Fig. 2).
Temperature and pH stability of purified enzyme
ES1 was tested for its stability at various temperatures for a period of 10 hours. Its residual activity was recorded to be unchanged for 9 hours while its half-life was recorded at 1 hour when the temperature was at 40°C. This enzyme was stable up to 50°C; there is a decrease in stability after this (Fig. 3).
ES2 was tested for stability at similar temperatures as above. It was recorded that the residual activity of GOX was unchanged for 6 hours at 40°C while the half-life was recorded to be at 30 min when the temperature was 45°C. Enzyme was stable up to 40°C after which the stability decreased due to excessive temperatures (Fig. 3).
Fig. 3. Effect of temperature and incubation period on enzyme stability of ES1 and ES2.
ES1 the relative activity was found to be at 95% at pH of 7, when incubated for 35 minutes. The relative activity decreased from pH 9 after 2 hours of incubation. The enzyme was stable up to pH of 10 when incubated for 30 minutes but stability decreased when the enzyme was provided in a buffer with 8-12 pH (Figure 4).
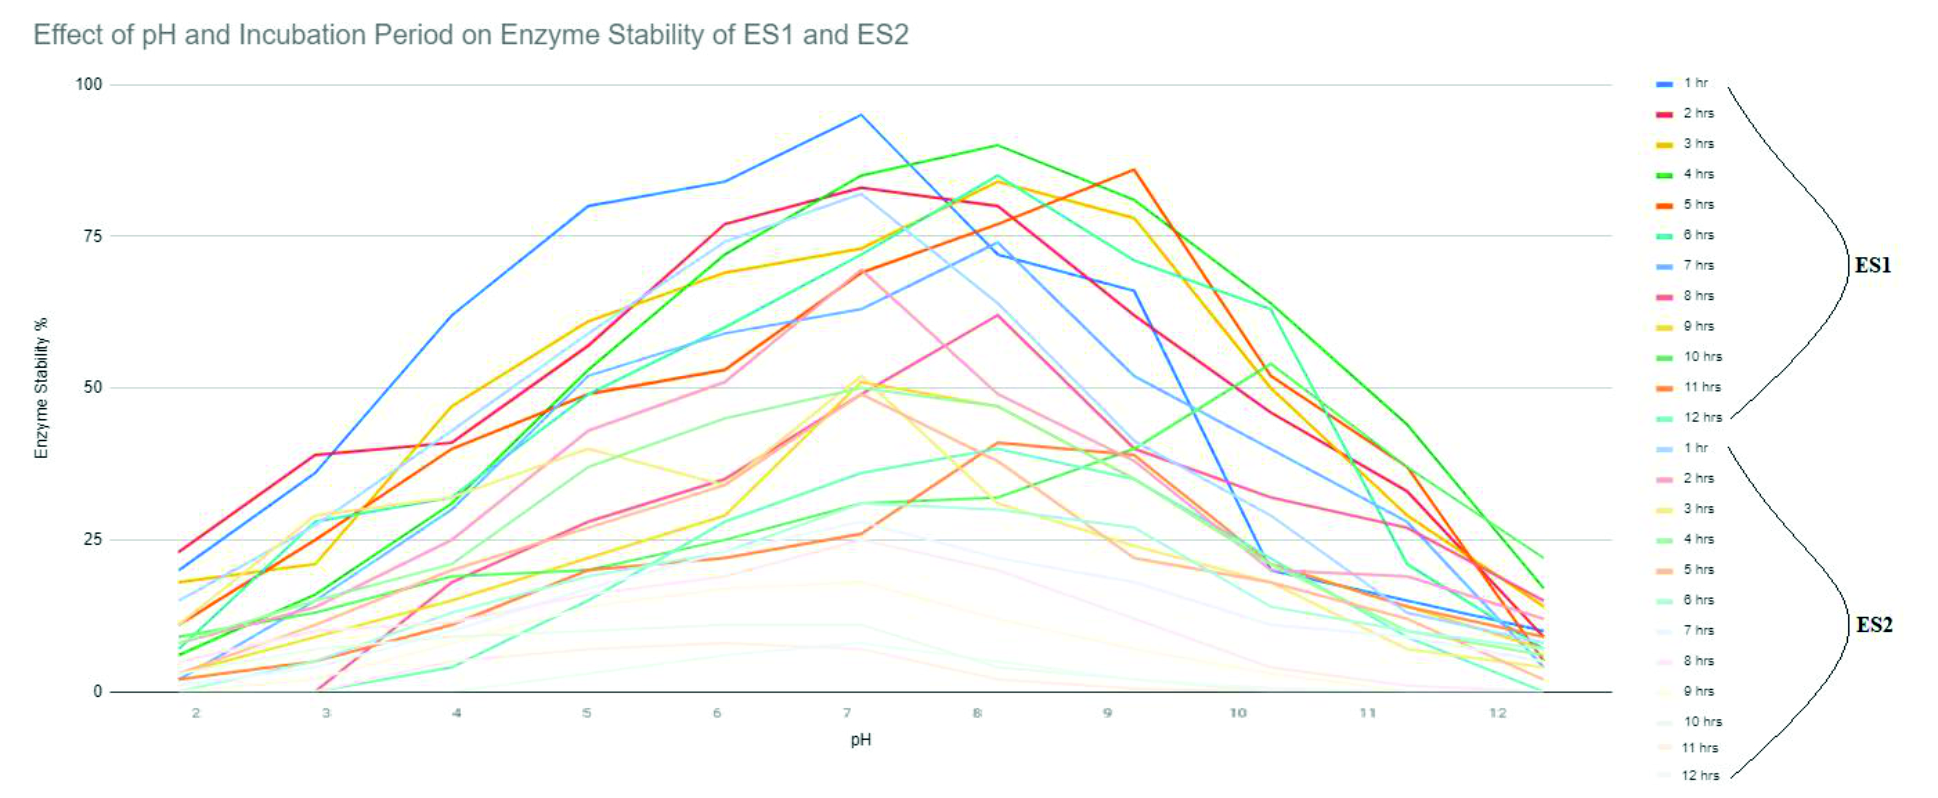
Fig. 4. Effect of pH and incubation period on enzyme stability of ES1 and ES2.
ES2 reported its relative activity to be 80% at 6.6 pH, when the sample was 30 minutes into incubation. The relative activity decreased when the pH is 9 and time duration of 90 minutes has lapsed. The enzyme has indicated stability even at pH 10 when it was incubated for 50 minutes but it became unstable when pH of the buffer varied from 7.5-12 (Fig. 4).
Effect of salt concentrations on enzyme stability
The effect of diverse salts at various concentrations on stability of the enzyme and its relative activity were tested by incubating both the purified enzymes in respective salt solutions and incubated along with D-glucose to interpret the activity after 2 hours of incubation. For ES1, the highest activity of 90% was recorded when AgNO3 at 1.4 mM was used for assay and the most limited activity of 17% was recorded in NaCl at 2.4 mM. The stability of the enzyme was intact until the concentration of 1.4 in all salts after which the stability decreased resulting in high relative activity (Table 1).
Table (1):
Effect of salts and their concentrations on enzyme stability of ES1 and ES2.
| Strain | Salt Concentration | |||||||||||||||
|---|---|---|---|---|---|---|---|---|---|---|---|---|---|---|---|---|
| Salts | 0.2mM | 0.4mM | 0.6mM | 0.8mM | 1mM | 1.2mM | 1.4mM | 1.6mM | 1.8mM | 2mM | 2.2mM | 2.4mM | 2.6mM | 2.8mM | 3mM | |
| MgCl2 | ES1 | 21.653 | 25.891 | 32.564 | 35.951 | 41.99 | 48.95 | 56.381 | 55.423 | 51.739 | 43.856 | 50.358 | 38.957 | 47.29 | 40.2 | 32.9 |
| ES2 | 43.92 | 45.39 | 50.23 | 59.21 | 53.6 | 57.6 | 61.37 | 79.34 | 61.27 | 72.39 | 69.23 | 59.3 | 47.29 | 40.2 | 32.9 | |
| CaCl2 | ES1 | 19.52 | 23.856 | 27.993 | 30.85 | 37.93 | 42.85 | 59.412 | 54.92 | 49.23 | 58.34 | 51.22 | 59.34 | 50.97 | 47.39 | 35 |
| ES2 | 42.99 | 42.69 | 53.68 | 64.2 | 62.49 | 59.37 | 54.28 | 50.79 | 69 | 61.28 | 51.22 | 59.34 | 50.97 | 47.39 | 35 | |
| BaCl2 | ES1 | 17.355 | 22.964 | 27.54 | 30.22 | 34.86 | 39.96 | 41.73 | 37.51 | 39.65 | 40.22 | 40.175 | 35.852 | 29.643 | 34.92 | 39.33 |
| ES2 | 39.2 | 40.62 | 59.42 | 61.69 | 64.94 | 51.37 | 59.34 | 66.37 | 59.3 | 65.35 | 70.9 | 62.17 | 51.96 | 42.37 | 36.27 | |
| CoCl2 | ES1 | 23.654 | 24.69 | 37.66 | 40.84 | 48.93 | 51.92 | 69.34 | 63.99 | 51.86 | 54.94 | 55.31 | 46.34 | 30.27 | 35.9 | 19.3 |
| ES2 | 42.69 | 47.23 | 51.53 | 58.22 | 62.69 | 60.28 | 73.28 | 89.34 | 86.17 | 74.94 | 65.31 | 56.34 | 50.27 | 35.9 | 29.3 | |
| NaCl2 | ES1 | 18.345 | 22.95 | 27.95 | 32.63 | 27.69 | 38.99 | 49.54 | 44.21 | 38.021 | 26.85 | 21.54 | 17.056 | 15.39 | 10.523 | 9.95 |
| ES2 | 33.56 | 34.06 | 40.99 | 51.99 | 52 | 49.36 | 56.18 | 63.27 | 73.89 | 65.27 | 59.37 | 51.27 | 49.32 | 50.67 | 25.71 | |
| MnCl2 | ES1 | 18.45 | 23.88 | 30.62 | 32.95 | 39.86 | 42.51 | 62.99 | 58.31 | 58.94 | 59.34 | 60.33 | 62.95 | 52.91 | 49.81 | 35.91 |
| ES2 | 42.51 | 42.91 | 40.61 | 59.14 | 55.7 | 57.31 | 59.37 | 51.37 | 63.75 | 57.39 | 67.34 | 61.37 | 42.31 | 49.3 | 32.37 | |
| ZnSo4 | ES1 | 20.55 | 27.91 | 32.79 | 40.46 | 51.96 | 69.55 | 71.42 | 68.43 | 70.21 | 59.33 | 42.66 | 50.11 | 39.72 | 41.78 | 32.71 |
| ES2 | 37.32 | 39.94 | 48.62 | 57.21 | 54.78 | 55.34 | 59.37 | 52.79 | 69.14 | 77.39 | 50.29 | 65.01 | 49.31 | 42.36 | 40.21 | |
| FeCl2 | ES1 | 21.62 | 27.96 | 36.55 | 41.84 | 51.82 | 63.92 | 78.99 | 73.52 | 75.91 | 68.53 | 62.95 | 53.97 | 42.59 | 31.8 | 26.35 |
| ES2 | 33.61 | 39.62 | 41.3 | 55.93 | 54.6 | 57.21 | 55.27 | 63.17 | 70.38 | 69.5 | 56.37 | 67.22 | 53.29 | 59.27 | 42.7 | |
| NiCl2 | ES1 | 19.48 | 27.99 | 31.52 | 40.22 | 52.86 | 59.47 | 82.75 | 74.99 | 62.3 | 34.81 | 28.77 | 30.66 | 26.84 | 23.6 | 18.025 |
| ES2 | 43.96 | 46.9 | 50.3 | 43.69 | 59.2 | 51.36 | 49.37 | 59.31 | 63.14 | 53.18 | 51.36 | 53.19 | 40 | 53.18 | 50.1 | |
| CuSo4 | ES1 | 14.9 | 32 | 43.52 | 49.31 | 56.32 | 52.85 | 59.04 | 66.41 | 72.69 | 68.43 | 74.95 | 61.28 | 52.99 | 43.95 | 32.96 |
| ES2 | 44.3 | 45 | 57.6 | 51.99 | 57.3 | 59.67 | 59.37 | 69.37 | 70.29 | 69.23 | 71.34 | 67.3 | 51.37 | 43.2 | 35.8 | |
| AgNo3 | ES1 | 29.64 | 38.95 | 45.72 | 56.93 | 63.77 | 76.34 | 90.46 | 64.62 | 70.51 | 63.71 | 53.74 | 39.85 | 43.86 | 32.7 | 28.46 |
| ES2 | 31.5 | 36.92 | 51.9 | 62.7 | 61.39 | 51.89 | 53.17 | 50.37 | 68.49 | 68.34 | 59.28 | 66.89 | 57 | 42.39 | 41.89 | |
| HgCl2 | ES1 | 23.85 | 30.79 | 38.67 | 43.61 | 58.72 | 69.85 | 82.99 | 72.89 | 63.87 | 59.86 | 37.82 | 29.81 | 21.97 | 19 | 17.48 |
| ES2 | 37.3 | 31.54 | 20.65 | 49.67 | 53.64 | 53.6 | 59.37 | 73.24 | 61.28 | 59.34 | 57.31 | 51.37 | 42.16 | 46 | 31.57 | |
Out of all the salts, CoCl2 indicated high activity of 94% at a concentration of 1.6 mM and lowest activity of 21% was shown by HgCl2 at a concentration of 0.6 mM for ES2 (Table 1).The stability of the enzyme was maintained at the concentrations of 0.2-1 mM, but after the salt concentrations of 2.4 to 3 mM stability decreased resulting in low relative activity.
Effect of Metal Ions on activity of Enzyme
ES1 and ES2 were incubated with metal ions as previously described. Enzyme purified from stain 1 were analyzed, it reported that its activity was not affected by Mg2+, Ca2+, Ni2+, Al2+, Zn2+but was highly inhibited by Mn2+, Hg2+, Ag2+, Cu2+, Fe2+. This enzyme showed high relative activity of 96% when Mg2+ was used at 1.7 mmol-l concentration and there was no activity recorded when Ag2+ was used at 2.2 mmol-l concentrations. (Table 2).
Table (2):
Effect of metal ions on enzyme activity of ES1 and ES2.
| Strain | Concentrations of Metal Ions | |||||||||||
|---|---|---|---|---|---|---|---|---|---|---|---|---|
| Metal Ions | 1 mmol/L | 1.2 mmol/L | 1.4 mmol/L | 1.6 mmol/L | 1.8 mmol/L | 2 mmol/L | 2.2 mmol/L | 2.4 mmol/L | 2.6 mmol/L | 2.8 mmol/L | 3 mmol/L | |
| Mg2+ | ES1 | 39.11 | 53.25 | 65.81 | 84.29 | 96.93 | 74.98 | 88.31 | 62.17 | 39.88 | 21.63 | 10.43 |
| ES2 | 13.68 | 26.85 | 40.28 | 52.95 | 67.48 | 53.24 | 60.57 | 79.21 | 82.97 | 92.72 | 98.03 | |
| Ca2+ | ES1 | 19.55 | 36.84 | 41.3 | 62.71 | 84.99 | 50.38 | 62.94 | 48.69 | 26.54 | 35.88 | 14.87 |
| ES2 | 8.52 | 15.62 | 20.71 | 36.85 | 58.48 | 53.21 | 41.58 | 38.61 | 29.18 | 36.95 | 28.57 | |
| Mn2+ | ES1 | 11.49 | 24.75 | 49.61 | 52.88 | 49.25 | 69.37 | 73.94 | 65.33 | 44.27 | 29.19 | 17.92 |
| ES2 | 3.68 | 4.31 | 13.67 | 19.85 | 25.11 | 30.68 | 26.74 | 21.88 | 17.42 | 20.67 | 29.21 | |
| Ni2+ | ES1 | 9.33 | 16.73 | 31.97 | 41.071 | 54.88 | 49.51 | 60.83 | 53.96 | 39.81 | 10.94 | 9.26 |
| ES2 | 8.31 | 11.75 | 14.82 | 18.29 | 21.75 | 24.11 | 18.74 | 21.73 | 29.7 | 17.95 | 10.88 | |
| Al3+ | ES1 | 24.95 | 37.21 | 40.85 | 53.88 | 61.42 | 68.94 | 54.94 | 39.52 | 21.93 | 10.96 | 2 |
| ES2 | 2.11 | 6.29 | 9.41 | 11.84 | 17.53 | 21.99 | 24.71 | 21.96 | 15.31 | 9.51 | 4.12 | |
| Zn2+ | ES1 | 10.85 | 37.96 | 44.83 | 59.31 | 60.45 | 59.46 | 32.88 | 20.58 | 12.55 | 4.78 | 0 |
| ES2 | 12.56 | 16.83 | 19 | 21.9 | 28.18 | 30.56 | 21.5 | 17.31 | 11.57 | 7.33 | 3.94 | |
| Hg2+ | ES1 | 21.97 | 35.94 | 42.61 | 51.86 | 69.5 | 42.51 | 36.99 | 24.83 | 13.9 | 5 | 0 |
| ES2 | 7.91 | 13.84 | 17.44 | 21.52 | 20.57 | 17.42 | 15.39 | 11.52 | 9.04 | 4.28 | 2.51 | |
| Ag2+ | ES1 | 26.3 | 36.66 | 32.61 | 36.8 | 41.93 | 23.97 | 0 | 0 | 0 | 0 | 0 |
| ES2 | 3.58 | 8.52 | 11.28 | 14.82 | 19.57 | 15.38 | 9.57 | 7.33 | 2.65 | 0.13 | 1.52 | |
| Cu2+ | ES1 | 15.72 | 24.61 | 39.77 | 44.86 | 52.19 | 40.5 | 38.92 | 23.85 | 14.29 | 6.42 | 0 |
| ES2 | 5.21 | 8.44 | 9.04 | 13.75 | 14.92 | 18.59 | 11.28 | 9.91 | 6.31 | 3.27 | 7.28 | |
| Fe2+ | ES1 | 29.54 | 32.9 | 49.86 | 57.42 | 62.95 | 57.6 | 42.9 | 36.31 | 21.58 | 11.7 | 3 |
| ES2 | 0 | 0 | 0 | 0 | 0 | 0 | 0 | 0 | 0 | 0 | 0 | |
The GOX activity of ES2 was unaffected by Mg2+, Ca2+, Mn2+, Ni2+, Al2+, Zn2+ but the activity was majorly inhibited by Hg2+, Ag2+, Cu2+, Fe2+. The enzyme showed high relative activity of 98% when Mg2+ was used at a concentration of 3 mmol while there was no activity when Fe2+ was used at concentration of 2.8 mmol-l. (Table 2).
Effect of chelating agents on enzyme activity
ES1 and ES2 were incubated with hydro gel incorporated with Cu and Co of concentrations 100 to 1200 ppm for 5 hours. The enzyme activity is calculated by using the gel and the free enzyme for spectrophotometric readings done at 276nm.Adsorption was noticed to be high at pH 6 and 7 (Table 3).
Table (3):
Effect of chelating agents and their concentrations on enzyme activity of ES1 and ES2.
| Chelating Agents | pH | Strain | 100ppm | 200ppm | 300ppm | 400ppm | 500ppm | 600ppm | 700ppm | 800ppm | 900ppm | 1000ppm | 1100ppm | 1200ppm | 1300ppm | 1400ppm | 1500ppm |
|---|---|---|---|---|---|---|---|---|---|---|---|---|---|---|---|---|---|
| Cu | 2 | ES1 | 3.78 | 8.93 | 13.86 | 27.94 | 34.62 | 39.51 | 43.22 | 57.94 | 51.49 | 43.75 | 39.57 | 21.69 | 25.31 | 17.59 | 6.42 |
| ES2 | 13.84 | 22.57 | 29.94 | 25.31 | 30.51 | 37.27 | 41.53 | 42.9 | 49.05 | 52.58 | 56.99 | 49.21 | 38.63 | 21.33 | 15.94 | ||
| 3 | ES1 | 9.45 | 14.24 | 29.58 | 35.68 | 41.79 | 37.62 | 38.63 | 45.76 | 49.71 | 53.67 | 63.78 | 70.42 | 65.61 | 52.78 | 35.37 | |
| ES2 | 11.51 | 16.49 | 20.41 | 25.69 | 31.95 | 38.61 | 42.95 | 49.16 | 53.99 | 48.32 | 44.96 | 32.68 | 40.72 | 36.45 | 27.71 | ||
| 4 | ES1 | 17.45 | 14.39 | 20.62 | 39.19 | 40.67 | 57.39 | 42.68 | 49.68 | 54.67 | 67.39 | 70.53 | 69.31 | 56.29 | 43.27 | 39.61 | |
| ES2 | 19.32 | 24.78 | 31.96 | 37.42 | 41.67 | 32.67 | 28.65 | 25.94 | 31.82 | 36.04 | 41.29 | 36.51 | 22.96 | 14.38 | 24.86 | ||
| 5 | ES1 | 13.68 | 19.62 | 25.86 | 30.62 | 37.93 | 41.402 | 53.94 | 68.91 | 59.2 | 72.45 | 71.49 | 59.76 | 40.68 | 37.31 | 21.56 | |
| ES2 | 21.58 | 36.81 | 42.61 | 57.94 | 62.58 | 49.51 | 31.85 | 29.57 | 34.06 | 40.82 | 49.61 | 58.22 | 44.96 | 38.02 | 29.65 | ||
| 6 | ES1 | 21.94 | 29.47 | 37.41 | 42.87 | 50.21 | 68.32 | 62.59 | 73.75 | 81.29 | 74.71 | 51.85 | 47.62 | 32.85 | 29.75 | 16.37 | |
| ES2 | 19.94 | 23.72 | 31.94 | 40.09 | 43.17 | 52.07 | 57.42 | 63.28 | 69.04 | 53.99 | 45.07 | 38.95 | 21.42 | 18.05 | 11.38 | ||
| 7 | ES1 | 17.37 | 24.81 | 40.28 | 36.48 | 47.78 | 59.31 | 65.28 | 73.85 | 83.57 | 81.48 | 79.32 | 62.68 | 51.91 | 32.67 | 21.83 | |
| ES2 | 13.67 | 26.85 | 30.05 | 38.27 | 42.68 | 51.94 | 31.57 | 43.19 | 49.67 | 58.11 | 65.82 | 78.03 | 69.31 | 53.99 | 42.57 | ||
| 8 | ES1 | 14.48 | 21.17 | 35.18 | 32.91 | 26.44 | 37.56 | 41.94 | 48.87 | 57.42 | 69.37 | 54.32 | 49.39 | 32.66 | 28.56 | 16.92 | |
| ES2 | 9.52 | 17.94 | 20.56 | 28.71 | 35.92 | 40.99 | 42.61 | 48.26 | 51.92 | 54.83 | 41.06 | 37.95 | 32.95 | 26.41 | 17.4 | ||
| 9 | ES1 | 7.36 | 12.49 | 23.75 | 31.47 | 45.79 | 59.63 | 53.85 | 37.69 | 45.81 | 42.79 | 40.28 | 35.88 | 21.49 | 18.41 | 14.78 | |
| ES2 | 2.31 | 4.95 | 11.54 | 19.4 | 23.06 | 31.58 | 29.22 | 35.37 | 21.58 | 17.42 | 21.18 | 27.59 | 34.26 | 28.41 | 21.84 | ||
| 10 | ES1 | 2.81 | 6.38 | 11.49 | 16.83 | 23.31 | 29.67 | 35.94 | 42.72 | 48.67 | 50.46 | 58.23 | 42.58 | 26.58 | 21.67 | 16.39 | |
| ES2 | 1.37 | 4.96 | 9.44 | 13.67 | 16.39 | 19.55 | 23.01 | 34.86 | 21.67 | 10.18 | 11.05 | 19.42 | 26.37 | 12.68 | 6.31 | ||
| Co | 2 | ES1 | 8.48 | 15.86 | 21.79 | 28.66 | 25.83 | 31.76 | 35.88 | 35.91 | 46.26 | 36.71 | 57.92 | 44.59 | 50.15 | 69.36 | 73.64 |
| ES2 | 3.68 | 5.91 | 10.58 | 28.91 | 31.95 | 40.58 | 49.31 | 53.19 | 67.24 | 41.58 | 50.91 | 53.91 | 62.68 | 42.51 | 28.35 | ||
| 3 | ES1 | 2.61 | 9.62 | 19.45 | 11.65 | 24.78 | 32.69 | 47.7 | 49.62 | 55.72 | 68.44 | 77.3 | 72.64 | 46.61 | 58.72 | 39.88 | |
| ES2 | 10.58 | 14.35 | 23.85 | 26.01 | 33.68 | 39.27 | 42.88 | 50.27 | 43.91 | 41.47 | 39.41 | 20.57 | 24.81 | 30.7 | 19.47 | ||
| 4 | ES1 | 5.82 | 16.49 | 27.39 | 30.74 | 48.63 | 59.37 | 61.66 | 59.31 | 43.46 | 54.78 | 63.97 | 70.48 | 69.36 | 69.33 | 57.61 | |
| ES2 | 21.47 | 37.95 | 47.81 | 31.73 | 28.47 | 15.94 | 23.61 | 34.81 | 39.51 | 37.48 | 44.92 | 31.94 | 29.86 | 28.46 | 19.57 | ||
| 5 | ES1 | 11.58 | 18.55 | 24.82 | 23.61 | 35.78 | 42.95 | 50.83 | 64.88 | 79.67 | 67.43 | 59.6 | 41.692 | 55.94 | 61.68 | 79.32 | |
| ES2 | 8.25 | 17.48 | 25.99 | 31.56 | 37.92 | 42.57 | 49.77 | 32.58 | 29.17 | 24.85 | 36.94 | 40.99 | 41.59 | 49.58 | 32.14 | ||
| 6 | ES1 | 18.78 | 24.71 | 36.79 | 40.78 | 59.43 | 63.78 | 87.47 | 94 | 90.48 | 87.37 | 74.29 | 58.47 | 49.26 | 39.63 | 31.68 | |
| ES2 | 11.66 | 15.92 | 23.61 | 29.71 | 33.19 | 41.8 | 49.21 | 57.92 | 41.26 | 49.63 | 53.8 | 61.54 | 38.75 | 21.53 | 7.47 | ||
| 7 | ES1 | 18.45 | 29.57 | 30.61 | 38.69 | 43.29 | 40.78 | 59.78 | 85.88 | 79.41 | 72.69 | 65.81 | 50.82 | 57.3 | 48.32 | 43.73 | |
| ES2 | 19.43 | 25.26 | 30.92 | 36.25 | 42.95 | 32.84 | 38.92 | 45.86 | 58.99 | 63.15 | 73.85 | 87 | 64.91 | 47.95 | 23.62 | ||
| 8 | ES1 | 17.48 | 19.74 | 25.79 | 35.84 | 40.62 | 42.64 | 39.32 | 42.76 | 52.78 | 60.36 | 59.72 | 53.75 | 38.22 | 30.65 | 21.68 | |
| ES2 | 6.03 | 12.95 | 16.34 | 23.68 | 27.81 | 31.95 | 36.14 | 43.95 | 47.25 | 57.99 | 61.93 | 53.82 | 30.85 | 18.72 | 8.94 | ||
| 9 | ES1 | 4.89 | 12.49 | 13.92 | 19.57 | 25.83 | 31.79 | 38.64 | 43.89 | 49.72 | 52.75 | 69.434 | 51.56 | 40.28 | 35.79 | 21.96 | |
| ES2 | 1.52 | 5.61 | 9.85 | 13.91 | 19.6 | 25.94 | 31.95 | 39.77 | 43.96 | 50.37 | 33.85 | 29.51 | 17.32 | 8.51 | 2.69 | ||
| 10 | ES1 | 1.54 | 5.48 | 9.74 | 18.35 | 25.58 | 32.68 | 39.75 | 41.68 | 31.58 | 27.69 | 21.69 | 16.48 | 13.68 | 6.32 | 3.61 | |
| ES2 | 0 | 0.14 | 0.81 | 2.68 | 6.23 | 9.44 | 14.68 | 21.49 | 29.66 | 37.59 | 27.41 | 24.95 | 23.58 | 17.4 | 5.11 |
ES1 and ES2 demonstrated significant activity of 86% and 79% in phosphate buffer rather than in acetate buffer which was 58% and 42% respectively when incubated for 50 days. Enzymes demonstrated significant activity when Co is used as a chelating agent which was reported to be 94% and 87% for ES1 and ES2 respectively. Enzyme activity when Cu was used as chelating agent were reported to be barely than the former which recorded as 83% and 78% for ES1 and ES2 respectively (Table 3).
Effect of denaturing agents on enzyme activity
Both ES1 and ES2 have demonstrated intense activity when SDS, Urea and guanidine hydrochloride were incubated along with the enzyme for 48 hours while analyzing samples were taken first for 10 min for 4 hours. Activity for ES1 was maintained at 90%-98% when SDS, Urea and guanidine hydrochloride were used. Half-life was achieved after 1 hour of the reaction. Activity of the enzyme decreased after 10 hours of incubation. When SHS was used, the ES1 was recorded to be low i.e., 67% when the incubation time was 10 minutes only this was maintained till 2 hours even though the enzyme reached half-life after 30 minutes. DTAB displayed the most improper activity of 29% at 10 min making it an efficient denaturing agent. Half-life was achieved at 1 hour. The enzyme activity decreased after incubation for 3 hours after which the activity decreased at a rapid rate. At pH of 5.5 the denaturing agents showed high reactivity to enzyme at 40°C (Table 4).
Table (4):
Effect of denaturing agents and their concentrations on enzyme activity of ES1 and ES2.
| Strain | Temperature | |||||||||||
|---|---|---|---|---|---|---|---|---|---|---|---|---|
| Denaturing Agents | pH | 25°C | 30°C | 35°C | 40°C | 45°C | 50°C | 55°C | 60°C | 65°C | 70°C | |
| Sodium n-Dodecyl sulphate | 3.2 | ES1 | 33.48 | 40.82 | 52.99 | 67.58 | 73.56 | 88.59 | 90.03 | 83.58 | 64.29 | 43.72 |
| ES2 | 38.52 | 47.35 | 59.33 | 75.14 | 69.39 | 49.21 | 39.29 | 21.99 | 19.04 | 7.31 | ||
| 6.4 | ES1 | 24.83 | 34.91 | 48.28 | 52.92 | 68.52 | 72.93 | 90.29 | 85.39 | 68.33 | 33.19 | |
| ES2 | 31.52 | 49.13 | 54.96 | 81 | 74.92 | 50.47 | 63.72 | 49.51 | 28.75 | 19.42 | ||
| Urea | 3.2 | ES1 | 18.74 | 28.64 | 33.85 | 48.64 | 59.22 | 73.29 | 92.58 | 96.31 | 83.62 | 48.31 |
| ES2 | 17.48 | 25.39 | 57.38 | 79.37 | 84.95 | 68.28 | 51.68 | 38.74 | 30.39 | 13.66 | ||
| 6.4 | ES1 | 31.58 | 48.32 | 32.91 | 49.25 | 53.96 | 68.32 | 73.65 | 89.45 | 94.28 | 52.69 | |
| ES2 | 24.01 | 57.18 | 73.59 | 94 | 90.68 | 73.51 | 63.95 | 42.99 | 24.67 | 11.58 | ||
| Dodecyl Trimethyl Ammonium Bromide | 3.2 | ES1 | 3.69 | 5.39 | 9.29 | 11.69 | 18.59 | 21.85 | 29.59 | 19.57 | 13.58 | 8.58 |
| ES2 | 1.38 | 7.94 | 11.17 | 10.56 | 21.89 | 19.73 | 16.49 | 13.25 | 6.29 | 0.037 | ||
| 6.4 | ES1 | 1.55 | 4.63 | 6.42 | 11.45 | 17.94 | 20.67 | 26.49 | 29.14 | 17.26 | 5.32 | |
| ES2 | 5.21 | 13.28 | 22.64 | .29.41 | 18.23 | 20.95 | 12.58 | 16.43 | 8.52 | 2.51 | ||
| Guanidine Hydrochloride | 3.2 | ES1 | 19.51 | 23.58 | 27.58 | 35.68 | 40.6 | 58.71 | 67.31 | 83.68 | 93.67 | 78.41 |
| ES2 | 15.89 | 42.57 | 69.31 | 73.27 | 65.32 | 31.56 | 58.71 | 18.38 | 4.45 | 0.38 | ||
| 6.4 | ES1 | 12.86 | 24.62 | 37.6 | 46.55 | 49.81 | 72.56 | 64.23 | 83.56 | 91.56 | 64.22 | |
| ES2 | 8.44 | 14.29 | 53.94 | 89.13 | 73.27 | 61.44 | 58.46 | 42.91 | 27.53 | 9.47 | ||
| Sodium n-Hexadecyl Sulphate | 3.2 | ES1 | 14.39 | 26.58 | 31.12 | 48.9 | 52.58 | 41.67 | 58.42 | 67.21 | 53.27 | 32.1 |
| ES2 | 11.27 | 37.41 | 25.18 | 63.49 | 41.83 | 22.47 | 35.27 | 39.54 | 47.55 | 49.32 | ||
| 6.4 | ES1 | 10.57 | 30.91 | 41.57 | 38.61 | 59.36 | 61.59 | 59.75 | 62.9 | 52.95 | 37.59 | |
| ES2 | 24.58 | 52.56 | 63.18 | 93.44 | 78.27 | 82.46 | 50.28 | 36.21 | 53.29 | 41.58 | ||
ES2 has exhibited high enzyme activity at pH of 6.2 when urea, Guanidine and SHS were used which were recorded as 94%, 89%, 93% respectively after 20 minutes of incubation. Half-life for all these three agents was achieved after 1 hour of the reaction as the activity decreased after 5, 9 and 12 hours respectively. SHS batch showed enzyme activity little less than the above batches, i.e. 71% showing that SHS managed to denture the enzyme to a little extent only in 40 minutes of the incubation period, half-life of the enzyme was achieved at 2 hours while the enzyme activity decreased rapidly from 4 hours of incubation. DTAB showed high denaturing effect as the enzyme activity was extremely less i.e. 29% after 10 minutes of incubation; the half-life was achieved after 1 hour of the reaction while enzyme activity decreased after 2 hours of incubation. Reaction of denaturing agents against the enzyme was best at 6.2 -6.5 pH when the temperature was maintained at 40°C. (Table 4).
Effect of substrates and concentrations on enzyme activity
ES1 and ES2 were tested for activity against numerous substrates like D-glucose, trehalose, D-galactose, melibiose, raffinose, L-mannomethylose, D-fructose, D-xylose, lactose and sucrose at concentrations ranging from 0.1 M-1 M.
ES1 exhibited excellent specificity to D-glucose when it is added as a substrate than other substrates as high enzyme activity, i.e. 92% at the concentration of 0.4M and incubated for 24 hours. The enzyme activity was recorded at 85% for melibiose at 0.7M, 77% for trehalose 0.3M, 69% for raffinose 0.2M, 48% for D-galactose 1M, 39% for L-mannomethylose at 0.1M, 20% for D-fructose 0.6M, 20% for D-xylose 0.1M, 13% for lactose 0.1M and 6% for sucrose 1M.(Table 5).
Table (5):
Effect of substrates and their concentrations on enzyme activity of ES1.
| Strain | Concentration of Substrates | |||||||||||
|---|---|---|---|---|---|---|---|---|---|---|---|---|
| Substrates | Incubation Period | 0.1mM | 0.2mM | 0.3mM | 0.4mM | 0.5mM | 0.6mM | 0.7mM | 0.8mM | 0.9mM | 1mM | |
| D-glucose | 24hrs | ES1 | 27.48 | 47.38 | 63.29 | 92.01 | 87.38 | 63.22 | 52.48 | 61.49 | 41.48 | 25.72 |
| ES2 | 74 | 88 | 90 | 80 | 91 | 96 | 77 | 86 | 90 | 71 | ||
| 48hrs | ES1 | 13.51 | 16.49 | 39.27 | 43.29 | 59.93 | 64.28 | 72.88 | 81.58 | 63.19 | 41.57 | |
| ES2 | 81 | 79 | 83 | 55 | 67 | 90 | 81 | 72 | 67 | 51 | ||
| 72hrs | ES1 | 28.57 | 31.57 | 44.69 | 56.82 | 61.58 | 58.39 | 43.68 | 41.88 | 32.67 | 26.94 | |
| ES2 | 75 | 69 | 53 | 67 | 59 | 71 | 62 | 81 | 73 | 66 | ||
| 96hrs | ES1 | 12.68 | 22.68 | 35.78 | 48.69 | 59.19 | 54.29 | 49.38 | 42.58 | 31.57 | 24.6 | |
| ES2 | 69 | 71 | 80 | 74 | 59 | 40 | 71 | 63 | 55 | 50.39 | ||
| 120hrs | ES1 | 1.69 | 10.68 | 16.49 | 21.68 | 35.67 | 40.92 | 37.59 | 25.39 | 14.6 | 11.39 | |
| ES2 | 42 | 57 | 66 | 52 | 70 | 76 | 87 | 80 | 75 | 80.67 | ||
| Trehalose | 24hrs | ES1 | 36.87 | 47.98 | 77.3 | 59.08 | 61.96 | 54.99 | 62.16 | 54.97 | 79.99 | 46.93 |
| ES2 | 72 | 75.3 | 71.28 | 65.97 | 81.29 | 83 | 77.54 | 79.6 | 80.34 | 89.39 | ||
| 48hrs | ES1 | 28.97 | 30.46 | 48.94 | 57.92 | 61.82 | 53.89 | 47.32 | 50.71 | 42.94 | 36.83 | |
| ES2 | 51.3 | 57.9 | 69.37 | 71.28 | 77.34 | 80.31 | 71.3 | 55.37 | 67.9 | 63.25 | ||
| 72hrs | ES1 | 16.98 | 28.31 | 28.09 | 42,87 | 37.99 | 25.73 | 47.98 | 59.85 | 57.97 | 57.31 | |
| ES2 | 47.3 | 51.37 | 55.2 | 67.4 | 52.8 | 71.34 | 69.5 | 77.4 | 61.2 | 57.9 | ||
| 96hrs | ES1 | 21.86 | 28.96 | 36.74 | 46.78 | 53.26 | 59.77 | 47.83 | 28.53 | 17.55 | 13.75 | |
| ES2 | 34.2 | 49.19 | 57.3 | 59.7 | 57.2 | 69.5 | 57.3 | 61.2 | 64.7 | 61.8 | ||
| 120hrs | ES1 | 9.65 | 37.98 | 41.87 | 35.89 | 24.77 | 39.87 | 45.98 | 36.88 | 21.42 | 15.65 | |
| ES2 | 30.4 | 43.5 | 40.9 | 42.1 | 40.2 | 56.7 | 51.23 | 59.34 | 50.8 | 54.6 | ||
| D-galactose | 24hrs | ES1 | 23.09 | 36.55 | 43.89 | 32.12 | 42.87 | 35.99 | 27.64 | 31.89 | 34.76 | 48.72 |
| ES2 | 57.31 | 60.27 | 64.39 | 59.34 | 65.2 | 61.4 | 59.39 | 68.4 | 72.9 | 71.8 | ||
| 48hrs | ES1 | 19.76 | 26.89 | 34.76 | 42.78 | 22.87 | 43.98 | 21.78 | 35.79 | 41.89 | 31.64 | |
| ES2 | 52.17 | 53.7 | 54.29 | 60.17 | 59.37 | 69.37 | 56.8 | 57.2 | 64.39 | 65.17 | ||
| 72hrs | ES1 | 27.81 | 29.99 | 37.97 | 23.87 | 41.88 | 36.74 | 33.67 | 23.78 | 19.97 | 27.66 | |
| ES2 | 49.38 | 49 | 51.28 | 55.6 | 54.71 | 59.3 | 67.24 | 63.2 | 59.79 | 61.24 | ||
| 96hrs | ES1 | 16.99 | 21.65 | 37.89 | 31.76 | 25.76 | 21.78 | 30.98 | 32.87 | 26.98 | 17.33 | |
| ES2 | 45.91 | 49.36 | 57.9 | 60.27 | 58.37 | 67.2 | 54.8 | 50.9 | 58.6 | 57.39 | ||
| 120hrs | ES1 | 19.54 | 24.65 | 28.76 | 35.75 | 32.87 | 29.62 | 16.89 | 33.86 | 21.98 | 21.76 | |
| ES2 | 58.3 | 57.19 | 51.3 | 69.47 | 70.5 | 62.8 | 59.31 | 54.2 | 52.19 | 64.8 | ||
| Melibiose | 24hrs | ES1 | 25.89 | 37.865 | 43.98 | 53.87 | 74.99 | 53.31 | 85.32 | 63.88 | 28.71 | 21.76 |
| ES2 | 89.47 | 84.61 | 87.26 | 88.6 | 91.57 | 90.25 | 84.39 | 80.33 | 47.2 | 9.56 | ||
| 48hrs | ES1 | 17.97 | 27.85 | 33.87 | 47.31 | 50.63 | 64.86 | 53.84 | 34.78 | 46.88 | 56.98 | |
| ES2 | 80.29 | 74.36 | 84.21 | 86.75 | 70.15 | 79.36 | 65.81 | 51.34 | 40.29 | 29.73 | ||
| 72hrs | ES1 | 24.99 | 31.97 | 34.78 | 54.77 | 43.98 | 50.52 | 47.09 | 37.98 | 21.89 | 36.88 | |
| ES2 | 59.3 | 61.8 | 74.3 | 80.9 | 86.4 | 74.99 | 56.21 | 60.13 | 49.35 | 19.87 | ||
| 96hrs | ES1 | 17.98 | 25.97 | 30.98 | 46.52 | 35.98 | 38.65 | 21.87 | 41.87 | 32.86 | 21.42 | |
| ES2 | 49.33 | 50.1 | 69.6 | 52.84 | 64.88 | 56.31 | 55 | 47.29 | 31.22 | 20.6 | ||
| 120hrs | ES1 | 36.79 | 25.86 | 32.87 | 22.76 | 12.87 | 34.87 | 21.78 | 32.88 | 26.74 | 21.83 | |
| ES2 | 66.73 | 74.29 | 51.84 | 62.39 | 73.15 | 58.37 | 43.27 | 33.17 | 24.69 | 9.27 | ||
| Raffinose | 24hrs | ES1 | 43.86 | 69.32 | 54.43 | 36.87 | 53.98 | 33.98 | 42.89 | 57.98 | 46.87 | 32.54 |
| ES2 | 59.37 | 56.33 | 69.41 | 50.24 | 43.55 | 39.36 | 40.9 | 35.19 | 29.37 | 20.11 | ||
| 48hrs | ES1 | 26.89 | 33.87 | 26.71 | 49.84 | 23.98 | 47.82 | 33.96 | 24.75 | 35.65 | 42.76 | |
| ES2 | 55.29 | 51.37 | 60.81 | 58.39 | 53.4 | 49.2 | 41.33 | 36.27 | 27.73 | 11.69 | ||
| 72hrs | ES1 | 31.78 | 40.97 | 37.54 | 46.87 | 32.75 | 25.74 | 21.99 | 39.65 | 26.87 | 10.63 | |
| ES2 | 43.29 | 48.22 | 47.6 | 50.91 | 48.36 | 35.27 | 12.67 | 10.9 | 6.77 | 10.74 | ||
| 96hrs | ES1 | 14.79 | 26.88 | 34.98 | 23.65 | 32.85 | 21.77 | 20.98 | 25.76 | 31.75 | 24.76 | |
| ES2 | 47.39 | 4.33 | 49.25 | 30.67 | 39.66 | 45.29 | 38.67 | 25.11 | 20.67 | 14.3 | ||
| 120hrs | ES1 | 12.78 | 20.98 | 14.77 | 24.65 | 23.75 | 33.71 | 24.87 | 25.88 | 20.98 | 23.61 | |
| ES2 | 53.9 | 51.27 | 58.34 | 50.26 | 47.55 | 49.32 | 41.5 | 31.27 | 24.11 | 21.6 | ||
| L-mannomethylose | 24hrs | ES1 | 26.87 | 36.88 | 26.87 | 15.88 | 26.73 | 24.89 | 29.95 | 30.51 | 26.99 | 39.22 |
| ES2 | 57.16 | 51.39 | 56.22 | 51.9 | 49.3 | 45.27 | 35.27 | 11.5 | 10.7 | 8.33 | ||
| 48hrs | ES1 | 15.87 | 20.98 | 28.77 | 14.76 | 20.54 | 10.75 | 25.88 | 35.89 | 27.98 | 23.78 | |
| ES2 | 55.3 | 54.21 | 59.37 | 47.23 | 42.11 | 39.22 | 31.77 | 29.34 | 21.66 | 20.8 | ||
| 72hrs | ES1 | 17.97 | 20.65 | 21.99 | 15.76 | 13.98 | 11.87 | 10.87 | 13.87 | 21.87 | 17.99 | |
| ES2 | 47.9 | 46 | 42.33 | 49.51 | 40.23 | 39.22 | 34.18 | 29.6 | 27.51 | 22.9 | ||
| 96hrs | ES1 | 10.87 | 15.87 | 25.98 | 14.98 | 20.76 | 16.74 | 13.87 | 11.98 | 8.53 | 17.54 | |
| ES2 | 45.33 | 46.7 | 42.19 | 39.33 | 36.27 | 31.25 | 28.61 | 27.3 | 24.69 | 14.3 | ||
| 120hrs | ES1 | 23.68 | 11.42 | 19.69 | 14.69 | 12.59 | 4.69 | 10.55 | 12.58 | 13.53 | 11.49 | |
| ES2 | 45 | 47.36 | 46.33 | 42.1 | 40.8 | 36.22 | 31.85 | 29.4 | 24.66 | 11.55 | ||
| D-fructose | 24hrs | ES1 | 10.53 | 11.56 | 12.58 | 12.69 | 16.38 | 20.04 | 18.58 | 14.62 | 13.58 | 18.45 |
| ES2 | 51.36 | 49.33 | 49.2 | 44.31 | 40.25 | 44.29 | 35.26 | 36.22 | 29.33 | 18.37 | ||
| 48hrs | ES1 | 4.68 | 3.68 | 14.38 | 12.59 | 11.66 | 18.43 | 15.73 | 12.68 | 10.53 | 14.62 | |
| ES2 | 49.2 | 45.36 | 47.22 | 41.39 | 40.2 | 36.28 | 31.22 | 32.54 | 24.19 | 11.4 | ||
| 72hrs | ES1 | 2.64 | 3.68 | 5.38 | 7.29 | 12.64 | 10.68 | 9.03 | 3.68 | 6.69 | 15.34 | |
| ES2 | 50.26 | 45.36 | 42.33 | 44.36 | 36.25 | 32.11 | 30.57 | 24.19 | 21.36 | 17.23 | ||
| 96hrs | ES1 | 5.38 | 19.43 | 16.48 | 14.62 | 11.69 | 16.35 | 19.32 | 13.58 | 12.68 | 9.43 | |
| ES2 | 42.39 | 47.36 | 41.28 | 39.26 | 32.51 | 27.66 | 24.3 | 21.55 | 18.36 | 14.35 | ||
| 120hrs | ES1 | 9.42 | 13.54 | 13.02 | 9.48 | 13.02 | 11.52 | 8.43 | 7.33 | 2.59 | 8.38 | |
| ES2 | 40.22 | 39.27 | 48.33 | 41.7 | 35.67 | 30.22 | 29.37 | 21.56 | 14.67 | 9.34 | ||
| D-xylose | 24hrs | ES1 | 20.05 | 20 | 20.02 | 18.35 | 13.62 | 17.43 | 15.39 | 11.57 | 5.31 | 9.43 |
| ES2 | 41.55 | 38.36 | 34.25 | 37.55 | 29.16 | 24.2 | 21.69 | 11.47 | 9.37 | 4.31 | ||
| 48hrs | ES1 | 3.62 | 2.96 | 7.21 | 9.4 | 12.91 | 12.68 | 11.76 | 12.65 | 6.53 | 1.69 | |
| ES2 | 42.55 | 40.3 | 38.24 | 34.55 | 30.2 | 27.55 | 21.67 | 21.84 | 16.34 | 8.26 | ||
| 72hrs | ES1 | 0 | 0 | 2.64 | 6.28 | 9.43 | 14.77 | 15.03 | 11.59 | 3.95 | 5.77 | |
| ES2 | 39.54 | 36.24 | 40.91 | 37.26 | 32.11 | 27.6 | 21.54 | 13.77 | 8.66 | 6.38 | ||
| 96hrs | ES1 | 0 | 0 | 1.99 | 3.04 | 4.88 | 7.41 | 11.62 | 10.62 | 5.88 | 3.61 | |
| ES2 | 34.29 | 32.15 | 37.26 | 31.29 | 30.94 | 28.36 | 25.39 | 19.67 | 11.5 | 4.88 | ||
| 120hrs | ES1 | 0 | 0 | 0 | 0 | 3.14 | 5.39 | 3.96 | 6.04 | 4.92 | 5.03 | |
| ES2 | 31.57 | 34.22 | 39.61 | 31.72 | 23.47 | 21.55 | 18.34 | 15.3 | 10.45 | 7.36 | ||
| Lactose | 24hrs | ES1 | 13.05 | 12.93 | 12.2 | 11.06 | 12.95 | 10.58 | 9.93 | 8.99 | 7.86 | 7.42 |
| ES2 | 28.37 | 26.31 | 21.69 | 20.8 | 18.36 | 15.29 | 11.23 | 10.57 | 8.06 | 4.39 | ||
| 48hrs | ES1 | 11.53 | 12.96 | 10.95 | 10.47 | 9.75 | 9.03 | 8.66 | 7.96 | 7.51 | 8.08 | |
| ES2 | 21.67 | 20.6 | 19.37 | 15.36 | 17.22 | 11.39 | 10.85 | 8.39 | 6.333 | 2.47 | ||
| 72hrs | ES1 | 3.06 | 5.39 | 4.22 | 6.48 | 7.43 | 6.04 | 5.29 | 4.21 | 3.04 | 2.91 | |
| ES2 | 24.69 | 21.33 | 19.34 | 16.35 | 11.2 | 19.96 | 7.61 | 4.88 | 2.04 | 0.69 | ||
| 96hrs | ES1 | 0.35 | 1.03 | 2.63 | 3.054 | 2.96 | 4.02 | 3.72 | 2.85 | 1.77 | 1.32 | |
| ES2 | 29.36 | 28.36 | 24.36 | 18.36 | 15.39 | 11.57 | 10.84 | 9.37 | 6.34 | 3.59 | ||
| 120hrs | ES1 | 0.19 | 0.43 | 0.84 | 1.69 | 3.67 | 3.02 | 2.99 | 1.71 | 1.38 | 1.03 | |
| ES2 | 23.9 | 1.06 | 19.33 | 14.75 | 16.58 | 11.27 | 9.26 | 5.74 | 3.25 | 1.06 | ||
| Sucrose | 24hrs | ES1 | 0 | 5.73 | 4.67 | 3.96 | 4.42 | 5.05 | 2.66 | 3.91 | 4.66 | 6.21 |
| ES2 | 20.67 | 18.36 | 15.41 | 14.67 | 12.35 | 10.93 | 11.37 | 9.23 | 7.069 | 3.49 | ||
| 48hrs | ES1 | 0.43 | 0.05 | 0.02 | 0.95 | 0.53 | 0.77 | 0.35 | 0.21 | 0.52 | 0.23 | |
| ES2 | 17.64 | 14.39 | 13.94 | 15.97 | 12.94 | 11.37 | 10.57 | 9.34 | 7.34 | 5.39 | ||
| 72hrs | ES1 | 0.967 | 0.57 | 0.86 | 0.64 | 0.37 | 0.28 | 0.15 | 0.11 | 0.13 | 0.01 | |
| ES2 | 13.29 | 10.25 | 9.34 | 11.8 | 10.34 | 9.35 | 7.34 | 4.99 | 2.98 | 0.84 | ||
| 96hrs | ES1 | 0.49 | 0.21 | 0.52 | 0.22 | 0.16 | 0.12 | 0.03 | 0 | 0 | 0 | |
| ES2 | 15.31 | 14.88 | 11.39 | 10.87 | 9.34 | 7.22 | 4.36 | 3.57 | 1.89 | 0.2 | ||
| 120hrs | ES1 | 0 | 0 | 0 | 0 | 0 | 0 | 0 | 0 | 0 | 0 | |
| ES2 | 13.87 | 10.67 | 9.35 | 8.33 | 7.59 | 6.01 | 4.93 | 2.87 | 1.06 | 0.18 | ||
ES2 showed high substrate specificity to D-glucose out of all others and showed exceptional enzyme activity i.e. 96% at 0.6M when incubated for 24 hours. The enzyme activity was recorded at 91% for melibiose at 0.5M, 83% for trehalose 0.6M, 69% for raffinose 0.3M, 64% for D-galactose 0.7M, 57% for L-mannomethylose at 0.1M, 51% for D-fructose 0.1M, 41% for D-xylose 0.1M, 28% for lactose 0.1M and 20% for sucrose 0.1M. (Table 5).
Activation Energy
GOX reaction was examined at different temperatures from 20°C to 50°C at 5.5 pH with substrate concentration 1 mM to 40 mM. The velocity of reactions increased with temperature proportionally while the rate constants were estimated. The Plot was linear for lnK against 1/T. Activation energy (Ea) was calculated from the slope to be at 23.95 kJmol/L for ES1 and 39.52 kJmol/L for ES2 at 27°C and 30°C of temperature which was determined as optimum temperature. (Table 6).
Table (6):
Kinetic parameters of ES1 and ES2.
Kinetic Parameters |
ES1 |
ES2 |
|---|---|---|
Vmax |
1.2U |
0.7U |
Km |
6.91mM |
72mM |
Ea |
23.95 kJmol/L |
39.5 kJmol/L |
Kinetic parameters
Kinetic parameters like Vmax and Km were calculated for both the extracted enzymes at a pH of 5.5 and 6 and a range of temperatures from 35°C to 70°C. The effect of D-glucose concentrations at a range of 2-50 mM as a substrate the rate of reaction was studied. Km (Michaelis – Menten constant) and Vmax (maximum reaction rate) were calculated from Lineweaver-Burk plots. Vmax and Km for ES1 were at an optimum rate when the temperature was 45°C at both 5.5 and 6 pH which was calculated as 6.91 mM and 5.1 mM of Km and 1.2U and 0.83U of Vmax respectively. Whereas for ES2 after the experiment calculated Km as 5.72 mM and 3.2 mM at 45°C with pH at 5.5 and 6 while Vmax was calculated to be 0.7U and 0.2U at 45°C. (Table 6).
Statistical Analysis
Statistical analysis was done to find the P value for all the characteristics of glucose oxidase extracted and purified from ES1 and ES2. P Values were calculated and analyzed as for enzyme activity for different parameters and recorded as follows, at various temperatures <0.0003(ES1) and <0.0001(ES), at different pH levels <0.0021 to <0.0415 (ES1) and <0.0001 to <0.0062 (ES2), alteration of metal ion concentrations <0.0075 to 0.0001 (ES1) and <0.001 and <0.0001 (ES2), chelating agents at different concentrations <0.0001 (ES1 and ES2) for both Cu and Co, denaturing agents at various concentrations gave <0.0013 to <0.0001(ES1) and <0.0008 to <0.0001 (ES2), different substrates at various concentrations read <0.0189 to <0.0001 (ES1) for all the batches with an exception of 0.3023 for trehalose and <0.0022 to <0.0001 (ES2). P values for Enzyme stability at different temperatures recorded to be 0.0077 to 0.0001 (ES1) and <0.0002 to <0.0001 (ES2), different pH gave values <0.0039 to 0.0001 (ES1) and <0.0004 to <0.0098 (ES2), tolerance of salt batches gave p value of <0.0001 for all batches.
GOX has several industrial applications like textiles, food, beverage, medical, pharmaceutical industries are amongst the list. To our soundest knowledge GOX from Pseudomonas and Actinomyces species were rarely studied. The enzyme from isolated Pseudomonas species (ES1) and Actinomyces (ES2) species were extracted and purified and identified as glucose oxidase by its enzyme activity and measuring it spectrometrically. The extracted enzymes are then further characterized according to the chemical, thermal and Kinetic characteristics. The optimum temperature for ES1 and ES2 were determined to be at 27°C and 30°C respectively. GOX isolated from both sources showed stability by retaining the enzyme activity at 50°C and 40°C respectively for 10 hours. These results were similar to A.niger and a recombinant GOX which retained intense activity in the temperature range of 25-40°C7. By seeing these temperature characteristics of the enzymes, it can be concluded that GOX from ES1 and ES2 can be used in kits and biosensors that are used at room temperature. They cannot be recommended for implantable biosensor applications that can operate at body temperature without further stabilization investigations. Optimum pH of enzymes was calculated to be 5 pH for both ES1 and ES2. Stability of the enzyme was maintained at 7 and 6.6 pH for both enzymes respectively. Changes in pH effects ionization of amino acid residues that are present at the active site that involve in substrates binding and other reactions. Ionization of this area causes distortion of the active site which indirectly affects the activity of the enzyme. The results reported in this paper were closely relatable to study in which it was reported that glucose dioxide possesses activity in the range of 4-7 pH10. Enzyme activity, when diverse salts were manipulated to test tolerance and stability of ES1, AgNO3 at concentration of 1.4 mM resulted in high activity while it was CoCl2 at 0.6 mM concentration that displayed activity of 90% and 94% respectively. Stability of the enzyme was intact till 1.4 mM and 1 mM in all salts used for both ES1 and ES2 respectively. A group of metal ions were tested for their effect on enzyme activity in this 96% of activity was observed in when Mg2+ was added to the reaction mixture while Ag2+ indicated no activity at all for ES1 which clearly shows the enzyme reaction was inhibited by Ag2+ 14,15 While for ES2, reaction mixture with Mg2+ showed 96% of activity while Fe2+ indicated no activity by inhibiting the enzymatic reaction. Denaturing agents when added to the reaction mixture to know about their effect on enzymes displayed significant activity when SDS, guanidine hydrochloride and urea were added that shows that no complexes were formed between the enzyme and the agent. There was moderate enzyme activity when the denaturing agent was SHS which shows that less complexes were formed while there was extremely less activity of the enzyme when DTAB was added which means that complete complexes were formed between the enzyme and DATB. These results were constant for both ES1 and ES2. SHS binds o the enzyme better than SDS due the SHS chain length that can increase demonstrating roles of a hydrophobic and iconic interaction. For some specific interactions, there is a necessity to have an iconic chief group along with a long hydrocarbon chain that can establish hydrophobic connection with the enzyme. This confirms that anionic parts of SDS and SHS bind with the cationic region of glucose oxidase which causes heat evolution. Deep ionic links were forged between DTAB, and negative sites on glucose oxidase were formed followed by complete unfolding curve in the transition region. The reaction between glucose oxidase and DTAB is endothermic. Like so, it was identified that DTAB causes rapid denaturing effect on glucose oxidase and is stronger than any other denaturing agent used. Chelating agents Cu and Co were used to recognize the effects on enzyme activity in acetate and phosphate buffer. It was observed that all batches of reaction with acetate buffer were unstable as their activity was recorded to be at 58% and 42% respectively for ES1 and ES2. This may be anticipated to the inhibitive interaction between the active sites of the enzyme and acetate ion. Around 95% of activity was lost within 2 hours. In phosphate buffer, the enzyme activity was 86% and 79% for both the enzymes respectively, but the activity was lost completely after 10 hours. But when the chelating agents were included to the phosphate buffer, the activities were calculated as 94% and 87% for Co and enzyme activity was stable up to 24 hours while of Cu ions, the enzyme activity was reported to be 83% and 78% and was stable till 24 hours. It can be concluded by these results that in phosphate buffer, the enzyme activity of GOX when metal ion chelated hydro gels were used retained its activity for a longer time at room temperature due to the ineffectiveness of the interactions on enzyme activity. Both ES1 and ES2 showed high specificity to D-glucose when it was calculated at 0.4 M and 0.6M respectively. Their reaction rate was high at these concentrations as it reacts swiftly than other substrates. Specificity and affinity to remaining of the substrates was low when compared with D-glucose. This proves that D-glucose can be used as a biocatalyst for reactions of glucose oxidase in industrial applications. Activation energy at optimum temperature for ES1 and ES2 were calculated to be 23.95kJmol/L and 39.52kJmol/l, respectively the values were determined from Arrhenius plot. These activation energies are more than that of other studies resulting in the conclusion that the activation of the enzyme bears more time and more substrate concentration as compared to other GOX studies reported16. Changes in temperature and substrate concentrations affect the ionization of amino acid residues present on the active site involved in binding of the substrate to the enzyme and catalytic activity. Due to this ionization, distortion of the cleft of the active site could be caused by the residues indirectly affecting the activity of the enzyme. Vmax and Km were calculated from Lineweaver-Burk plots. ES1 under 5.5 and 6 pH at 45°C, Vmax of 1.2U and 0.83U, while Km 6.91mM and 5.1mM were calculated from the slope of plot respectively. For ES2 under 5.5 and 6 pH, at 45°C of optimum temperature recorded Vmax as 0.7U and 0.2U whereas Km was recorded as 5.72mM and 3.2mM. Statistical analysis showed that the results obtained were significant with an exception of trehalose as a substrate which was analyzed not to be significant.
In this paper, GOX from Pseudomonas species and Actinomyces species which were extracted from sustainable sources was purified and studied for their characterizations and activities. Stability studies were also conducted which indicated that these enzymes were stable up to moderate temperatures. There was excellent stability, substrate affinity and catalytic activity perceived in the two enzymes purified has shown that these enzymes can be used in industrial applications as well as in biosensors. The GODs extracted and purified from naturally isolated strains displayed optimum activity at lower temperature than GOD from Aspergillus tubingensis and a recombinant GOD from Penicillium amagasakiense16,17.The Km of the GOD from both the isolated strain was similar to the Km and Vmax of GOD from A. niger, and Penicillium species a recombinant one expressed in Pichia pastoris16,18,19. Inhibition of the enzyme activity by chemical agents such as chelating and denaturing agents along with substrates were similar to Aspergillus niger.
ACKNOWLEDGMENTS
We express our sincere gratitude to Dr. J K Srivastava, Director of AIB, Amity University, Lucknow campus for granting permission to perform research work in bioprocess lab.
CONFLICT OF INTEREST
The authors declares that there is no conflict of interest.
AUTHORS’ CONTRIBUTION
All authors listed have made a substantial, direct and intellectual contribution to the work, and approved it for publication.
FUNDING
None.
ETHICS STATEMENT
This article does not contain any studies with human participants or animals performed by any of the authors.
AVAILABILITY OF DATA
All datasets generated or analyzed during this study are included in the manuscript and the Supplementary Files.
- Sujeet Pratap, S., Raj, M. and Kumar, T. Isolation, screening, identification and optimization of growth conditions of glucose oxidase producing microbes from various sources. Research Journal of Biotechnology, 2019; 14(9): 1-17.
- Sari, N., Antepli, E., Nartop, D. and Yetim, N. Polystyrene Attached Pt (IV)–Azomethine, Synthesis and Immobilization of Glucose Oxidase Enzyme. International Journal of Molecular Sciences, 2012; 13(12): 11870-11880.
Crossref - Kelley, R. and Reddy, C. Purification and characterization of glucose oxidase from ligninolytic cultures of Phanerochaete chrysosporium. Journal of Bacteriology, 1986; 166(1): 269-274.
Crossref - Takeda, A., Hachimori, A., Mural, M., Sato, K. and Samejima, T. Effect of Sodium Dodecyl Sulfate on the Dissociation of Bovine Liver Catalase. The Journal of Biochemistry, 1975; 78(5): 911-924.
Crossref - Holland, J., Harper, J., Dolan, P., Manginell, M., Arango, D., Rawlings, J., Apblett, C. and Brozik, S. Rational Redesign of Glucose Oxidase for Improved Catalytic Function and Stability. PLoS ONE, 2012; 7(6): e37924.
Crossref - Belyad, F., Karkhanei, A. and Raheb, J. Expression, characterization and one step purification of heterologous glucose oxidase gene from Aspergillus niger ATCC 9029 in Pichia pastoris. EuPA Open Proteomics, 2018; 19: 1-5.
Crossref - Aygan, A., Arikan, B., Korkmaz, H., Dincer, S. and Colak, O. Highly thermostable and alkaline a-amylase from a halotolerant-alkaliphilic Bacillus sp. AB68. Brazilian Journal of Microbiology, 2008; 39(3): 547-553.
Crossref - Moosavi-Movahedi, A., Housaindokht, M. and Moghaddasi, J. Thermodynamic studies of the interaction of glucose oxidase with anionic and cationic surfactants. Thermochimica Acta, 1993; 219: 143-150.
Crossref - Moosavi-Movahedi, A., Rabbani, A., Godarzi, M. and Goliaei, B. Thermodynamic study of the interaction of sodium n-dodecyl sulphate with histone HI. Thermochimica Acta, 1989; 154(2): 205-212.
Crossref - Park, C. and Raines, R. Quantitative Analysis of the Effect of Salt Concentration on Enzymatic Catalysis. Journal of the American Chemical Society, 2001; 123(46): 11472-11479.
Crossref - Pekel, N., Salih, B. and G ven, O. Enhancement of stability of glucose oxidase by immobilization onto metal ion-chelated poly (N-vinyl imidazole) hydrogels. Journal of Biomaterials Science, Polymer Edition, 2005; 16(2): 253-266.
Crossref - Rando, D., Kohring, G. and Giffhorn, F. Production, purification and characterization of glucose oxidase from a newly isolated strain of Penicillium pinophilum. Applied Microbiology and Biotechnology, 1997; 48(1): 34-40.
Crossref - Combes, D., Ye, W., Zwick, A. and Monsan, P. Effect of Salts on Enzyme Stability. Annals of the New York Academy of Sciences, 1988; 542(1 Enzyme Engine): 7-10.
Crossref - Hassan, B., Jebor, M. and Ali, Z. Purification and Characterization of the Glucose Oxidase from Penicillium notatum. International Journal of Pharmaceutical Quality Assurance, 2018; 9(01).
Crossref - Gouda, M., Singh, S., Rao, A., Thakur, M. and Karanth, N. Thermal Inactivation of Glucose Oxidase. Journal of Biological Chemistry, 2003; 278(27): 24324-24333.
Crossref - Courjean, O. and Mano, N. Recombinant glucose oxidase from Penicillium amagasakiense for efficient bioelectrochemical applications in physiological conditions. Journal of Biotechnology, 2011; 151(1): 122-129.
Crossref - Kriaa, M., Hammami, I., Sahnoun, M., Azebou, M., Triki, M. and Kammoun, R. Purification, biochemical characterization and antifungal activity of a novel Aspergillus tubingensis glucose oxidase steady on broad range of pH and temperatures. Bioprocess and Biosystems Engineering, 2015; 38(11): 2155-2166.
Crossref - Otadi, M. and Mobayen, S. The survey of kinetic behavior of immobilized glucose oxidase on gum tragacanth carrier. World Applied Sciences Journal, 2019, 14(Special Issue of Food and Environment): 15-19.
- Kovacevic, G., Blazic, M., Draganic, B., Ostafe, R., Gavrovic-Jankulovic, M., Fischer, R. and Prodanovic, R. Cloning, Heterologous Expression, Purification and Characterization of M12 Mutant of Aspergillus niger Glucose Oxidase in Yeast Pichia pastoris KM71H. Molecular Biotechnology, 2013; 56(4): 305-311.
Crossref
© The Author(s) 2019. Open Access. This article is distributed under the terms of the Creative Commons Attribution 4.0 International License which permits unrestricted use, sharing, distribution, and reproduction in any medium, provided you give appropriate credit to the original author(s) and the source, provide a link to the Creative Commons license, and indicate if changes were made.