


ISSN: 0973-7510
E-ISSN: 2581-690X
A bacterium which produced novel extracellular fibrinolytic enzyme for digesting bovine blood clots was isolated from soil, and identified by 16s rRNA sequencing as Bacillus altitudinis, given strain name was S-CSR 0020 (accession number KT369312). Fibrin proved the best nitrogen source with an enzyme activity of 750 U/mL, followed by casein after incubation at 37 °C for 4 days. The cultural conditions were optimised using Response Surface Methodology (RSM) and Box-Behnken Design (BBD). Based on 3D surface plot and contour plots, the optimized temperature, pH and substrate concentrations were 47°C, 10.5 and 4 g/L respectively, resulted in increase in enzyme activity of 306.88 U/mL and specific activity of 780 U/mg which was 2-fold; compared to initial level of 400 U/mg after 2 days of incubation. The crude enzyme has got potent activity and digested human blood clot completely within 1hr.
Bacillus altitudinis S-CSR 0020, bovine blood clot, Box Behnken Design, fibrinolytic enzyme.
Fibrin plays a vital role in healing. Inappropriate clotting in blood vessel is a major factor for myocardial infarction and other cardiovascular diseases, resulted in 18 million of people dying every year as reported by World Health Organization. Fibrin, the major component involved in blood clot is formed from fibrinogen by proteolytic activity of thrombin. Meanwhile, plasmin hydrolyzed the clots to avoid thrombosis. But in an unbalanced situation, the fibrin clots are not hydrolyzed, and thrombosis occurs14. Twenty enzymes present in the body to assist in clotting of blood, while only the plasmin or any other plasmin like protease can break it down3. For the treatment of cardio-vascular diseases, various blood clot-dissolving agents such as urokinase, streptokinase, and tissue plasminogen activator (t-PA) have been utilized24. Despite widespread use, these fibrinolytic agents suffer from various side effects including bleeding complications, short half-life, expensiveness, risk of anaphylactic reactions and large therapeutic doses4, so there is a necessary for the search of new fibrinolytic agents from various sources.
Various proteases from microorganisms have been purified and characterized which are having capability to interfere with the blood clotting mechanism. Microbial fibrinolytic enzymes are classified in to three types: Serine protease, Metallo protease and mixture of both Serine and Metallo protease24. Fibrinolytic enzyme activity resembles on plasmin, which can degrade fibrin and inhibit clot formation32. Many researchers find that high yield of proteases are produced by bacteria24. The lack of accurate mathematical model equation to explain the whole process, high noise levels, interaction among variables, and complex biochemical reaction are the obstacles for bioprocess research, needs a good strategy6 to rectify the problems.
In the past, optimization of media components by one variable at a time, changing one independent variable is a tedious task and it is time consuming, expensive, less accurate to get optimum conditions especially because of interactions among the factors3, 30. The limitations of single variable optimization can be eliminated by optimizing the parameters collectively using experimental statistical method such as BBD and RSM15. The main objective of this work is production of fibrinolytic enzymes from bacterial soil isolates and to study the effect of various parameters such as temperature, pH and substrate concentration in the yield of fibrinolytic bacterial enzyme by using BBD.
Chemicals and reagents
All chemicals and reagents of analytical grade were used in this study; purchased from Sigma Aldrich. All experiments were conducted in triplicates and the mean values were considered.
Isolation and cultivation of bacterial isolates
Samples were collected by scraping off the soil from the various locations near slaughter house, Vazhayoor, Malappuram, Kerala, India. Isolation was performed by the soil dilution plate technique35 on minimal agar medium supplemented with bovine fibrin. Nutrient broth was used to maintain cultures, supplemented with glycerol (70%), and preserved at -20°C27. A stock suspension was prepared and adjusted to 7×10³ cell/ml10, 33.
Determination of proteolytic activity
The proteolytic activity of the organism was determined by a modified method11. Casein agar was prepared by using 1% casein. The organisms were spot inoculated on the medium and incubated at room temperature for 48 hr, the colonies were observed, proteolytic organisms showed a clear hallow around the colony, which indicated the casein hydrolysis by the organism.
Preparation of blood clot for nitrogen source
Buffalo blood was collected from the slaughter house and clot was formed by incubating at room temperature. Then the clots were shredded by using the surgical blade and were placed in 1L of distilled water in a beaker. The beaker was placed on the magnetic stirrer for further shredding and RBC removal. Water was replaced every half an hour, this procedure was repeated for 2-3 days, until the clot became grey in colour. This clot was grinded into fine powder by using mortar and pestle, sterilized using ethanol and dehydrated by acetone. This powder was used as a source of fibrin and stored at 4°C in refrigerator.
Screening of fibrinolytic organism
Fibrinolytic organisms were identified by using clot agar with mild modifications28. The caseinolytic organisms were spot inoculated on the clot agar medium which contained powdered fibrin. The plates were incubated at 37°C for 48hr. Fibrinolytic organisms showed clear zone on fibrin plate agar after adding congo red as an indicator and inoculated into minimal media with 0.5% buffalo fibrin as a substrate, and incubated at 37°C for 48hr until the substrate got disappeared, centrifuged and the supernatant was used to check enzyme activity against the substrate fibrin.
Identification of organism
Bacterial colonies were identified macroscopically and microscopically by using staining methods, and by 16s rRNA sequencing, sequence comparison with the databases were performed using BLAST through the NCBI server29.
Enzyme assay and protein content
Fibrinolytic enzyme activity was estimated5,8 using 0.5% bovine fibrin in 0.1 M carbonate buffer with an equal volume of extracted enzyme solution and incubated for 30 min at 37 °C. After 30 min, the reaction was stopped by adding 3 mL of 10% cold tri chloroacetic acid (TCA); centrifuged at 5,000 rpm for 10 min. To 0.5 mL supernatant, 2.5 mL of 0.5 M Na2CO3 was added, followed by 0.5mL of two-fold diluted Folin-Ciocalteaure agent; incubated for 30 min at 37°C and colour developed was read at 660 nm against a reagent blank. Tyrosine served as the reference standard. The optical density was measured in a UV-Vis (Shimadzu) spectrophotometer. For obtaining the quantitative estimation of the protein content of individual fraction different steps was done systematically17. One unit of fibrinolytic activity was defined as the amount of enzyme required to catalyze the release 1 µg of tyrosine per mL under the reaction conditions.
Submerged fermentation using different nitrogen sources
Various nitrogen sources such as casein, fibrin, peptone, yeast extract, skim milk powder were tested for fibrinolytic enzyme production. The enzyme activity and protein content were determined along with the specific activity.
Production and extraction of fibrinolytic enzyme
The organism was inoculated in production media containing minimal media with beef extract (0.3%), casein (1%), buffalo fibrin (0.5%) and peptone (0.5%); pH 7.0, incubated at 37°C in orbital shaker for 48hr at 200rpm. After 76hr of incubation, the contents of the flasks were filtered through Whatman No.1 filter paper, centrifuged at 5,000 rpm for 10 min and the supernatant was used as the crude enzyme5.
Statistical optimization of cultural conditions using RSM
A three variable Box-Behnken design is used to study the combined effect of the substrate concentration, broth pH and fermentation temperature on fibrinolytic enzyme production over three levels. The range and levels of the variables optimized are shown in the Table 1. The Box-Behnken design is suitable for the exploration of quadratic response surfaces and generates a second degree polynomial model, which in turn is used in optimizing a process using a small number of experimental runs. This design requires an experimental number of runs according to: N = k2 + k + Cp, where k is the factor number which is 3 in this case and Cp is the number of replications at the center point which is also 3 in this case.
Table (1):
Actual levels for the factors for three factors Box-Behnken design.
| Independent Variables | Symbols | Coded and actual levels | ||
|---|---|---|---|---|
| -1(low) | 0 | +1(high) | ||
| Temperature (OC ) | A | 10 | 37.5 | 65 |
| pH | B | 3 | 6.75 | 10.5 |
| Substrate Concentration (g/L) | C | 0.25 | 2.125 | 4 |
The design which is developed using the Design Expert 10.0.3.1 resulted in 17 experimental runs. The second degree polynomial is expressed as follows:
Y= b0 + b1A + b2B + b3C + b12AB + b13AC+ b23BC + b11A2 + b22B2 + b33C2 (equation 1), where Y is predicted response, A, B and C are independent variables, b0 is the offset term, b1, b2, b3 are linear effects, and b11, b22, and b33 are interaction terms. Regression analysis and analysis of variance (ANOVA) are used to fit the model according to the equation1. Adequacy of models is checked by model analysis and R2 analysis; F value is checked to find out the significance of all the fitted equation at 5% level of significance. To visualize relationship between response and experimental levels of each factor and to find out optimum conditions, the fitted equations are expressed as contour plots, which is explained by statistical software, Design Expert 10.0.3.1.
Application studies
Blood clot degradation method was used to determine in-vitro fibrinolytic activity19, 7. Blood was collected from male human volunteer in capillary tube and blood clot was formed by incubating for 1hr at room temperature. After 1hr, artificial blood clot in capillary tube was rinsed thoroughly and dipped in 3mL of carbonate buffer (pH 9.0) containing enzyme solution for clot dissolution, incubated at room temperature and 37°C, normal saline was kept as control.
Isolation and screening of fibrinolytic organisms
Twenty soil isolates with caseinolytic activity were collected and designated as F1 to F20. Among 20 isolates, 4 isolates exhibited fibrinolytic activity (Fig. 1). Isolate named as F1 with high fibrinolytic activity of 550 U/mL, with a protein content of 0.8 mg and specific activity of 688 U/mg after 4 days of incubation was selected for the further study. Isolates named as F4, F13 and F18 showed less specific activity compared to F1 (Table 2)
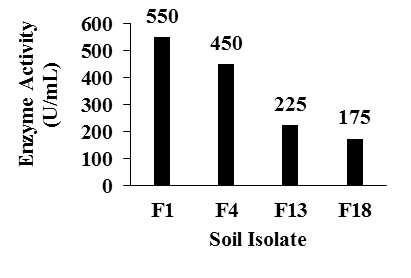 Fig. 1. Enzyme activity of different soil isolates
Table (2):
Enzyme activity and specific activity of different soil isolates Of different soil isolates.
Soil isolate |
Enzyme activity(U/mL) |
Specific activity(U/mg) |
|---|---|---|
F1 |
550 |
688 |
F4 |
450 |
450 |
F13 |
225 |
205 |
F18 |
175 |
146 |
On fibrin plate agar after adding congo red, F1 showed clear zone followed by F4 (Fig. 2). Isolate F1 showed clear zone around casein agar (Fig. 3)
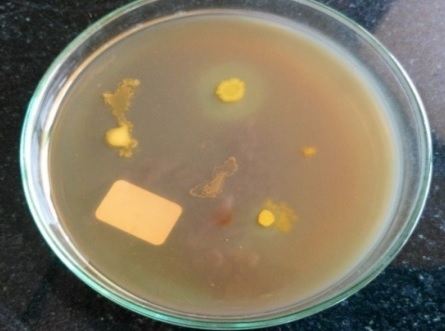 Fig. 2. Fibrinolytic activity of different soil isolates on fibrin plate agar
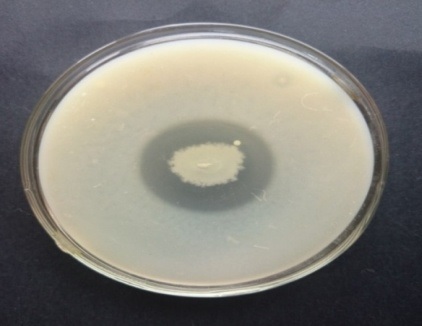 Fig. 3. Caseinolytic activity of F1 on casein agar
Identification of the organism
F1 showed macroscopic appearance of flat, irregular, pale in color, rough (6 to 7 mm) colonies and with a microscopic appearance of large Gram-positive bacilli. From the16S rRNA gene, partial sequence, it was identified as Bacillus altitudinis and designated as Bacillus altitudinis strain S-CSR 0020, submitted to GenBank (Accession No. KT369312). The Phylogenetic tree constructed from the sequenced data by the neighbor joining method showed the detailed evolutionary relationship between the strain S-CSR0020 to Bacillus altitudinis29. The isolate showed 99% similarity with Bacillus altitudinis.
Submerged fermentation using different nitrogen sources
Among the nitrogen sources fibrin showed maximum enzyme activity of 750 U/mL with a protein content of 0.69 mg and specific activity of 1087 U/mg of protein followed by casein and peptone by using production medium (Fig. 4 and Table 3).
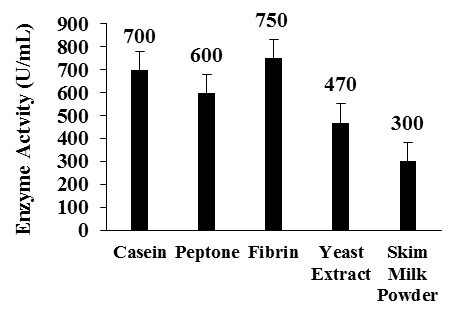 Fig. 4 Effect of different nitrogen sources on enzyme production
Table (3):
Enzyme activity and specific activity obtained with different nitrogen source.
| Nitrogen source | Enzyme activity (U/mL) | Specific activity (U/mg) | ||
|---|---|---|---|---|
| Casein | 700 | 1000 | ||
| Peptone | 600 | 900 | ||
| Fibrin | 750 | 1087 | ||
| Yeast extract | 470 | 600 | ||
| Skim milk powder | 300 | 500 | ||
The best nitrogen sources for the fibrinolytic enzyme production by Bacillus altitudinis S-CSR0020 were fibrin and casein.
Statistical optimization of cultural conditions using RSM
Statistical Analysis
Three most important factors such as temperature, pH and substrate concentration are selected for optimization studies. The results obtained from 17 experimental runs carried out according to the Box- Behnken design are summarized in the Table 3. A regression analysis is carried out to fit the mathematical model to the experimental data in order to determine the optimum fermentation conditions that results in the maximum enzyme production. By applying multiple regression analysis on the experimental data, the following second degree polynomial is found to represent the relationship between enzyme production, substrate concentration, pH and fermentation temperature adequately. The predicted model can be described by the following second-order polynomial equation 1.
Final Equation in Terms of Coded Factors
R1 (U/mL) = + 230 + 45.13 * A + 64.25 * B + 48.63 * C + 25.75 * AB + 28.50 * AC + 20.25 * BC – 102 * A2 – 27.25 * B2 -29 *C2 (equation 1)
Temperature, pH and substrate concentration where represented by A, B and C respectively. The predicted enzyme activity using equation (1) were given in Table 4 with experimental data.
Table (4):
Three factor Box – Behnken design with experimental as well as predicted responses of dependent variable.
| Runs | Actual Values | Enzyme activity (U/ml) | ||||
|---|---|---|---|---|---|---|
| A | B | C | OBSERVED | PREDICTED | ||
| 1 | 37.5 | 6.75 | 2.125 | 230.00 | 230.00 | |
| 2 | 37.5 | 6.75 | 2.125 | 230.00 | 230.00 | |
| 3 | 10 | 10.5 | 2.125 | 95.00 | 94.13 | |
| 4 | 65 | 10.5 | 2.125 | 239.00 | 235.87 | |
| 5 | 37.5 | 6.75 | 2.125 | 230.00 | 230.00 | |
| 6 | 37.5 | 6.75 | 2.125 | 230.00 | 230.00 | |
| 7 | 37.5 | 10.5 | 4 | 300.00 | 306.88 | |
| 8 | 37.5 | 10.5 | 0.25 | 172.00 | 169.13 | |
| 9 | 65 | 6.75 | 4 | 225.00 | 221.25 | |
| 10 | 10 | 6.75 | 4 | 80.00 | 74.00 | |
| 11 | 37.5 | 3 | 0.25 | 88.00 | 81.12 | |
| 12 | 10 | 3 | 2.125 | 14.00 | 17.12 | |
| 13 | 10 | 6.75 | 0.25 | 30.00 | 33.75 | |
| 14 | 65 | 3 | 2.125 | 55.00 | 55.87 | |
| 15 | 65 | 6.75 | 0.25 | 61.00 | 67.00 | |
| 16 | 37.5 | 6.75 | 37.5 | 230.00 | 230.00 | |
| 17 | 37.5 | 3 | 37.5 | 135.00 | 137.88 | |
The significance of the fit of the second-order polynomial for enzyme activity is assessed by carrying out analysis of variance (ANOVA) with results are shown in the Table 5.
Table (5):
Statistical information for ANOVA.
Source |
Response Value |
|---|---|
R – squared |
0.9982 |
Adjusted R – squared |
0.9959 |
Pred- R square |
0.9714 |
Standard deviation |
5.76 |
C.V % |
3.70 |
Adequate precision |
65.587 |
The coefficient of determination (R2) of the model is 0.9982 (Table 6), which indicated that the model adequately represented the real relationship between the variables under consideration. The 5ØEÜ2 value closer to 1.0 shows a stronger model with better predictability. R2 value of 0.9982 means that 99.82% of the variability was explained by the model and only 0.18 was as a result of chance. The “Pred R-Squared” of 0.9714 is in a reasonable agreement with the “Adj R-Squared” of 0.9959; i.e. the difference is less than 0.2. “Adeq Precision” measures the signal to noise ratio. A ratio greater than 4 is desirable. Ratio of 65.587 indicates an adequate signal. This model can be used to navigate the design space. The coefficient of variation (C.V.) obtained was 3.7.The Coefficient of Variation (C.V.) indicates the degree of precision with which the treatments were carried out. Adequate precision value 65.587 measure the signal to noise ratio and a ratio greater than 4 is desirable.
Table (6):
Analysis of variance (ANOVA) for quadratic model of fibrinolytic enzyme production.
Sources |
Sum of squares |
Degrees of freedom |
Mean square |
F value |
P – value [Prob>F] |
|---|---|---|---|---|---|
Model |
1.296E+005 |
9 |
14401.55 |
434.06 |
|
A-Temperature |
16290.13 |
1 |
16290.13 |
490.98 |
|
B-pH |
33024.50 |
1 |
33024.50 |
995.36 |
|
C-Substrate Conc |
18915.13 |
1 |
18915.13 |
570.10 |
|
AB |
2652.25 |
1 |
2652.25 |
79.94 |
|
AC |
3249.00 |
1 |
3249.00 |
97.92 |
|
BC |
1640.25 |
1 |
1640.25 |
49.44 |
0.0002 |
A2 |
43806.32 |
1 |
43806.32 |
1320.32 |
|
B2 |
3126.58 |
1 |
3126.58 |
94.23 |
|
C2 |
3541.05 |
1 |
3541.05 |
106.73 |
|
Residual |
232.25 |
7 |
33.18 |
||
Lack of Fit |
232.25 |
3 |
77.42 |
||
Pure Error |
0.000 |
4 |
0.000 |
||
Cor Total |
1.298E+005 |
16 |
The Model F-value of 434.06 implies the model is significant. There is only a 0.01% chance that the F-value large could occur due to noise (table 7). Values of “Prob> F” less than 0.05 indicates model terms are significant. In this case A, B, C, AB, AC, BC, A2, B2, C2 are significant model terms, indicating that there is an interaction between temperature and pH, temperature and substrate concentration and pH and substrate concentration.
Optimization of cultural conditions
An increase in temperature and broth pH results in an increase of enzyme activity from about 98.89U/mL to a maximum value of 279.28 U/mL at a temperature of 47.18 °C and broth pH of 10.5 (Fig. 5).
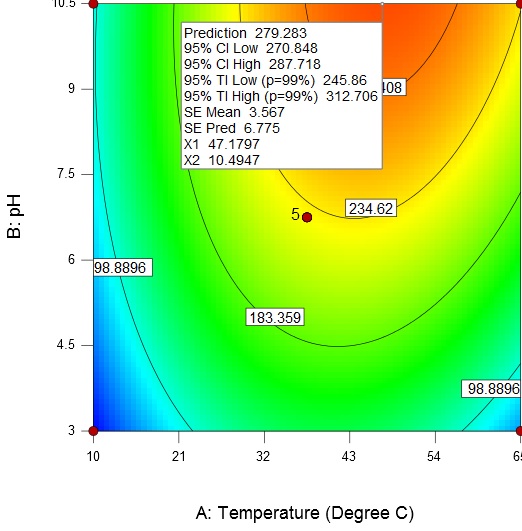
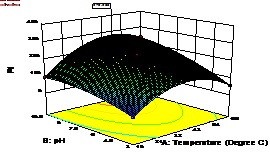 Fig. 5. Contour plot and 3D surface plot showing the effect of temperature and pH on enzyme activity
An increase in the substrate concentration and broth pH results in increase of enzyme activity from about 98.89 U/mL to a maximum value of 306.88 U/mL at a substrate concentration of 4 g/L and broth pH of 10.5 (Fig. 6).
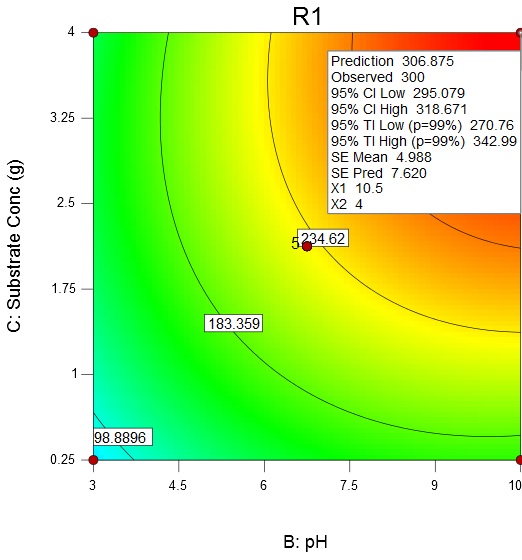
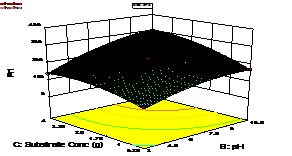 Fig. 6. Contour plot and 3D surface plot showing the effects of substrate concentration and pH on enzyme activity
An increase in the substrate concentration and temperature results in increase of enzyme activity from about 98.89 U/mL to a maximum value of 262.9 U/mL at a substrate concentration of 4 g/L and temperature of 47.38 °C (Fig. 7)
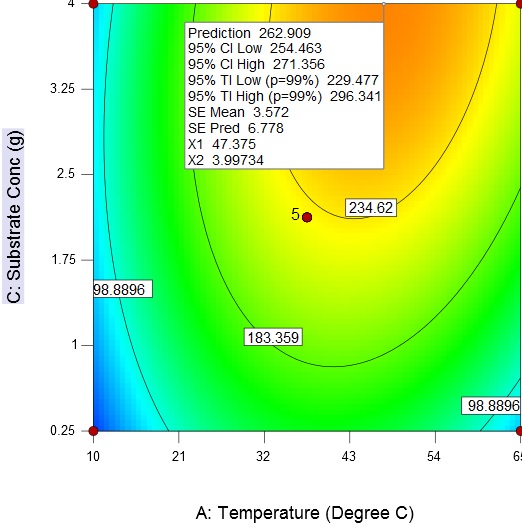
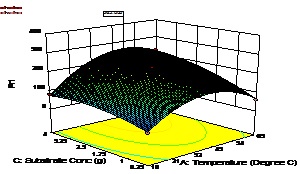 Fig. 7. Contour plot and 3D surface plot showing the effects of fermentation temperature substrate concentration on enzyme activity
The response surface methodology is an efficient technique for the rapid screening of the significant influencing parameters and development of a polynomial model to optimize fermentation conditions. The final optimized fermentation conditions obtain with RSM are 47 °C, 4 g/L (substrate concentration), and 10.5 (broth pH).
Application studies
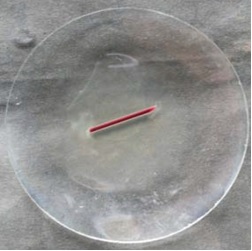
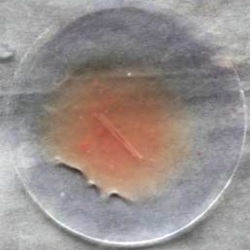
It shows complete lysis of the blood clot by the crude enzyme happens within 1hr and from this, it is proved as a good fibrinolytic agent, and activity can be further improved by purification (Fig. 8).
 |
 |
Control (blood clot with normal saline) |
Test (blood clot with enzyme solution) |
Fig. 8. Watch glass showing blood clot lysis
Fibrinolytic enzyme producing bacilli isolated from soil near slaughter house and the strain showed a clear zone on casein agar and a clear zone on fibrin plate agar after adding congo red indicator. All the fibrinolytic organisms were caseinolytic but not vice versa, so casein could be used for preliminary screening. From the biochemical tests and 16s rRNA sequencing it was designated as Bacillus altitudinis S-CSR0020 (accession number KT369312). Bacillus altitudinis was first isolated from cryogenic tubes used to collect air samples at altitudes of 41 Km31. The isolate obtained in this study was a novel organism since there were no previous reports of the fibrinolytic potential of Bacillus altitudinis. Nattokinase could be used as thrombolytic agent, but its high cost and could be used only by intravenous instillation leads to some other alternative method for the large scale production. For fibrinolytic enzyme production, fibrin was a necessary substrate, and it was obtained from blood collected from the slaughter house was an inexpensive substrate for enzyme production. For screening, if the choice for fibrinolytic enzyme production was substrates other than fibrin, then there was a chance of contamination and production of other enzymes. More over fibrin was an insoluble substrate and its utilization by the organism could be detected easily. Enzyme activity preferably could be checked by using fibrin as substrate, because if we used any other assay substrate, there was a chance of misinterpretation of the result. Of the nitrogen sources as growth substrate optimized, fibrin gave maximum enzyme activity of 750 U/mL with a specific activity of 1087 U/mg after incubation for 4 days at 37 °C which was followed by casein. Experiments revealed that incubation time had a significant effect on enzyme production by showing a decrease in enzyme activity of 200 U/mL with a protein content of 0.5 mg and specific activity of 400 U/mg after 2 days of incubation. Marine Pseudomonas strain 1452 produced extracellular protease by using casein as carbon as well as nitrogen source20. High concentration of nitrogen sources in media was effective in increasing the fibrinolytic enzyme production by Bacillus cereus GD5534. To date, isolation, productions, characterization of fibrinolytic enzymes were done and there were fewer reports regarding the optimization of media composition especially the major factors like temperature, pH, and substrate concentration. The fermentation temperature was important in that when cells were grown under non ideal temperature, they exhibited signs of adverse growth and metabolic production9. RSM was a well-known statistical method that employed the cost-effective experimental design and had advantages such as predicted response and evaluation. Statistical experimental design was not very much used in biological sciences rather it was used in chemical, engineering, food science and medical fields7. This was designed by using statistical methods to yield the most information in the minimum number of experiments. It had been successfully applied to the optimization of medium composition7. Wang et al used BBD to optimize medium composition for nattokinase production13. BBD also used for the optimization of citric acid production by Aspergillus niger1 and dilute acid hydrolysis of cornstover2. Fibrinolytic enzyme production from Bacillus sp. strain AS-S20-1, B. natto NLSSE, and B. cereus IND1, were done by the statistical methods such as Plackett–Burman23, two-level fractional factorial design16, and two-level full factorial design25 respectively. RSM could be used to optimize physical environment in terms of temperature and pH and alpha cyclodetrin glucanotranaferase production increased 163.9%12. Cost reduction was another factor of physical environment optimization. Regression analysis of the experimental data showed that coefficient of three factors such as temperature (45.13), pH (64.25) and substrate concentration (48.63) were positive (equation 1). Among the three factors pH had the highest impact on fibrinolytic enzyme followed by substrate concentration and temperature. Comparison of experimental and predicted values of the regression model showed the agreement was satisfactory. A low value of C.V. (3.7) suggested a high reliability of the experiment21, 22. All the experiments were done in triplicate and the final optimized fermentation conditions obtained by RSM were 47 °C, 4 g/L (substrate concentration), and 10.5 (broth pH), with a predicted maximum enzyme activity of 306.88 U/mL after an incubation of 2 days. Further increase of temperature, pH, and substrate concentration had a reverse effect on enzyme production. The results obtained from three replications showed that the average of experimental value, 312 U/mL is close to mathematically predicted value, suggested that the model was valid. The protein content was noticed as 0.4 U/mg with a specific activity of 780 U/mg after 2-day incubation suggested that optimization of cultural conditions by statistical approach gave an overall 2 fold increase in enzyme production. Nattokinase production dependent on magnesium sulfate, dipotassium hydrogen phosphate, and yeast extract by using BBD13. From the results, it was found that the organism is temperature and pH stable and it could produce enzyme at extreme conditions. Further factors like carbon source, minerals, and incubation period had to be optimized and purification steps had to be done to increase the enzyme activity further. The novel fibrinolytic enzyme of Bacillus altitudinis S-CSR0020 showed high blood clot lytic activity, a clot lysed completely within 1 hr by the crude enzyme. Purified enzyme from an Actinomycete showed lysis of clot weighing 0.41 g within two hour28. In -vitro blood clot lysis studies were performed with other organisms after purification to an extent6, 18, 16, 26, 36. By purification, this enzyme could be used as a promising fibrinolytic agent to treat myocardial infarction and other cardiovascular diseases in future.
ACKNOWLEDGMENTS
The authors are sincerely grateful to the Management, Karpagam University (Karpagam Academy of Higher Education), Coimbatore – 641 021, Tamil Nadu, India, for the constant encouragement and support.
- Amenaghawon NA, Nwaru KI, Aisien FA, Ogbeide SA, Okieimen CO. Application of Box-Behnken design for the optimization of citric acid production from corn starch using Aspergillus niger. Br Biotechnol J3: 2013; 236-245
- Amenaghawon NA, Ighodalo H, Agbonghae E, Ogbeide SE, Okieimen CO. Modelling and optimization of dilute acid hydrolysis of corn stover using box-behnken design. J Eng Sci Technol, 2014; 9:443 – 454
- Ali UF, Ibrahim ZM. Production and some properties of fibrinolytic enzyme from Rhizomucormiehei (Cooney & Emerson) Schipper. J ApplSci Res, 2008 ; 4: 892-899
- Chitte RRD, Eshmukh SV, Kanekar PP. Production, purification, and biochemical characterization of a fibrinolytic enzyme from thermophilic Streptomyces sp. MCMB-379. Appl Biochem Biotechnol. 2011 ; 165:1406-13. Pub Med PMID: 21909629.
- Debajit B, Yadav RNS, Ankush S, Lubana S, Anand KC. Production, purification and characterization of nattokinase from Bacillus subtilis from tea garden soil samples of Dibrugarh, Assam. Asian J Pharm Clin Res., 2012; 5:124-125
- Deepak V, Kalishwaralal K, Ramkumarpandian S, Babu SV, Senthilkumar SR, Sangiliyandi G. Optimization of media composition for nattokinase production by Bacillus subtilis using response surface methodology. BioresourTechnol, 2008; 99: 8170–8174.doi:10.1016/j.biortech.2008.03.018
- Dean A, Voss D. Response surface methodology. Design and analysis of experiments., 1999; 483-529.
- Dubey R, Kumar J, Agrawala D, Char T, Pusp P. Isolation, production, purification, assay and characterization of fibrinolytic enzymes (Nattokinase, Streptokinase and Urokinase) from bacterial sources. Afr J Biotechnol, 2011; 10: 1408-1420.doi: 10.5897/AJB10.1268
- Ellaiah P, Srinivasulu B, Adinarayana K. Optimisation studies on neomycin production by a mutant strain of Streptomyces marinensis in solid state fermentation. Proc Biochem, 2004; 39: 529–534.
- Gitishree D, Prasad MP. Isolation, purification and mass production of protease enzyme from Bacillus subtilis. Int Res J Microbiol, 2010; 1: 26-31
- Gholamhossein E, Hossein S, Zahra Khosravi B, Soleiman A. Identification of a bacterium isolated from soil of Ahvaz contaminated by oil and determination of Its protease stability in organic solvents. Jundishapur J Microbiol., 2013; 6: 106-111.
- Ibrahim HM, Yusoff WMW, Hamid AA, Illias RM, Hassan O, Omar O. Optimisation of medium for the production of alpha cyclodetrtringlucano tranaferase using ventral composite design (CCD). Proc Biochem, 2005; 40:753-758
- Jau-Kai W, Hua-Hsien C, Ching-Shieh H. Optimization of the medium components by statistical experimental methods to enhance nattokinase activity. Fooyin J Health Sci, 2009; 1:21-27
- Jaya RS, Poonam M, Seung SC, Jin CY. A novel fibrinolytic protease from Streptomycs sp. CS684.ProcBiochem, 2010; 45:88-93. doi:10.1016/j.procbio.2009.08.010
- Khuri AI, Cornell JA. Response Surfaces Design and Analysis. Dekker: New York, 1987.
- Liu J, Xing J, Chang T, Ma Z, Liu H. Optimization of nutritional conditions for nattokinase production by Bacillus natto NLSSE using statistical experimental methods. Proc Biochem, 2005; 40:2757–2762.doi: 10.1016/j.procbio.2004.12.025
- Lowry OH, Rasebrough NJ, Farr AR, Randall RJ. Protein measurement with the Folin phenol reagent. J Biol Chem, 1951; 193:265–275
- Mahajan PM, Nayak S, Lele SS. Fibrinolytic enzyme from newly isolated marine bacterium Bacillus subtilis ICTF-1 media optimization, purification and characterization. J Biosci Bioeng, 2012; 113, 307–314.doi: 10.1016/j.jbiosc.2011.10.023
- Mahajan PM, Gokhale SV, Lele SS. Production of nattokinase using Bacillus natto NRRL 3666: media optimization, scale up, and kinetic modeling. Food Sci Biotechnol, 2010; 19:1593-1603
- Makino K, Koshikawa T, Nishihara T ,Ichikawa T, Kondo M. Studies on protease from marine bacteria. Isolation of marine Pseudomonas sp.145-2 and purification of protease. Microbio, 1981; 31:103-12
- Mason RL, Gunst RF, Hess JL. Statistical design and analysis of experiments, John Wiley & Sons, Inc., New York 1989.
- Montgomery DC. Design and analysis of experiments (6th Ed.). John Wiley & Sons, Inc., New York 2005.
- Mukherjee AK, Rai SK. A statistical approach for the enhanced production of alkaline protease showing fibrinolytic activity from a newly isolated Gram-negative Bacillus sp. Strain AS-S20-1. New Biotechnol, 2011; 28: 182– 189. doi:10.1016/j.nbt.2010.11.003
- Peng Y, Yang X, Zhang Y. Microbial Fibrinolytic enzymes: an overview of source, production, properties and thrombolytic activity in vivo. Appl Micro Biotechnol, 2005; 69:126-132
- Ponnuswamy V, Samuel GPV. Medium optimization for the production of fibrinolytic enzyme by Paenibacillussp. IND8 using Response Surface Methodology. Scientific World J, 2014 : doi.org/10.1155/2014/276942
- Ponnuswamy V, Arumugaperumal A, Samuel GPV, Mariadhas VA, Naif AD. Cowdung is a novel feed stock for fibrinolytic production from newly isolated bacillus Paenibacillus sp. IND 7 and its application in vitroclot lysis. Front Microbiol, 2016; 7:361. doi: 10.3389/fmicb.2016.00361
- Richard RB, Murray PD. Guide to protein purification. Academic Press is an Imprint of Elsevier, 2009 ; 463(2): 14-5
- Sasirekha C, Ramya S, Balagurunathan R. Fibrinolytic enzymes from Actinomycetes. J Pharm Res, 2012 ; 5:5457-5463
- Altschul SF, Madden TL, Sch¨affer AA. Gapped BLAST and PSI-BLAST: a new generation of protein database search programs. Nucl Acids Res, 1997; 25:3389–3402
- Siala R, Frikha F, Mhamdi S. Optimization of acid protease production by Aspergillusnigerl1 on shrimp peptone using statistical experimental design. Scientific World J, 2012 : doi:10.1100/2012/564932
- Shivaji PS, Chadurvedi K, Suresh G, Reddy SN, et al Bacillus aerius sp. nov., Bacillus aerophilus sp.nov. Bacillus stratopericus sp.nov. and Bacillus altitudinis sp. nov isolated from cryogenic tubes used for collecting air samples from high altitudes. Int J Syst Evol Microbiol, 2006; 56:1465-1473
- Sumi H, Hamada H, Tsushima H, Mihara H, Muraki H. A novel fibrinolytic enzyme (nattokinase) in the vegetable cheese natto; a typical and popular soybean food in the Japanese diet. Experientia, 1987 ; 43: 1110–1111
- Venkata Naga Raju E, Goli. Divakar. Non recombinant mutagenesis of Bacillus cereus for fibrinolytic protease production. World J Pharm Pharm Sci, 2013 ; 2:6189-6201.
- Venkata NRE, Divakar G. Effect of physiochemical parameters on fibrinolytic protease production by solid state fermentation. World J Pharm Pharm Sci, 2014 ; 3:1937-1954
- Waksman SA. The Actinomycetes, classification, identification and description of genera and species. Baltimore: The Williams and Wilkins Company, 1961; 2: 61-292
- Yuan J, Yang J, Zhuang Z, Yang Y, Lin L, Wang S. Thrombolytic effects of douche fibrinolytic enzyme from Bacillus subtilisLD-8547 in vitro and in vivo. BMC Biotechnol., 2012; 12:36. doi: 10.1186/1472-6750-12-36.
© The Author(s) 2017. Open Access. This article is distributed under the terms of the Creative Commons Attribution 4.0 International License which permits unrestricted use, sharing, distribution, and reproduction in any medium, provided you give appropriate credit to the original author(s) and the source, provide a link to the Creative Commons license, and indicate if changes were made.