

ISSN: 0973-7510
E-ISSN: 2581-690X
The macrofungi thrive in different four areas namely Vansda, Waghai, Kaprada, Aamolia region. Maximum Microbial diversity was observed in sample collected from waghai location includes, Taxa_S-31, Individual-31, Dominance_D-0.032 , Simpson_1-D-0.96, Shannon_H-3.434 , Evenness- 1, Brillouin-2.519, Menhinick-5.568, Margalef-8.736, Equitability J-1, Fisher Alpha-0, Berger-Parker-0.322,Chao-496. The decrease numbers of specimens consistently found with the location Waghai, Whittaker- 0.16129, Harrison- 0.0046083, Cody- 4, Wilson-shmida- 4.6452, Mourelle- 0.13272 followed by Kaparada and Vansda region.
Diversity indices, Alpha and Beta Diversity, Macrofungi.
The term alpha and beta diversity was introduced by R. H. Whittaker. The idea was that the total species diversity in a landscape (ã) is determined by two different things, the mean species diversity at the habitat level (á) and the differentiation among habitats (â). Fungi of various taxonomic groups producing conspicuous sporocarps are collectively known as macrofungi which include gilled fungi, jelly fungi, coral fungi, stinkhorns, bracket fungi, puffballs, and bird’s nest fungi (Bates,2006). The issue of fungal diversity, its extent and conservation, has attracted more attention in the last 10 to 15 years than in any period of history (Hawksworth, 2004). Mushrooms appear to be collected and consumed during almost the entire year, but most fungi are collected during the rainy seasons, suggesting the importance of rainfall patterns in fungal phenology (Dijk et al., 2003). The components most often studied are: (i) alpha (local) diversity; (ii) gamma (regional) diversity, which can be considered as an equivalent to alpha diversity on a larger scale, but reûects the allopatric distribu- tion of related taxa, and; (iii) beta diversity that measures turnover of species between communities, but for which there is no universally accepted measure (Whittaker et al., 2001; Koleff et al., 2003).
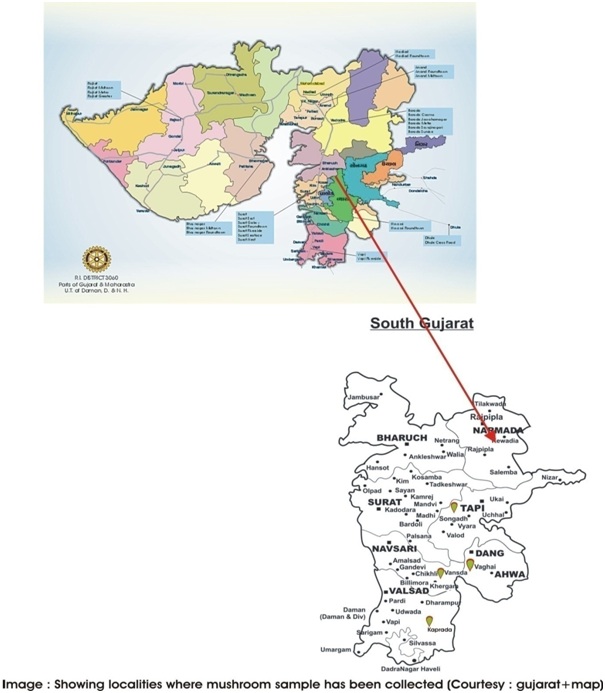
Study Area
The main sampling sites in this study were Vansda, Waghai, Kaprada, Aamolia.
Table (1):
Sampling site.
Sr. No |
Localities |
Latitude, Longitude |
|---|---|---|
1. |
Vansda |
20.45° N, 73.22° E |
2. |
Waghai |
20.46° N, 73.29° E |
3. |
Kaparada |
20.61° N, 72.92° E |
4. |
Aamolia |
21.12° N, 73.40° E |
Collection
In order to initiate mushroom study, it is necessary to collect healthy specimen in sufficient amount and collection should be collected in all developmental stage. Each species should be hold separately in plastic perforated bags. Mushroom fruit body were carefully detached from host or removed from ground without damaging its entire part. Note papers should be carried out at collection site to make on the spot field notes. A brief note such as growing habit, habitat, host, locality, collection type and number, date of collection should be recorded each time on the field note which is further tagged with collection.
Collection kit
There are some equipment used for collection includes, Basket- A broad basket with broad base is necessary for transportation of collected mushrooms to the laboratory or work place in proper condition. Plastic bags- Plastic bags with perforated holes used for putting collected mushrooms. Knife- It is required for digging up mushrooms and detaching them from their host and to remove debris attached with mushrooms. Forceps were used for the collection of very small sporocarps. Note papers are required for taking field notes. Other accessories includes hand lens, hand gloves, photographic equipments.
Microbial Diversity Indices calculation
Microbial diversity index was calculated by Past 3 software (Øyvind Hammer, 2001).
The present experiment include survey for mushroom diversity in four location Vansda, Waghai, Kaprada, Aamolia region. Their distribution was fluctuated during the survey period. 25 samples from Vansda region, 31 samples from waghai region, 20 samples from kaparada region and 16 samples from Aamolia.
Microbial diversity Indices had been prepared with Past3 software (Table-2 & 3). Maximum Microbial diversity was observed in sample collected from waghai location includes, Taxa_S-31, Individual-31, Dominance_D-0.032 , Simpson_1-D-0.96, Shannon_H-3.434 , Evenness- 1, Brillouin-2.519, Menhinick-5.568, Margalef-8.736, Equitability J-1, Fisher Alpha-0, Berger-Parker-0.322,Chao-496. Minimum Diversity was observed in sample collected from Aamolia location which includes,Taxa_S-16, Individual-16,Dominance_D-0.0625, Simpson_1-D-0.9375, Shannon_H-2.773, Evenness-1, Brillouin-1.917, Menhinick- 4, Margalef- 5.41, Equitability-1, Fisher Alpha-0, Berger-Parker-0.0625, Chao-136.
Table (2):
Alpha diversity indices.
Vansada |
Waghai |
Kaparada |
Aamolia |
|
|---|---|---|---|---|
Taxa_S |
23 |
31 |
21 |
16 |
Individuals |
23 |
31 |
21 |
16 |
Dominance_D |
0.04348 |
0.03226 |
0.04762 |
0.0625 |
Simpson_1-D |
0.9565 |
0.9677 |
0.9524 |
0.9375 |
Shannon_H |
3.135 |
3.434 |
3.045 |
2.773 |
Evenness_e^H/S |
1 |
1 |
1 |
1 |
Brillouin |
2.244 |
2.519 |
2.161 |
1.917 |
Menhinick |
4.796 |
5.568 |
4.583 |
4 |
Margalef |
7.016 |
8.736 |
6.569 |
5.41 |
Equitability_J |
1 |
1 |
1 |
1 |
Fisher_alpha |
0 |
0 |
0 |
0 |
Berger-Parker |
0.04348 |
0.03226 |
0.04762 |
0.0625 |
Chao-1 |
276 |
496 |
231 |
136 |
Table (3):
Global beta diversities.
Vansada |
Waghai |
Kaparada |
Aamolia |
|
|---|---|---|---|---|
Whittaker |
0.56522 |
0.16129 |
0.71429 |
1.25 |
Harrison |
0.016149 |
0.0046083 |
0.020408 |
0.035714 |
Cody |
11 |
4 |
9.5 |
9.5 |
Routledge |
-2.949E-17 |
-2.4937E-18 |
8.0773E-17 |
-1.1167E-17 |
Wilson-Shmida |
17.217 |
4.6452 |
16.286 |
21.375 |
Mourelle |
0.49193 |
0.13272 |
0.46531 |
0.61071 |
Harrison 2 |
0 |
0 |
0 |
0 |
Williams |
0 |
0 |
0 |
0 |
Using (dis) similarity or related coefficients as measures of beta diversity is a common practice (Johannsson & Minns, 1987; Philippi et al., 1998; Anderson et al., 2006; Ferrier et al., 2007; Ricotta & Marignani, 2007). Beta diversity decreases with increase in sample number. The maximum decrease numbers of specimens consistently found with the location Waghai, Whittaker- 0.16129, Harrison- 0.0046083, Cody- 4, Wilson-shmida- 4.6452, Mourelle- 0.13272. Followed by Kaparada and Vansda region. The increase numbers is with Aamolia region. As several authors have previously pointed out for different datasets and measures (Fisher, 1999; Plotkin & Muller-Landau, 2002; Chao et al., 2005) theoretical or empirical, beta diversity typically decreases with increasing sampling effort. The decrease in beta diversity with an increasing number of sampled individuals is usually constant and diversity values often do not asymptote. Pedro et al., (2009) has performed testing the beta diversity indices.Krishnappa et al., (2014) had also worked on Diversity index of Simphon and Shannon of Chikmagalur district for five years study 2007-2011. Simpson diversity index value was highest during 2007 (D= 0.031) showing maximum diversity followed by 2008-09, 2010 (D= 0.032) and 2011 (D= 0.033). Shannon diversity index of Chikmagalur district was found to be 4.35, 4.18, 4.32, 4.14, 4.01 during 2007, 2008, 2009, 2010 and 2011 respectively. Diversity reached its peak in the year 2007 (H’= 4.35). The Simpson diversity index was calculated and diversity was found to be more during 2007 (D= 0.015). Pushpa et al., (2012) had surveyed eight different locations of Banglore from that, Simpson diversity index (1-D) of JnanaBharathi (0.92), Raman Research Institute campus (0.95), Savandurga forest (0.92) was same as our results. The Simpson and Shannon’s diversity index was found to be 0.9210 and 0.1513. The evenness and species richness was found to be 0.9244 and 1.3379 respectively.The result for Mergalef Index was in favour with the Type II: Cryptomeria fortunei forest (7.8695), Type V: mixed bamboo- broadleaf forest (5.4866), studied by Shujiang et al., (2012). Simpson and Shannon diversity index of Idenau site, Ekonalelu site (0.9042), (0.9217) and (2.7477), (2.7950) respectively, found by Egbe et al., (2013). Sandhya et al., (2015) also calculated Shannon diversity index, Simpson Index, Evenness and the Species richness (Menhinick Index) of Chuhiya forest, Rewa Local Area, Sohagi forest, Teonthar forest, Semariya forest, which includes forest area as well as grassland of the mushroom. Shannon’s diversity and Simpson diversity index was found to be 0.9901 and 0.8903 respectively. Species richness and species evenness of this region was found to be 1.06 and 0.9175 respectively.
The presence or absence of fungal species is a useful indicator to assess the damage or the maturity of an ecosystem. Data on their diversity in different vegetation types is important for planning and managing ecosystem biodiversity. Diversity indices compares Dominance of single species under different environmental condition or in same Ecosystem, It can also measure relative abundance of each species from total number of Individual, species richness, evenness.
- Anderson, M.J., Ellingsen, K.E. & McArdle, B.H. Mul- tivariate dispersion as a measure of beta diversity. Ecology Letters, 2006; 9: 683–693.
- Bates SC. A preliminary checklist of Arizona macrofungi. Canotia., 2006; 2(2): 47-78.
- Chao, A., Chazdon, R.L., Colwell, R.K. & Tsung-Jen, S. A new statistical approach for assessing similarity of species composition with incidence and abundance data. Ecology Letters, 2005; 8: 148–159.
- Dijk HV, Onguene NA, Kuyper TW. Knowledge and utilization of edible mushrooms by local populations of the rain forest of South Cameroon. Ambio, 2003; 32:19-23.
- Dwivedi Sandhya , Singh Surendra , Chauhan U.K and Tiwari Mahendra Kumar. First Report on Unreported Macrofungal diversity of Vindhyan Region of Central India with special reference to Agaricales. Int. Res. J. Environment Sci., 2015; 4(8): 50-59. ISSN 2319–1414.
- Egbe Enow Andrew, Tonjock Rosemary, Kinge , Ebai Maureen Tabi1, Nji Thiobal and Afui Mathias Mih. Journal of Ecology and the Natural Environment., 2013; 5(10): 318-334.
- Ferrier, S., Manion, G., Elith, J. & Richardson, K. Using generalized dissimilarity modelling to analyse and predict patterns of beta diversity in regional biodiversity assessment. Diversity and Distributions, 2007; 13: 252–264.
- Fisher, B.L. Improving inventory efûciency: a case study of leaf-litter ant diversity in Madagascar. Ecological Appli- cations, 1999; 9: 714–731.
- H. Pushpa and K.B. Purushothama, Biodiversity of Mushrooms in and Around Bangalore (Karnataka), India. American-Eurasian J. Agric. & Environ. Sci., 2012; 12 (6): 750-759, ISSN 1818-6769.
- Hawksworth LD. Fungal diversity and its implications for genetic resource collections. Studies in Mycol, 2004; 50:9-18.
- Johannsson, O.E. & Minns, C.K. Examination of association indices and formulation of a composite seasonal dissimilarity index. Hydrobiologia, 1987; 150: 109–121.
- Koleff, P., Gaston, K.J. & Lennon, J.J. Measuring beta diversity for presence-absence data. Journal of Animal Ecol- ogy, 2003; 72: 367–382.
- Krishnappa M, Swapna S and Syed Abrar. Diversity of macrofungal communities in chikmagalur district of western ghats, India. ICMBMP., 2014; 71-82
- Øyvind Hammer, D. A. T. H., and Paul D. Ryan. “ Paleontological Statistics Software Package For Education And Data Analysis.” Palaeontologia Electronica, 2001; 4( 1): 4-9.
- Pedro Cardoso, Paulo A. V. Borges and Joseph A. Veech. Testing the performance of beta diversity measures based on incidence data: the robustness to undersampling. Diversity and Distributions, 2009; 15: 1081–1090.
- Philippi, T.E., Dixon, P.M. & Taylor, B.E. Detecting trends in species composition. Ecological Applications, 1998; 8: 300–308.
- Plotkin, J.B. & Muller-Landau, H.C. Sampling the species composition of a landscape. Ecology, 2002; 83: 3344– 3356.
- Ricotta, C. & Marignani, M. Computing b-diversity with Rao’s quadratic entropy: a change of perspective. Diversity and Distributions, 2007; 13: 237–241.
- Shujiang Li, Tianhui Zhu, Guanghai Liu and Hanmingyue Zhu. African Journal of Biotechnology, 2012; 11(8): 1970-1976. ISSN 1684–5315.
- Whittaker, R.J., Willis, K.J. & Field, R. Scale and species richness: towards a general, hierarchical theory of species diversity. Journal of Biogeography, 2001; 28: 453–470.
© The Author(s) 2017. Open Access. This article is distributed under the terms of the Creative Commons Attribution 4.0 International License which permits unrestricted use, sharing, distribution, and reproduction in any medium, provided you give appropriate credit to the original author(s) and the source, provide a link to the Creative Commons license, and indicate if changes were made.