ISSN: 0973-7510
E-ISSN: 2581-690X
This study aims to scrutinize the phenolic secondary metabolites in the polar peel decocture of Malus domestica var Maharaji via hyphenated techniques along with the study of the antibacterial, anti-candida, and tyrosinase inhibitory potential of bioactive compound-rich fractions. Preliminary phenolics go over was performed together with thin layer chromatography before the polar decocture was subjected to hyphenated techniques. FTIR investigation revealed the C-O bonds as in phenols, O-H bond stretch, and vibrations of alcohols and carboxylic acids as well as portrayed the C-H and >C=O stretches among other functional groups all of which are representative of phenolic and polyphenolic compounds. GC-MS perusal demonstrated the presence of bioactive compounds like Quercetin (13.04%), Ascorbic acid (6.48%), p-Coumaric acid (6.17%), Caffeic acid (5.69 %), Mallic acid (5.44%), Apigenin (5.28%), Citric acid (5.15%), Gallic acid (4.38%), Cyanidin (3.52%), and Ferulic acid (3.51%). Kirby-Bauer method followed by the resazurin microtiter assay technique (REMA) for MIC/MBC against six MTCC bacterial strains and one yeast, all producing stubborn opportunistic infection in humans, was used to assess the antibacterial property of all the bioactive rich fractions. Some fractions comparatively revealed a good activity index (AI) against tested microbes. MIC concentrations for bacteria ranged from 15-24 mg/ml while a lower MBC value recorded was 18 mg/ml. Methanol fraction revealed significant tyrosinase inhibitory activity by revealing IC50 of 980.98 µg/ml when L-Tyrosine was substrate and IC50 of 830.68 µg/ml when L-DOPA was substrate when juxtaposed to standard kojic acid that revealed IC50 of 128.822 µg/ml when L-Tyrosine was substrate and IC50 of 149.43 µg/ml when L-DOPA was substrate. The bioactive compounds possessed by the fractions, may be synergistically, turned out to be more effective in the diphenolase reaction and kojic acid acts more effectively in the monophenolase one. It was inferred that peel phenolics of this malus variety have a lot of therapeutic potential in the context of bacterial infections and pigmentation disorders.
Malus domestica var Maharaji, TLC, Phenolics, GC-MS/FTIR, Minimum Inhibitory Concentration, REMA, Tyrosinase Inhibition
Apple is a rosaceous tree of the Malus genus. It is among the most extensively planted fruit crops, and it is promulgated in temperate climates. The genus is divided into five divisions, with more than 120 species and subspecies.1 Malus pumila Mill denotes the natural apple cultivars, while its hybrid variations are the position of Malus domestica Bork.2 The finest geographical region for apple cultivation is Kashmir, which is located in the western Himalayas. It is a well-known apple-growing province, accounting for over 65-70% of overall apple output in India. There are around 7500 Malus varieties recognized globally, including at least 113 identified in Kashmir in which only 9-11 varieties like Delicious, Kulu Delicious, Kinor, Golden, Jonthon, Maharaji, American, Ambri, Balgaria, Trel are grown on a large scale.3 The most popular and commercial apple cultivar in Kashmir is Red Delicious. China just emerged as the world’s biggest cultivator of Apple, surpassing all other makers. Yet, Kashmiri Apples have a distinct identity in the worldwide marketplace. The cultivar taken up for the current study (Malus domestica var Maharaji) is indigenous to Kashmir.
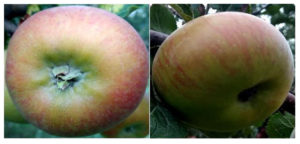
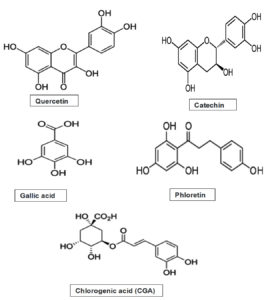
Malus domestica var Maharaji is a huge apple with a brilliant red colour on a green foundation with noticeable spots or streaks (Figure 1). The fruit’s peel is crisp, juicy, and fragrant, but the flavor is highly acidic. Maharaji apple is a morphologically low-growing, round-crowned solid wood plant with a deliquescent and adventitious base having alternated phyllotaxy. The plant produces pentamerous, actinomorphic flowers with petals that range in colour from white to pinkish. Fruit is a pome with spongy thalamus as an edible component. In Kashmir, almost every commercial orchard possesses a few recommended pollinizer Maharaji varieties.4 Most of the therapeutic benefits of malus varieties have been linked to secondary metabolites, which are non-nutrient secondary phytochemicals such as flavonoids, isoflavonoids, carotenoids, phenolic acids, and so on, which are all synthesized in the plant via biosynthetic pathways of secondary metabolism mostly as phytoanticipins.5 Scores of phytochemicals have been discovered in plants and their components, but many more remain unidentified. Various phytochemicals have been discovered to have a variety of actions that may aid in the prevention of chronic illness when it comes to human health.6 Protecting against oxidation is one of the phytochemicals’ main characteristics. Because fruits and vegetables are abundant in such compounds that act as antioxidants, eating them regularly minimizes oxidative stress and as a result, may mitigate chronic illness and slow ageing. Because of these observations, the National Research Council now recommends eating five to six servings of fruits and veggies diurnal. Apples pack a range of phytochemical punches, with flavonoids being the most frequent kind. The quantity of these phytochemicals can vary depending on multiple factors, including apple cultivar, harvesting, and stockpiling time, climatic and soil conditions, and finally apple processing.7 Therapeutic potential of phytoanticipins has sparked a lot of interest in pharmacognosy research in the last two decades when numerous types of research revealed their anti-inflammatory, anti-oxidative, anti-carcinogenic, anti-tumour, anti-hypertensive, anti-viral, anti-allergic, anti-mutagenic, anti-ageing, cardioprotective, and immunomodulatory properties, as well as their ability to modulate enzymatic functions, inhibit cell proliferation, induce apoptosis, and inhibit bacterial and fungal growth among others.2-7 The primary goal of incorporating plant-based bioactive chemicals into healthcare is to produce a beneficial interaction with the body’s physiology while eschewing the unintended and off-target detrimental effects that pharmaceuticals are notorious for. In the current study, this unexploited cultivar’s peel bioactive compounds were tested in the context of antimicrobial potential and the capabilities of halting the activity of enzyme tyrosinase. Tyrosinase, a multifunctional polyphenol oxidase that is glycosylated and contains copper, catalyzes the first two stages in mammalian melanogenesis and is also in charge of an enzymatic browning response that occurs in damaged fruits during processing and handling after harvest.8 Tyrosinase’s inhibitory action can be used to limit the production of melanin. Drugs called tyrosinase antagonists prevent melanin from being produced. The inhibitory mechanism of the tyrosinase enzyme can be employed to reduce melanin synthesis. Both enzymatic fruit browning and hyperpigmentation of human skin are undesirable. These events have motivated scientists to look for new, powerful tyrosinase inhibitors that they may utilize in enhancing the shelf life of fruits and the lightening effect of cosmetics. It has been demonstrated that a number of chemically produced chemicals, such as mequinol, kojic acid, monobenzone, mercury, hydroquinone, and arbutin, have an inhibiting effect on tyrosinase enzyme and melanocytes during melanogenesis.9 However, continued use of chemical therapies is either reducing their effectiveness or endangering general health by producing unintended adverse effects. As a result, bioactive substances from organic sources are required that have anti-tyrosinase potential. The content of bioactive compounds differs significantly between apple peels and apple flesh. Apple peels, notably, are loaded with phenolics. Apple antioxidant chemicals of such type that have received the greatest attention include catechin, epicatechin, gallic acid, phloridzin, procyanidin, quercetin and its other forms like quercetin-3-glucoside, quercetin glucuronide, quercetin sulfate, quercetin-3-galactoside, quercetin-3-rhamnoside, chlorogenic acid, cyanidin-3-galactoside, and coumaric acid (Figure 2)8-9. According to studies, apple peels possess 2-3 times more flavonoids than apple inner flesh and 2-6 times more phenolics than the flesh (depending on the cultivar). Quercetin and chlorogenic acid conjugates are highly prevalent in the peels.10-12 The ability of peels to scavenge free radicals has been revealed to be substantially greater, ranging from 2 to 6 times that of the flesh.13 Apple peels should be studied in the realms of medicine where they are yet unexploited. As a result, the current investigation’s goal was to evaluate the phenolics in Malus domestica var. Maharaji peels.
In the current study, the polar decocture of the peels that are deemed to be the potential source of phenolics was subjected to preliminary bioactive compound analysis via qualitative tests and thin layer chromatography (TLC). Fourier transform infrared spectroscopy analysis was used to obtain an infrared spectrum of absorption or emission of the molecules present, thus correlating to the quantity of functionality present in the sample. The quantitative audit of pure molecules was done via hyphenated techniques involving Gas chromatography coupled with mass spectroscopy. Moreover, phenolics were freed via sequential extractions following the well-established method of fractionation and subsequently assessed for anti-tyrosinase potential along with the appraisal of antibacterial activity against six human pathogenic MTCC bacterial strains and antimycotic potential against the yeast Candida albicans, all causing opportunistic infections in humans. Fractions that revealed strong antimicrobial activities in initial trial assays were studied in-depth to demonstrate their MIC and MBC. Tyrosinase inhibitory activity was assessed by studying in vitro monophenolase and diphenolase reactions of the enzyme tyrosinase which plays a paramount role in melanin generation. This study revealed that Malus domestica var Maharaji peels pack a big stock of bioactive compounds that possess anti-bacterial and anti-tyrosinase properties.
Sampling, Authentication, and Reagents Incorporate
In September 2022, four Malus domestica cultivars were collected from Malus gardens in Dodarkoot, an area in Kashmir’s Kulgam district (33°37’23″N 75°02’11″E). Only fruits that appeared to be healthy were chosen at random. The specimens with the number CBT/KU/21 were presented to the ‘Herbarium’ at the Taxonomy Department at Kashmir University, where they were certified by a taxonomist. Nevertheless, initial trial-based bioactivity assays qualified Malus domestica var Maharaji comparatively much better for in-depth bioactive compound perusal. To investigate the same, the reagents of analytical grade including 2, 2-diphenyl-1-picryl-hydrazyl Folin reagent, Folin-Ciocalteau’s phenol reagent (FCR), methanol, DMSO, dichloromethane, chloroform, hydrogen peroxide, toluene, petroleum ether, ammonia Solution, ethyl acetate, Alsever’s solution, resazurin, Mayer’s reagent, ferric chloride, potassium acetate, lead acetate, concentrated H2SO4, sodium carbonate, quercetin, rutin, ascorbic acid, gallic acid, aluminium chloride, tetracycline, Amphotericin-B, peptone water, phosphate buffer, diclofenac sodium, Mueller-Hinton Agar (MHA), nutrient broth, YPD broth, potato dextrose agar (PDA), Kojic acid, L-Tyrosine, L-DOPA, etc. were incorporated in the study. These reagents were procured from different vendors like Hi-media, Merck, and Sigma.
Modus operandi for Extraction of polar compounds
200 g of shade-dried and pulverized Malus peels were decocted for 28 hours employing Soxhlet extraction and hot-cold maceration processes through a hot polar menstruum of 70% MeOH and absolute DCM (80:20 v/v). The concentrate was dehydrated by the rotatory evaporator and then dwindled at a temperature of 40-50°C under controlled pressure before being stored at 4°C in cryotubes. Free secondary metabolites in crude extract were retrieved by re-extracting (fractionating) the dehydrated gummy extract successively with absolute MeOH (fraction A), ethyl acetate (fraction B), and chloroform (fraction C) following the well-established methodology.14 Each fraction was dried and treated with Petroleum ether, with these fractions high in fatty compounds being eliminated. The leftover fractions underwent hydrolysis for 2.5 hours via refluxing them with 6% H2SO4 (to exempt them from bound sugars) and filtered. The filtrates were again extracted with their respective solvents to neutrality. The final fractions thus retrieved were dehydrated in vacuo and subsequently subjected to Anti-bacterial, Anti-candida, and tyrosinase inhibitory potential.
Screening of secondary metabolites, total phenolic content, and thin-layer chromatography
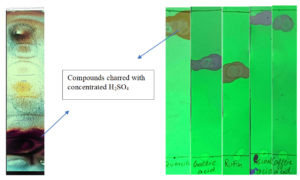
Traditional procedures for a set of nearly a dozen assays15 were utilized to assess the primary polar extract for secondary bioactive compounds. With slight changes, the overall phenolic quantum was evaluated using Folin-Ciocalteau’s reagent assay16, and the data was expressed as the equivalent of gallic acid (GAE) per gram of dry mass. Moreover, thin-layer chromatography of purified decocture was performed along with the probable standards. Crude extract obtained from the polar menstruum of 70% MeOH and absolute DCM was dispersed in ethyl acetate and then loaded to activated (105°C in the oven for 25 min) commercial pre-coated TLC plates (0.2mm) properly marginated with load point solvent front. The probable standard reference compounds like chlorogenic acid, quercetin, caffeic acid, rutin, and gallic acid were used as reference compounds. All these compounds were also separately loaded on TLC plates. All these plates were developed in a menstruum blend of N-hexane, ethyl acetate, acetic acid, and water (90:20:10:26 v/v), air dried, visualized under ultraviolet (UV) light, and charred with concentrated H2SO4 to make them visible. In the TLC plate over which the sample was run, various spots with different retention factors were observed and retention factors were seen on the TLC plates over which standards were run.
FT-IR and gc-ms analysis
The IR radiations exert an effect on the atomic vibrations of molecules present in the test sample, resulting in a specific quantity of energy getting transmitted or absorbed. To capture infrared radiations, as a result of their vibratory or rotatory motions, a molecule’s degree of separation of opposing charges changes. Atoms’ relative positions change continually as a result of many sorts of vibrational movements (flexing and deformation) in molecules. The bonds in a molecule act as minute springs, vibrating at a particular frequency. These frequency bands belong to the infrared electromagnetic spectrum. Shifting energies specific to each chemical group are visible in the Infrared spectrum.17 Consequently, the IR spectrum of a chemical compound acts as a unique signature that distinguishes it from the spectra of other compounds. It was thus feasible to identify the kinds of functional groups and nature of bonds in the test samples being assessed by transmitting IR radiation onto them and noticing which frequency bands were captured. This investigation used a made-in-Japan FT-IR spectroscope (AC- 630) with a scan stretch of 400 to 4000 cm-1 under 8 cm-1 imaging resolution. 2 mg of dehydrated decocture was loaded as translucent sample discs by encapsulating them in 115 mg potassium bromide pellet. The ionization of inert analyte compounds into gas-phase ionized species is the primary and most critical element in GC-MS mass spectrometry assessment. Ionization is the cause of the additional energy that the molecule receives during cleavage. Then, a mass spectrometer uses the m/z ratio to distinguish the molecular ions from their charged shards.18 After being correctly identified, a mass spectrum depicts the ion momentum produced by these mass-differentiated ions. All of these procedures are carried out under a strong hoover (10-4 to 10-8 torr). The active components of the polar decocture were determined using a GC-MS machine, (Agilent tech V. GC-7890A/MS-5975C), coupled with an HP-5MS cartridge. (L 30m, D 250 mm, FT 0.25mm). For spectroscopic analysis by GC-MS, a device for ionizing high-energy electrons (70 eV) was employed. The gas phase consisted of 99.995% pure helium gas with a flux rate of one milliliter per minute. The initial temperature was held constant at 50-1500 with an increasing rate of 30°C per minute and a hold time of 10 minutes. After that, the system was loaded with the sample that had been diluted with the proper menstruum and heated up to 300°C. Each extract’s relative amount of bioactive compounds was calculated as a percentage form in accordance with the detected peak coverage in the chromatogram. Using the HP-5MS column’s GC retention duration, bioactive substances were uncovered. Using the AMDIS, the raw GC-MS data files were deconvoluted using Wsearchpro’s tools (www.wsearch.com.au). The collected metabolite data were subsequently transformed into csv (comma-separated values) format before being posted to Metaboanalyst 4.0 (http://metaboanalyst.ca). A spectrum juxtaposition utilizing e-programming data of benchmarks (Replib and Mainlab content of the GCMS output) was additionally utilized to clarify the results.
Antimicrobial assay (MIC and MBC)
Seven pathogenic microorganisms in total were incorporated into the study including six bacteria strains viz., Escherichia coli GIM1.708, Pseudomonas aeruginosa ATCC 10145,Staphylococcus aureus ATCC29213, Escherichia coli DH5-Alpha, Salmonella enteritidis 10982, Micrococcus leteus ATCC14452 and one yeast, viz, Candida albicans (MTCC 183), all procured from IMTECH Chandigarh. Kirby-Bauer disc diffusion assay was incorporated for antimicrobial testing.19 The bacterial and yeast inoculums were swabbed onto MHA and SDA plates, with the inoculum of 0.5 MacFarland turbidity (1.5×10⁸ CFU per ml for bacteria and 1.5 × 10⁷ cell per ml for yeast). To eliminate any menstrual remnants that could have affected the results, 100µl of each fraction (25 mg/ml) was coated onto sterile discs before being allowed to dry in vacuo. The seeded agar plates were then topped with loaded discs. Tetracycline discs (TE30), an antibiotic, and Ny statin discs(NS-100), an antifungal, were used as standards for the testing of each fraction in triplicate. The negative control was DMSO, which was utilized at a strength of 15%. After being kept at 4°C for one hour for decocture diffusion, the plates underwent a 24-hour incubation at 37°C for bacteria and a 48-hour incubation at the same temperature for fungus. Activity index (AI) was used to represent antibacterial and antifungal activity. Each fraction’s AI was evaluated via the following parameter.
Activity index = [IZ developed by test samples extract / IZ developed by positive standards]
where IZ=inhibition zone.
The MIC was calculated for the samples that demonstrated antimicrobial activity against the test microorganisms via broth microdilution technique with resazurin as an indicator compound.20 Dehydrated samples were reconstituted in DMSO, having no effect on the test strains, to generate a known concentration of 25mg per ml. From this stock suspension, functional concentrations of 3 -24mg per ml were made. 96-well microtiter plates equipped with broth medium (PDB for fungus and MHB for bacteria) received 100 µl of each dilution. Then, each well received a 50 µl inoculum with 1.5×10⁷CFU/ml of yeast and 1.5×10⁸ CFU/ml of bacteria along with 30 µl of 0.02% resazurin as indicator dye. Negative controls included bacterial and fungal suspensions devoid of any chemicals, while positive controls included suspensions having standard control drugs such as tetracycline (50 µg/ml for bacteria) and amphotericin-B (40 µg/ml for yeast). The microtiter plates were subjected to incubation for 24 hours at 37°C for bacteria and 48 hours for yeast. Each sample was analyzed in parallel. The MIC values were derived as the lowest concentration of fractions sufficient to prevent turbidity in a microtiter plate well during incubation. By sub-culturing 50 µl from wells with negligible turbidity, the MBC/MFC was computed. The dose with no discernible growth after subculturing was taken as MBC/MFC.21
Tyrosinase inhibitory activity
Tyrosinase is an oxidase that participates in the Raper-Mason pathway that generates melanin. The tyrosinase enzyme’s inhibitory mechanism can be used to slow down the production of melanin and hence skin lightening. Tyrosinase (EC 1.14.18.1) is a polyphenol oxidase (PPO) enzyme that contains copper and catalyzes two distinct reactions that both use molecular oxygen, the hydroxylation of L-tyrosine to L-3.4-dihydroxyphenylalanine (L-DOPA) by monophenolase reaction and the oxidation of L-DOPA to Dopaquinone via diphenolase reaction.22 Tyrosinase inhibitory ability testing was performed to assess the existence of the inhibitory capacity of detected bioactive compounds in Malus domestica var Maharaji peel decoctures against the enzyme tyrosinase. All of the dehydrated polar extract’s inhibitory tyrosinase action was measured using a spectrophotometric method with an ELISA microplate reader. The desiccated extracts were dissolved at a 25 mg/ml concentration in 50 mM phosphate buffer (pH 6.5) to create extract stocks. Concentrations between 5 and 15 mg/ml were analyzed for anti-tyrosinase activity. Kojic acid was tested at dosages ranging from 100 to 1000 µg/ml as a positive control. A 96-well plate containing 50 µL of the test concentration and 30 µL of tyrosinase enzyme (Sigma, 333 units/mL in phosphate buffer pH 6.5) was subjected to incubation for five minutes. Utilizing a microplate reader, 100 µL of enzyme substrates (2 mM L-Tyrosine and 2 mM L-DOPA) were added and incubated at room temperature for half an hour to assess the absorbance (abs 475) of each well. This allowed us to calculate the extent of inhibition and the concentration at which 50% of the enzyme activity is halted (IC50).
Statistical analysis
All dimensions were at the very least documented in triplicate and estimated. In this study, the 95% confidence interval (p < 0.05, 0.01, and 0.001) was chosen. The mean of triplicate with standard deviation (±SD) denotes our data everywhere in our findings. Bonferroni’s Multiple Comparison Testing was employed after the analysis of variance (ANOVA) method to analyze multiple juxtapositions using SPSS software.
Preliminary secondary metabolite analysis, TLC, and TPC
A dehydrated greenish exudate that emerged in the extraction process weighs approximately thirty-three grams, thus giving an extractive yield of around 16.62% w/w. Preliminary investigation of secondary metabolites revealed the presence of various secondary metabolite categories like polyphenols, glycosides, quinones, flavonoids, phenols, terpenoids, anthocyanins, saponins, alkaloids, chalcones, coumarins, and tannins but anthraquinones, phytosterols, phlobatannins, emodins were absent. In the context of TLC, in the present investigation, the mobile phase menstruum system of N-hexane, ethyl acetate, acetic acid, and water (90:20:10:26 v/v) gave excellent results. In the TLC plate over which the sample was run, various spots with different retention factors (Rf 0.86, 0.38,0.51, 0.93, 0.53, 0.92, 0.62, 0.78, 0.89, 0.10) were observed. Specific retention factors of 0.93,0.53, 0.92, 0.62, and 0.89 were seen for the standard compounds of chlorogenic acid, rutin, quercetin, gallic acid, and caffeic acid, respectively (Figure 3). Since these Rf values coincide with the TLC plate that separated purified crude extract, it indicates the presence of such compounds in it.
Overall phenolic content was determined using a previously prepared calibration graph (R2 = 0.9861, y = 0.0079x + 0.2866) of gallic acid (0.05-0.25 mg/mL) and was expressed inequivalent amounts of gallic acid (GAE) per gramme dry extract weight (DW). All the fractions contained different amounts of phenolics. The TPC varied from 112.23 to 198.99 mg GAE/G dry weight of the sample (Table 1). Methanolic fraction as per the results of this study revealed the highest TPC and ethyl acetate fraction revealed the least TPC comparatively.
Table (1):
Total phenolic content of different fractions
Fraction |
Overall phenolic quantum (mg GAE/G DW) |
|---|---|
Methanol fraction |
198.99±16.416 |
Chloroform fraction |
141.95±8.645 |
Ethyl acetate fraction |
112.23±12.652 |
FTIR results
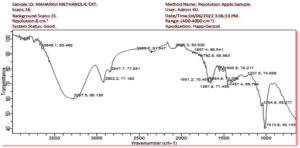
Table 2 lists the wave numbers (cm -1) of the observable peaks discovered by FTIR analysis of purified polar extract that were retrieved via polar menstruum cocktail of 70% MeOH and absolute DCM (80:20 v/v). FT-IR spectra in the 4000-400 cm-1 range are shown in Figure 4. The O-H bond stretching of alcohols, which often unfolds around 3700 and 3200 cm-1, and the O-H bond resonance of carboxylic acids, which typically unfolds generally between 3400 and 2400 cm-1, are both included in the broad range within 3570 and 3200 cm-1. The C-H and >C=O stretching are depicted by the distinctive peaks at 2918 cm-1 and 1732 cm-1, correspondingly. The C-C bond in aromatic rings stretches as a result of absorptions around 1600 and 1585 cm-1 and 1500 and 1400 cm-1. Peaks appeared in the spectra for the C-O bond’s axial flexing in phenols (1260-1000 cm-1), angular distortion at the C-H bonds of aromatic rings (1300-1000 cm-1), and the C-O bond’s axial compression in -COOH (1320-1210 cm-1). The stretching N-H peak that is observed at 3309.85 cm-1 is due to the existence of nitrogen-containing compounds like amides and amines. The appearance of an absorption peak for C-C-H at 3224.98-2987.87 cm-1 has affirmed the existence of alkynes. The C=O of carbonyl compounds are responsible for the mid-intense peak at 1735.93-1555.86 cm-1. The stretching band at 1635.64 -1550 cm-1 is because of the existence of unsaturated alkenes. The presence of alkynes has been confirmed by appearing absorption peaks at 3224.98- 2987.87 cm-1 for C≡C-H. The mid-intense peak at 1735.93-1555.86 cm-1 is imputed to the C=O of carbonyl compounds. Unsaturated alkene’s presence corresponds to the stretching band at 1635.64 -1550cm-1. Major categories of Malus domestica peel secondary metabolites like flavonoids, procyanidins, chlorogenic acids, polyphenols, quercetin conjugates, carotenoids, terpenes, hydroxycinnamic acids, anthocyanins, and organic acids fall in these categories.
Table (2):
F TIR spectral peak values and functional groups obtained for the crude polar extract
Wave No. cm-1 |
Wave number cm-1[Reference] |
Functional group type |
Intensity compound class |
Predicted |
|---|---|---|---|---|
3649.1 |
3700-3500 |
stretching of O-H |
Medium, sharp |
Alcohol |
3287.5 |
3570-3200 |
symmetric O-H stretch Hydroxy group, H-bonded |
Broad |
Alkanes |
2922.2 |
3000-2845 |
stretching of C-H |
Medium |
Alkane |
2847.7 |
3000-2850 |
stretching of N-H |
Strong, broad |
Amine |
2355.7 |
2380-2349 |
stretching of O=C=O |
Strong |
Carbon compound |
2087.3 |
2140-1990 |
stretching N=C=S |
Narrow and Strong |
Isothiocyanate |
1867.4 |
2000-1650 |
Bending of C-H |
Weak |
Aromatic compound |
1792.8 |
2000-1650 |
Bending of C-H |
Weak |
Aromatic compound |
1651.2 |
2000-1650 |
Bending of C-H |
Weak |
Aromatic compound |
1505.8 |
1580-1490 |
N-H deformation vibrations |
Weak |
Secondary amine |
1457.4 |
1580-1490 |
Bending of C-H |
Medium |
Methyl/methylene group |
1397.8 |
1150-1085 |
stretching of C-O |
Strong |
Aliphatic ether |
1237.5 |
1440-1395 |
Bending of O-H |
Medium |
Carboxylic acid |
1054.8 |
1155–1015 |
CH3 rocking vibration |
Weak-Medium |
P-O-C2H5; Organic Phosphorus compound |
1013.8 |
1250-1020 |
stretching of C-N |
Medium |
Amine |
Gc-ms results
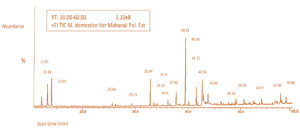
Table 3 lists the bioactive compounds reported in polar decocture achieved via a polar menstruum cocktail of 70% MeOH and absolute DCM (80:20 v/v). More than thirty peaks were achieved in the scan time of 10.00-60.00 mins in which about 20 peaks were pinpointed. The rhythm of their elution on the column was employed to determine and describe them. The elution duration, molecular mass, and amount of these bioactive compounds according to percent area were retrieved. Figure 5 depicts the GC chromatogram demonstrating the duration of retention in the column as well as the peaks that were found and correlated to the bioactive ingredients in the decocture. GC-MS perusal demonstrated that the polar decocture is rich in bioactive compounds like Quercetin (13.04%), Ascorbic acid (6.48%), p-Coumaric acid(6.17%), Caffeic acid (5.69%), Mallic acid (5.44%), Apigenin (5.28%), Citric acid (5.15%), Gallic acid (4.38%), Cyanidin (3.52%) and Ferulic acid (3.51%). Additional molecules that correlate to other signals in the recorded chromatogram are listed.
Table (3):
Bioactive compounds identified from the polar decocture of Malus domestica var Maharaji peels
No. |
Compound identified |
Retention time (min) |
%Area |
MW (g/mol) |
Qualification Ions[m/z] |
|---|---|---|---|---|---|
1. |
Vanillic acid |
11.83 |
3.48 |
168.14 |
749,226 |
2. |
Apigenin |
13.18 |
5.28 |
270.05 |
368,179 |
3. |
Ascorbic acid |
13.91 |
6.48 |
176.12 |
464,449 |
4. |
(+)-Catechin |
25.66 |
1.69 |
290.27 |
280,179 |
5. |
Isoquercitin |
29.21 |
1.58 |
464.10 |
286,451 |
6. |
p-Coumaric acid |
32.84 |
6.17 |
164.05 |
308,293 |
7. |
Chlorogenic acid |
33.52 |
1.33 |
354.31 |
786,712 |
8. |
(-)-Epicatechin |
34.01 |
1.29 |
290.27 |
368,179 |
9. |
Phlorizin |
36.18 |
2.49 |
436.40 |
317,314 |
10. |
Gallic acid |
37.82 |
4.38 |
170.12 |
435,237 |
11. |
Quercetin |
39.68 |
13.04 |
302.24 |
559,560 |
12. |
Citric acid |
40.14 |
5.15 |
192.12 |
465,437 |
13. |
Caffeic acid |
41.72 |
5.69 |
180.16 |
396,381 |
14. |
Malic acid |
42.53 |
5.44 |
368.55 |
350,335 |
15. |
Ferulic acid |
43.87 |
3.51 |
194.18 |
476,561 |
16. |
Rutin |
49.18 |
2.56 |
610.52 |
302,463 |
17. |
Phloridzin |
50.78 |
2.31 |
436.40 |
419,317 |
19. |
Cyanidin |
57.88 |
3.52 |
287.24 |
521,337 |
20. |
Protocatechuic acid |
58.88 |
3.01 |
154.12 |
370,355 |
Figure 5. A typical gas chromatogram showing the bioactive compounds of Malus domestica var Maharaji peel polar decocture
Antimicrobial assay
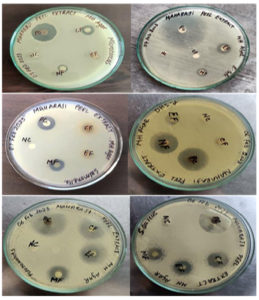
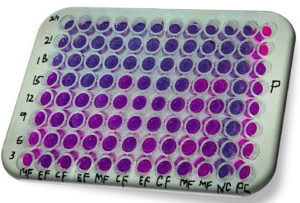
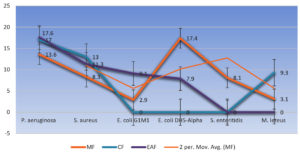
The establishment and assessment of the growth suppression around the discs after incubation (37°C for 24 hrs.) was used to determine antimicrobial activity (Figure 6). Premised on the CLSI breakpoint definitions, zone widths of susceptibility testing findings were classified as susceptible, moderate, or resistant. With a few anomalies, different fractions hindered the development of test organisms, thus revealing their anti-microbial potential. MIC and MBC of only those fractions were studied whose activity index against some strains was significant (AI > 0.3) as per CLSI breakpoint criteria. The non-fluorescent resazurin blue is converted by vigorous cells to the fluorescent resorufin pink (Figure 7), offering an easily measurable indicator of bacterial metabolic activity. Candida albicans was discovered to be the most resilient to the studied fractions, whilst Pseudomonas aeruginosa turned out to be the most vulnerable. Best antibacterial activity was observed in ethyl acetate fraction against P. aeruginosa (IZ 17.6 ±1.13mm, AI 0.70, MIC 15mg/ml, MBC 21 mg/ml) followed by chloroform fraction (IZ 17 ± 1.21mm, AI 0.68, MIC 15mg/ml, MBC 18 mg/ml) and Methanol fraction (IZ 13.6 ± 0.95mm, AI0.54, MIC 18 mg/ml, MBC 24 mg/ml). Staphylococcus aureus was also found to be significantly sensitive towards test fractions. The best activity was seen in chloroform fraction (IZ13 ± 0.52mm, AI0.49, MIC18mg/ml, MBC24mg/ml) followed by ethyl acetate fraction (IZ11.3 ± 0.49 mm, AI 0.42, MIC 21 mg/ml, MBC 24 mg/ml) and methanol fraction (IZ 8.3 ± 0.62 mm, AI0.31, MIC 21mg/ml). Methanol fraction revealed significant activity against Escherichia coli DH5-Alpha (IZ 17.4 ± 0.40mm, AI 0.76, MIC 15mg/ml, MBC 24 mg/ml). Similarly, methanol fraction revealed intermediate activity against Salmonella enteritidis (IZ 8.1 ± 1.01mm, AI 0.51, MIC 24 mg/ml). Other test strains were intermediate sensitive to some fractions (Table 4 and Table 5). Some strains were resistant to the test fractions, either showing no zones of inhibition at all or the inhibitory zones were insignificant (Figure 8). No fraction revealed anti-fungal activity against the candida albicans except a small activity index (AI 0.30) in the methanol fraction which was thus considered insignificant.
Table (4):
Antimicrobial activity of Malus domestica var Maharaji polar peel extracts via disc diffusion assay
| Teststrain | MF | CF | EAF | |||
|---|---|---|---|---|---|---|
| ZI(mm) | AI | ZI(mm) | AI | ZI(mm) | AI | |
| P. aeruginosa ATCC10145 | [13.6±0.92]** | 0.544 | [17±1.21]*** | 0.68 | [17.6±1.13]*** | 0.70 |
| S. aureus ATCC29213 | [8.3±0.62] | 0.31 | [13±0.52]** | 0.49 | [11.3±0.49]** | 0.42 |
| E.coli GIM1.708 | [2.9±0.23] | 0.12 | _ | _ | [9.1±0.88]** | 0.36 |
| E. coli DH5-Alpha | [17.4±0.4]*** | 0.76 | _ | _ | [7.9±0.78]* | 0.34 |
| S. enteritidis 10982(SE). | [8.1±1.01]* | 0.51 | _ | _ | _ | _ |
| Micrococcus leteus ATCC14452 | [3.1±0.27] | 0.15 | [9.3±1.2]* | 0.44 | _ | _ |
| Candida albicans MTCC183 | [5.3±0.37]* | 0.30 | _ | _ | _ | _ |
IZ: Inhibition zone in mm(mean value; indicating mm diameter of disc); AI: Activity index (IZ developed by extract/IZ developed by standard); ±: SEM; ( ): No activity; MF: Methanol fraction, CF: chloroform fraction, EAF: Ethyl acetate fraction. Fractions assayed in triplicate, IZ of standard drug tetracycline (TE30mcg) against P. aeruginosa (25±0.26), S. aureus (26.4±0.32), E.coli (25.8± 0.22), S. enteritidis (16 ± 0.41), M. leteus (21 ± 0.58). IZ of standard anti-fungal drug Nystatin (NS-50mcg)-(17.62±0.28)*** P>0.001, **P>0.01, *P>0.5
Table (5):
MIC and MBC/MFC values of Malus domestica var Maharaji polar peel fractions against the test strains
| Test Strains | MF | CF | EAF | |||
|---|---|---|---|---|---|---|
| MIC mg/ml | MBC mg/ml | MIC mg/ml | MBC mg/ml | MIC mg/ml | MBC mg/ml | |
| Pseudomonas aeruginosa ATCC10145 | 18 | 24 | 15 | 18 | 15 | 21 |
| Staphylococcus aureus ATCC29213 | 21 | _ | 18 | 24 | 21 | 24 |
| Escherichia coli GIM1.708 | 24 | _ | _ | _ | 21 | _ |
| Escherichia coli DH5-Alpha | 15 | 24 | _ | _ | 24 | _ |
| Salmonella enteritidis 10982(SE). | 24 | _ | _ | _ | _ | _ |
| Micrococcus leteus ATCC14452 | _ | _ | 21 | _ | _ | _ |
| Candida albicans MTCC183 | _ | _ | _ | _ | _ | _ |
MIC-Minimum inhibitory concentration, MBC-Minimum bactericidal concentration, MF-Methanol fraction, CF-Chloroform fraction, EF-Ethyl acetate fraction,(-) No activity seen
Figure 6. Antimicrobial activity of peel fractions against different bacterial strains via Kirby- Bauer disc diffusion assay
Figure 7. MIC/MBC via resazurin microtiter assay method (REMA). MF-methanol fraction, EF-ethyl acetate fraction, CF- chloroform fraction, P- Pseudomonas aeruginosa
Figure 8. Graphical representation of the antimicrobial activity of peel fractions against different bacterial strains
Tyrosinase inhibition results
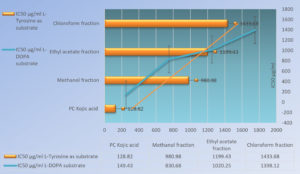
The results were expressed as IC50 value which denotes the dose at which half the activity of the enzyme is halted. IC50 values (averages of triplicate data sets) of kojic acid (as positive control), MF, EAF, and CF on enzyme, when L-Tyrosine was substrate, came out to be 128.822 µg/ml, 980.98 µg/ml, 1199.43µg/ml, and 1433.68 µg/ml, respectively (P < 0.05). IC50 values (averages of triplicate data sets) of kojic acid (as positive control), MF, EAF, and CF on enzyme, when L-DOPA was incorporated as substrate, comes out to be 149.43 µg/ml, 830.68 µg/ml, 1020.25 µg/ml, and 1398.12 µg/ml respectively (P < 0.05). This indicates that all test fractions act more effectively on the diphenolase reaction while kojic acid acts more effectively on the monophenolase one (Figure 9).
In this day and age, there are more than 7,500 domesticated cultivars of apples known worldwide. Apple, a dicotyledonous plant with 17 chromosomes and an approximate genome size of 650 Mb, is taxonomically a member of the Rosaceae family, subfamily Maloideae (formerly Pomideae).23 In the current study, Malus domestica var Maharaji indigenous to Kashmir was incorporated. This study is the first of its kind in the context of this variety. This cultivar ripens in late October, keeps its freshness for a prolonged duration, and starts out tart but gradually becomes sweeter. The fruit has an ample amount of saccharides and sorbitol in it (sucrose, glucose, and fructose), organic acids (mainly malic and citric acid), minerals (iron, potassium) vitamins (vitamin C and E). Almost all apple cultivars are important sources of phenolic and polyphenolic compounds whose accumulation in the different parts of the fruit depends upon various intrinsic and extrinsic factors. Fruit cultivar, fruit growth stage, the pattern of cultivation, soil type, environmental stress circumstances, weather variables, and other factors like storage time, post-harvest scenarios, and so on all affect individual phenolic and polyphenolic phytochemical concentrations in apples. All these factors impact the overall phenolic content of fruits, as well as their antioxidant and pathogen-defending abilities.24 As a result, data from the original study done on a variety of cultivars under a variety of conditions cannot be easily compared to arrive at a conclusion. The current study aimed to perform the evaluation of secondary metabolites of the peels of Malus domestica var Maharaji via the metabolomics approach incorporating preliminary secondary metabolite perusal, thin layer chromatography, and Total phenolic content estimation followed by FT-IR and GCMS scrutiny. Moreover, the scrutiny of the antimicrobial and anti-inflammatory potential of the polar fractions of the peel was also analyzed. Secondary metabolites being usually polar in nature were extracted from peels via the Soxhlet extraction process using a cocktail of menstruum systems of varied polarity. The recovery of different categories of molecules in conditions of uniform time and temperature is most significantly influenced by the menstruum encompassed and the chemical characteristics of the test specimens.25 In a blend of polar menstruum, our extractive yield was around 16.62 % w/w with the preliminary investigation showing the presence of major phenolics like polyphenols, flavonoids, alkaloids, etc. TLC analysis revealed the presence of important apple phenolics like gallic acid, quercetin, chlorogenic acid, rutin, and caffeic acid. Various studies have revealed the existence of such bioactive compounds in distinct Malus varieties.26 In this investigation, the overall phenolic content of peels ranged from 112.23 ± 12.652 to 198.99 ± 16.416 mg GAE/g, which is comparable to the concentration in grape extract, a phenolic beverage. As indicated in the current study, the peel’s TPC content was less than those found by Sahafi et al.27 which reported higher TPC values of 653.8 ± 20.78 in the same cultivar. FTIR spectra of the polar decocture reported the number of bands and peaks showing the abundance of extracted compounds. It revealed the presence of phenols, alkenes, aromatic rings, alcohols, carboxylic acids, esters, nitro compounds, poly-hydroxy compounds, ethers, and hydrogen-bonded alcohols. As far as apple secondary metabolites like flavonoids, hydroxycinnamic acids, polyphenols, quercetins, carotenoids, chlorogenic acids, procyanidins, anthocyanins, terpenes, and other organic acids are concerned, these all fall under the broad categories of functional groups as revealed by FT-IR data. The FT-IR spectra were recorded in the mid-range (4000-400 cm-1). The O-H bond stretching of alcohols, which often unfolds around 3700 and 3200 cm-1, and the O-H bond resonance of carboxylic acids, which typically unfolds generally between 3400 and 2400 cm-1, are both included in the broad range within 3570 and 3200 cm-1. The C-H and >C=O stretching are depicted by the distinctive peaks at 2918 cm-1 and 1732 cm-1, correspondingly. The C-C bond in aromatic rings stretches as a result of absorptions around 1600 and 1585 cm-1 and 1500 and 1400 cm-1. Peaks appeared in the spectra for the C-O bond’s axial flexing in phenols (1260-1000 cm-1), angular distortion at the C-H bonds of aromatic rings (1300-1000 cm-1), and the C-O bond’s axial compression in -COOH (1320-1210 cm-1). The stretching N-H peak that is observed at 3309.85 cm-1 is due to the existence of nitrogen-containing compounds like amides and amines. The appearance of an absorption peak for C-C-H at 3224.98-2987.87 cm-1 has affirmed the existence of alkynes. The C=O of carbonyl compounds is responsible for the mid-intense peak at 1735.93-1555.86 cm-1. The stretching band at 1635.64 -1550 cm-1 is because of the existence of unsaturated alkenes. The presence of alkynes has been confirmed by appearing absorption peaks at 3224.98- 2987.87 cm-1 for C≡C-H. The mid-intense peak at 1735.93-1555.86 cm-1 is imputed to the C=O of carbonyl compounds. Unsaturated alkene’s presence corresponds to the stretching band at 1635.64 -1550cm-1. These findings concur with those of Mallampati et al.28 which report almost the same peaks in the FT-IR analysis of the red apple variety. in the current study, GC-MS perusal demonstrated the presence of numerous bioactive compounds like Quercetin (13.04%), Ascorbic acid (6.48%), p-Coumaric acid (6.17%), Caffeic acid (5.69 %), Mallic acid (5.44%), Apigenin (5.28%), Citric acid (5.15%), Gallic acid (4.38%), Cyanidin (3.52%), Ferulic acid (3.51%) etc. Researchers have investigated the average amounts of the key phenolics in different apple varieties. They discovered that the typical phenolic quantities were 13-13.5 mg/100 g fruit for quercetin glycosides; 12.2-12.9 mg/100 g fruit for ascorbic acid; 9.47- 10.32 mg/100 g fruit for procyanidin B; 8.02-9.64 mg/100 g fruit for chlorogenic acid; 8.42-9.04 mg/100 g fruit for epicatechin; and 6.29 -7.02mg/100 g fruit for phloretin glycosides.29 Catechin, chlorogenic acid, Procyanidins, epicatechin, quercetin conjugates, and phloridzin comprise the most abundant phenolics in apple peels. As apple peels possess more such phenolic benign compounds, particularly quercetin, than apple flesh, they may be more biologically active in terms of human health.30 As a result, it is highly recommended to consume apples in their skins. Kirby-Bauer test followed by resazurin microtiter assay technique (REMA) for MIC was used to investigate the antimicrobial activity against six (both GP and GN) bacterial ATCC strains and one yeast and the minimum bactericidal/fungicidal concentration was evaluated by subculturing the pertinent suspensions. All tested peel fractions revealed notable antibacterial action against Pseudomonas aeruginosa, and Staphylococcus aureus while only methanol fraction showed antibacterial action against Salmonella enteritidis and Escherichia coli DH5-Alpha. The chloroform fraction did not show any activity against Salmonella enteritidis, Escherichia coli GIM1.708, Micrococcus leteus, and Escherichia coli DH5-Alpha. Also, there was no activity of ethyl acetate fraction against Salmonella enteritidis and Micrococcus leteus. No fraction possessed the capacity to inhibit the growth of Candida albicans except methanol fraction to some extent. Out of the six bacteria tested, a general trend of MIC and MBC was revealed where a particular concentration of the fraction inhibited the visible growth, the next near-higher concentration proved to be bactericidal. However, this trend confronts exceptions in some cases wherein the highest concentration in the series comes out to be the MBC or no concentration in the series shows the bactericidal activity despite its intermediate or higher concentrations being minimum concentrations that inhibit the visible growth. The MIC of the fractions ranged from 12-20 mg/ml while as lower MBC value recorded was 16 mg/ml. Hence, primary Maharaji peel fractions provide the chance for the discovery of novel, therapeutically viable antibacterial molecules. The current study found that Maharaji peels are a potent source of bioactive compounds possessing tyrosinase inhibitory capabilities. Tyrosinase (EC 1.14.18.1), commonly referred to as polyphenol oxidase, is an oxidoreductase that contributes to the production of melanin, a typical physiological pigment found in the skin, hair, eyes, and various other bodily tissues. Tyrosinase antagonists are drugs that stop the production of melanin.
In order to lighten the skin’s color or depigment hyper pigmentation, tyrosinase inhibitors, mainly synthetic chemicals, are utilised. Nonetheless, these chemicals are hazardous to the skin’s health and might have unwanted adverse reactions, organic alternatives are preferable. Tyrosinase inhibitors have been produced using phenolic and polyphenolic compounds, benzaldehyde derivatives, long-chain fatty acids, steroid compounds, and other natural materials31-32, which supports the findings of the present investigation. According to the results of the current investigation, the polar extract of Malus domestica var. Maharaji polar decoctures are well suited for the treatment of hyper pigmentation conditions such as melisma, malignant melanoma, dark spots, and generalized facial hyper pigmentation. To conclude, this study is giving the highest pharmaceutical priority to the Malus domestica var Maharaji when it comes to human-health benign bioactive compounds to be used in bacterial infections, pigmentation disorders, oxidative stress-related diseases, and other related diseases.
The present study analyzed the secondary bioactive compounds composition of polar peel decocture from Malus domestica var Maharaji indigenous to Kashmir. This study is the first of its kind in the context of this variety. As per the current study carried out via modern hyphenated techniques, this variety packs a big phenolics hoard. Our data demonstrate the versatility and beneficial effects of the peel phenolics of this cultivar in the context of infection and inhibition of melanin-forming enzyme tyrosinase and encourage its consumption. Many epidemiologic investigations have connected apples to a lower risk of chronic illnesses like cardiovascular diseases, cancers, asthma, etc., which is ascribed mostly to the existence of abundant levels of secondary bioactive metabolites in them. As scientists work to explain the mechanism underlying the phenolic compounds’ capacity to lower the risk of chronic diseases like inflammatory disorders, oxidative stress-related ailments, cancers, immune-exaggeration-related illnesses, etc., phenolic and polyphenolic compounds in this variety warrant more study so that they can be exploited for novel bioactive compounds that may be incorporated into managing infectious diseases, pigmentation disorders, inflammatory disorders and aliments related to oxidative stress. Peel powder of this cultivar possessing benign phenolic chemicals can be formulated as capsules and can be used in medicine to take advantage of its therapeutic potential without the negative side effects. This is part of our forthcoming project aimed at organic supplement formulation of apple peel powder of specific cultivars indigenous to Kashmir.
ACKNOWLEDGMENTS
The authors gratefully appreciate the Microbiology Department of Graphic Era (Deemed to be) University for offering the requisite materials and assistance in performing and publishing this research study on pharmacognosy.
CONFLICT OF INTEREST
The authors declare that there is no conflict of interest.
AUTHORS’ CONTRIBUTION
All authors listed have made a substantial, direct, and intellectual contribution to the work, and approved it for publication.
FUNDING
None.
DATA AVAILABILITY
All datasets generated or analyzed during this study are included in the manuscript.
ETHICS STATEMENT
Not applicable.
- Kumar P, Sethi S, Sharma RR, et al. Nutritional characterization of apple as a function of genotype. J Food Sci Technol. 2018;55(7):2729-2738.
Crossref - Sestras RE, Sestras AF. Quantitative Traits of Interest in Apple Breeding and Their Implications for Selection. Plants (Basel). 2023;12(4):903.
Crossref - Shah AA, Gupta A. Antioxidants in Health, and Disease with Their Capability to Defend Pathogens that Attack Apple Species of Kashmir. In: Ekiert HM, Ramawat KG, Arora J. (eds) Plant Antioxidants and Health. Reference Series in Phytochemistry. Springer, Cham. 2021.
Crossref - Garratt MP, Breeze TD, Boreux V, et al. Apple Pollination: Demand Depends on Variety and Supply Depends on Pollinator Identity. PLoS One. 2016;11(5):e0153889.
Crossref - Ahmad SA, Gupta A. Venturiainaequalis post-infection enhancement of secondary metabolites in the peels of delicious apple variety. Mater Today: Proc. 2022;73(1):151-162.
Crossref - Shah AA, Rehman AU, Kapoor S, et al. GC- MS Analysis of Phytoactive Compounds, Antioxidant and Antibacterial Activity of Citrulluslanatus Seeds. Biomed Pharmacol J. 2023;16(1).
Crossref - Zielinska D, Laparra-Llopis JM, Zielinski H, Szawara-Nowak D, Gimenez-Bastida JA. Role of Apple Phytochemicals, Phloretin and Phloridzin, in Modulating Processes Related to Intestinal Inflammation. Nutrients. 2019;11(5):1173.
Crossref - Zolghadri S, Bahrami A, Hassan Khan MT, et al. A comprehensive review on tyrosinase inhibitors. J Enzyme Inhib Med Chem. 2019;34(1):279-309.
Crossref - Pillaiyar T, Manickam M, Namasivayam V. Skin whitening agents: medicinal chemistry perspective of tyrosinase inhibitors. J Enzyme Inhib Med Chem. 2017;32(1):403-425.
Crossref - Tsao R, Yang R, Young JC, Zhu H. Polyphenolic profiles in eight apple cultivars using high-performance liquid chromatography (HPLC). J Agric Food Chem. 2003;51(21):6347-6353.
Crossref - Giomaro G, Karioti A, Bilia AR, et al. Polyphenols profile and antioxidant activity of skin and pulp of a rare apple from Marche region (Italy). Chem Cent J. 2014; 10(8):45.
Crossref - Boyer J, Liu RH. Apple phytochemicals and their health benefits. Nutr J. 2004;12(3):5.
Crossref - Chinnici F, Bendini A, Gaiani A, Riponi C. Radical scavenging activities of peels and pulps from cv. Golden Delicious apples as related to their phenolic composition. J Agric Food Chem. 2004; 52(15):4684-4689.
Crossref - Singh G, Kumar P. Phytochemical study and screening for antimicrobial activity of flavonoids of Euphorbia hirta. Int J Appl Basic Med Res. 2013;3(2):111-6.
Crossref - Ashfaq AS, Amit G, Akshita R, Tanvi P, Neha P, Vijay K. Relative Phenolic Profile, ROS Scavenging, and Anti-haemolytic Potential of Polarity-Driven Peel Bioactive Compounds of Distinct Malus species Indigenous to Kashmir. J Med Pharm Allied Sci. 2023;12(4):5911-5920.
Crossref - VL Singleton, R Orthofer, RM Lamuela-Raventos. Analysis of total phenols and other oxidation substrates and antioxidants by means of folin-ciocalteu reagent. Methods Enzymol. 1998;299:152-178.
Crossref - Primpke S, Wirth M, Lorenz C, Gerdts G. Reference database design for the automated analysis of microplastic samples based on Fourier transform infrared (FTIR) spectroscopy. Anal Bioanal Chem. 2018; 10(21):5131-5141.
Crossref - Krone N, Hughes BA, Lavery GG, Stewart PM, Arlt W, Shackleton CH. Gas chromatography/mass spectrometry (GC/MS) remains a pre-eminent discovery tool in clinical steroid investigations even in the era of fast liquid chromatography tandem mass spectrometry (LC/MS/MS). J Steroid Biochem Mol Biol. 2010;121(3-5):496-504.
Crossref - Nassar MSM, Hazzah WA, Bakr WMK. Evaluation of antibiotic susceptibility test results: how guilty a laboratory could be? J Egypt Public Health Assoc. 2019;94(1):4.
Crossref - Elshikh M, Ahmed S, Funston S, et al. Resazurin-based 96-well plate microdilution method for the determination of minimum inhibitory concentration of biosurfactants. Biotechnol Lett. 2016;38(6):1015-1019.
Crossref - Holla G, Yeluri R, Munshi AK. Evaluation of minimum inhibitory and minimum bactericidal concentration of nano-silver base inorganic anti-microbial agent (Novaron(®)) against streptococcus mutans. Contemp Clin Dent. 2012;3(3):288-293.
Crossref - Cui HX, Duan FF, Jia SS, Cheng FR, Yuan K. Antioxidant and Tyrosinase Inhibitory Activities of Seed Oils from Torreya grandis Fort. ex Lindl. Biomed Res Int. 2018;18:5314320.
Crossref - Dandekar AM, Teo G, Uratsu SL, Tricoli D. Apple (Malus x domestica). Methods Mol Biol. 2006;344:253-261.
Crossref - Bizjak J, Mikulic-Petkovsek M, Stampar F, Veberic R. Changes in primary metabolites and polyphenols in the peel of “braeburn” Apples (Malus domestica Borkh.) during advanced maturation. J Agri Food Chem. 2013;61(43):10283-10292.
Crossref - Sultana B, Anwar F, Ashraf M. Effect of extraction solvent/technique on the antioxidant activity of selected medicinal plant extracts. Molecules. 2009;14(6):2167-80.
Crossref - Rana S, Bhushan S. Apple phenolics as nutraceuticals: assessment, analysis, and application. J Food Sci Technol. 2016;53(4):1727-38.
Crossref - Shafi W, Mansoor S, Jan S, et al. Variability in Catechin and Rutin Contents and Their Antioxidant Potential in Diverse Apple Genotypes. Molecules. 2019 ;24(5):943.
Crossref - Mallampati R, Valiyaveettil S. Apple peels—a versatile biomass for water purification? ACS Appl Mater Interfaces. 2013;5(10):4443-4449.
Crossref - Kschonsek J, Wolfram T, Stockl A, Bohm V. Polyphenolic Compounds Analysis of Old and New Apple Cultivars and Contribution of Polyphenolic Profile to the In Vitro Antioxidant Capacity. Antioxidants (Basel). 2018;7(1):20.
Crossref - Sandip S, Ashfaq AS, Bajpai AB, Rajesh JS, Chandrashekhar PP, Amit Gupta. Fourier transform infrared spectroscopy (FTIR) analysis, antioxidant and anti-inflammatory activities of leaf and fruit extracts of Gymnosporia montana, Mater Today: Proc. 2023; 73 (1):134-141.
Crossref - Zuo AR, Dong HH, Yu YY, et al. The anti-tyrosinase and antioxidant activities of flavonoids dominated by the number and location of phenolic hydroxyl groups. Chin Med. 2018;13:51.
Crossref - Ashfaq A Shah, Vijay Kumar, Amit Gupta. Immunomodulation via Phyto active compounds a promising therapy for future medical system. J Med Pharm Allied Sci. 2021;10(2):126-133.
Crossref
© The Author(s) 2023. Open Access. This article is distributed under the terms of the Creative Commons Attribution 4.0 International License which permits unrestricted use, sharing, distribution, and reproduction in any medium, provided you give appropriate credit to the original author(s) and the source, provide a link to the Creative Commons license, and indicate if changes were made.


