


ISSN: 0973-7510
E-ISSN: 2581-690X
Aditya Saxena1![]() , Uma Chaudhary1
, Uma Chaudhary1![]() , Alok Bharadwaj1
, Alok Bharadwaj1![]() , Nitin Wahi2
, Nitin Wahi2![]() , Jitender Reddy Kalli3
, Jitender Reddy Kalli3![]() , Shravya Gupta3
, Shravya Gupta3![]() , Sparsh Kumar3
, Sparsh Kumar3![]() , Somya Gupta3
, Somya Gupta3![]() and Utkarsh Raj3
and Utkarsh Raj3 ![]()
Severe Acute Respiratory Syndrome Corona Virus-2 (SARS-CoV-2) rose without precedent for Wuhan, China, in December 2019. It is a kind of exceptionally pathogenic human coronavirus (HCoV) which causes zoonotic sicknesses and represents a significant risk to general wellbeing. Recognizing the hidden biology and pathogenesis of this novel coronavirus is extremely critical to comprehend as well as boosting the treatment of this deadly pandemic. The point of this study is to recognize key genes which show significant expression in the SARS-CoV-2 infected lungs as compared to healthy ones. Our analysis uncovered 149 gene-signatures that show substantial up-regulation in COVID-19 lungs. Out of these, top ten dysregulated genes STAP1, CASP5, FDCSP, CARD17, ST20, AKR1B10, CLC, KCNJ2-AS1, RNASE2 and FLG are found to be significant based on various crucial statistical factors and may end up being acceptable helpful drug targets.
SARS-CoV-2, COVID-19, gene signatures
The novel coronavirus – Severe Acute Respiratory Syndrome Corona Virus-2 (SARS-CoV-2) which is the causative agent of recent Coronavirus Disease-2019 (COVID-19) pandemic and has infected around 3.2 million peoples and claimed over 2,24,000 deaths (https://www.who.int/docs/default-source/coronaviruse/situation-reports/20200501-covid-19-sitrep.pdf?sfvrsn=742f4a18_2 )1-3. It is not just a health crisis but has become the cause of global public, financial and political turmoil. No vaccine and antiviral drug are available right now for its clinical management.
It is therefore imperative to study the host response toward the viral infection at the cellular level in order to enhance our understanding of the disease pathophysiology and be able to identify drug molecules for combating the disease. To meet these ends, a recent brilliant study conducted at Icahn School of Medicine at Mount Sinai, New York, USA generated an RNA-seq datasets comprising in vitro, ex vivo, and in vivo systems of SARS-CoV-2 and other related viruses’ infection4.
In our study, we focused on the re-analysis of four of these samples to extract some new information beyond the original publication.
The RNA-Seq dataset GSE147507 containing the gene count matrix of the samples of Healthy lung biopsy (GSM4462413, and GSM4462414) and COVID-19 lung (GSM4462415, and GSM4462416) used in this research was taken from the Gene Expression Omnibus (GEO) database [5] and submitted by Daniel et al. [4] The preprocessing of the data began with the filtering of those genes which are at low-count level. In this study, filtering was done by taking low count filtering method: Mean (filter features where Row Means < 10) and normalization of the data was carried out by trimmed mean of M-values normalization (TMM) normalization method. Since, the count data obtained from a sequencing based experiment may also be affected from the depth of sequencing and the variations in the composition of the features that are detected. Therefore, the TMM normalization method was deployed in our study to estimate relative RNA production levels from RNA-seq data. The checking of the quality and normalization of the data used was carried out by using R /Bioconductor software & packages [6]. EdgeR is a software package for analyzing the differential expression profile of replicated data at the exon, gene, transcript as well as tag level. A characteristic feature of its functionality comprises of empirical Bayes based methods which allows the assessment of biological variation at gene-specific level. In addition, it may also be used for those experiments in which low levels of biological replication exist. It also utilizes TMM normalization for the differential analysis purpose.
Differential expression analysis can be performed by various statistical tests. In this study, we used EdgeR as the differential Expression method using TMM normalization and zero dispersion with exact test. Statistically significant parameters such as p-value, fold-change, adjusted-p value, were also calculated. The Gene Ontology (GO) analysis for the biological process and human phenotype ontology were also performed using Enrichr tool7. Further, the protein-protein interaction (PPI) network was also constructed utilizing STRING8 for all the DEGs obtained after analysis.
The samples obtained from GEO dataset originally contain 21795 genes/regions but filtering of this data is very much required in order to obtain differentially expressed genes as it eliminates the undesirable variation sources. After this preprocessing, the no. of genes/regions came down to 13890. Box plot and Density plot were used to check the quality of the data as shown in Figure 1 (A) and 1(B) respectively.
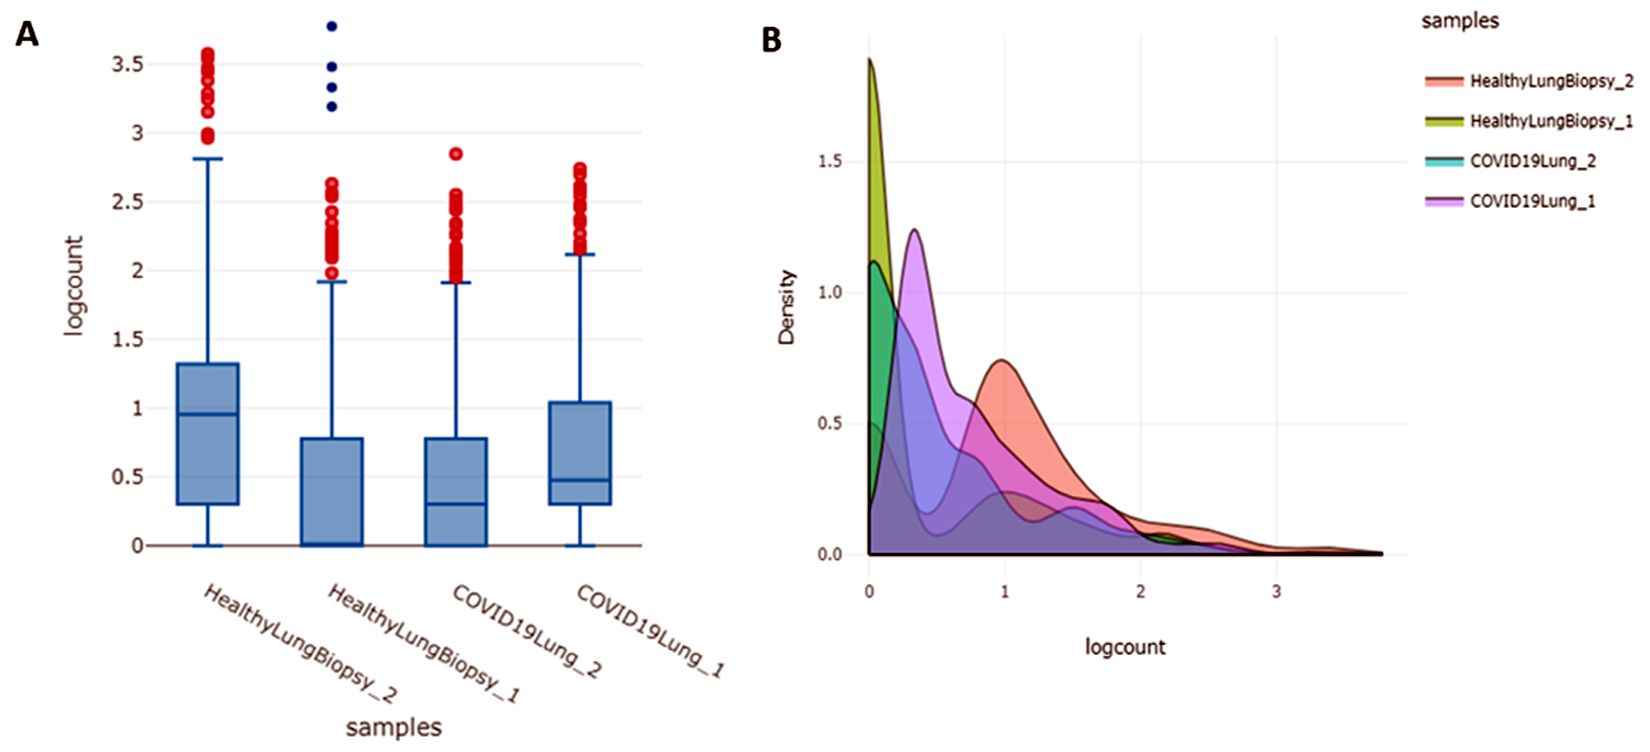
Fig. 1. (A) Boxplot for describing center and variability of the data used in the study; (B) Density plot which uses a kernel density estimate to show the probability density function of the variable.
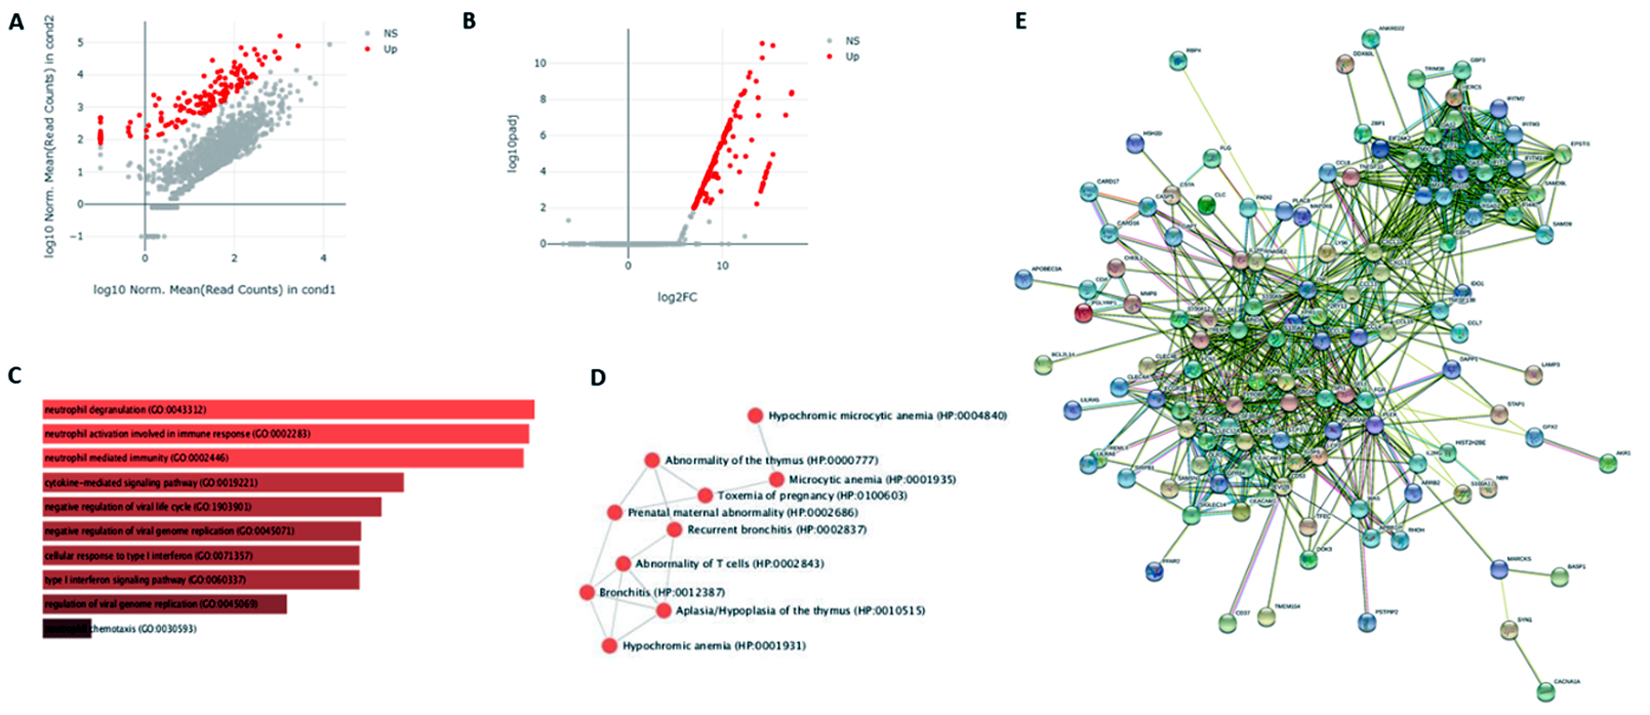
Fig. 2. (A) Scatter Plot (log10 Normalized Mean (Read Counts) in condition 1 against log10 Normalized Mean (Read Counts) in condition 2); (B) Volcano Plot (log10 padj. Vs log2 FC); (D) GO – Biological Process; (D) Human Phenotype Ontology; (E) PPI network of screened significant DEGs.
The identification of Differentially Expressed Genes (DEGs) in COVID-19 affected lung is vital for strategy development in order to detect and treat this pandemic. Normally, for DE analysis, both fold-change and p-value are considered to be the most important factors. Therefore, we took those genes which are having adj. p-value less than 0.01 and log Fold Change greater than 2 and 149 DEGs were screened for further analysis. The scatter plot and volcano plot were also obtained in order to decipher the regulation of the genes as shown in Figure 2(A) and 2(B) respectively9. It is clear from the plots that the DEGs obtained only show up-regulation, no down-regulated genes were obtained based on the significant threshold we choose. The top ten DEGs in the decreasing order of their fold change were mentioned in the Table 1.
Table (1):
Top ten screened significant DEGs in the decreasing order of their log2 Fold change.
ID |
Healthy Lung Biopsy_2 |
Healthy Lung Biopsy_1 |
COVID-19 Lung_2 |
COVID-19 Lung_1 |
p-adj |
log2 Fold Change |
|---|---|---|---|---|---|---|
STAP1 |
0 |
0 |
643.0631886 |
300.9525922 |
4.00E-09 |
17.39775747 |
CASP5 |
0 |
0 |
560.4426505 |
361.9752376 |
4.97E-09 |
17.35103906 |
FDCSP |
0 |
0 |
462.6750137 |
227.448042 |
7.41E-08 |
16.74612725 |
CARD17 |
0 |
0 |
294.6799194 |
65.18328034 |
1.10E-05 |
15.38866926 |
ST20 |
0 |
2.931208312 |
2880.702764 |
1891.702008 |
1.04E-11 |
15.38019554 |
AKR1B10 |
0 |
0 |
280.9098297 |
22.19005288 |
3.61E-05 |
15.02959596 |
CLC |
0 |
0 |
220.3214351 |
63.79640203 |
5.48E-05 |
14.89798936 |
KCNJ2-AS1 |
0 |
0 |
143.2089328 |
117.8846559 |
9.53E-05 |
14.72655049 |
RNASE2 |
0 |
0 |
150.0939776 |
102.6289946 |
0.000127291 |
14.65793047 |
FLG |
0 |
0 |
1.377008969 |
237.1561902 |
0.000201618 |
14.54883138 |
The GO component: Biological process was calculated by taking all 149 DEGs into consideration and the top GO sorted based on p-value ranking has been depicted in Figure 2(C). Similarly, human phenotype ontology was calculated in order to obtain a standardized vocabulary of phenotypic abnormalities encountered in human disease as shown in Figure 2(D).
STRING database [8] was used for the construction of PPI network of all screened DEGs. The least required interaction scoring was kept to 0.400 at the level of medium confidence and active interaction sources such as Experiments, Text mining, Co‑expression, Databases, Neighborhood, Co‑occurrence, and Gene Fusion were used. The disconnected nodes were removed as they are supposed to be less significant. The obtained network consists of 144 nodes & 770 edges (with an enrichment p-value of PPI less than 1.0e-16). The average node degree and avg. local clustering coefficient was found to be 10.7 and 0.545, respectively. The important functional enrichments in the network has been depicted in the Figure 3.
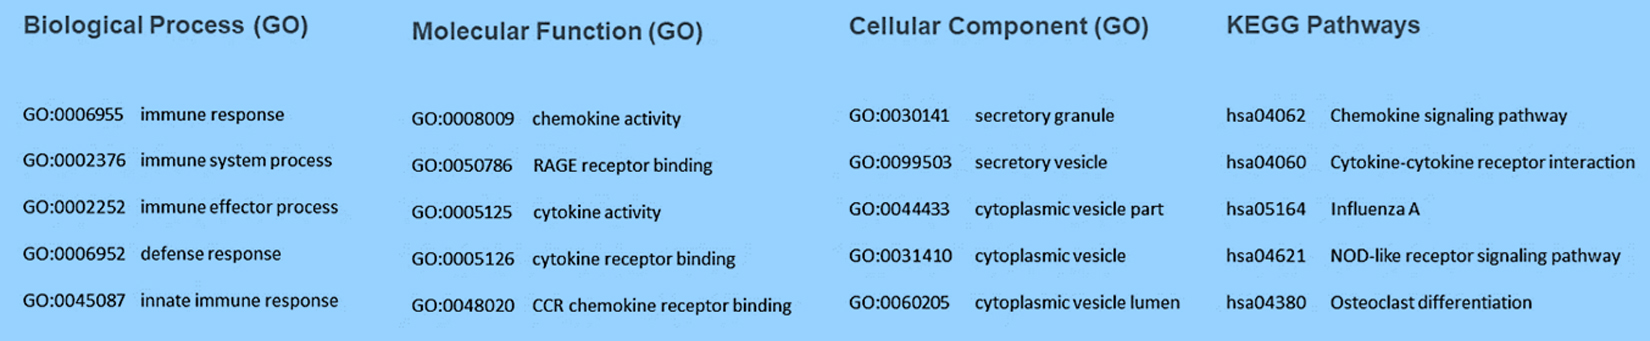
Fig. 3. Functional Enrichment analysis (top five GO terms and pathways) in the network involving all the three components of Gene Ontology and KEGG Pathways.
The pathway and GO analysis of the significant signature genes enrich various immune-system related terms such as chemokine signaling pathway, cytokine-cytokine receptor interaction, NOD-like receptor signaling pathway, cytokine receptor binding, CCR chemokine receptor binding, and cytokine activity. Clearly, viral infection mounts a cytokine storm [10] which may lead to acute respiratory distress syndrome (ARDS) as well as acute lung injury (ALI), often leading to reduction proper functioning of the lungs or even death [4].
Top dysregulated proteins were also found to be involved in similar processes. Protein STAP1 in macrophage colony-stimulating factor receptor binding, CASP5, and ST20 in apoptosis, FDSCP in regulator of antibody responses, CARD17 in expression of pro-inflammatory cytokine IL-1b, CLC for immune suppression, interestingly protein RNASE2 is involved in antiviral activity against respiratory syncytial virus and its agnostics may be used as effective agent against COVID-19 [11]. We foresee our re-analysis would help researchers in designing effective therapeutics by screening some of these genes.
The samples, we have used in our analysis were not from in vitro, or from animal models but from COVID-19-infected patients. Given the paucity of gene expression data available on this disease, we hope our analysis could be further exploited for identification of potential drug targets. One limitation of this study is that – it actually requires a large number of samples for more robust analysis that our study lacks indeed.
In future, we intend to incorporate our outcomes from the re-analysis of RNA-seq data with other samples present in the GEO dataset and try to investigate the variation in the sequence (SNPs) and their impact on this deadly disease.
ACKNOWLEDGMENTS
None.
CONFLICT OF INTEREST
The authors declares that there is no conflict of interest.
AUTHORS’ CONTRIBUTION
All the listed author(s) have made a substantial, direct and intellectual contribution to the work, and approved it for publication.
FUNDING
None.
ETHICS STATEMENT
This article does not contain any studies with human participants or animals performed by any of the authors.
AVAILABILITY OF DATA
Not applicable.
- Huang C, Wang Y, Li X, Ren L, Zhao J, Hu Y, et al. Clinical features of patients infected with 2019 novel coronavirus in Wuhan, China. The Lancet. 2020;395:497–506.
Crossref - Lai C-C, Shih T-P, Ko W-C, Tang H-J, Hsueh P-R. Severe acute respiratory syndrome coronavirus 2 (SARS-CoV-2) and corona virus disease-2019 (COVID-19): the epidemic and the challenges. Int J Antimicrob Agents. 2020;105924.
Crossref - Wang C, Horby PW, Hayden FG, Gao GF. A novel coronavirus outbreak of global health concern. The Lancet. 2020;395:470–473.
Crossref - Blanco-Melo D, Nilsson-Payant BE, Liu W-C, Moller R, Panis M, Sachs D, et al. SARS-CoV-2 launches a unique transcriptional signature from in vitro, ex vivo, and in vivo systems. BioRxiv. 2020:2020.03.24.004655.
Crossref - Clough E, Barrett T. The gene expression omnibus database. Stat. Genomics, Springer. 2016;93–110.
Crossref - Gillespie CS, Lei G, Boys RJ, Greenall A, Wilkinson DJ. Analysing time course microarray data using Bioconductor: a case study using yeast2 Affymetrix arrays. BMC Res Notes. 2010;3:81.
Crossref - Kuleshov MV, Jones MR, Rouillard AD, et al. Enrichr: a comprehensive gene set enrichment analysis web server 2016 update. Nucleic Acids Res. 2016;44:W90–W97.
Crossref - Szklarczyk D, Franceschini A, Wyder S, Forslund K, Heller D, Huerta-Cepas J, et al. STRING v10: protein–protein interaction networks, integrated over the tree of life. Nucleic Acids Res. 2015;43:D447–D452.
Crossref - Li W, Freudenberg J, Suh YJ, Yang Y. Using volcano plots and regularized-chi statistics in genetic association studies. Comput Biol Chem. 2014;48:77–83.
Crossref - Ye Q, Wang B, Mao J. Cytokine Storm in COVID-19 and Treatment. J Infect. 2020.
- Domachowske JB, Bonville CA, Dyer KD, Rosenberg HF. Evolution of antiviral activity in the ribonuclease A gene superfamily: evidence for a specific interaction between eosinophil-derived neurotoxin (EDN/RNase 2) and respiratory syncytial virus. Nucleic Acids Res. 1998;26:5327–5332.
Crossref
© The Author(s) 2020. Open Access. This article is distributed under the terms of the Creative Commons Attribution 4.0 International License which permits unrestricted use, sharing, distribution, and reproduction in any medium, provided you give appropriate credit to the original author(s) and the source, provide a link to the Creative Commons license, and indicate if changes were made.