


ISSN: 0973-7510
E-ISSN: 2581-690X
A dual step statistical approach including Plackett-Burman combined with response surface methodology was used to enhance xylanase production by Bacillus sp. Using the mentioned approach, three fermentation variables (xylan, ammonium sulphate and pH), were showed significant effect on xylanase production out of all the variables studied for fermentation. The enzyme was found to be optimally active at pH 8.5 and 45 °C. A high enzyme titre of 95.46 U/ml was attained at ammonium sulphate concentration of 0.3% and pH (8.5). The enzyme may be used for hydrolysis of xylan and can be used in the bleaching and food processing industry.
Bacillus, Xylanase, RSM, CCD, Enhancement
Xylanase are enzymes that hydrolyse xylan, a heteropolysaccharide consisting of D-xylose monomers into xylose. Xylan is a commonly occurring polymer in plant cell walls. Many bacteria and fungi are known to produce xylanase and possess a range of environmental applications.1 The pollutants from paper and pulp industry impact largely and thus are of concern for environment. So, it is a rapid growing research area involved in the development of novel bleaching techniques. Almost all chloro aromatic compounds that emits during the process of pulp bleaching are toxic and gather in the ecosystem in abiotic as well as biotic components.2 The seepages from paper mills are also of serious concern to the aquatic life as it causes harmful effect on fish.3 The chemical paper pulp is widely being used for manufacturing of baby diapers and food packaging that raises an alarm as some chlorinated compounds for example 2,3,7,8-TCDD (Tetra Chloro Dibenzo-p-Dioxin) are carcinogenic.4 Xylanase produced from bacteria usually have higher activity. Higher activity is desirable for food processing and bleaching processes.5 The present study reports the isolation, identification and optimization of submerged production medium using Plackett-Burman and response surface technology.
Sample collection
20 samples were collected from diverse geographical locations for isolation of xylanase producing bacteria. Samples from soil were collected by a disinfected spatula from 10 cm below soil surface in disinfected plastic bags. Three sequential dilutions were prepared for each sample (10-1, 10-2, 10-3) in normal sterile saline. Selective medium for xylanase (xylanase screening medium) was prepared. 100 µl of each dilution was spread on selective medium and the plates were incubated at optimal temperature 45 °C for 24-72 h. Plates were detected for colonies with different characteristics like size, shape and presence of spores and dissimilar colonies were sub cultured onto freshly prepared nutrient-rich agar medium.6 All the isolates were preserved as glycerol stocks at -20 °C for further use.
Isolation of xylanase-secreting bacteria
The xylanase producing bacterial isolates were spot inoculated onto xylanase screening medium (Birch wood xylan 2 g, Yeast extract 3 g, Ammonium sulphate, 0.2 g Sodium bicarbonate 20 g, Agar 15 g, pH 11, Distilled water 1 L) and incubated for 24-48 h. Plates were swamped with Congo red and 0.1 M NaCl, respectively. The bacterial colonies that have xylanase activities will show a region of substrate hydrolysis on solid medium. The bacterial isolates showing clear hydrolysis zones were chosen for further investigation.
Xylanase enzymatic assay
50 mL xylanase production broth was taken, and potential bacterial isolates were inoculated in it. Broth was incubated in a rotatory shaker (250 rpm) at 45 °C for 72 h. 3 mL cultures were withdrawn from flasks on regular intervals and centrifuged. Centrifugation was done at 10,000 rpm for 10 min. The supernatant free of cells thus obtained after centrifugation was selected as the source of xylanase enzyme. Xylanase assay was conducted by measuring the quantity of xylan as a substrate. The reaction mixture contained approximately 0.5 mL diluted xylan. The reaction was performed at 45 °C for a period of 10 min and ceased with the addition of 1 mL of DNSA (di nitro salicylic acid reagent) and followed by 0.4 mL of 33% sodium potassium tartrate. The xylanase released was determined spectrophotometrically at 540 nm. A standard curve was plotted according to Miller.7
pH and temperature optimization
The enzyme was incubated on different pH and temperatures to identify the optimum range at which enzyme activity is maximum. The enzyme’s optimal pH range was determined. It is done by incubating reaction mixture on varied pH. The temperature at which the enzyme performs best was also determined. This is done by incubating the reaction mixture at varied temperature. After incubation xylanase activity was assayed.
Identification of xylanase producing bacterial isolates
The bacterial isolates producing xylanase were observed for morphology of colony, microscopic examination (gram staining) and biochemical test were performed such as Catalase, Oxidase, Gelatin liquefaction and endospore staining to identify the gram reaction and physiology of isolates.
Optimisation of submerged fermentation parameters for xylanase production by statistical approaches
A two factorial Plackett-Burman Design was applied for optimizing the parameters for improved fermentation for production of xylanase by selected isolate. This design is used to recognize important parameters including physical and chemical that are necessary for enhanced enzyme production. This is accomplished by performing N+1 experiments in screening N numbers of variables.8 In these two minima (-) and two maximum (+) values were chosen for each variable (Table 1). The highest enzyme production is indicated by the peak area. Better results may be obtained if the variation between the two values (minimum and maximum) is large. The experimental design includes the evaluated experimental design. Eleven variables were analysed that includes three dummies (for evaluation of error), seven nutritional and one physical variable. Experimental error was computed using the following equation9:
Veff = ∑(Ed)2 / N
Where,
Veff = the variance of the effect of level
Ed = the effect of level for the dummy variables
N = the number of dummy variables used in the experiments.
As per Plackett-Burman design, three critical variables were identified. Additional, optimization was carried out using Central Composite Design.10
Table (1):
Showing code values variable, maximum and minimum used in the Plakett-Burman design
Independent variable (%) |
Lower limit |
Upper limit |
|---|---|---|
Inoculum |
1 |
3 |
Magnesium sulphate |
0.00 |
0.03 |
Potassium hydrogen sulphate |
0.01 |
0.2 |
Xylan |
0.1 |
0.3 |
Yeast extract |
0.1 |
0.4 |
Ammonium sulphate |
0.1 |
0.4 |
pH |
7 |
10 |
Table (2):
Code values of variables in CCD
Independent Variable |
-α |
-α |
α |
+α |
+α |
|---|---|---|---|---|---|
Xylan |
0.10% |
0.20% |
0.30% |
0.40% |
0.50% |
Ammonium Sulphate |
0.10% |
0.20% |
0.30% |
0.40% |
0.50% |
pH |
7 |
8 |
9 |
10 |
11 |
The statistical tool used for experimental design analysis was ‘Design Expert 6.0’ Stat-Ease, Inc. Minneapolis, USA. The effect substrate concentration, ammonium sulphate and pH on xylanase secretion was observed across five distinct concentrations (Table 2).
Twenty experimental runs were carried out and xylanase activity was measured. Experiments were done in triplicates. The data was analysed by multiple regression procedure and polynomial equation (second order)7.
The equation for analysis is as follows:
Y = β0 + ∑βixi + ∑βiixi2 + ∑βij + xixj
Where,
y = predicted response
β0 = offset term
βi = linear effect
βii = squared effect
βij = interaction effect
xi = independent variables
xj = independent variables
Using design expert software, contour plots were generated.
Isolation and identification of microorganisms
Isolation of bacterial isolates was performed on xylanase screening agar medium. The total of 10 bacterial isolates were obtained from different samples.
Screening of bacterial isolates for enzyme production
All the 10 isolates were screened for the possibility of producing commercially viable enzyme including phytase, pectinase, cellulase, xylanase, amylase and lipase (Table 3).
Table (3):
Result of different enzymes produced by the isolates
Culture ID |
RC1 |
RC2 |
RC3 |
RC4 |
RC5 |
RC6 |
RC7 |
RC8 |
RC9 |
RC10 |
|---|---|---|---|---|---|---|---|---|---|---|
Xylanase |
+ |
– |
+ |
– |
+ |
+ |
– |
+ |
+ |
– |
Cellulase |
– |
– |
+ |
+ |
– |
– |
– |
+ |
+ |
– |
Amylase |
+ |
+ |
– |
– |
– |
– |
+ |
– |
– |
– |
Pectinase |
+ |
+ |
– |
– |
– |
+ |
+ |
– |
– |
+ |
Phytase |
– |
– |
+ |
– |
– |
– |
– |
– |
+ |
– |
Lipase |
– |
– |
– |
+ |
– |
+ |
+ |
– |
– |
– |
Qualitative and quantitative screening for xylanase enzyme
Qualitative screening was resulted in the isolation of six xylanase producing Bacillus isolates (Figure 1 and 2). Based on the larger size of zone of hydrolysis, strain selected and quantitatively screened for xylanase production in xylan containing broth. Strains were producing comparable titre of xylanase.
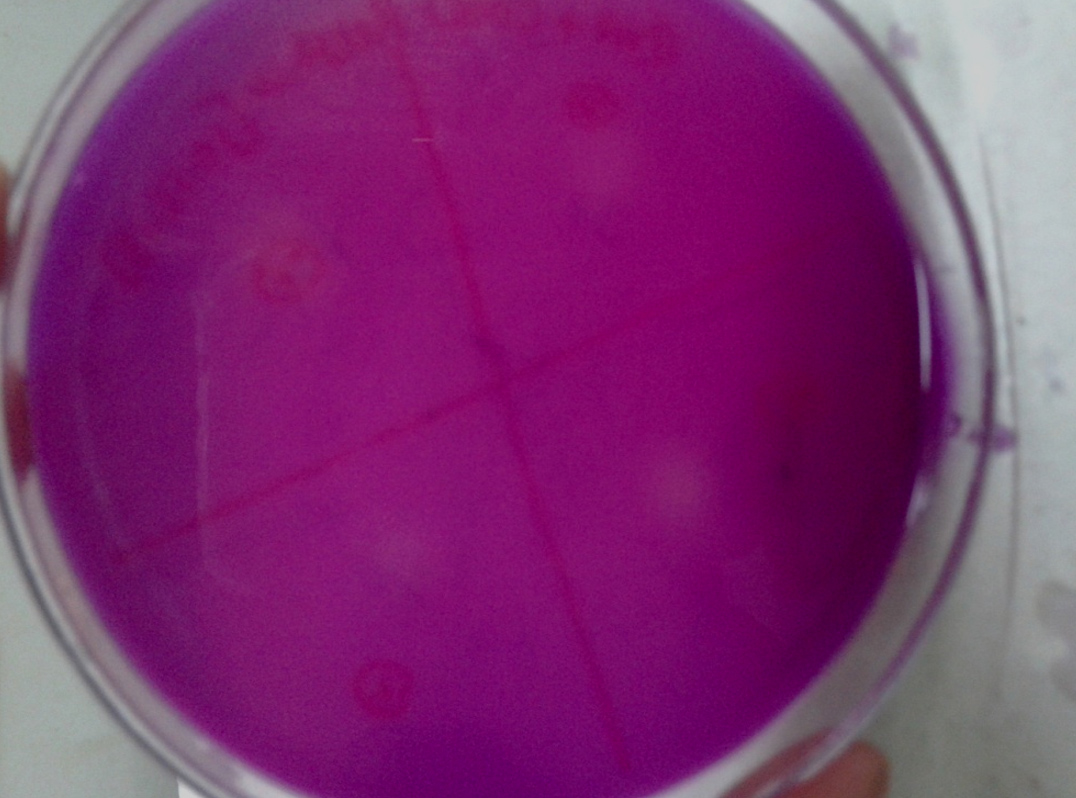
Figure 1. Zone of hydrolysis shown by positive isolates
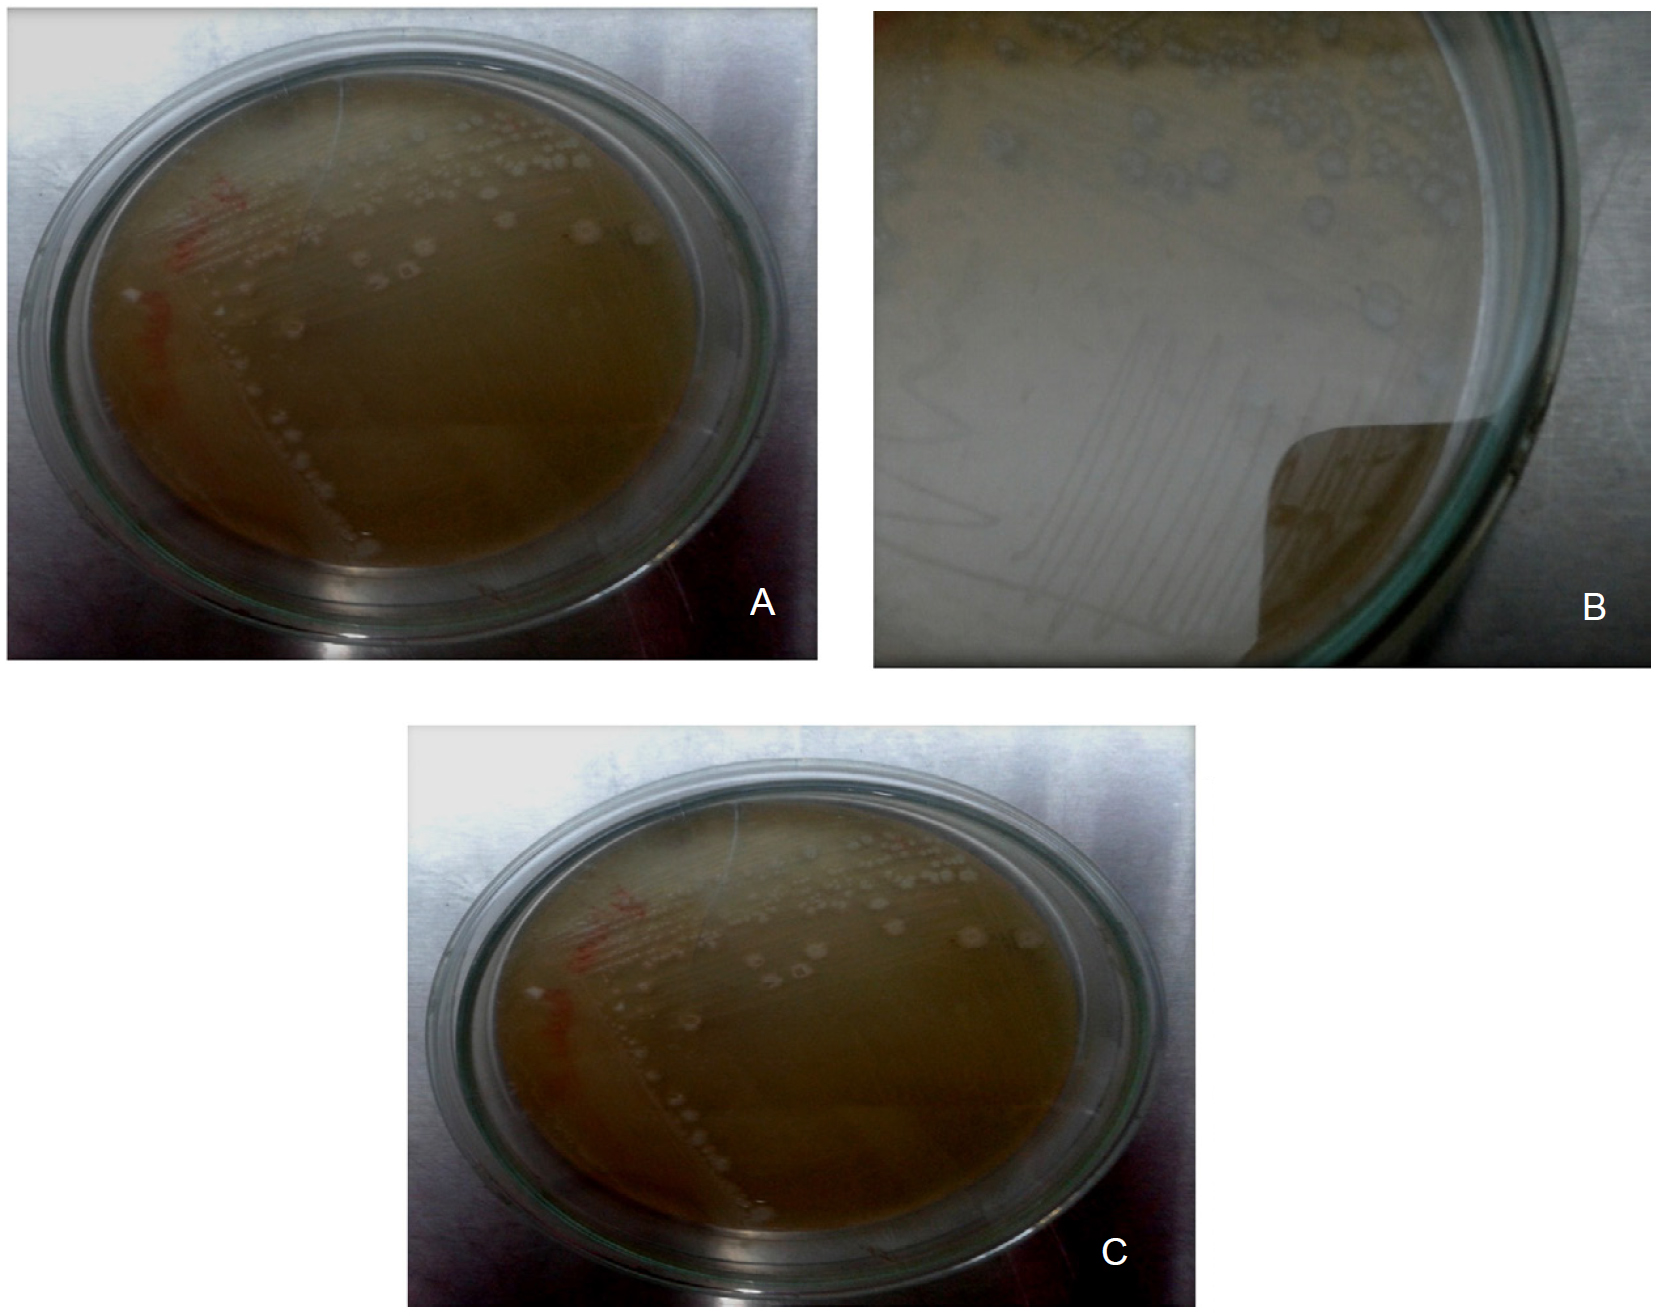
Figure 2. Colony morphology of some xylanase producers (A-RC1; B-RC3; C-RC5)
The highest xylanase producers were subjected to gram’s staining (Figure 3) and series of biochemical test like catalase, gelatine liquefaction and oxidase to identify the shape, gram reaction and physiology of isolated cultures, respectively. Microscopy showed the presence of gram’s positive rods. Six isolates were observed to be catalase positive as well as positive for oxidase test (Table 4).
Table (4):
Result of different enzymes produced by the isolates
No. |
Isolates ID |
Oxidase Test |
Catalase Test |
|---|---|---|---|
1 |
RC1 |
+ |
+ |
2 |
RC2 |
– |
– |
3 |
RC3 |
+ |
+ |
4 |
RC4 |
– |
– |
5 |
RC5 |
+ |
+ |
6 |
RC6 |
+ |
+ |
7 |
RC7 |
– |
– |
8 |
RC8 |
+ |
+ |
9 |
RC9 |
+ |
+ |
10 |
RC10 |
– |
– |
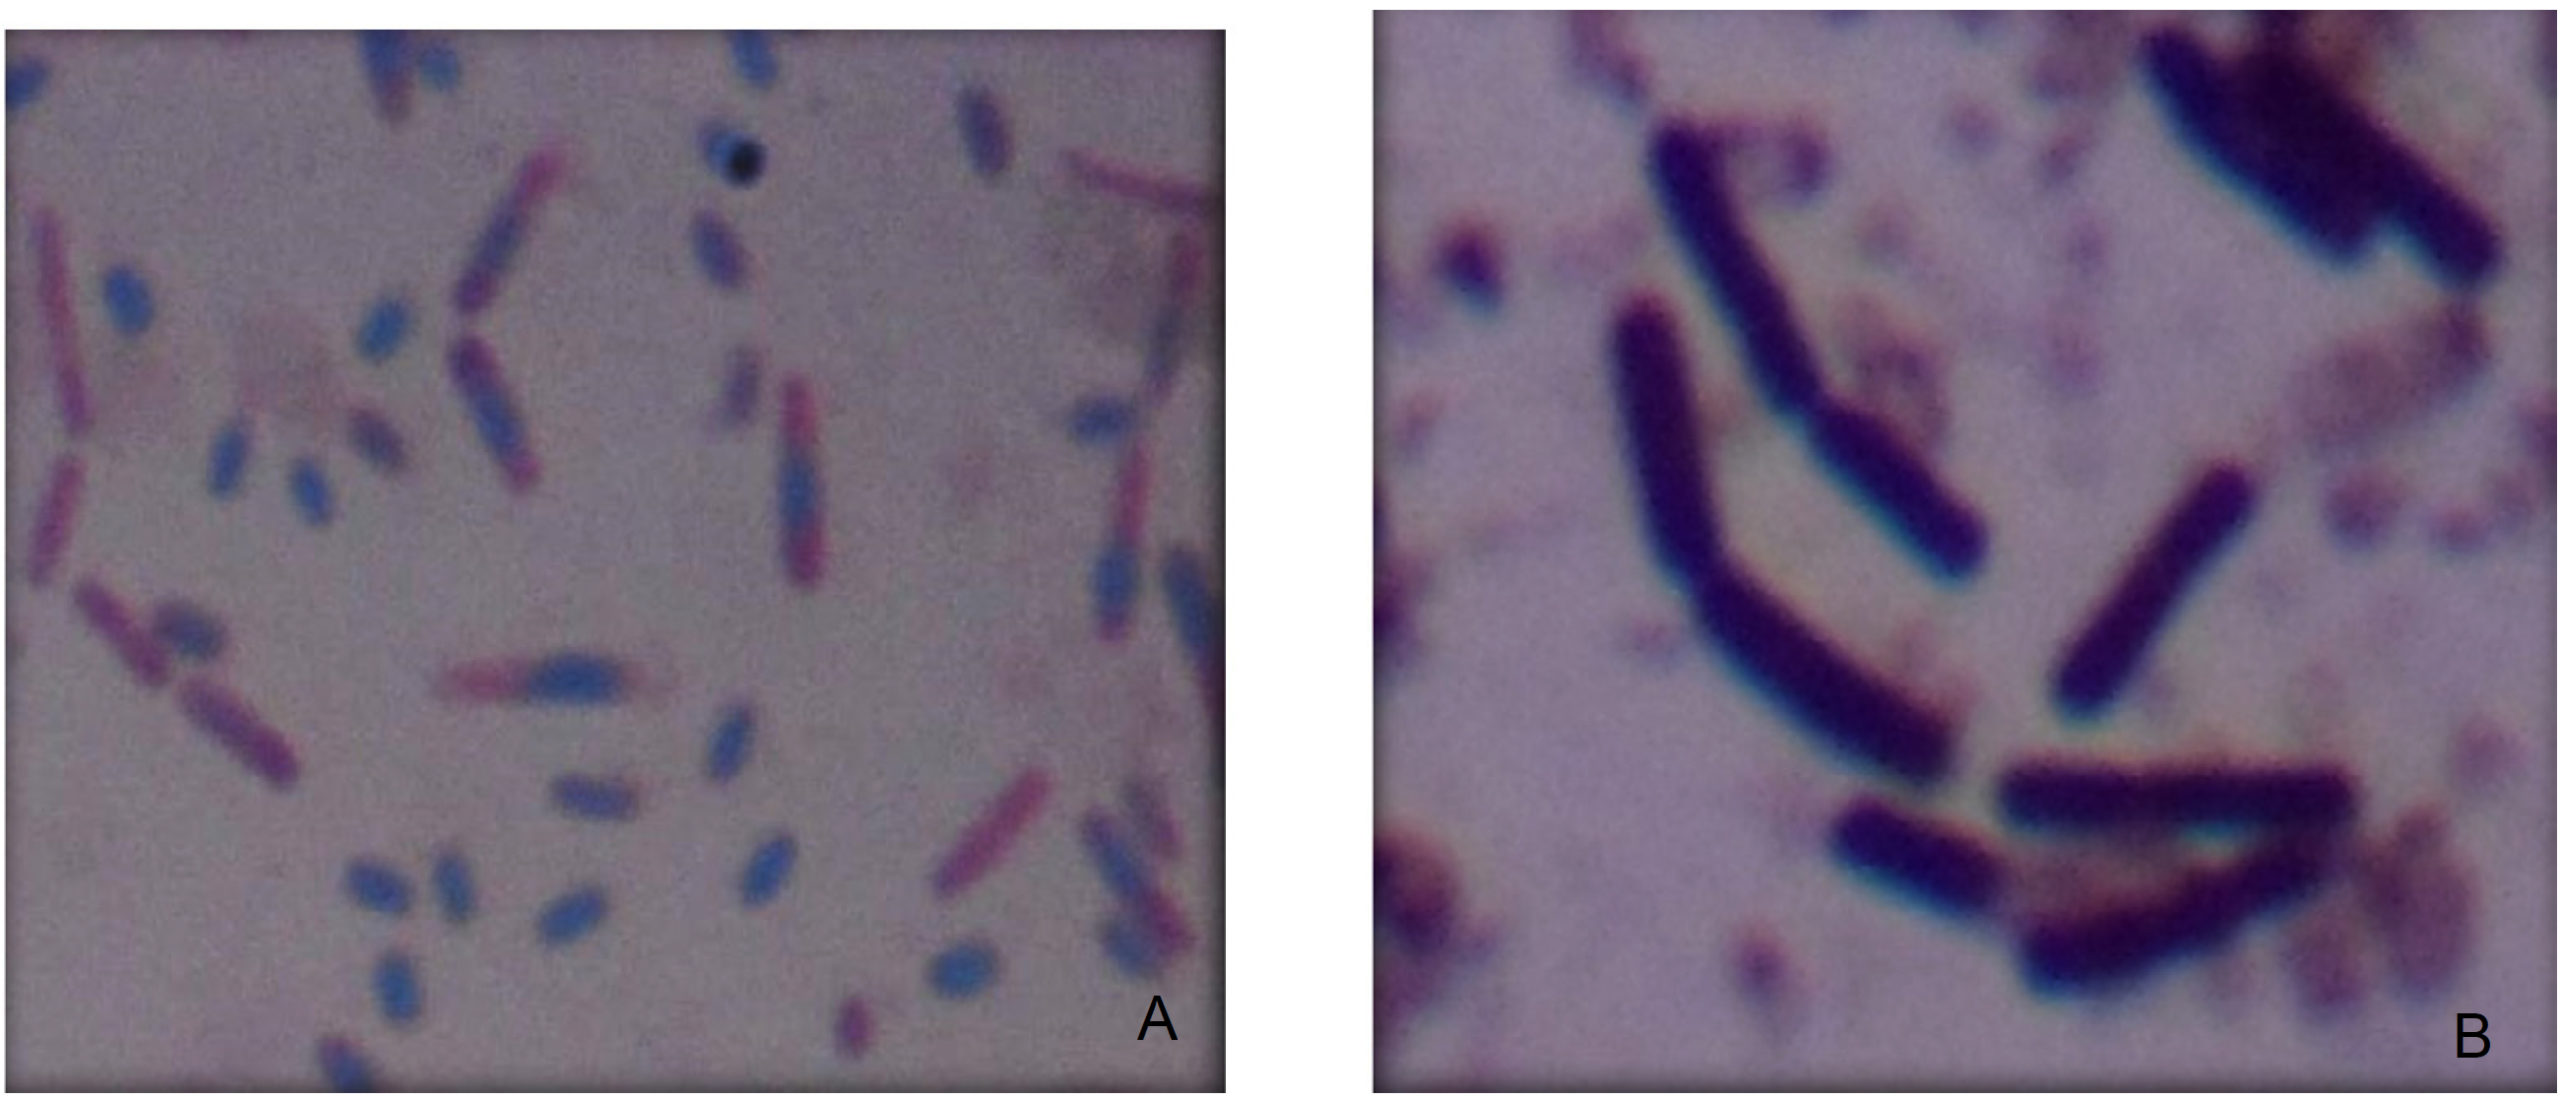
Figure 3. Gram staining of xylanase producer. A and B showing RC5 (highest xylanase producer) as gram positive rod shaped
Optimization of submerged fermentation factors for xylanase secretion by statistical approaches
Plackett-Burman design was used to analyse the effect of eleven variables (including two dummy) on xylanase production by the selected isolate. Variability in three factors (xylan, ammonium sulphate, pH) significantly affected xylanase production. None of the dummy factors showed impact on enzyme production, which confirmed the validity of the Plackett-Burman design. In addition, the coefficient of determination (R2) of the model was 0.9935 that could explain up to 99.53% variability of the data. The F-value of 34.06 implied that the model was significant. Prob > F-value of less than 0.005 was further substantiated that the model terms were significant. The optimization of xylanase production from Penicillium sp. WX-Z1 using Plackett-Burman design has also been studied.11
The three significant factors (concentration of xylan and ammonium sulphate along with pH) were further optimized using RSM and the results obtained by CCD (Table 5) were analyzed by standard analysis of variance (ANOVA).
Table (5):
Showing the experimental plan results of CCD, the 20-treatment combination
Run |
Xylan g/ml |
Ammonium sulphate in g/ml |
pH |
Xylanase activity (predicted value) UL-1 |
Xylanase activity (actual value) UL-1 |
|---|---|---|---|---|---|
1 |
0.20 |
0.20 |
8.00 |
57070 |
59990 |
2 |
0.40 |
0.20 |
8.00 |
53820 |
62100 |
3 |
0.20 |
0.20 |
10.00 |
68130 |
64910 |
4 |
0.40 |
0.20 |
10.00 |
56780 |
54590 |
5 |
0.20 |
0.40 |
8.00 |
47380 |
56700 |
6 |
0.40 |
0.40 |
8.00 |
55500 |
65850 |
7 |
0.20 |
0.40 |
10.00 |
53630 |
52480 |
8 |
0.40 |
0.40 |
10.00 |
53650 |
57880 |
9 |
0.10 |
0.30 |
9.00 |
52550 |
51310 |
10 |
0.50 |
0.30 |
9.00 |
49840 |
40990 |
11 |
0.30 |
0.30 |
7.00 |
53510 |
38600 |
12 |
0.30 |
0.30 |
11.00 |
61260 |
66080 |
13 |
0.30 |
0.10 |
9.00 |
71240 |
71240 |
14 |
0.30 |
0.50 |
9.00 |
60460 |
50370 |
15 |
0.30 |
0.30 |
9.00 |
97690 |
97980 |
16 |
0.30 |
0.30 |
9.00 |
97690 |
97980 |
17 |
0.30 |
0.30 |
9.00 |
97690 |
97980 |
18 |
0.30 |
0.30 |
9.00 |
97690 |
97980 |
19 |
0.30 |
0.30 |
9.00 |
97690 |
97980 |
20 |
0.30 |
0.30 |
9.00 |
97690 |
97980 |
The ‘F’ Value and ‘Prob > F-value’ after ANOVA were 11.51 and <0.0005, respectively, indicating the significance of model. The coefficient of the determination (R2) value used 0.9120 for xylanase secretion. This indicates 91.20% variability of the response. The adequate precision suggested an adequate signal with noise ratio of 26.879.12 The predicted R2 value (0.3312) suggest a strong agreement with experimental values for xylanase production.
A 3D plot was plotted to show the interaction of different physiochemical parameters. The plot had two independent variables on two axis while xylanase production on z-axis
(Figure 4). Show a response surface plot representing interaction between ammonium sulphate and pH on xylanase production.
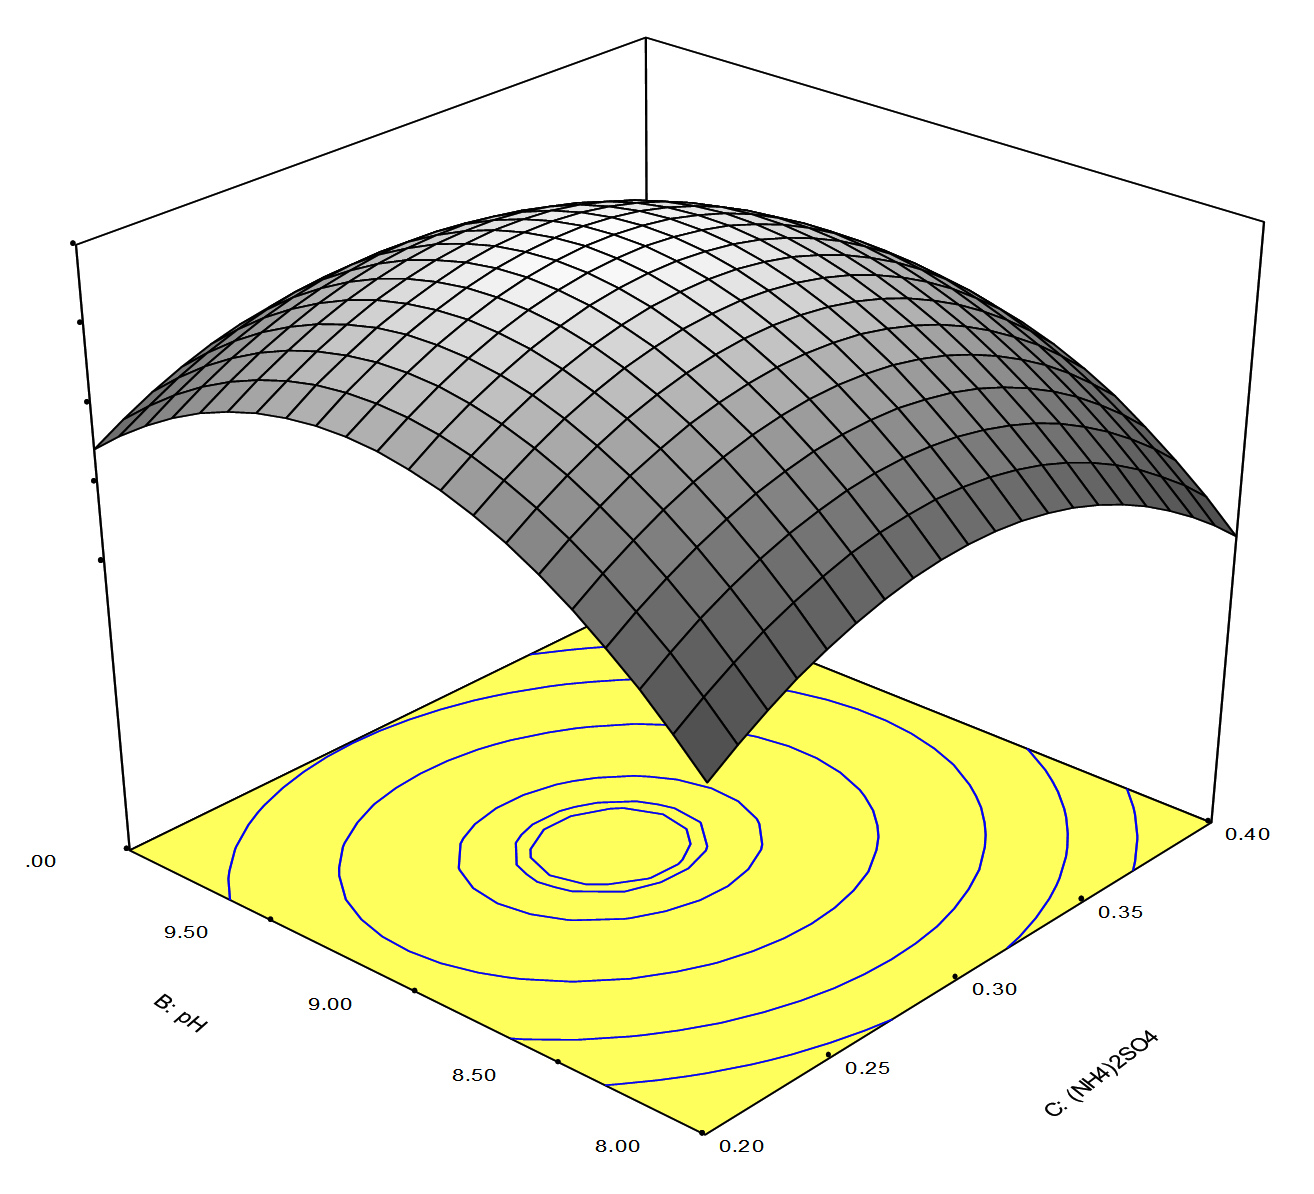
Figure 4. Response surface plot representing the interaction between ammonium sulphate and pH on xylanase
An initial linear increase in xylanase production was observed when xylanase concentration and inoculum were level increased followed by decline after reaching plateau 95.00 U/ml. The concentration of ammonium sulphate was enhanced from 0.1% to 0.3% with a maximum increase at the 0.3% of ammonium sulphate and pH (8.5). Response surface graph was mostly used to discover the optima of the variables, for which the response was maximum. Response surface curve of xylan concentration and pH revealed that when the level of both parameters is higher the xylanase production is decreased (Figure 4). Thus, ammonium sulphate concentration of 0.3% and pH (8.5) were vital for achieving a high enzyme titre of 95.46 U/ml.
Model validation
To validate the model, Xylanase production was attempted under conditions predicted by RSM.13 It was found that the enzyme production in shake flask was similar to the CCD predicted xylanase production.
The production of alkaline xylanase by Bacillus sp. embraces great potential for various industrial applications, including biofuel, pulp and paper, and textile industries. Alkaline conditions are often essential for efficient enzymatic processes. The present study aimed to enhance the production of alkaline xylanase from Bacillus sp. by optimizing fermentation conditions through a sequential design approach using the Plackett-Burman (PB) design for screening, followed by Central Composite Design (CCD) for response surface optimization. The xylanase enzyme has wide application commercially in paper, pulp and food industries. It has also been reported that only a few bacteria and actinomycetes are known to produce xylanase in the neutral or alkaline range.14 Other researches also have reported the similar findings.15 The nutrition sources in a culture medium for the production of xylanase from Penicillium sp. WX-Z1 using Plackett-Burman design and Box-Behnken design was also optimized and it was observed that this statistical experimental design resulted in an increase in the xylanase production under optimal condition and xylanase activity increases 1.34-fold as compared with the original medium.16 It was detected that xylanase produced by Streptomyces sp. QG-11-3 could efficiently be induced using wheat bran for improved and elevated xylanase production.17 The substrate concentration plays a vital role and is of outmost importance for the production of xylanase by A. awamori.18 Incubation temperature, initial medium pH, and agitation speed parameters were optimized by RSM in the shake flask scale for Bacillus halotolerans DSM 8802. The optimum xylanase production points were found as 30 °C, pH 8, and 127.27 rpm under submerged fermentation conditions. R2 and predicted R2 values that reflects the significance of the designed model were calculated as 0.9964 and 0.9674, respectively.19 The results indicate the enzyme is inducible and substrate should be suplemented in nutrient solution. Some studies also indicates that xylose is good substrate. It could also be used to induce production of xylanase by Trichosporon cutaneum SL409 as well as Aspergillus nidulans. Some scientists discussed that the optimized CCD model displayed a 1.84-fold greater xylanase production and suggests that wheat bran could be used as a convenient substrate.20 The more effective variables for xylanase production for isolate Trichoderma koeningi was mustard cake, xylose, FeSO4·7H2O, ZnSO4·7H2O and pH. Using CCD optimization of xylanase and protein were quantified to be 74.84 U/mL and 2.94 mg/mL, respectively.21
In conclusion, from the present study, an initial linear increase in xylanase production was observed when xylanase concentration and inoculum level were increased, followed by a decline after reaching plateau 95.000 U/ml. It was also observed that ammonium sulphate concentration of 0.3% and pH (9) were one of the many factors essential for attaining a high enzyme titre of 95.46 U/ml.
ACKNOWLEDGMENTS
The authors would like to thank the Department of Microbiology, Chaudhary Charan Singh University, Meerut, India, for their support.
CONFLICT OF INTEREST
The authors declare that there is no conflict of interest.
AUTHORS’ CONTRIBUTION
All authors listed have made a substantial, direct and intellectual contribution to the work, and approved it for publication.
FUNDING
None.
DATA AVAILABILITY
All datasets generated or analyzed during this study are included in the manuscript.
ETHICS STATEMENT
Not applicable.
- Santos Gomes MMOD, Nicodemos IS, da Costa Silva M, et al. Optimization of enzymatic saccharification of industrial wastes using a thermostable and halotolerant endoglucanase through Box-Behnken experimental design. Prep Biochem Biotechnol. 2024;54(1):1-11.
Crossref - Subramaniyan S, Prema P. Cellulase-free xylanases from Bacillus and other microorganisms. FEMS Microbiol Lett. 2000;183(1):1-7.
Crossref - Poole NJ, Wildish DJ, Kristmanson DD, Waldichuk M. The effects of the pulp and paper industry on the aquatic environment. Crit Rev Environ Sci Technol. 1977;8(1-4):153-195.
Crossref - Auer MR. Krafting an agreement: Negotiations to reduce pollution from the Nordic pulp industry, 1985-1989. Yale University. 1996.
Crossref - Walia A, Guleria S, Mehta P, Chauhan A, Parkash J. Microbial xylanases and their industrial application in pulp and paper biobleaching: a review. 3 Biotech. 2017;7(1):11.
Crossref - Singh CS, Singh S, Sharma PK, Sharma DC. Isolation, identification and molecular characterization of phytase producing bacteria, Pseudomonas sp. aazad. J Pure Appl Microbiol. 2017;11(4):1845-1850.
Crossref - King BC, Donnelly MK, Bergstrom GC, Walker LP, Gibson DM. An optimized microplate assay system for quantitative evaluation of plant cell wall-degrading enzyme activity of fungal culture extracts. Biotechnol Bioeng. 2009;102(4):1033-1044.
Crossref - Plackett RL, Burman JP. The design of optimum multifactorial experiments. Biometrika. 1946;33(4):305-325.
Crossref - Sharma DC, Satyanarayana T. A marked enhancement in the production of a highly alkaline and thermostable pectinase by Bacillus pumilus dcsr1 in submerged fermentation by using statistical methods. Bioresour Technol. 2006;97(5):727-733.
Crossref - Khurana s, Kapoor M, Gupta S, Kuhad RC. Statistical optimization of alkaline xylanase production from Streptomyces violaceoruber under submerged fermentation using response surface methodology. Indian journal of microbiology. 2007;47:144-52.
- Cui F, Zhao L. Optimization of xylanase production from Penicillium sp. WX-Z1 by a two-step statistical strategy: Plackett-Burman and Box-Behnken experimental design. Int J Mol Sci. 2012;13(8):10630-10646.
Crossref - Singh R, Sharma DC, Gupta MK. Optimization of critical process parameters for amylase production by Bacillus sp. using statistical approach (RSM). J Microbiol Biotechnol Res. 2017;7(3):7-15.
Crossref - Kumar V, Chhabra D, Shukla P. Xylanase production from Thermomyces lanuginosus VAPS-24 using low cost agro-industrial residues via hybrid optimization tools and its potential use for saccharification. Bioresour Technol. 2017;243:1009-1019.
Crossref - Nakamura S, Mukai T, Senoh M. Candela class high brightness InGaN/AlGaN double heterostructure blue light emitting diodes. Appl Phys Lett. 1994;64(13):1687-1689.
Crossref - Duarte MCT, Pellegrino ACA, Portugal EP, Ponezi AN, Franco TT. Characterization of alkaline xylanases from Bacillus pumilus. Braz J Microbiol. 2000;31(2):90-94.
Crossref - Li Y, Cui F, Liu Z, XuY, Zhao H. Improvement of xylanase production by Penicillium oxalicum ZH-30 using response surface methodology. Enzyme and microbial Technology. 2007;40(5):1381-8
- Beg QK, Bhushan B, Kapoor M, Hoondal GS. Production and characterization of thermostable xylanase and pectinase from Streptomyces sp. QG-11-3. J Ind Microbiol Biotechnol. 2000;24(6):396-402.
Crossref - Li Y, Lin J, Meng D, Lu J, Gu G, Mao Z. Effect of pH, Cultivation Time and Substrate Concentration on the Endoxylanase Production by Aspergillus awamori ZH-26 under Submerged Fermentation Using Central Composite Rotary Design. Food Technol Biotechnol. 2006;44(4).
- Guler F, Ozcelik F. Screening of xylanase producing Bacillus species and optimization of xylanase process parameters in submerged fermentation. Biocatal Agric Biotechnol. 2023;51:102801.
Crossref - Siwach R, Sharma S, Khan AA, Kumar A, Agrawal S. Optimization of xylanase production by Bacillus sp. MCC2212 under solid-state fermentation using response surface methodology. Biocatal Agric Biotechnol. 2024;57:103085.
Crossref - Bandikari R, Katike U, Seelam NS, Obulam VSR. Valorization of de-oiled cakes for xylanase production and optimization using central composite design by Trichoderma koeningi isolate. Turkish Journal of Biochemistry. 2017;42(3):317-328.
Crossref
© The Author(s) 2025. Open Access. This article is distributed under the terms of the Creative Commons Attribution 4.0 International License which permits unrestricted use, sharing, distribution, and reproduction in any medium, provided you give appropriate credit to the original author(s) and the source, provide a link to the Creative Commons license, and indicate if changes were made.