

ISSN: 0973-7510
E-ISSN: 2581-690X
Extensive studies on γ-aminobutyric acid (GABA) over decades highlight its significant physiological and pharmacological effects on humans. GABA produced using microbe is favoured compared to enzymatic and chemical methods due to operational ease and reduced harmful pollutant formation. This study focused on increasing γ-aminobutyric acid (GABA) biosynthesis from Lactiplantibacillus plantarum B7, employing a multi-step optimisation strategy. An unoptimised cultivation approach yielded a maximum GABA of 11.68 ± 0.04 g/L and viable cell count of 10.47 ± 0.01 log CFU/mL at 48 h. A nutrient-rich medium was developed through single-parameter optimisation, comprising 1%, 2.5% and 0.0002% of glucose, yeast extract and each trace element (CaCO3, KI, and Tween 80) respectively. Temperature, pH, incubation period, initial concentration of monosodium glutamate (MSG) and pyridoxal-5’-phosphate (PLP) demonstrated significant contributions towards GABA production and cell growth as determined using a two-level factorial design. Steepest ascent identified optimal conditions (36°C, pH 5.5, 370 mM MSG, and 0.7 mM PLP), resulting in 30.50 g/L GABA and 11.51 log CFU/mL at 60 h. Further refinement via a central composite experiment yielded optimal conditions (temperature-35.6°C, pH-5.66, initial MSG concentration-335.61 mM, PLP concentration-0.723 mM) with improved GABA production (32.18 g/L) and cell growth (11.52 log CFU/mL) over 63.66 h. Therefore, this approach utilising lactic acid bacteria capable of GABA synthesis holds promise for mass-produced, enhanced-functional foods.
Gamma-aminobutyric Acid, Lactiplantibacillus plantarum, Medium Formulation, Response Surface Methodology
Gamma-aminobutyric acid (GABA), a non-essential amino acid, is synthesised via the irreversible a-decarboxylation of L-glutamic acid. This process is facilitated by the enzyme glutamic acid decarboxylase (GAD) and the cofactor pyridoxal-5’-phosphate (PLP).1 Due to the extensive health implications of GABA for humans, research in this field has been a focal point for many years.2 GABA is well-known for its effective treatment against various human diseases such as cancer, cardiovascular related-diseases, diabetes, asthma, brain and nervous system related disorders.3 GABA also helps to treat insomnia, improve growth hormone secretion, plasma levels, protein synthesis within the brain, alleviate alcohol-related chronic diseases, strengthen immunity and help to make better decisions.4
Naturally synthesising GABA is more in demand compared to chemically produced GABA due to eco-friendly straightforward procedure, excellent catalytic efficiency and mild reaction conditions.5 Microorganisms, animals, and plants are among the natural GABA sources that have been extensively studied.6 However, naturally produced GABA in plant is low in quantity that is not sufficient for its beneficial activity, while GABA produced in animals is incapable to pass through the cerebrovascular barrier and flow throughout the entire body, preventing its overall function in humans.7 Therefore, GABA synthesised from microorganisms such as lactic acid bacteria (LAB) is preferred compared to animal’s and plant’s because it is much easier to control the growth and production beside these microorganisms are naturally found in food production processes, cheap, edible and also commonly used to produce functional foods.3
Among the GABA producers, LAB are highly preferred comparatively to other microorganisms due to its high availability, distinct physiological characteristic and generally regarded as safe (GRAS) status.7 LAB are commonly found in animal gut system, plant and fermented foods.8 GABA is synthesised by LAB to prevent the extracellular damage caused by the extreme acidity resulting from organic acid synthesis by LAB.9 The most common LAB species examined for GABA production include L. bulgaricus, L. brevis, L. paracasei, L. futsaii, L. helveticus, L. plantarum, L. buchneri, and L. paraplantarum.10
However, in general, GABA production by naturally found LAB does not meet market demand. Therefore, researchers and food industries are focusing on improving the biosynthesis of GABA to satisfy the market’s need for GABA-fortified products. Improving the GABA content could be possible by optimising the fermentation medium and the fermentation variables, including incubation temperature and time, starting pH, initial level of MSG (monosodium glutamate) and PLP.1 Wu et al. had successfully improved the GABA production up to 62.52 g/L by using optimised fermentation medium consists of 1%, 2.5% and 0.0002% of glucose, yeast extract and each trace element (CaCO3, MnSO4, and Tween 80) respectively.1 Carbon and nitrogen source at optimum level can enhance cell growth and improve the production of GABA. Moreover, the addition of trace elements such as sulphur and calcium can activate the GAD enzyme, whilst the supplementation of Tween 80 improved the cell growth and GABA titer.2
To date, several studies have reported on the optimisation of fermentation parameters via RSM to maximize the GABA titer. For example, a maximum GABA (ranging from 12.0 to 14.0 g/L) yield by L. plantarum L10-11 when fermented using MRS medium with an initial pH range of 5.0 to 6.0.11 Meanwhile, L. brevis TD10 fermented using MRS medium recorded the highest GABA of 19.90 g/L at pH 4.65.12 These findings indicate that different strains have varying optimal pH levels for maximising GABA production, which is influenced by their GAD enzyme properties. The optimal temperature range for GABA synthesis by most LAB is typically between 30 and 37°C during incubation.2 The ideal initial concentration of MSG also varies between different strains. Tanamool and Hongsachart observed that after the addition of more than 4% (w/v) of MSG concentrations, L. plantarum L10-11 synthesised the highest GABA, 15.74 g/L.11 However, a decline in the yield of GABA by L. plantarum NDC75017 was observed when 75 mM MSG was added because it inhibited the growth of cells and eventually suppressed GABA synthesis.5 Besides that, addition of optimum initial PLP concentration along with MSG could improve GABA production has been reported by various studies.1,5 Also, incubation time generally affects LAB’s GABA synthesis, as GABA production usually starts at the late logarithmic growth phase. Therefore, this study was aimed at improving the GABA production of a naturally found LAB, Lactiplantibacillus plantarum B7, through medium formulation (single-parameter optimisation) and optimisation of fermentation parameters via RSM.
Samples
Lactiplantibacillus plantarum B7, a naturally found LAB that was isolated from Budu (fermented anchovy sauce), was used in this study. L. plantarum B7 (OL818343), obtained from Microbial Culture Collection Unit, UPM was activated through two subculture cycles at 37°C for 24 h each using MRS broth (Oxoid LTD, Basingstoke, Hampshire, GB).
Unoptimised cultivation
Unoptimised cultivation was carried out using L. plantarum B7 incubated for 96 h in MRS broth added with 1% (w/v) of MSG (Sigma-Aldrich, MO, US).10 L. plantarum B7 underwent two 24-h subculture cycles at 37°C. Following the subculture cycles, the cells were harvested by centrifugation at 1844×g (5000 rpm) for 10 min and washed twice with sterile 0.85% NaCl (Sigma-Aldrich, MO, US) to remove any residual MRS components. After this washing step, an inoculum was prepared by inoculating 1% (v/v) of the active culture into MRS broth and incubating it for 24 h. Subsequently, 10% (v/v) of the inoculum was placed into fermentative media and incubated at the following conditions: 96 h, 37°C, 150 rpm. Sampling was carried out every 3 h within 24 h and followed by 24 h for the subsequent sampling until 96 h. Samples were assessed for cell density, viable cell count, reducing sugar depletion, MSG concentration and GABA production.
Analyses
Cell density was determined using spectrophotometry, expressed as OD600nm. The number of viable cells was determined using the standard method for colony formation, and the results were expressed as log CFU/mL. Ten-fold serial dilution of active culture was carried out by using a sterile peptone water (Merck, KGaA, Darmstadt, Germany). A 100 µL diluted sample was spread onto MRS agar and incubated anaerobically at following condition: 37°C for 48 h. The colonies were manually enumerated via a colony counter (Stuart, UK). Reducing sugar content is determined using the DNS method, which is a colorimetrical method, as described by Miller. Meanwhile, glutamate concentrations were quantified using the L-glutamic acid assay kit from Megazyme (Ireland).13 GABA titer was quantify according to the method (colorimetric) reported by Dikshit and Tallapragada with slight adjustments.14 A TLC plate (Merck, Darmstadt, DE) was spotted with two microliters of the sample and resolved in a n-butanol-acetic acid-water [5:3:2 (v/v/v)] solvent (Merck, Darmstadt, DE). The plate was then sprayed with a 1% (w/v in ethanol) ninhydrin solution and dried at 60°C for 30 min. After the drying process, the GABA spots were scraped off the plate and transferred into a mixture (3 mL of pH 7-borate buffer added with 0.5 mL of 0.8% (w/v in acetone) ninhydrin reagent) and incubated at
70°C for 20 min. The absorbance of the mixture was measured at 570 nm using spectrophotometry. A standard solution of GABA (10 mg/mL) was used to construct a GABA standard curve. Each experiment was performed in triplicate.
Fermentation medium formulation (Single-parameter optimisation)
Organic carbon sources
Approximately 10% inoculum was aliquot into MRS broth added with 1% of MSG and 1% of different carbon sources (Glu-glucose, Lac-lactose, Gal-galactose, Fru-fructose, Suc-sucrose, Mol-molasses, BS-brown sugar, Sta-starch, Xyl-xylose and Gly-glycerol) at 37°C with 150 rpm for 24 h. Cell growth (viable cell count) and GABA estimation were examined after 24 h. Based on the results, the selected carbon source (glucose) was examined under different concentrations ranging from 0 to 3% under similar fermentation parameters.
Nitrogen sources
Approximately 10% inoculum was aliquot into MRS broth added with 1% of MSG and 1% of different nitrogen sources (AT-ammonium thiocyanate, AN-ammonium nitrate, AM-ammonium molybdate, diAHP-di-ammonium hydrogen phosphate, Ure-urea, SP-soya peptone, Try-tryptone, ME-meat extract, YE-yeast extract and Pep-peptone) incubated at the following conditions: 24 h, 37°C, 150 rpm. Cell growth (viable cell count) and GABA estimation were examined after 24 h. Based on the results, the selected nitrogen source (yeast extract) was examined under different concentrations ranging from 0 to 3.5% under similar fermentation parameters.
Growth factors
Approximately 10% inoculum was aliquot into MRS broth added with 1% of MSG and 0.0002% of different growth factors (PS-potassium sulphate, ZS-zinc sulphate, ManS-manganese sulphate, MC-manganese chloride, MagS-magnesium sulphate, IS-iron sulphate, PI-potassium iodide, SA-sodium acetate, CC-calcium carbonate and Twe80-Tween 80) at 37°C with 150 rpm for 24 h. Cell growth (viable cell count) and GABA estimation were examined after 24 h. Based on the results, the selected growth factors in the form of combination (Tween 80 and potassium iodide; Tween 80 and calcium carbonate; potassium iodide and calcium carbonate; Tween 80, potassium iodide and calcium carbonate) were examined for cell growth and GABA production.
Two-level factorial design for screening
The significant factors affecting the cell growth of L. plantarum B7 and GABA production was determined using a two-level factorial design method.15 Six factors (temperature, pH, incubation time, MSG concentration, pyridoxal phosphate concentration and agitation) were examined in this method with the response measured for the cell growth and GABA concentration.26-2 factorial design with 4 center points per block (20 experimental runs) was used in this experiment utilising Design Expert 13 (State-Ease, Inc, Minneapolis, MN, USA). The levels of each factor, including high (+1), low (-1), and center points (0), were assessed. Table 1 shows the units, symbols and actual value of the parameters.
Steepest ascent
Steepest ascent procedure has been employed to ascertain the direction of changing parameters using the first-order model equation and their significant parameters derived from the two-level factorial design. In accordance with the first order model equation, the path was determined by increasing temperature (A), incubation time (E) and decreasing initial pH (B), initial MSG concentration (C), PLP concentration (D). The direction of the variables for GABA production and cell growth was begun with A-24°C, B-9.5, C-810 mM, D-1.5 mM and E-24 h. The non-significant parameter, agitation (F) was set at an intermediate level. Even though the maximum GABA titer and LAB growth have been identified, the corresponding point is expected to be in proximity to the ideal parameters and able to be utilised as the central point for central composite design (CCD).
Central Composite Design (CCD)
After determining the significant parameters and their direction using the two-level factorial design and steepest ascent method, respectively, CCD was conducted to determine the optimum incubation temperature and time, initial pH, MSG concentration and PLP concentration for GABA synthesis and L. plantarum B7 growth. It also used to define the relationships between each parameter. The CCD was designed by Design Expert 13 with 50 runs along with 8 replicates of the center point for determining the variance of pure experimental uncertainty in triplicates. Each parameter was analysed at three levels coded as -1, 0, +1. It was assumed that the system’s behaviour was represented by a second-order polynomial function, including linear, quadratic, and interaction effects, as depicted in Equation 1.
Y=β0+∑βiXi+∑βiiXi2+∑βijXij …(1)
where Y is predicted response, β0, βi βii and βij are the constant coefficients for offset term, linear, squared and interaction effect respectively, and X represents the coded value of the independent variable. Response surface graphs and regression analysis of variance were carried out. The optimum fermentation parameters for maximum GABA synthesis and L. plantarum B7 growth were estimated by the statistical analysis.
Optimised parameters validation
The validation of the model was performed using the forecast optimal values for the significant parameters as suggested by the design to achieve maximum cell growth and GABA production. The non-significant parameter was set to the intermediate value.
Statistical analysis
GraphPad Prism 9.0 (San Diego, CA, USA) used to perform analysis of experimental data. A significance level of p < 0.05 was used to determine statistical differences among the mean values of the results, employing a one-way analysis of variance (ANOVA). Tukey tests were utilised for conducting multiple comparisons of the means. The data of two-level factorial and CCD were analysed by using Design Expert 13. All data are expressed as mean ± SEM.
Unoptimised cultivation
Figure 1 demonstrates that the highest cell density (OD600nm) of L. plantarum B7 cultivated using MRS broth added 1% (w/v) MSG was reached at 48 h (2.788), starting from an initial cell density of 0.120 (0 h), under conditions of 37°C and 150 rpm. Deceleration phase was observed from 12 h to 21 h where the OD600nm was gradually increased. The cell growth was stable and entered a stationary phase before started to gradually decrease after 48 h. There was no discernible difference (p > 0.05) between 72 h and 96 h of L. plantarum B7’s cell density. Meanwhile, the number of initial viable cells (0 h) was 7.50 ± 0.00 log CFU/mL and increased to the highest cell count (10.47 ± 0.01 log CFU/mL) at 48 h. However, no statistically significant difference (p > 0.05) in the cell count between 24 h and 48 h was observed.
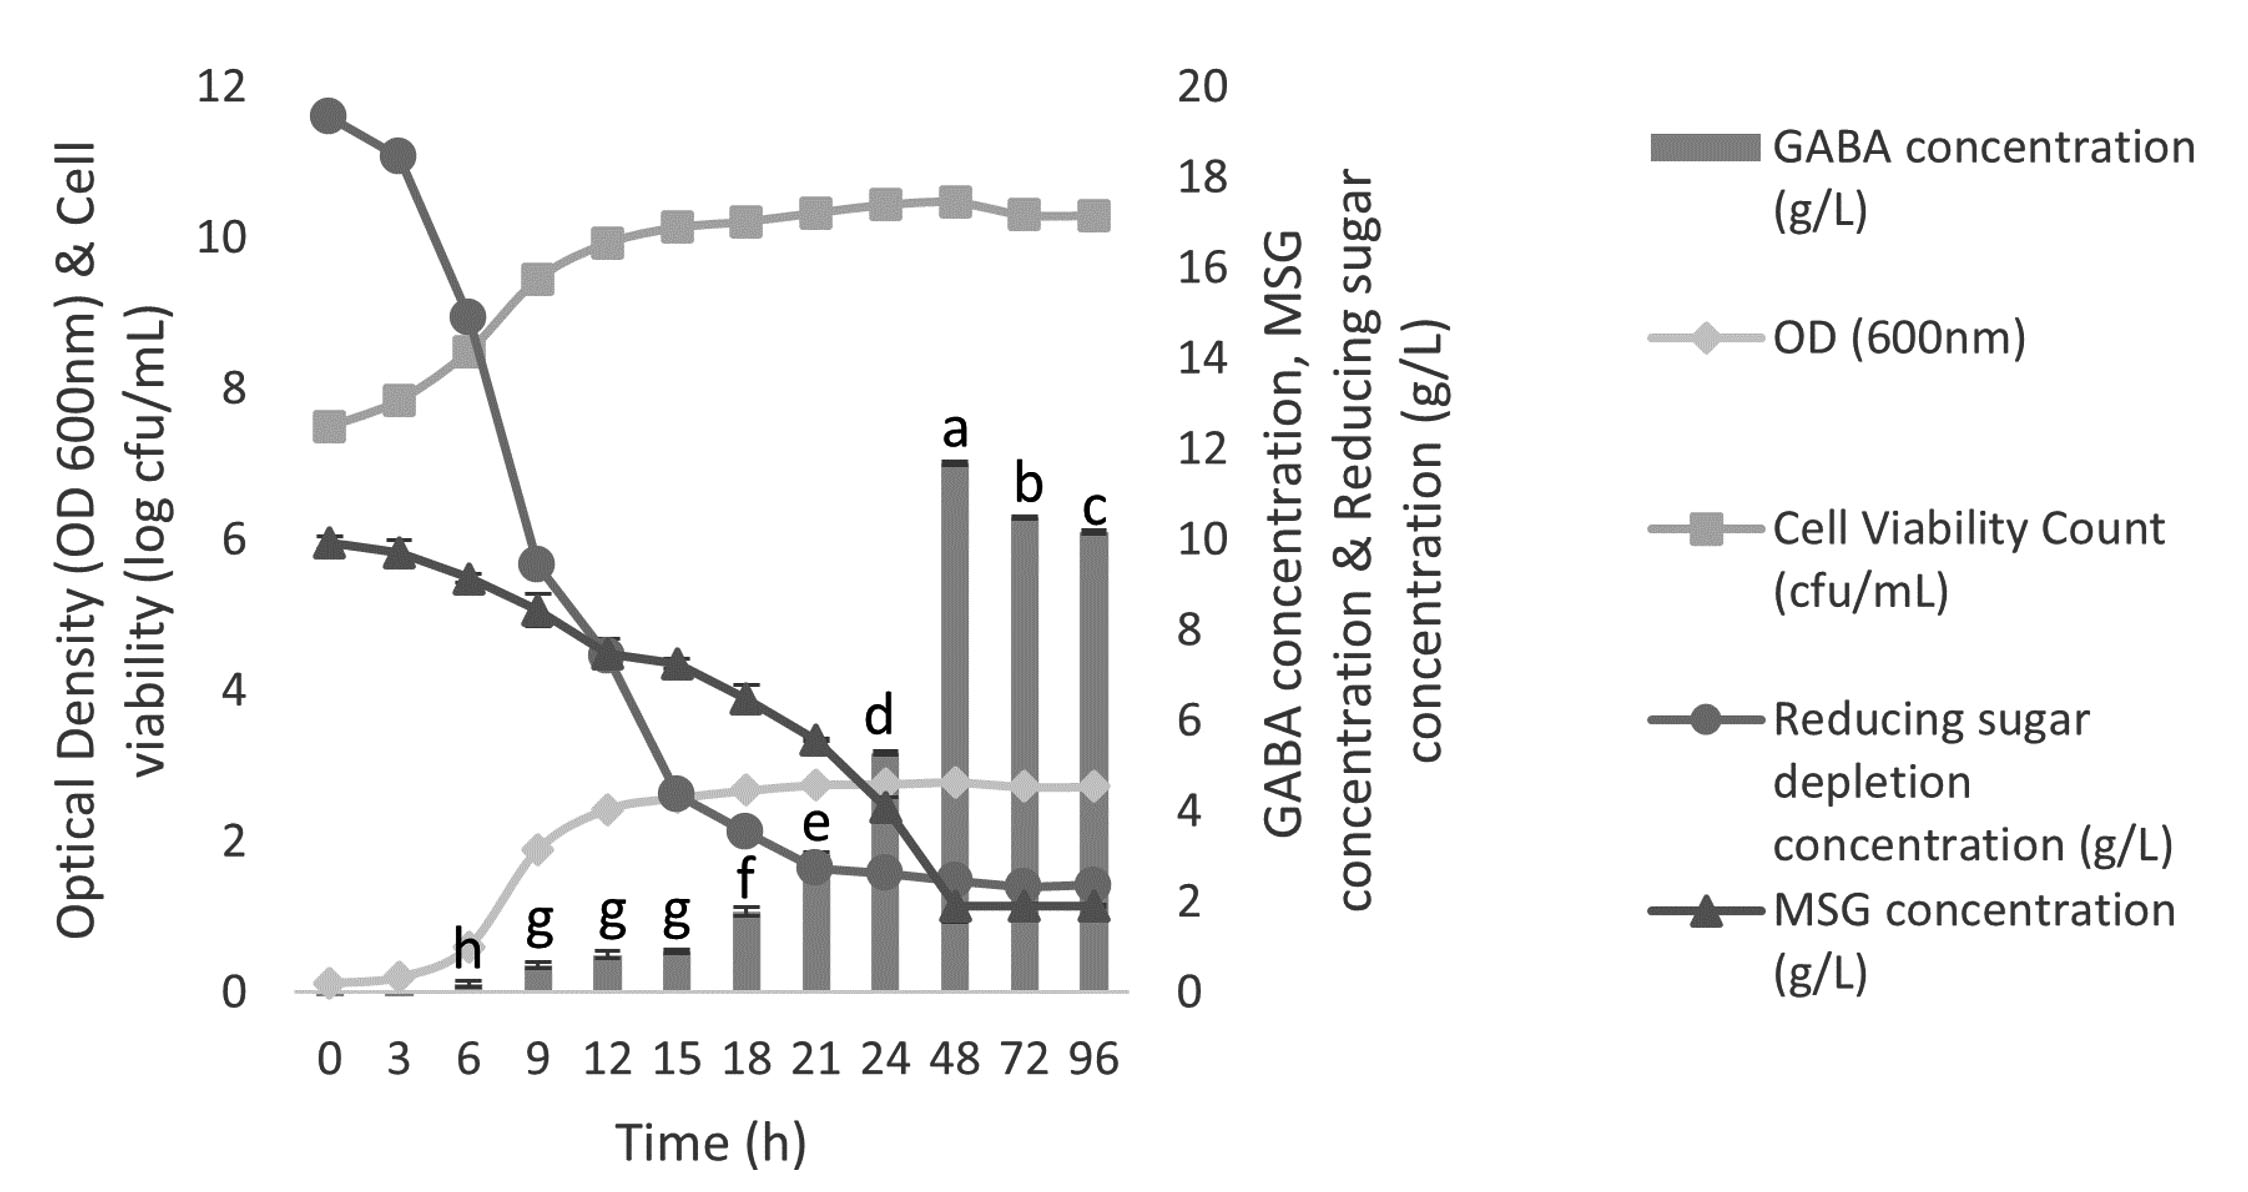
Figure 1. Cell density (OD 600 nm), viable cell count (log CFU/mL), reducing sugar (g/L), MSG depletion (g/L) and GABA production by Lactiplantibacillus plantarum B7 in MRS medium containing 1% of MSG. Each data represents the mean ± SEM of three replicates. Different lowercase letters on the top of bar indicate statistically significant differences (p < 0.05) of GABA production between the strains
The reducing sugar (glucose) concentrations were significantly decrease during the exponential growth phase from 0 to 18 h. There was no significant different in the reducing sugar starting from 21 until 96 h because the cell growth entered into a stationary phase. Meanwhile, MSG concentrations were gradually decrease from 0 to 48 h. After 48 h, there was no significant changes in the MSG concentration until the end of fermentation (96 h). L. plantarum B7 started to produce GABA from 6 h and slowly increase until 15 h. The GABA production showed no significant different from 9 to 15 h as cells were actively divided at this phase, causing the cell numbers to increase and subsequent increase of the cell’s major metabolite, lactic acid and others such as acetic acid and ethanol. The accumulation of these metabolites will create a sufficient enough acidic environment to activate GAD enzyme within the cell that responsible to catalyse MSG into GABA to maintain the pH.6 Therefore, after 15 h the GABA production was sharply increase until 48 h where the highest GABA (11.68 ± 0.04 g/L) was recorded. The decline of GABA production was observed starting from 72 to 96 h. In bacteria, GABA is typically produced through two pathways: either by directly converting L-glutamate into GABA in the cell cytosol through the action of the GAD enzyme,16 or through the GABA shunt. GABA shunt is a process where glucose will be used as substrate which bypass a certain key step of tricarboxylic acid (TCA) cycle to produce GABA. However, the GABA shunt may lead to the degradation of the produced GABA, as this pathway involves reactions catalyzed by the enzymes γ-aminobutyric acid aminotransferase (GABA-AT) and succinic semialdehyde dehydrogenase (SSADH). A high amount of GABA deposition results in an alkaline pH, which in turn activates both of these enzymes.7 This phenomenon could explain the observed reduction in GABA titer upon 48 h of fermentation (Figure 1). The GABA produced is metabolised by GABA-AT into succinic semialdehyde, which is further oxidised irreversibly by SSADH to form succinate. Following this, succinate enters the tricarboxylic acid (TCA) cycle and ultimately converts into oxaloacetate, which is a precursor crucial for gluconeogenesis, which is a process of synthesising glucose from non-carbohydrate precursors, ultimately leading to an increase in glucose concentration.6,7 As a result, no significant changes in glucose concentration were observed after 21 h, where the amounts of glucose produced and consumed were equal. Besides that, the produced succinate is also capable of being transformed into α-ketoglutarate via the TCA cycle and eventually becoming MSG.6 Therefore, no significant changes in MSG concentration were observed after 48 h because the amounts of MSG produced and consumed were almost the same.
Effects of carbon, nitrogen and growth factors on GABA synthesis and cell growth
To optimize the fermentation medium for GABA production and cell growth of L. plantarum B7, a step-by-step approach was adopted to evaluate the effects of different carbon sources, nitrogen sources, and growth factors on GABA production and cell growth. This strategy recognizes that LAB can metabolize these sugars, nitrogen, and growth factors in the presence of other nutrients in the MRS broth. MRS broth was chosen as the base nutrient medium due to its rich supply of amino acids, vitamins, and minerals, essential for the growth of L. plantarum B7. This also ensures the presence of essential growth factors and mimics a more natural and nutrient-rich environment. While acknowledging that other medium such as mineral salt medium (MSM) might offer better control over various factors, the use of MRS broth provides a stable and nutrient-rich environment, supporting robust cell growth and facilitating the identification of effective carbon, nitrogen, and growth factor sources that enhance GABA production. This approach ensures that the results obtained are relevant and easily translatable to real-world applications where MRS broth or similar nutrient-rich media are commonly used. Thus, this study improves the existing MRS medium to optimize GABA production and cell growth of L. plantarum B7 by supplementing the MRS medium with additional sources. This step-by-step optimization process allows to systematically evaluate the impact of each component while maintaining a consistent baseline provided by the MRS medium. This enhancement approach ensures that the identified optimal conditions can be readily applied to existing fermentation protocols, making it easier to adopt in practical applications.
The growth of L. plantarum B7 and its GABA synthesis were hence further improved by modifying the MRS medium by adding several carbon and nitrogen sources at constant concentration (1% w/v) after 24 h. From Figure 2A, among the carbon sources that were evaluated (glucose, lactose, galactose, fructose, sucrose, molasses, brown sugar, starch, xylose and glycerol), glucose was observed to have the highest cell growth (11.15 ± 0.01 log CFU/mL) and GABA (7.01 ± 0.01 g/L). The optimum concentration of glucose was further determined in the range of 0-3% (w/v). It was identified that 1% of glucose recorded the highest GABA (7.17 ± 0.05 g/L) and cell growth (11.15 ± 0.00 log CFU/mL) (Figure 2B). Meanwhile, for nitrogen sources (ammonium thiocyanate, ammonium nitrate, ammonium molybdate, di-ammonium hydrogen phosphate, urea, soya peptone, peptone, meat extract, tryptone and yeast extract), peptone and yeast extract showed the highest GABA with no discernible difference (p > 0.05), which were 7.62 ± 0.02 g/L and 7.41 ± 0.07 g/L, respectively (Figure 2C). Moreover, the cell growth observed was not significantly different between peptone, yeast extract and meat extract, in which peptone attained the highest growth (11.15 ± 0.00 log CFU/mL). The optimal yeast extract concentration was determined within the range of 0-3.5% (w/v). It was found that 2.5% of yeast extract has the highest GABA (8.09 ± 0.07 g/L) along with cell growth (11.14 ± 0.01 log CFU/mL) (Figure 2D).
Apart from carbon and nitrogen source, growth factors (potassium sulphate, zinc sulphate, manganese sulphate, manganese chloride, magnesium sulphate, iron sulphate, potassium iodide, sodium acetate, calcium carbonate and Tween 80) were also tested at 0.0002% concentration. The highest GABA and cell growth were attained for Tween 80, calcium carbonate and potassium iodide (Figure 2E). Hence, the combination of these three growth factors was tested again and has resulted in higher GABA (8.50 ± 0.06 g/L) and cell growth (11.18 ± 0.00 log CFU/mL) (Figure 2F).
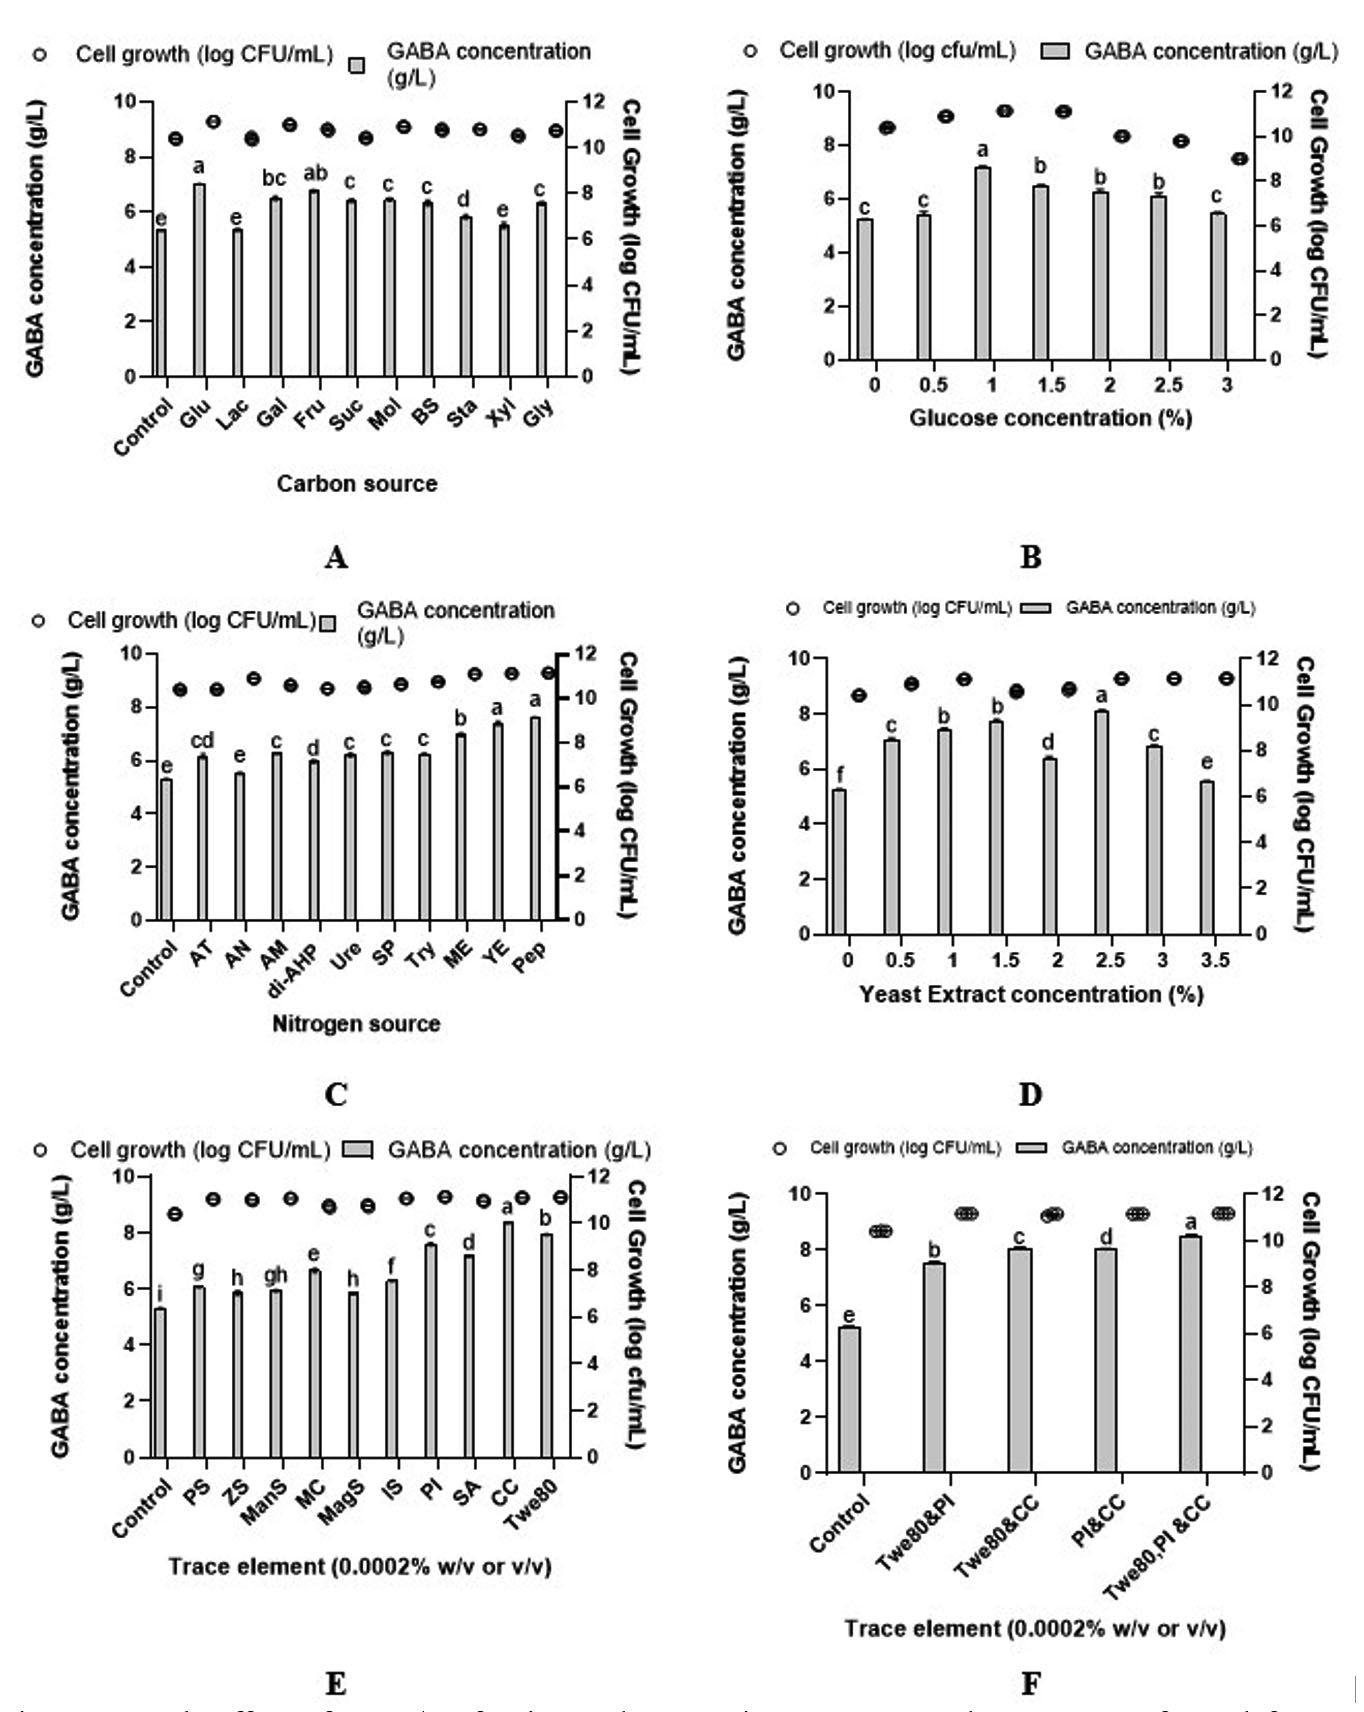
Figure 2. (A) Effects of 1% (w/v) various carbon sources and (B) different glucose concentrations; (C) effects of 1% (w/v) various nitrogen sources and (D) different yeast extract concentrations; (E) effects of 0.0002% various growth factors and (F) combinations of selected growth factors (at 0.0002%) on GABA production by Lactiplantibacillus plantarum B7 incubated in MRS broth containing 1% (w/v) of MSG for 24 h of fermentation. The average ± SEM of three replicates represents each data point. Varied lowercase letters positioned above the bars represent statistically significant differences (p < 0.05) in GABA production
Carbon act as the major energy source for the development of bacteria while nitrogen serve as peptides and amino acids for the cell growth and are significant substances for cell wall development.17 Among the tested carbon, all the three monosaccharides (glucose, galactose and fructose) were observed with the highest cell growth and GABA concentration. This is because bacteria and yeast could easily metabolized simpler sugars than disaccharides and polysaccharides, which have more complicated structures and are more difficult to break down.18 Among these three monosaccharides, glucose was identified as the ideal carbon source for L. plantarum B7. This discovery aligns with the findings of Harnentis et al., who also determined glucose as the optimal carbon source for L. plantarum, producing 14.43 g/L of GABA.19
The usage of exogenous nitrogen sources is necessary for LAB’s optimal growth because it has a limited ability to produce by its own.17 Organic nitrogen sources are the more favourable to the LAB growth and its metabolic production compared to inorganic nitrogen sources.1 In this study, yeast extract and peptone showed better GABA titer and growth among the rest of the nitrogen sources evaluated. Both yeast extract and peptone containing peptides, free amino acids, inorganic salts, lipids, vitamins, minerals and sugars which makes them as the excellent nutritional sources for the microbial growth.20 Yeast extract (at 2.5% (w/v)) was however selected due to its cheaper price and even though peptone attained a slightly higher GABA that the yeast extract, however there is no significant different (p > 0.05). Similarly, Wu et al. reported peptone yielded the highest GABA and growth of L. brevis RK03 followed by yeast extract.1 Due to its cost-effectiveness, they also found that a 2.5% (w/v) yeast extract emerged as the preferred nitrogen source for L. brevis RK03 to synthesise GABA.
Apart from carbon and nitrogen, other growth factors also may help to enhance the GABA titer and cell growth. In this study, the combination of calcium carbonate, potassium iodide and Tween 80 at 0.0002% enhanced the cell growth and GABA content. Tween 80 is recognized for its role as a growth stimulant for most LAB.7 Besides, Tween 80 also increased GABA production by acting as a surfactant, which improved the cell membrane permeability and may enhance the glutamate-GABA antiporter’s efficiency.21 Wu et al. also found that supplementation with Tween 80 improved the GABA titer and cell growth.1 Calcium carbonate is another growth factor which is used to minimize the pH fluctuation during fermentation and improve the LAB growth and GABA production.22 Calcium ions are involved in the cell division of some LAB species.23 Wu et al. also observed a similar result, whereby supplementation with calcium carbonate increased the level of GABA and L. brevis RK03 growth.1
Screening via two-level factorial design
The effects of all the varied parameters are able to be determined at a time via a two-level factorial design.24 As shown in Table 1, six factors (temperature, pH, initial MSG concentration, PLP concentration, incubation time and agitation) were randomised in 16 runs. ANOVA was employed to examine the interrelationship between the independent parameters as well as the main effects of GABA and cell growth, using a confidence level greater than 95% based on the p-value. GABA and cell growth results were varied from 4.41 ± 0.02 g/L and 9.31 ± 0.05 log CFU/mL to 10.01 ± 0.05 g/L and 10.48 ± 0.03 log CFU/mL, respectively with randomised variable level which presented in a coded form.
Table (1):
Two-level factorial design (coded) and response value
Run |
Levels |
A |
B |
C |
D |
E |
F |
GABA concentration(g/L) |
Cell growth(log CFU/mL) |
|---|---|---|---|---|---|---|---|---|---|
-1
1 |
25
40 |
4
7 |
100
800 |
0.1
1 |
24
72 |
100
150 |
|||
1 |
1.000 |
1.000 |
1.000 |
1.000 |
1.000 |
1.000 |
7.03 |
10.20 |
|
2 |
1.000 |
-1.000 |
-1.000 |
1.000 |
1.000 |
1.000 |
9.70 |
10.48 |
|
3 |
-1.000 |
1.000 |
-1.000 |
1.000 |
1.000 |
-1.000 |
6.60 |
9.73 |
|
4 |
1.000 |
1.000 |
-1.000 |
1.000 |
-1.000 |
-1.000 |
8.95 |
10.10 |
|
5 |
-1.000 |
1.000 |
-1.000 |
-1.000 |
1.000 |
1.000 |
7.20 |
9.74 |
|
6 |
-1.000 |
-1.000 |
-1.000 |
-1.000 |
-1.000 |
-1.000 |
7.36 |
9.65 |
|
7 |
1.000 |
1.000 |
-1.000 |
-1.000 |
-1.000 |
1.000 |
9.43 |
10.10 |
|
8 |
1.000 |
1.000 |
1.000 |
-1.000 |
1.000 |
-1.000 |
8.41 |
10.27 |
|
9 |
1.000 |
-1.000 |
1.000 |
-1.000 |
-1.000 |
1.000 |
8.47 |
10.23 |
|
10 |
-1.000 |
1.000 |
1.000 |
-1.000 |
-1.000 |
-1.000 |
5.33 |
9.44 |
|
11 |
-1.000 |
1.000 |
1.000 |
1.000 |
-1.000 |
1.000 |
4.41 |
9.31 |
|
12 |
1.000 |
-1.000 |
1.000 |
1.000 |
-1.000 |
-1.000 |
7.65 |
10.11 |
|
13 |
-1.000 |
-1.000 |
-1.000 |
1.000 |
-1.000 |
1.000 |
6.91 |
9.48 |
|
14 |
-1.000 |
-1.000 |
1.000 |
-1.000 |
1.000 |
1.000 |
6.15 |
9.66 |
|
15 |
1.000 |
-1.000 |
-1.000 |
-1.000 |
1.000 |
-1.000 |
10.01 |
10.48 |
|
16 |
-1.000 |
-1.000 |
1.000 |
1.000 |
1.000 |
-1.000 |
5.86 |
9.66 |
Note: A: Incubation temperature (°C), B: Initial pH, C: Initial MSG concentration (mM), D: PLP concentration (mM), E: Incubation time (h) and F: Agitation (rpm)
Table (2):
Regression analysis of two-level factorial design experiment
a) GABA concentration
Source |
Sum of Squares |
df |
Mean Square |
F-value |
p-value |
Remarks |
|---|---|---|---|---|---|---|
Model |
38.43 |
6 |
6.41 |
105.81 |
significant |
|
A |
24.57 |
1 |
24.57 |
405.91 |
significant |
|
B |
1.41 |
1 |
1.41 |
23.28 |
0.0009 |
significant |
C |
10.31 |
1 |
10.31 |
170.33 |
significant |
|
D |
1.72 |
1 |
1.72 |
28.40 |
0.0005 |
significant |
E |
0.3746 |
1 |
0.3746 |
6.19 |
0.0346 |
significant |
F |
0.0472 |
1 |
0.0472 |
0.7790 |
0.4004 |
|
Residual |
0.5448 |
9 |
0.0605 |
|||
Cor Total |
38.98 |
15 |
Fit statistics: R2 = 0.9860; Adjusted R2 = 0.9767; Predicted R2 = 0.9558; df: degree of freedom.
b) Cell growth
Source |
Sum of Squares |
df |
Mean Square |
F-value |
p-value |
Remarks |
|---|---|---|---|---|---|---|
Model |
2.08 |
6 |
0.3460 |
115.40 |
significant |
|
A |
1.76 |
1 |
1.76 |
586.87 |
significant |
|
B |
0.0462 |
1 |
0.0462 |
15.40 |
0.0035 |
significant |
C |
0.0475 |
1 |
0.0475 |
15.85 |
0.0032 |
significant |
D |
0.0167 |
1 |
0.0167 |
5.56 |
0.0427 |
significant |
E |
0.2026 |
1 |
0.2026 |
67.56 |
significant |
|
F |
0.0035 |
1 |
0.0035 |
1.16 |
0.3097 |
|
Residual |
0.0270 |
9 |
0.0030 |
|||
Cor Total |
2.10 |
15 |
Fit statistics: R2 = 0.9872; Adjusted R2 = 0.9786; Predicted R2 = 0.9594; df: degree of freedom.
Table 2 shows the regression analysis of two-level factorial experiments for both (a) GABA synthesis and (b) L. plantarum B7 growth. Both of the models for GABA concentration and cell growth were significant because the p-values were lesser than 0.05 with F-value 105.81 and 115.40, respectively. Temperature (A), initial pH (B), initial MSG concentration (C), PLP concentration (D) and incubation time (E) significantly affecting the GABA synthesis and cell growth because the p-value is lower than 0.05. However, agitation (F) was known as a non-significantly affecting parameter due the p-values are greater than 0.05 (0.4004 for GABA concentration and 0.3097 for cell growth). Hence, agitation was set at a medium level (125 rpm) for further the optimisation procedure. The significantly affecting parameters were further used in the steepest ascent and CCD method for an optimisation. First order polynomial Equation 2 and 3 were derived based on the ANOVA with five independent variables (A, B, C, D and E) which represented the response (Y) GABA concentration and cell growth, respectively.
Y=4.584+0.165A-0.198B-0.002C-0.728D+0.006E …(2)
Y=8.634 + 0.044A – 0.036B – 0.0002C – 0.072D – 0.005E …(3)
The coefficient R2 of the model for GABA production and cell growth were 0.9860 (98.6%) and 0.9872 (98.72%), respectively. The R2Adj of GABA production and cell growth model were 0.9767 and 0.9786, respectively showed that the variability of the data could be completely described by both models of GABA concentration and cell growth. The first order polynomial Equation 2 and 3 indicates both of the GABA and L. plantarum B7 growth would be increased with increasing temperature (A) and incubation time (E), while both the response would be decreased with decreasing pH (B), initial MSG concentration (C) and PLP concentration (D). Hence, it is proof that pH, initial MSG concentration and PLP concentration had negative effects on both responses while temperature and incubation time had positive effects.
Optimisation via steepest ascent method
Two-level factorial design is a vital method to screen parameters that has significant effect on the response, however it is incapable of detecting the optimum region of the parameters. Therefore, a steepest ascent method was implemented in this study to determine the path of parameters to achieve the maximum GABA and cell growth. Generally, the steepest ascent method is a technique for progressing step-by-step towards the maximum increase in the response. However, if the goal is to find the minimum value of the response, then it is referred to as the steepest descent method.25 According to first order model Equation 2 and 3, by increasing temperature (A), incubation time (E) and decreasing initial pH (B), initial MSG concentration (C), PLP concentration (D) should enhance the GABA production along with the cell growth. As shown in Table 3, the maximum cell growth (11.51 ± 0.01 log CFU/mL) and GABA production (30.50 ± 0.10 g/L) were observed at run 5, when incubation temperature, time, initial pH, MSG concentration and PLP concentration were 36°C, 60 h, 5.5, 370 mM and 0.7 mM, respectively. This region was hence chosen to be used as the centre point of CCD for further optimisation.
Table (3):
Experimental design and the results of steepest ascent
Run |
Temperature (°C) |
Initial pH |
Initial MSG concentration (mM) |
PLP concentration (mM) |
Incubation time (h) |
GABA concentration (g/L) |
Cell growth (log CFU/mL) |
|---|---|---|---|---|---|---|---|
1 |
24 |
9.5 |
810 |
1.5 |
12 |
– |
7.64 |
2 |
27 |
8.5 |
700 |
1.3 |
24 |
1.81 |
9.44 |
3 |
30 |
7.5 |
590 |
1.1 |
36 |
7.79 |
10.02 |
4 |
33 |
6.5 |
480 |
0.9 |
48 |
14.83 |
10.78 |
5 |
36 |
5.5 |
370 |
0.7 |
60 |
30.50 |
11.51 |
6 |
39 |
4.5 |
260 |
0.5 |
72 |
19.42 |
10.87 |
7 |
42 |
3.5 |
150 |
0.3 |
84 |
0.34 |
8.21 |
8 |
45 |
2.5 |
40 |
0.1 |
96 |
– |
7.97 |
Optimisation by CCD
The optimum level and the interactions among the significant parameters were studied by using CCD for maximum GABA synthesis and L. plantarum B7 growth. Based on Table 4, the highest GABA was observed at run 34 (33.86 ± 0.03 g/L) while the highest cell growth was noticed at run 44 (11.53 ± 0.00 log CFU/mL). A second-order polynomial model was designed to determine the optimum level of each parameter to achieve the maximum cell growth and GABA concentration. Second-order polynomial Equation 4 and 5 were developed to estimate (Y) GABA concentration and cell growth, respectively.
Y=-541.566 + 27.033A + 15.708B-0.044C+ 66.746D + 0.977E + 0.240AB + 0.004AC + 0.004BC + 0.0003CE – 0.416A2 – 2.256B2 – 0.0002C2 – 46.241D2 -0.008E2
…(4)
Y=-17.667 + 1.328A + 0.6534B + 0.005C + 2.369D + 0.064E + 0.008AB + 0.0002AC – 0.0004AE – 0.020A2 – 0.083B2 – 0.00002C2 – 1.640D2 – 0.0004E2
…(5)
Table (4):
Experimental design and the result of CCD
Run |
A |
B |
C |
D |
E |
GABA concentration (g/L) |
Cell growth (log CFU/mL) |
|---|---|---|---|---|---|---|---|
1 |
33 |
6.5 |
480 |
0.9 |
48 |
15.07 |
10.76 |
2 |
36 |
5.5 |
370 |
0.7 |
60 |
31.68 |
11.46 |
3 |
39 |
4.5 |
480 |
0.9 |
72 |
18.35 |
10.80 |
4 |
36 |
5.5 |
370 |
0.9 |
60 |
29.40 |
11.45 |
5 |
36 |
5.5 |
370 |
0.7 |
60 |
31.64 |
11.52 |
6 |
36 |
5.5 |
370 |
0.7 |
60 |
32.12 |
11.48 |
7 |
33 |
6.5 |
480 |
0.5 |
72 |
18.15 |
10.80 |
8 |
36 |
5.5 |
370 |
0.7 |
48 |
29.11 |
11.42 |
9 |
39 |
6.5 |
480 |
0.5 |
72 |
21.05 |
10.93 |
10 |
36 |
5.5 |
370 |
0.7 |
60 |
32.85 |
11.50 |
11 |
36 |
5.5 |
370 |
0.7 |
72 |
29.98 |
11.45 |
12 |
39 |
4.5 |
260 |
0.5 |
72 |
19.61 |
10.85 |
13 |
33 |
6.5 |
480 |
0.5 |
48 |
16.23 |
10.75 |
14 |
39 |
6.5 |
480 |
0.9 |
72 |
21.82 |
10.94 |
15 |
39 |
4.5 |
480 |
0.5 |
48 |
13.28 |
10.73 |
16 |
36 |
5.5 |
370 |
0.7 |
60 |
33.54 |
11.48 |
17 |
33 |
4.5 |
480 |
0.9 |
48 |
16.35 |
10.75 |
18 |
33 |
4.5 |
260 |
0.9 |
48 |
23.52 |
11.05 |
19 |
33 |
6.5 |
260 |
0.9 |
48 |
23.79 |
11.07 |
20 |
36 |
4.5 |
370 |
0.7 |
60 |
28.17 |
11.41 |
21 |
33 |
6.5 |
260 |
0.5 |
48 |
22.97 |
11.04 |
22 |
33 |
4.5 |
480 |
0.9 |
72 |
18.56 |
10.81 |
23 |
36 |
5.5 |
370 |
0.5 |
60 |
28.39 |
11.41 |
24 |
39 |
6.5 |
480 |
0.5 |
48 |
20.33 |
10.90 |
25 |
33 |
6.5 |
260 |
0.9 |
72 |
25.64 |
11.19 |
26 |
39 |
6.5 |
480 |
0.9 |
48 |
20.77 |
10.92 |
27 |
36 |
5.5 |
370 |
0.7 |
60 |
31.62 |
11.51 |
28 |
39 |
6.5 |
260 |
0.5 |
72 |
21.24 |
10.94 |
29 |
39 |
6.5 |
260 |
0.9 |
48 |
21.02 |
10.93 |
30 |
33 |
4.5 |
260 |
0.5 |
72 |
24.11 |
11.08 |
31 |
36 |
6.5 |
370 |
0.7 |
60 |
28.81 |
11.42 |
32 |
39 |
4.5 |
260 |
0.9 |
72 |
20.05 |
10.86 |
33 |
33 |
4.5 |
260 |
0.9 |
72 |
25.61 |
11.19 |
34 |
36 |
5.5 |
370 |
0.7 |
60 |
33.86 |
11.51 |
35 |
33 |
4.5 |
260 |
0.5 |
48 |
22.23 |
11.01 |
36 |
33 |
4.5 |
480 |
0.5 |
72 |
18.20 |
10.77 |
37 |
39 |
4.5 |
480 |
0.5 |
72 |
17.32 |
10.76 |
38 |
39 |
4.5 |
260 |
0.5 |
48 |
19.07 |
10.84 |
39 |
36 |
5.5 |
480 |
0.7 |
60 |
26.26 |
11.20 |
40 |
39 |
6.5 |
260 |
0.5 |
48 |
20.73 |
10.91 |
41 |
33 |
6.5 |
480 |
0.9 |
72 |
18.95 |
10.84 |
42 |
39 |
4.5 |
480 |
0.9 |
48 |
15.07 |
10.74 |
43 |
36 |
5.5 |
260 |
0.7 |
60 |
30.16 |
11.38 |
44 |
36 |
5.5 |
370 |
0.7 |
60 |
31.32 |
11.53 |
45 |
39 |
5.5 |
370 |
0.7 |
60 |
27.13 |
11.37 |
46 |
39 |
6.5 |
260 |
0.9 |
72 |
21.91 |
10.97 |
47 |
33 |
6.5 |
260 |
0.5 |
72 |
25.10 |
11.15 |
48 |
33 |
5.5 |
370 |
0.7 |
60 |
26.86 |
11.26 |
49 |
33 |
4.5 |
480 |
0.5 |
48 |
14.13 |
10.74 |
50 |
39 |
4.5 |
260 |
0.9 |
48 |
19.89 |
10.86 |
Notes: Temperature (A), initial pH (B), initial MSG concentration (C), PLP concentration (D), and incubation time (E).
Table (5):
A reduced second-order polynomial model’s regression analysis for GABA concentration and growth optimisation of L. plantarum B7
a) GABA concentration
Source |
Sum of Squares |
df |
Mean Square |
F-value |
p-value |
Remarks |
|---|---|---|---|---|---|---|
Model |
1576.43 |
14 |
112.60 |
104.75 |
significant |
|
A |
8.34 |
1 |
8.34 |
7.76 |
0.0086 |
|
B |
26.60 |
1 |
26.60 |
24.74 |
||
C |
173.33 |
1 |
173.33 |
161.24 |
||
D |
5.49 |
1 |
5.49 |
5.10 |
0.0302 |
|
E |
30.32 |
1 |
30.32 |
28.20 |
||
AB |
16.62 |
1 |
16.62 |
15.46 |
0.0004 |
|
AC |
54.60 |
1 |
54.60 |
50.79 |
||
BC |
5.12 |
1 |
5.12 |
4.76 |
0.0359 |
|
CE |
3.85 |
1 |
3.85 |
3.58 |
0.0668 |
|
A² |
34.74 |
1 |
34.74 |
32.32 |
||
B² |
12.59 |
1 |
12.59 |
11.71 |
0.0016 |
|
C² |
15.88 |
1 |
15.88 |
14.77 |
0.0005 |
|
D² |
8.46 |
1 |
8.46 |
7.87 |
0.0081 |
|
E² |
3.53 |
1 |
3.53 |
3.29 |
0.0784 |
|
Residual |
37.62 |
35 |
1.07 |
|||
Lack of Fit |
31.10 |
28 |
1.11 |
1.19 |
0.4359 |
not significant |
Pure Error |
6.53 |
7 |
0.9326 |
|||
Cor Total |
1614.06 |
49 |
Fit statistics: R2 = 0.9767; Adjusted R2 = 0.9674; Predicted R2 = 0.9503; df: degree of freedom.
b) Cell growth
Source |
Sum of Squares |
df |
Mean Square |
F-value |
p-value |
Remarks |
|---|---|---|---|---|---|---|
Model |
3.89 |
13 |
0.2992 |
281.56 |
significant |
|
A |
0.0303 |
1 |
0.0303 |
28.50 |
||
B |
0.0431 |
1 |
0.0431 |
40.57 |
||
C |
0.2953 |
1 |
0.2953 |
277.88 |
||
D |
0.0073 |
1 |
0.0073 |
6.84 |
0.0130 |
|
E |
0.0230 |
1 |
0.0230 |
21.69 |
||
AB |
0.0190 |
1 |
0.0190 |
17.85 |
0.0002 |
|
AC |
0.1431 |
1 |
0.1431 |
134.64 |
||
AE |
0.0060 |
1 |
0.0060 |
5.62 |
0.0232 |
|
A² |
0.0796 |
1 |
0.0796 |
74.87 |
||
B² |
0.0169 |
1 |
0.0169 |
15.95 |
0.0003 |
|
C² |
0.1086 |
1 |
0.1086 |
102.16 |
||
D² |
0.0082 |
1 |
0.0082 |
7.71 |
0.0086 |
|
E² |
0.0106 |
1 |
0.0106 |
10.01 |
0.0032 |
|
Residual |
0.0383 |
36 |
0.0011 |
|||
Lack of Fit |
0.0343 |
29 |
0.0012 |
2.12 |
0.1538 |
not significant |
Pure Error |
0.0039 |
7 |
0.0006 |
|||
Cor Total |
3.93 |
49 |
Fit statistics: R2 = 0.9903; Adjusted R2 = 0.9867; Predicted R2 = 0.9749; df: degree of freedom.
Table 5 shows a reduced second-order polynomial model’s regression analysis for both (a) GABA concentration and (b) L. plantarum B7 growth. Both models for GABA concentration and cell growth were significantly fitted to the experimental data because the p-values were lesser than 0.05 with F-value 104.75 and 281.56, respectively.25 The models fitness was also assessed using the coefficient R2 for the GABA production and cell growth which equal to 0.9767 (97.67%) and 0.9903 (99.03%), respectively. The R2Adj of the GABA production and cell growth models were 0.9674 and 0.9867, respectively indicating both models were well-fit to the regression equation with low experimental errors showing the significance of the model.25 However, the F-value (1.19) and p-value (0.4359) indicated a lack of fit for the GABA production model that was not significantly related to pure error. Cell growth model also have a non-significant lack of fit due to F-value 2.12 and p-value 0.1538 (p > 0.05).25 Besides that, it is also important to understand and determine the mutual interaction pattern between the experimental variables based on the p-value. Based on Table 5, all the independent variables tested showed a significant impact on both GABA synthesis and cell growth. Notably, AB, AC, BC, A², B², C² and D² have significant influence on the GABA production while AB, AC, AE, A², B², C², D² and E² have significant effects on L. plantarum B7 growth.
The interactions between two variables and their optimal levels are often elucidated using graphical representations of regression equations, such as 2D contour plots and 3D response surface curves. Figure 3A and 3B shows the 3D response surface curve with corresponding contour plots for the interactions that significantly affect the GABA concentration and cell growth developed by using the predicted model respectively. Figure 3A (a) and (b) depict the interaction effects between initial pH and temperature on GABA concentration when the values of the initial concentration of MSG, PLP and incubation time were fixed at 370 mM, 0.7 mM and 60 h, respectively. Increasing both pH and temperature until 5.69 and 35.9ºC, respectively produced a maximum GABA concentration; however, further increment will decrease the GABA production. Moreover, Table 5 (a) shows initial pH with higher F-value (24.74) has greater effects on GABA synthesis compared to temperature with lower F-value (7.76). Besides that, increasing temperature and initial MSG concentration until 35.6°C and 317.06 mM, respectively increased GABA concentration (Figure 3A (c) and (d)). Further increase in temperature and initial MSG concentration had caused adverse effects on the GABA content. Initial MSG concentration with larger F-value (161.24) greatly affects the GABA concentration compared to temperature with lesser F-value (7.76) (Table 5 (a)). In the meantime, Figure 3A (e) and (f) indicates GABA production by L. plantarum B7 increased by increasing the initial pH and MSG concentration at constant temperature (36ºC), PLP concentration (0.7 mM) and incubation period (60 h). However, increasing initial pH beyond 5.66 and initial MSG concentration above 322.45 mM, reduced the GABA production. From Table 5 (a), initial MSG concentration with higher F-value (161.24) has more influence towards GABA concentration compared to initial pH with fewer F-value (24.74). Meanwhile, Figure 3B (a) and (b) showed the effects of interactions between initial pH and temperature on L. plantarum B7 growth when the concentration values of initial MSG and PLP as well as incubation time were fixed at 370 mM, 0.7 mM and 60 h, respectively. Increasing both pH and temperature until 5.71 and 35.8°C, respectively achieved maximum cell growth; however, any further increase will decrease the growth. Initial pH with higher F-value (40.57) has greater impacts on cell growth compared to temperature with lower F-value (28.5) (Table 5 (b)). The cell growth tends to increase when the initial MSG concentration and temperature increased until 343.37 mM and 35.6°C, respectively beyond that the growth of cell declined (Figure 3B (c) and (d)). Based on the Table 5 (b), high F-value (277.88) of initial MSG concentration exerted great effects on cell growth compared to low F-value (28.5) of temperature. Finally, increasing temperature and incubation time at constant value of initial pH (5.5), initial MSG concentration (370 mM) and PLP concentration (0.7 mM) increased the cell growth. A reduction in cell growth would be expected at above 35.7ºC and 62.84 h of incubation time (Figure 3B (e) and (f)). Table 5 (b), shows an incubation time with lower F-value (21.69) slightly affected the cell growth compared to temperature with larger F-value (28.5) that was greatly affected. Additionally, all the contour plots shown in Figure 3A and 3B had an elliptic shape instead of a round, showing that the variables exhibited discernible interactions, which agree with the results in Table 5.26
Therefore, based on the model, the maximum GABA production (32.26 g/L) and cell growth (11.52 log CFU/mL) could be achieved at 35.6°C, pH 5.66, an initial MSG concentration of 335.61 mM, a PLP concentration of 0.723 mM, and an incubation time of 63.66 h.
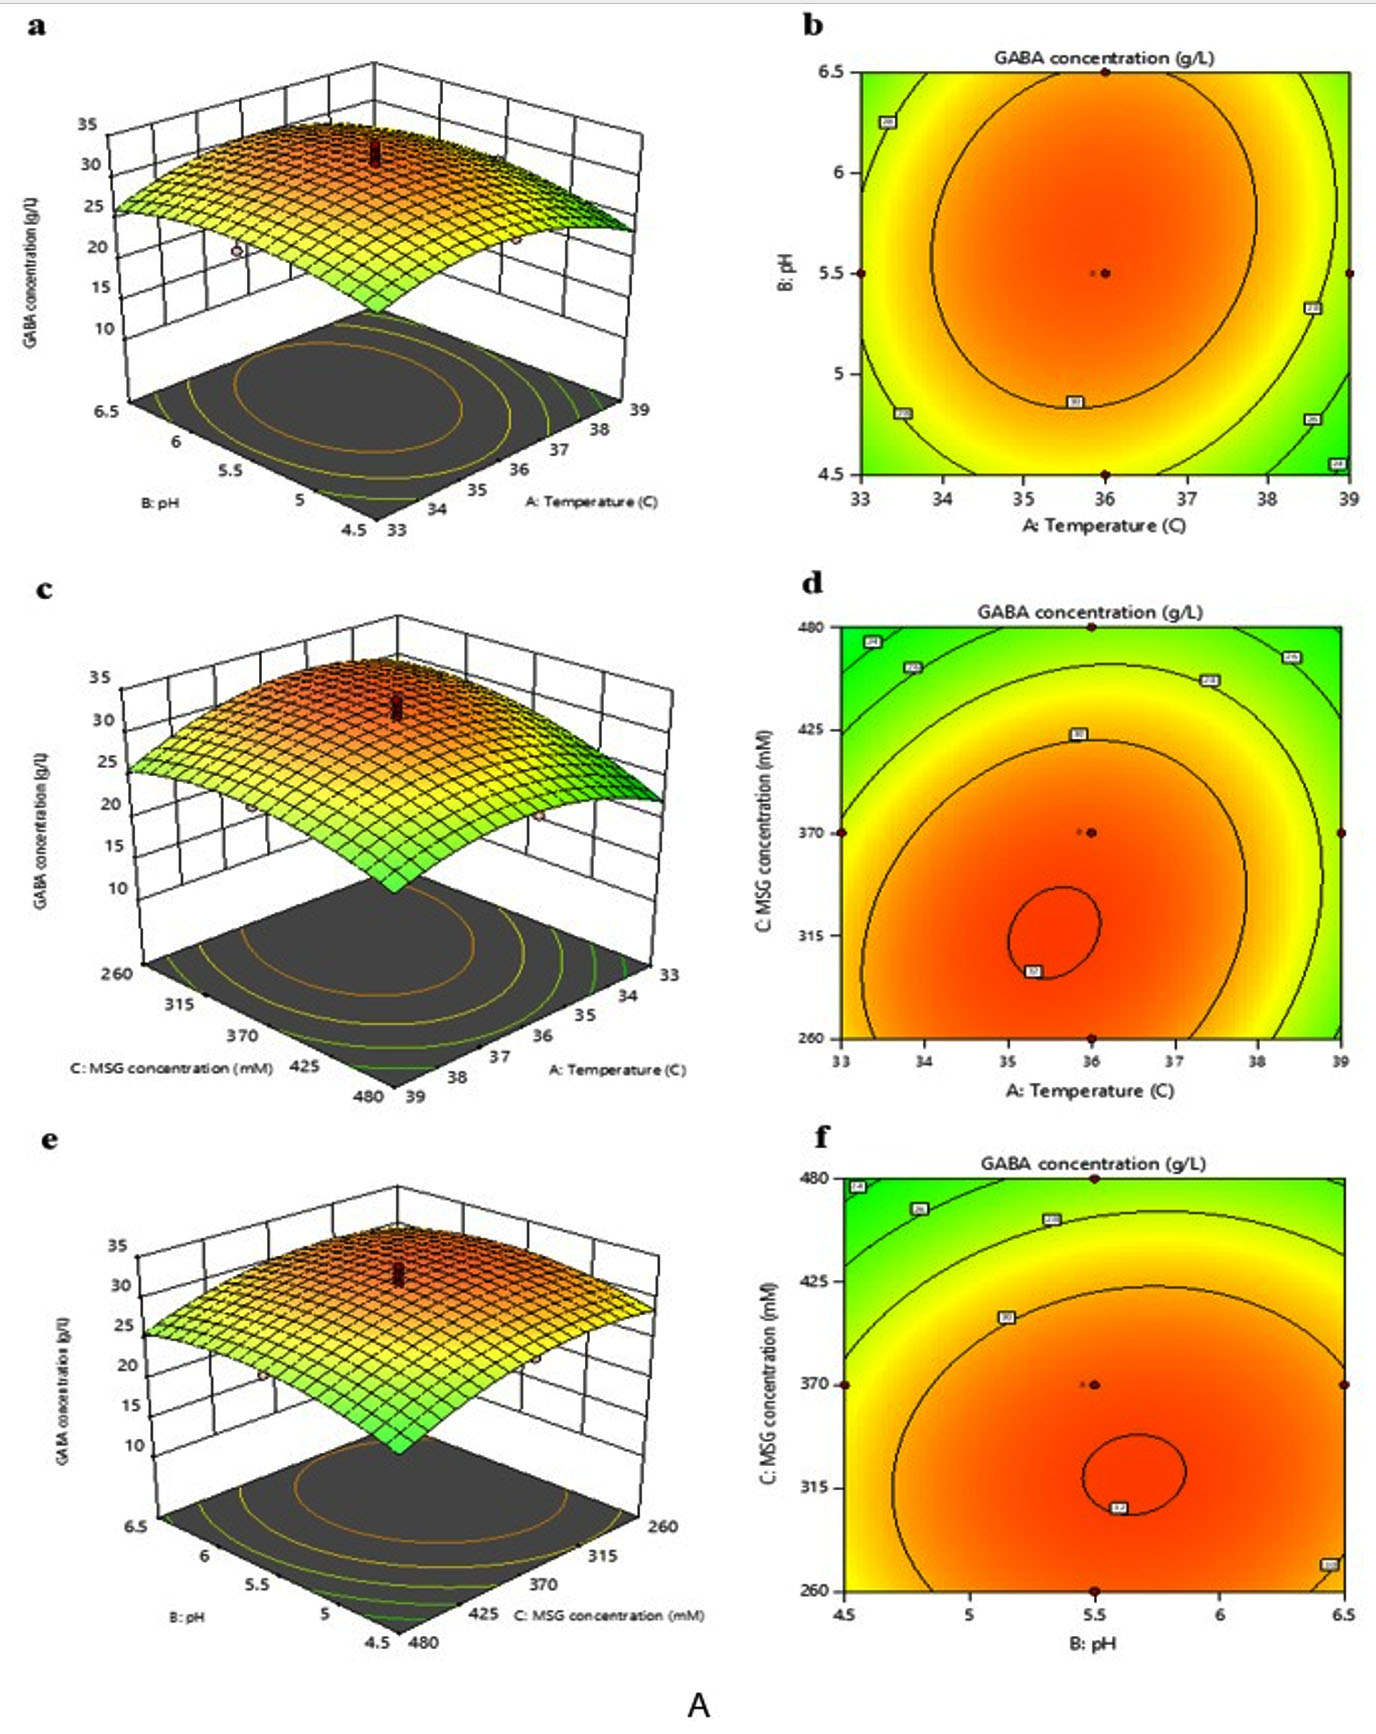
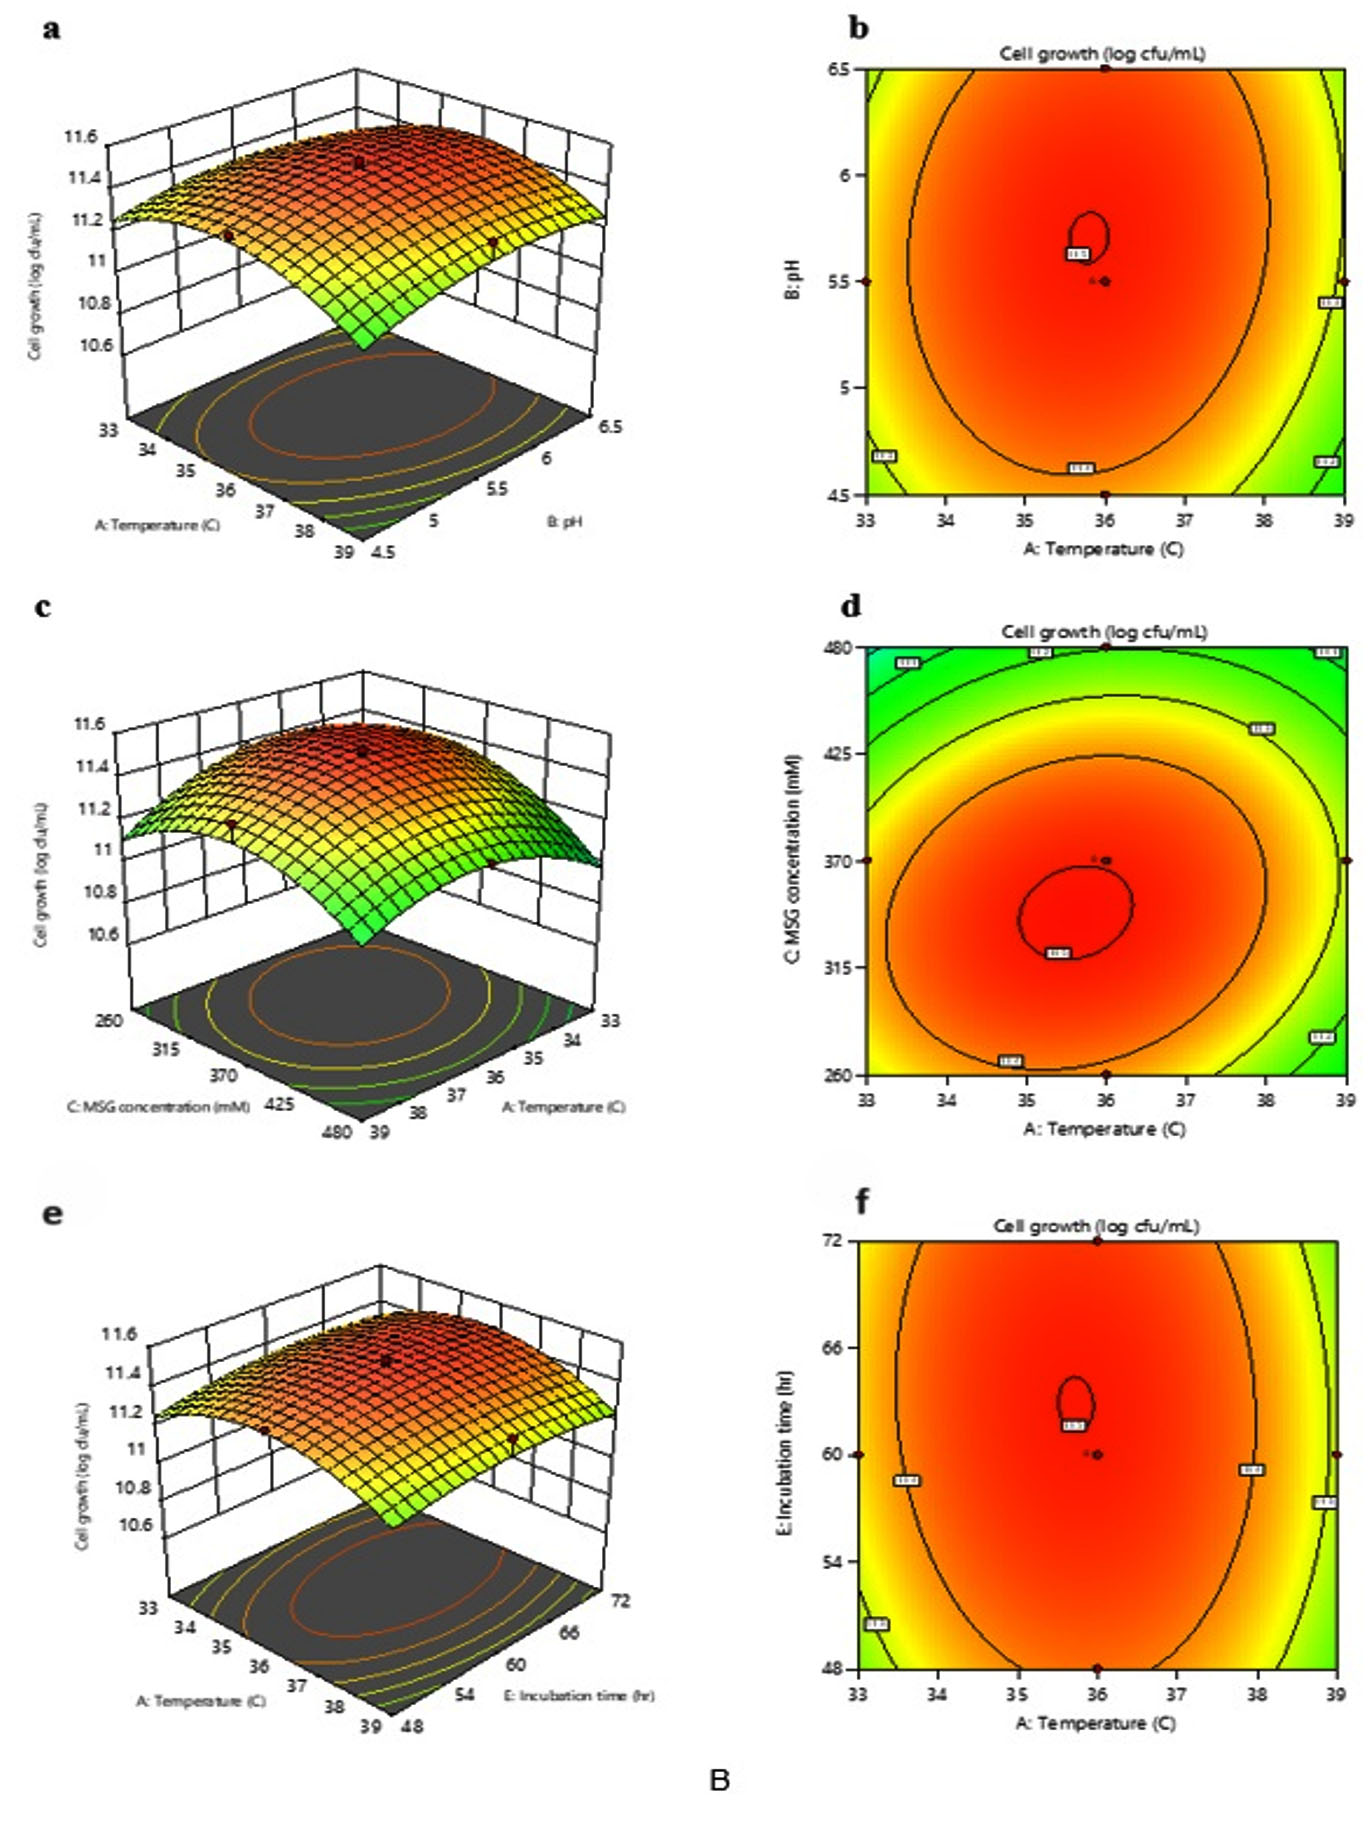
Figure 3. Response surface curve with corresponding contour plots for the interactions that affect GABA production A (a to f) and cell growth B (a to f) significantly
Validation of quadratic optimisation model
Based on the optimised quadratic model, the maximum predicted GABA production and L. plantarum B7 growth were 32.26 g/L and 11.52 log CFU/mL, respectively. The predicted model has been verified by using the optimised level of the fermentation variables (35.6°C, pH 5.66, an initial MSG concentration of 335.61 mM, a PLP concentration of 0.723 mM, and an incubation time of 63.66 h) and resulted with 32.18 ± 0.25 g/L of GABA and 11.52 ± 0.02 log CFU/mL of cell growth. The observed responses with no discernible different (p > 0.05) between the predicted values showed the model has high accuracy and good adequacy for the GABA production and cell growth. The result shows that the GABA content found in an optimised fermentation approach was 175.51% higher compared to an unoptimised cultivation approach. The growth of L. plantarum B7 also improved significantly (p < 0.05) compared to unoptimised cultivation approach. Therefore, this outcome supported the model’s effectiveness for GABA synthesis and L. plantarum B7 growth.
The combination optimisation approach employed in this study, combining various methods such as one factor at a time, two-level factorial design, steepest ascent, and central composite design proved highly successful in enhancing GABA production. Specifically, the GABA production by L. plantarum B7 increased significantly from 11.68 g/L (unoptimised approach) to 32.18 g/L, representing a remarkable 175.51% increment. Comparing these results to findings from previous studies reveals the exceptional effectiveness of the applied optimisation strategy. For instance, Zarei et al. reported a relatively modest increment (47.94%) in GABA concentration after optimising the GABA synthesis by L. plantarum isolated from local dairy products, using the response surface method.27 The notable disparity in the improvement of GABA titer between the present study and Zarei et al. may be attributed to the comprehensive nature of this study’s optimisation process. Unlike Zarei et al. that solely focused on optimising fermentation conditions, this study approach maximised the GABA production by concurrently optimising both the fermentative medium and conditions. This dual optimisation strategy likely contributed to the substantial enhancement observed in GABA production in this work. Besides that, Yogeswara et al. found a lower increment (from 809.20 mg/L to 1226.50 mg/L, which is equivalent to 51.57%) in the GABA titer produced by L. plantarum FNCC 260 after optimisation compared to the present study.28 This disparity in improvement may be attributed to the methodology employed by Yogeswara et al. which relied solely on OFAT approach for maximizing GABA titer. In general GABA concentration could be improved significantly higher using RSM methodology compared to OFAT.29 This is due to the OFAT method’s limitation that individual factor interactions cannot be taken into account in a complex system; instead, they can only be examined at particular point.10 Hence, a combination optimisation strategy used in this study likely contributed to the superior enhancement of GABA production compared to studies that solely relied on the OFAT methodology. In contrast, Wu et al. successfully improved the GABA production of L. brevis RK03 by 312.95% upon optimization of the fermentation medium and condition via OFAT, which is a significantly higher increment compared to the increment of this current study.1 The observed differences in GABA production improvements can be attributed to the usage of different strains, which have distinct genetic and metabolic characteristics that can lead to variation in GABA productions.30 In another study, the GABA concentration of L. pentosus R13 increased by approximately 58.88% (from 14.69 mM to 23.34 mM) after optimising fermentation conditions using OFAT method, as reported by Thuy et al.31 The observed lower increment in their GABA production was attributed to the limited scope of the optimisation approach, that was focusing only on several fermentation parameters including initial pH, incubation temperature, initial MSG concentration, and initial cell density. In contrast, this present study employed a more comprehensive two-level factorial design to identify the key parameters influencing GABA production, including initial pH, incubation temperature, initial MSG concentration, pyridoxal-5′-phosphate (PLP) concentration, and incubation period, before proceeding with RSM method, which leads to a more substantial improvement in GABA production compared to studies that optimised a limited set of parameters. Furthermore, several other studies have reported more modest increases in GABA concentration by various LAB following optimisation compared to the significant improvement achieved in the present study. For instance, Phuengjayaem et al. reported an 87.58% increment, Kwon et al. achieved a 49% increase, and Devi et al. observed a more conservative 19.12% enhancement.32-34 These findings highlight the notable distinction in the effectiveness of optimisation strategies, with the present study demonstrating a superior and substantial increase in GABA production compared to the referenced studies.
To conclude, GABA synthesising capability by natural GABA-producing microorganisms such as LAB could be improved via optimisation of fermentation medium and its condition. The optimal formulation identified in this study consisted of a modified MRS broth supplemented with 1%, 2.5%, and 0.0002% of glucose, yeast extract, and trace elements (CaCO3, KI, and Tween 80). The optimised fermentation conditions included initial concentrations of 335.61 mM MSG; 0.723 mM PLP, an initial pH of 5.66, and incubation at 35.6°C, 125 rpm for 63.66 h. L. plantarum B7 achieved the highest GABA concentration of 32.18 ± 0.25 g/L and cell growth of 11.52 ± 0.02 log CFU/mL, representing a remarkable 175.51% increase in GABA production from the unoptimized approach. Additionally, the regression analysis of a reduced second-order polynomial model for both GABA concentration and growth optimisation of L. plantarum B7 indicated that the initial MSG concentration had the most significant effect on both GABA production and cell growth, as evidenced by the highest F-value among the other evaluated factors. Thus, this study successfully demonstrated that a combination of optimisation approaches could substantially enhance GABA production by L. plantarum B7, paving the way for the development of various GABA-enriched functional products.
ACKNOWLEDGMENTS
The financial assistance of the Graduate Research Fellowship (GRF) provided by Universiti Putra Malaysia is gratefully acknowledged.
CONFLICT OF INTEREST
The authors declare that there is no conflict of interest.
AUTHORS’ CONTRIBUTION
SP and MH conceptualized the study. MH funding acquisition and performed supervision. SP, FWFW, HW, MSM, RM and MH applied methodology and collected resources. SP performed formal analysis and investigation. SP and MH wrote original draft. FWFW, HW, MSM and RM wrote, reviewed and edited the manuscript. All authors read and approved the final manuscript for publication.
FUNDING
This research was funded by the Universiti Putra Malaysia under Geran Putra GP-IPS (UPM-IPS/2023/9742200).
DATA AVAILABILITY
All datasets generated or analyzed during this study are included in the manuscript.
ETHICS STATEMENT
This article does not contain any studies on human participants or animals performed by any of the authors.
- Wu CH, Hsueh YH, Kuo JM, Liu SJ. Characterization of a potential probiotic Lactobacillus brevis RK03 and efficient production of γ-aminobutyric acid in batch fermentation. Int J Mol Sci. 2018;19(1):143.
Crossref - Pannerchelvan S, Rios-Solis L, Wong FWF, et al. Strategies for improvement of gamma-aminobutyric acid (GABA) biosynthesis via lactic acid bacteria (LAB) fermentation. Food Funct. 2023;14:3929-3948.
Crossref - Diez-Gutierrez L, San Vicente L, Barron LJR, del Carmen Villaran M, Chavarri M. Gamma-aminobutyric acid and probiotics: Multiple health benefits and their future in the global functional food and nutraceuticals market. J Funct Foods. 2020;64:103669.
Crossref - Moore JF, DuVivier R, Johanningsmeier SD. Formation of γ-aminobutyric acid (GABA) during the natural lactic acid fermentation of cucumber. J Food Compos Anal. 2021;96:103711.
Crossref - Shan Y, Man CX, Han X, et al. Evaluation of improved GABA production in yogurt using Lactobacillus plantarum NDC75017. J Dairy Sci. 2015;98(4):2138-2149.
Crossref - Sahab NRM, Subroto E, Balia RL, Utama GL. γ-Aminobutyric acid found in fermented foods and beverages: current trends. Heliyon. 2020;6(11):e05526.
Crossref - Pannerchelvan S, Muhamad FN, Wasoh H, et al. Improvement of γ-aminobutyric acid production and cell viability of Lactiplantibacillus plantarum B7 via whole-cell immobilisation in repeated batch fermentation system. Probiotics Antimicrob Proteins. 2023.
Crossref - Fazilah NF, Hamidon NH, Ariff AB, Khayat ME, Wasoh H, Halim M. Microencapsulation of Lactococcus lactis Gh1 with gum arabic and Synsepalum dulcificum via spray drying for potential inclusion in functional yogurt. Molecules. 2019;24(7):1422.
Crossref - Laroute V, Yasaro C, Narin W, et al. GABA production in Lactococcus lactis is enhanced by arginine and co-addition of malate. Front Microbiol. 2016;7:1-11.
Crossref - Lim HS, Cha IT, Roh SW, Shin HH, Seo MJ. Enhanced production of gamma-aminobutyric acid by optimizing culture conditions of Lactobacillus brevis HYE1 isolated from kimchi, a Korean fermented food. J Microbiol Biotechnol. 2017;27(3):450-459.
Crossref - Tanamool V, Hongsachart P, Soemphol W. Screening and characterisation of gamma-aminobutyric acid (GABA) producing lactic acid bacteria isolated from Thai fermented fish (Plaa-som) in Nong Khai and its application in Thai fermented vegetables (Som-pak). Food Sci Technol. 2020;40(2):483-490.
Crossref - Sharafi S, Nateghi L. Optimization of gamma-aminobutyric acid production by probiotic bacteria through response surface methodology. Iran J Microbiol. 2020;12(6):584-591.
Crossref - Miller GL. Use of dinitrosalicylic acid reagent for determination of reducing sugar. Anal Chem. 1959;31(3):426-428.
Crossref - Dikshit R, Tallapragada P. Screening and optimization of γ-aminobutyric acid production from Monascus sanguineus under solid-state fermentation. Front Life Sci. 2015;8(2):172-181.
Crossref - Roslan MAM, Sohedein I, Ling PS, et al. Sustainable agronomic valorization of unsulfured molasses and defatted soybean meal as an optimized formulation of bio-organic fertilizer enriched with high cell density p-solubilizing bacteria. Agronomy. 2021;11(5):996.
Crossref - Yuan H., Wang H, Fidan O, Qin Y, Xiao G, Zhan J. Identification of new glutamate decarboxylases from Streptomyces from efficient production of γ-aminobutyric acid in engineered Escherichia coli. J Biol Eng. 2019;13:24.
Crossref - Cheng F, Chen H, Lei N, Zhang M, Wan H. Effects of carbon and nitrogen sources on activity of cell envelope proteinase produced by Lactobacillus plantarum LP69. Acta Univ Cibiniensis Ser E Food Technol. 2019;23(1):11-18.
Crossref - Burnison H, Granato T, King M, Peoples H, Hallidayschult T. The effect of monosaccharides versus disaccharides on the rate of co2 production. J Undergrad Biol Lab Investig. 2018;1(1):1-4.
- Harnentis H, Nurmiati N, Marlida Y, Adzitey F, Huda N. γ-Aminobutyric acid production by selected lactic acid bacteria isolate of an Indonesian indigenous fermented buffalo milk (dadih) origin. Vet world. 2019;12(8):1352-1357.
Crossref - Zarei O, Dastmalchi S, Hamzeh-Mivehroud M. A simple and rapid protocol for producing yeast extract from Saccharomyces cerevisiae suitable for preparing bacterial culture media. Iran J Pharm Res IJPR. 2016;15(4):907-913.
- Wang Q, Liu X, Fu J, et al. Substrate sustained release-based high efficacy biosynthesis of GABA by Lactobacillus brevis NCL912. Microb Cell Fact. 2018;17(1):1-8.
Crossref - Son J, Baritugo KA, Sohn YJ, et al. Production of γ-aminobutyrate (GABA) in recombinant Corynebacterium glutamicum by expression of glutamate decarboxylase active at neutral pH. ACS omega. 2022;7(33):29106-29115.
Crossref - Kojima M, Suda S, Hotta S, Hamada K, Suganuma A. Necessity of calcium ion for cell division in Lactobacillus bifidus. J Bacteriol. 1970;104(2):1010-1013.
Crossref - Ridza PNYM, Ya’acob A, Zainol N, Mortan SH. Application of two level factorial design to study the microbe growth inhibition by pineapple leaves juice. IOP Conf Ser: Mater Sci Eng. 2020;736(2):022011.
Crossref - Wang L, Zhang M, Li Y, et al. Application of response surface methodology to optimize the production of antimicrobial metabolites by Micromonospora Y15. Biotechnol Biotechnol Equip. 2017;31(5):1016-1025.
Crossref - Chen L, Alcazar J, Yang T, Lu Z, Lu Y. Optimized cultural conditions of functional yogurt for γ-aminobutyric acid augmentation using response surface methodology. J Dairy Sci. 2018;101(12):10685-10693.
Crossref - Zarei F, Nateghi L, Eshaghi MR, Taj Abadi ME. Optimization of gamma-aminobutyric acid production in probiotics extracted from local dairy products in west region of Iran using MRS broth and whey protein media. Appl Food Biotechnol. 2018;5(4):233-242.
Crossref - Yogeswara IBA, Maneerat S, Haltrich D. Glutamate decarboxylase from lactic acid bacteria-a key enzyme in GABA synthesis. Microorganisms. 2020;8(12):1-24.
Crossref - Kim J, Lee MH, Kim MS, Kim GH, Yoon SS. Probiotic properties and optimization of gamma-aminobutyric acid production by Lactiplantibacillus plantarum FBT215. J Microbiol Biotechnol. 2022;32(6):783-791.
Crossref - Dovom MRE, Najafi MBH, Vosough PR, Norouzi N, Nezhad SJE, Mayo B. Screening of lactic acid bacteria strains isolated from Iranian traditional dairy products for GABA production and optimization by response surface methodology. Sci Rep. 2023;13(1):440.
Crossref - Thuy DTB, Nguyen TA, Vandamme P. Isolation, screening, identification and optimization of culture parameters to produce γ-aminobutyric acid by Lactiplantibacillus pentosus R13, an isolate from ruoc (fermented shrimp paste). Appl Food Biotechnol. 2022;9(1):1-8.
Crossref - Phuengjayaem S, Kuncharoen N, Booncharoen A, Ongpipattanakul B, Tanasupawat S. Genome analysis and optimization of γ-aminobutyric acid (GABA) production by lactic acid bacteria from plant materials. J Gen Appl Microbiol. 2021;67(4):150-161.
Crossref - Kwon HY, Choi JS, Kim SJ, et al. Optimization of solid-phase Lactobacillus fermentation conditions to increase γ-aminobutyric acid (GABA) content in selected substrates. Fermentation. 2023;9(1).
Crossref - Devi PB, Rajapuram DR, Jayamanohar J, et al. Gamma-aminobutyric acid (GABA) production by potential probiotic strains of indigenous fermented foods origin and RSM based production optimization. LWT. 2023;176:114511.
Crossref
© The Author(s) 2024. Open Access. This article is distributed under the terms of the Creative Commons Attribution 4.0 International License which permits unrestricted use, sharing, distribution, and reproduction in any medium, provided you give appropriate credit to the original author(s) and the source, provide a link to the Creative Commons license, and indicate if changes were made.