

ISSN: 0973-7510
E-ISSN: 2581-690X
Pigment is the most attractive attribute and integral part of human life. The source of the pigment used for different applications is chemically synthesised. However, pigment produced from natural sources (such as plants and microorganisms) can also be applied as a coloring agent. In addition to being colorants, many natural pigments are also fascinating bioactive substances with possible health benefits. Agrochemicals, food, medicine, pharmacology, cosmetics, and numerous other industries use these compounds. In this study, a total of 7 pigmented colonies were isolated from the soil samples of different areas of Assam. Out of 7 pigmented colonies, 3 colonies showed orange color and 4 colonies showed yellow color. Based on the similarity of growth pattern and high intensity of pigmentation one colony from each pigment was picked for further studies. The isolated orange and yellow pigments were denoted as S1 and S2, respectively. With the help of Bergey’s Manual of Determinative Bacteriology the isolated pigmented strains were preliminary identified based on their morphological, microscopic, and biochemical characteristics and after that 16S rRNA gene sequencing helped to identify the bacteria at the species level and the strains were identified as (S1) Micrococcus aloeverae ON377368 and (S2) Exiguobacterium aestuarii ON377409. The identified strains Micrococcus aloeverae and Exiguobacterium aestuarii showed a high pigment production rate at specific optimized conditions such as at temperature 37°C, pH 6, and NaCl concentrations at 1.5-2% and strains also showed a good characteristic growth pattern at a specific time interval. Therefore, the present study may be a helpful step towards the large-scale manufacture of pigments and the extraction, purification, and characterization of the pigment extracted from these strains will lead to provide a potent eco-friendly natural dye in the industrial sector.
Natural, Pigment, Bioactive, Extraction, Strains
For human beings, color is one of the sources of attraction. It reflects the variety of geographical, cultural, sociological, and economic statuses among the population. In day-to-day life from every aspect, color influences human life. According to history from the ancient period, pigments have been used as coloring agents.1 Pigments can be derived from both natural sources, such as plants and microorganisms, as well as synthetically produced compounds. However, synthetic pigments have several harmful effects on human health as well as the environment.2 Knowing the negative effects of these synthetic coloring chemicals, people are becoming more conscious of them and become attracted to the harmless natural pigment. Natural pigments are mostly derived from plants, animals, or microorganisms. Many natural pigments are known to be fascinating bioactive substances with potential health effects in addition to being colorants. In addition to medicine, food, pharmacology, agrochemicals, and cosmetics, these compounds are also used in many other industries.3 Bioactive pigments produced by microorganisms have been discovered in large quantities, and many of these pigments exhibit antioxidant, anti-inflammatory, and/or antibacterial properties.4,5 During 2020 researchers predicted that due to the increased demand for natural products, the market for colorants developed at an estimated 7% annual pace and reached $7.79 billion in a year.5,6 Many pigments have had their global markets for microbial pigments evaluated; for example, the carotenoids market was projected to reach $1.7 billion USD in 2020 and is predicted to grow at a rate of 2.6 percent to reach nearly $2 billion USD in the upcoming years. Astaxanthin, a type of carotenoid, had a market size of $192.5 million USD in 2020 and is expected to grow exponentially to approximately $228.4 million USD by 2027, according to AMR (2021) reports.7,8 Therefore, the organics market and the pigment industries are sizable commercial sectors that will soon be dominated by microbial pigments.5,9 The production of microbial pigments using fermentation technology is more dynamic and cost-effective than that of pigments derived from plants and animals. These pigments are biodegradable compounds with potential commercial uses as colorants.3,10
Fungal and bacterial microorganisms offer a convenient substitute source of naturally derived pigments.11,12 In comparison to fungi, bacteria are better at producing pigment because they have a shorter life cycle and are easier to genetically modify.13 Most bacteria can produce several types of pigments such as astaxanthin, canthaxanthin, carotenoids, melanins, granadaene, indigoidine, flavins, and quinines.11 According to the Munsell color system, most of the bacterial species produced a variety of coloring shades red (Serratiamarcescens, Gordoniajacobaea), red-yellow (Kocuria sp., Chryseoacteriumartocarpi), yellow (Micrococcus, Hymenobacter sp., and Chryseobacterium sp.), green (Pseudomonas sp.) blue (Corynebacteriuminsidiosum, Erwiniachrysanthemi, VogesellaIndigofera), purple (Chromobacterium sp.).13 Many factors, including carbon, nitrogen sources, pH, temperature, time of incubation, moisture content, and aeration rate, affect the production of these bacterial pigments. Therefore, it is important to investigate their effects on the biosynthetic pathways that regulate pigment production in order to develop processes for increased production.14 Considering these points, the present investigation was undertaken. The goal of the current study was to isolate and identify bacterial species that produce pigments in the natural environment, taking into account the diverse range of microbial pigments. In the current study, soil samples were screened for pigment-producing bacteria from different soil sample sites, including river banks, paddy fields, oil digging sites, tea gardens, etc.
Collection of samples
For the investigation, soil samples were collected from several locations of Assam viz (Figure 1), Digboi, Duliajan, Sonari, Cinnamora, Golaghat, Diphu, Howraghat, Nagaon, Hatisila, Amchong Tea Garden, Panikhaiti, Basistha Forest area, Lachitghat, Fancy Bazar, Rani reserve forest, Deepor Beel, Mukalmua, Dhubri. According to the habitat of the soil, random sample locations were chosen from each area. The locations of the samples ranged from 25.50-27.23°” N and 89.59-95.37°” E (Table 1).15 From sample sites, approximately 100g soil samples were collected at a depth of 0-20cm in a sterile plastic container, and after collection soil samples were stored at room temperature.
Table (1):
Geographical features of the locations where the tested areas were collected throughout the distinct regions of Assam
No. |
Place |
Latitude |
Longitude |
|---|---|---|---|
1 |
Digboi |
27°23’17.99″N |
95°37’16.78″E |
2 |
Duliajan |
27°22’46.10″N |
95°18’19.59″E |
3 |
Sonari, Tea Estate |
27° 0’55.38″N |
95° 0’6.78″E |
4 |
Cinnamon Tea Estate |
26°43’16.31″N |
94°14’32.22″E |
5 |
Kamargaon, Golaghat |
26°38’32.93″N |
93°46’57.50″E |
6 |
Diphu |
25°50’22.95″N |
93°26’50.91″E |
7 |
Howraghat |
26° 6’44.16″N |
93° 2’40.90″E |
8 |
Kolongpar River Side, Nagaon |
26°18’24.82″N |
92°39’44.69″E |
9 |
Paddy Field, Hatisila |
26°16’10.61″N |
91°59’49.37″E |
10 |
Amsang Tea Garden |
26° 9’29.12″N |
91°55’15.73″E |
11 |
River Bank Panikhati |
26°12’56.25″N |
91°52’40.24″E |
12 |
Basistha Forest Area |
26° 5’52.15″N |
91°47’25.30″E |
13 |
Lachitghat, Fancy Bazar |
26°10’43.37″N |
91°44’0.80″E |
14 |
Rani Reserve Forest |
26° 1’47.09″N |
91°35’47.30″E |
15 |
DeeporBeel |
26° 6’21.55″N |
91°37’41.95″E |
16 |
Mukalmua Paddy Field |
26°16’23.76″N |
91°21’47.53″E |
17 |
Dhubri |
26° 1’6.82″N |
89°59’8.30″E |
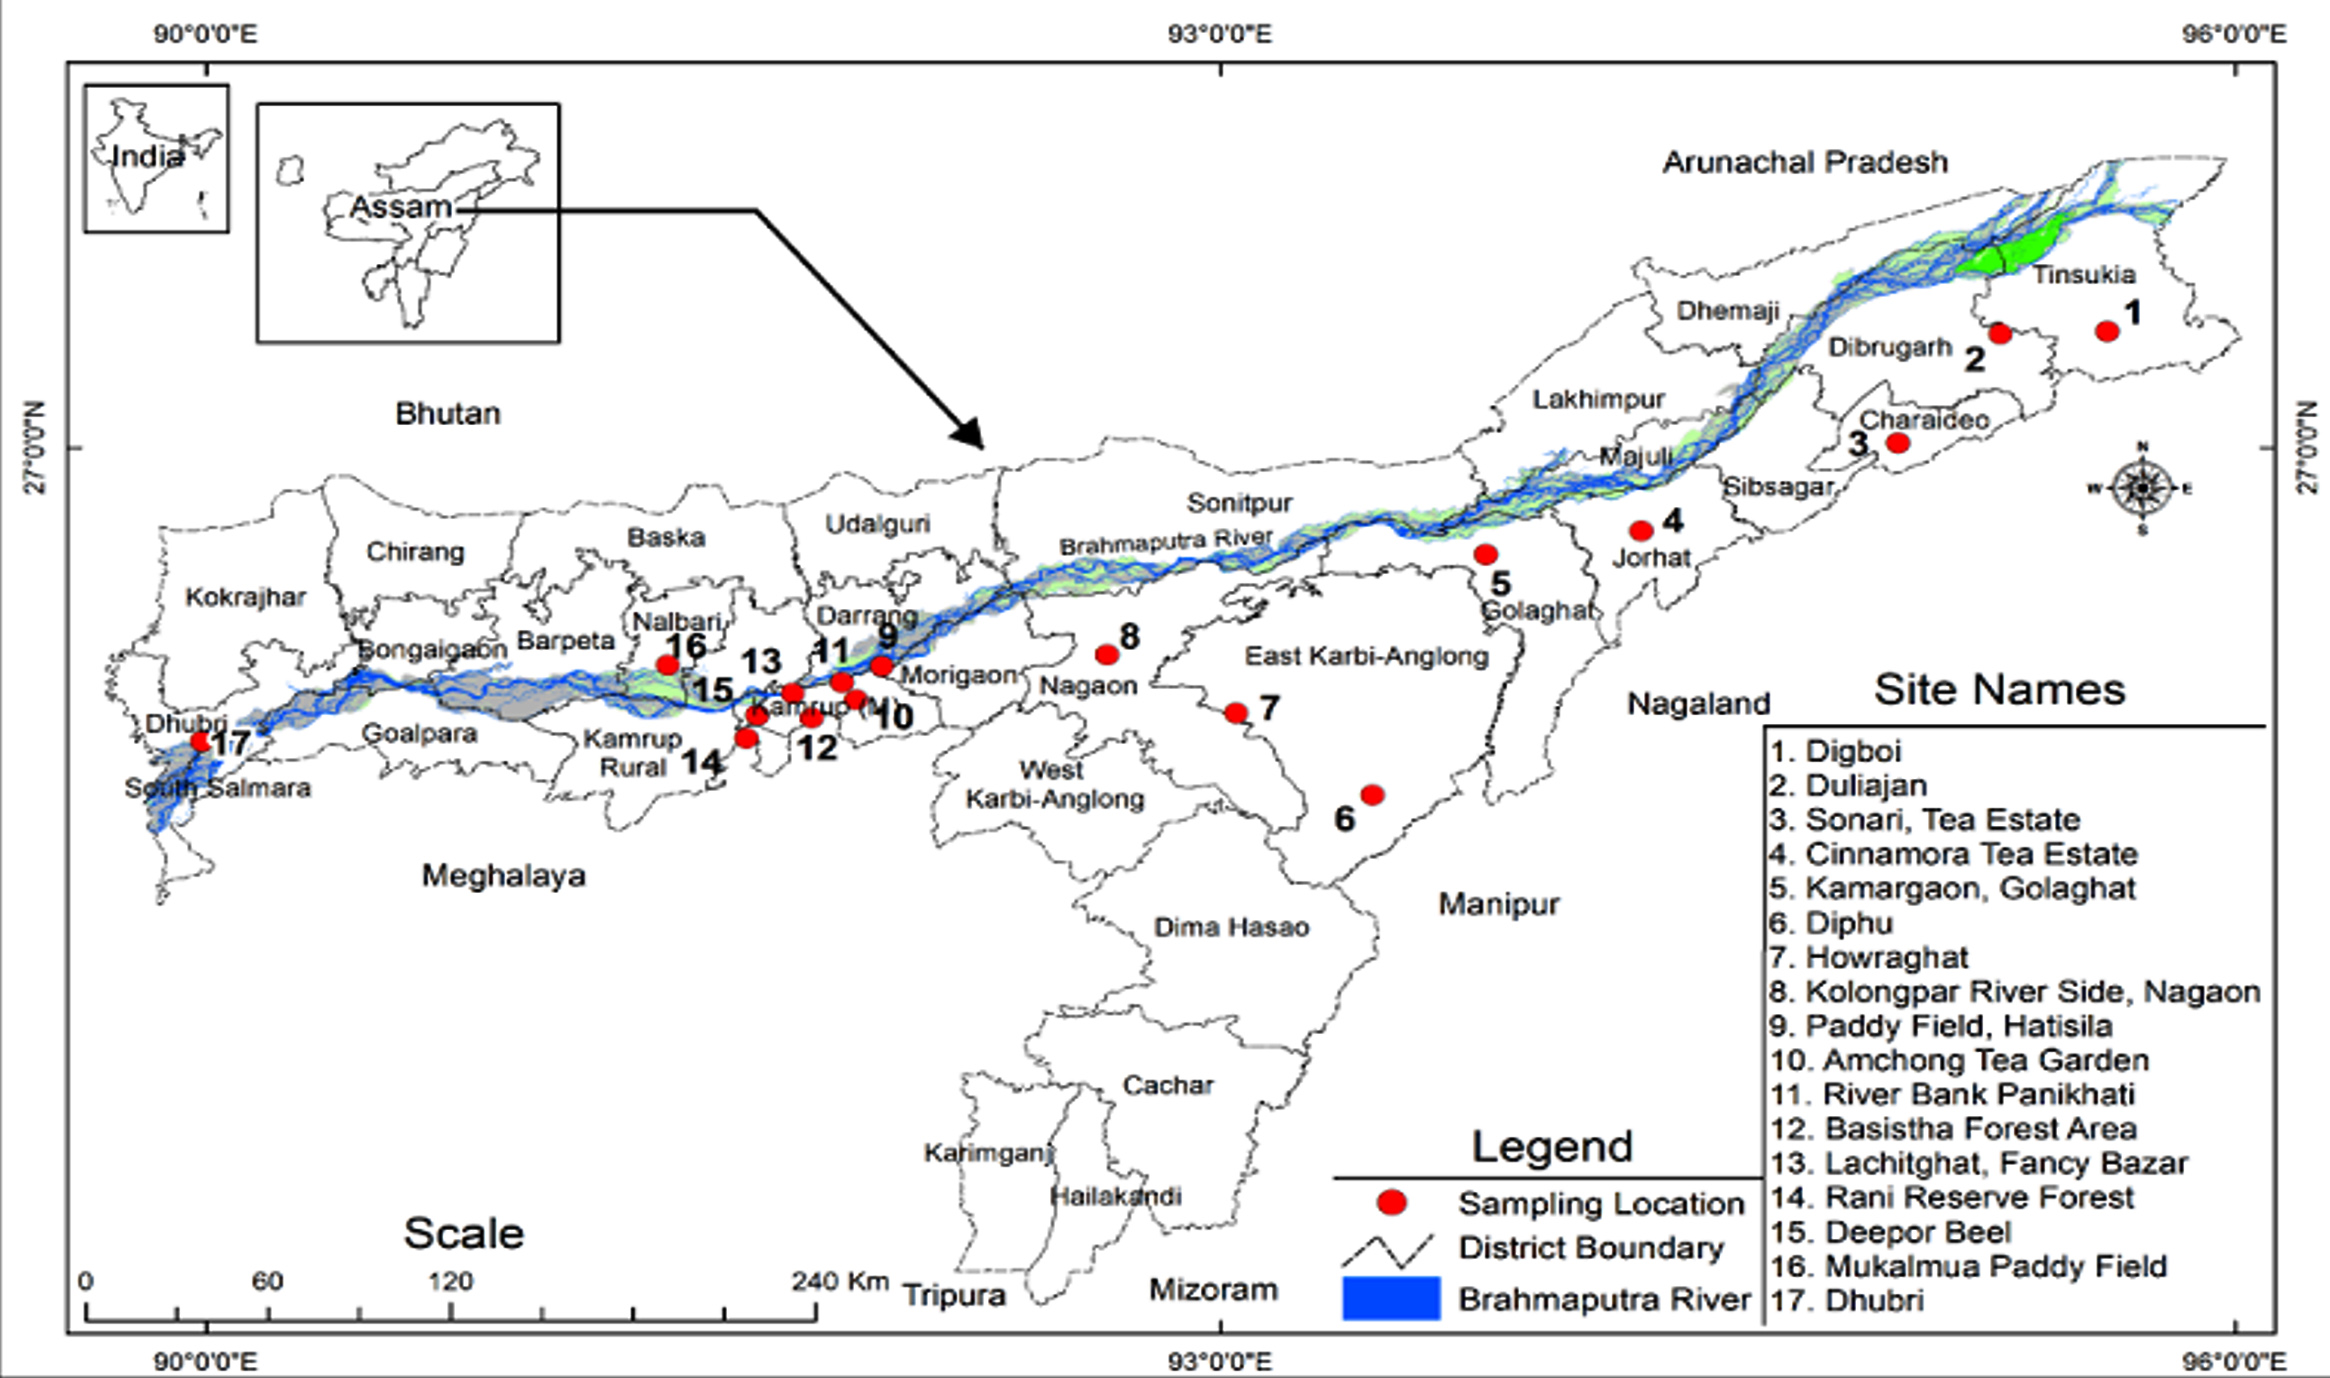
Figure 1. Map of Assam displaying the location of the sampling
Isolation and screening of pigmented bacteria
The collected soil samples were carried to the laboratory in a sterile container. Approximately 1.0g of materials were weighed, dissolved in 10mL of distilled water, serially diluted up to 10-8 dilutions, and then 0.1 ml of each dilution was plated over in a nutrient agar plate by using a sterile spreader. The plates were incubated at 35°C (±2) for 5 days and the plates at regular intervals for the appearance of the pigments (Figure 2). The pigmented colonies were screened and pure colonies of the strains were obtained by performing several rounds of the quadrant streaking method on sterile agar plates with 1.5% (w/v) of agar.16 Pure isolated strains were sub-cultured on nutrient agar slant and plates and allowed to grow for 2-3 days at 37°C. After incubation, the plates and slants were kept in the refrigerator at 4°C for further study.
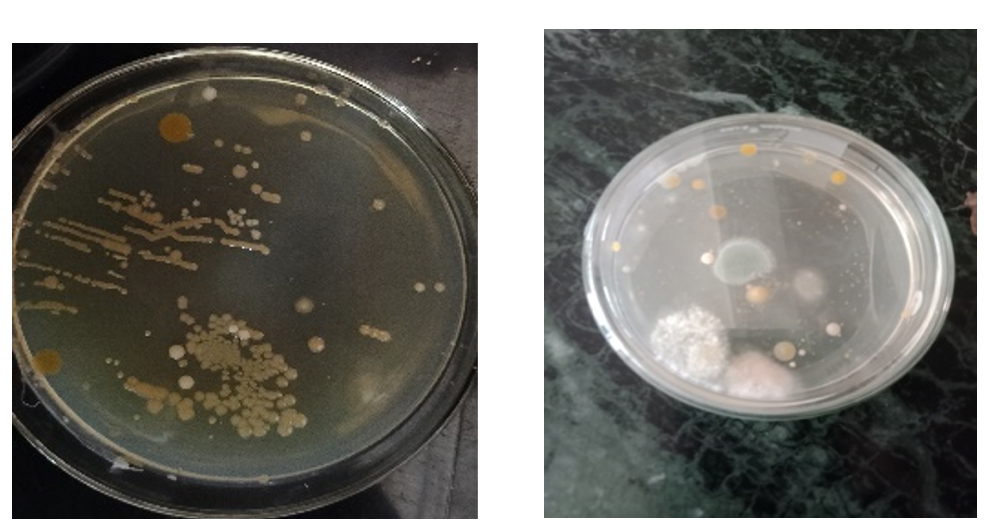
Figure 2. Isolation of pigmented bacteria
Morphological and biochemical characterization of pigmented isolates
With the aid of Bergey’s Manual of Determinative Bacteriology,17 the isolated pigmented strains were first identified based on their morphological, microscopic, and biochemical characteristics
Molecular characterization and Phylogenetic tree analysis of the isolated strains
Overnight-grown cultures of the isolated pigmented strains were used for DNA isolation. DNA was isolated by using a Macherey Nagel Nucleospin kit. For amplification of the 16S rRNA bacterial gene fragments, the 8F-806R (forward primer 5′-AGAGTTTGATCCTGGCTCAG-3′ and reverse primer 5′- GGACTACHVGGGTWTCTAAT-3′) were used. For the PCR reaction, the optimized parameters were initial denaturation at 95°C for 5min, followed by 35 cycles of denaturation at 95°C for 1 min, annealing at 54°C for 1min, extension at 72°C for 1min, and final extension at 72°C for 10 min. After amplification PCR products were electrophoresis by using 2% agarose gel. Amplified products were purified by using an ExoSAP-IT kit (Invitrogen) and were directly sequenced using an ABI PRISM BigDye Terminator V3.1 kit (Applied Biosystems, USA). The sequences were examined using the software Sequencing Analysis 5.2. The NCBI server’s BlastN site (http://www.ncbi.nlm.nih.gov/BLAST) was used to perform the BLAST analysis. By adding the closest-matching reference sequences from the NCBI Genbank nucleotide sequence database, MEGA 11 software was used to create a phylogenetic tree for each of the sample sequences.
Growth curve of pigment-producing bacteria
The viable cells of the purified pigment-producing bacteria were inoculated into a sterile Nutrient broth. After that, the culture medium’s incubation temperature was kept constant at 37°C under shaking conditions. The optical density of the bacterial growth at 405 nm (OD405) was measured for 72 hours at regular intervals of time to study the growth curve of the isolates.18
Optimization of different parameters for maximum production of pigment
For optimization of the maximum production of pigment, the following parameters were investigated: –
Effect of different temperatures on pigment production
The impact of incubation temperature on pigment production was examined by adjusting the NB medium’s temperature to 25°C, 30°C, 37°C, 40°C, and 45°C. The Erlenmeyer flasks containing 100 ml of the fermentation medium (pH: 7) were inoculated with 10% of freshly prepared bacterial cell suspension and were incubated for 48-72 hours under shaking conditions of 200 rpm. After completion of the incubation period, the biomass yields (mg/ml) of the pigment-producing microorganisms were then determined as dry weight per volume. Also from the culture extracellular pigment was extracted by the methanol solvent separation method and The quantification of the pigment yields was done as per the formula.19
Pigment yield (µg/ml) = O.D520 x 17.072
Effect of pH on pigment production
The nutrient broth was prepared in different sets and before autoclaving the pH of the broth was adjusted by using 1M HCl and 1M NaOH to 2, 4, 6, 8, 10 respectively and inoculated with 10% bacterial cell suspension and incubated for 48-72 hours under shaking conditions to study the effect of pH for pigment production. After completion of the incubation period similar methodology was adopted for biomass and pigment yield.
Effect of NaCl concentration on the pigment production
Nutrient broths were prepared in different sets and before autoclaving different NaCl concentrations were added (0.5%, 1%, 2%, 4%, 6%, 8%), respectively, and after that Erlenmeyer flask containing 100 ml of the medium was inoculated with 10% freshly prepared bacterial cell suspension and incubated for 48-72 hours to study the effect of salt concentration for pigment production. After the completion of the incubation period, a similar methodology which was applied to the effect of temperature conditions was adopted for biomass and pigment yield.
Statistical analysis
The experiments were carried out in triplicate, and the Analysis of Variance (ANOVA) test was used to statistically analyze the results.
Isolation and Screening of pigment-producing bacteria
In this study, a total of 7 pigmented colonies were isolated from the soil samples
(Table 2). Out of 7 pigmented colonies, 3 colonies showed orange color and 4 colonies showed yellow color. Based on the similarity of growth pattern and high intensity of pigmentation. One isolate from both pigments was selected for further studies. The isolate’s orange colony was designated as S1 (Figure 3), and the yellow ones were designated as S2 (Figure 3).
Table (2):
Colony morphology of S1 and S2 isolates
| S1 | S2 | |
|---|---|---|
| Colony Characteristics | ||
| Colony shape | Round convex | Round |
| Colony sizes | 0.5mm | 1-2mm |
| Margin | Entire | Entire |
| Surface | Smooth | Smooth |
| Color | Orange | Yellow |
| Cell morphology | ||
| Cell shape | Cocci | Bacilli |
| Gram staining | Gram-positive | Gram-positive |
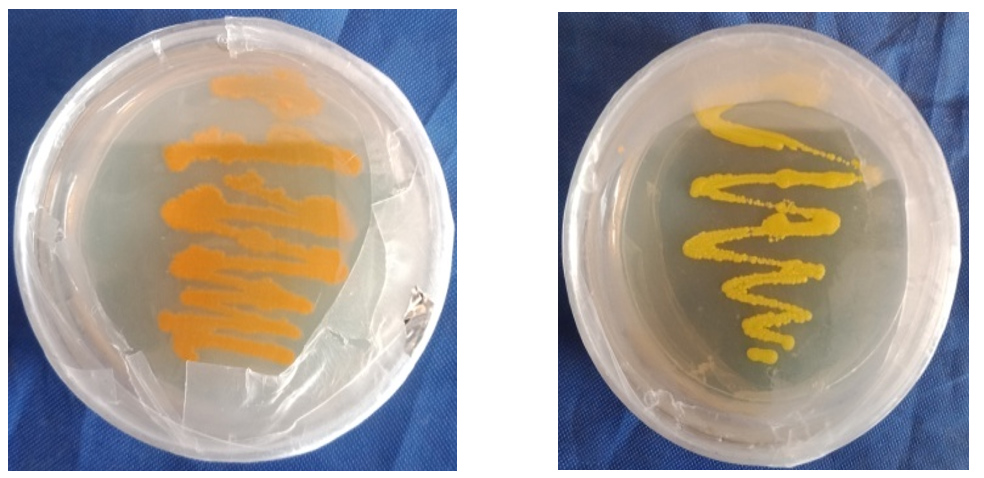
Figure 3. S1- Orange Isolates S2 Yellow Isolates
Morphological and biochemical characterization of pigmented isolates
The isolated S1 and S2 strains showed good growth on the nutrient agar medium. According to the colony morphology and cell properties of the bacterial isolates on Nutrient agar, the isolate developed to form dense orange and yellow colonies that were 0.5-2 mm in diameter and had smooth consistency within 3 to 5 days of incubation.20 The shape of the isolates and staining characteristics were identified by using Gram staining and biochemical analysis for both the isolates was analyzed by the Bergey Manual of Determinative Bacteriology and the results have been stated in Table 3 and 4. The Microscopic observation for both isolates were depicted in Figure 4 and 5. It was observed that similar biochemical results were carried out by the researchers Fatima and Anuradha, Prakash et al., and Arulselvi et al. in their study.21-23
Table (3):
Biochemical test for S1 and S2 isolates
Test |
S1 Isolates |
S2 Isolates |
|---|---|---|
Catalase test |
+ve |
+ve |
Indole |
-ve |
-ve |
MR |
+ve |
+ve |
VP |
+ve |
+ve |
Citrate |
+ve |
+ve |
TSI |
+ve |
-ve |
Urease |
-ve |
+ve |
Coagulase |
-ve |
-ve |
Starch hydrolysis |
+ve |
-ve |
Glucose |
+ve |
-ve |
Sucrose |
+ve |
-ve |
Maltose |
+ve |
-ve |
Lactose |
-ve |
+ve |
Mannitol |
-ve |
-ve |
Arbinose |
-ve |
-ve |
Xylose |
-ve |
-ve |
Table (4):
Specific Growth characteristics of the isolates
No. |
Laboratory Code Designation |
Species name and Accession Number |
Specific growth rate (μm cm-3 min-1) |
Generation time (h-1) |
PCV / mL (× 106) After 24 Hrs |
Colony texture in Nutrient agar media |
Colony Colour in Nutrient agar media |
|---|---|---|---|---|---|---|---|
1 |
S1 |
Micrococcus aloeverae ON377368 |
0.138 ± 0.032 |
7.14 ± 0.479 |
5.4 ± 0.75 |
Smooth, Opaque, Round |
Orange |
2 |
S2 |
Exiguobacterium aestuarii ON377409 |
0.145 ± 0.039 |
6.89 ± 0.441 |
3.9 ± 0.51 |
Smooth, Opaque, Round |
Yellow |
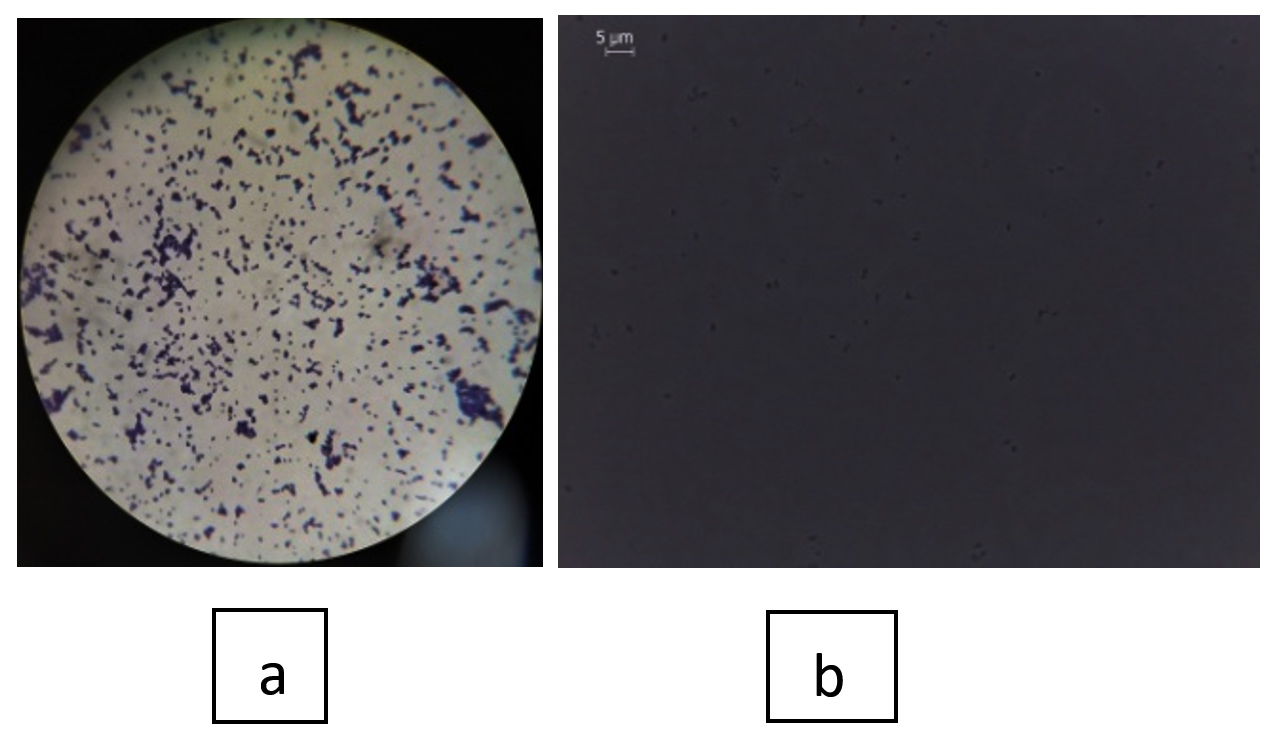
Figure 4(a, b). Gram staining and Phase contrast microscopy of S1 isolates
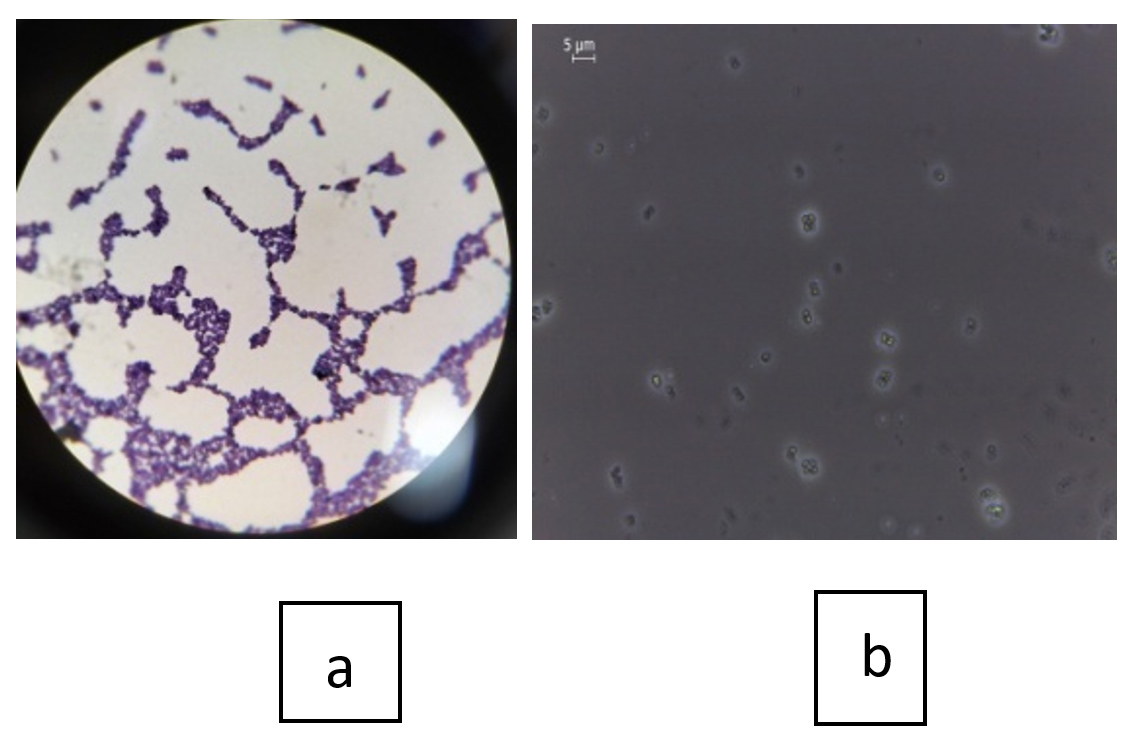
Figure 5(a, b). Gram staining and Phase contrast microscopy of S2 isolates
Molecular characterization and phylogenetic tree analysis
The low range 100-1000 bp molecular marker was used to separate the PCR amplicons in agarose 2% gel, and the amplified products were recorded using the BIO-RAD GelDoc-XR gel documentation system. The obtained sequences were then compared to sequences in the Genbank nucleotide database. With 98-100% similarity, phylogenetic analysis is used to identify the species. Utilizing the help of MEGA11 software, phylogenetic tree analysis and sequence alignment was performed. Based on the similarity obtained from the database, the S1 isolate containing 531bp was identified as Micrococcus aloeverae, and the S2 isolate containing 761bp was identified as Exiguobacterium aestuarii. The sequences were deposited in NCBI and the allocated accession no for Micrococcus aloeverae is ON377368 and Exiguobacterium aestuarii is ON377409 (Figure 6 and 7). The results revealed a high similarity of the 16S rRNA sequence of Micrococcus aloeverae and Exiguobacterium aestuarii with other species in the Micrococcus and Exiguobacterium genus, which was found by the different researcher in their study. The present result was in good agreement with Arulselvi et al., Zhao et al., and Shahin et al. Arulselvi et al. reported that the phenotypic characterization and 16SrDNA sequencing analysis helped to identify their two isolated yellow colour pigment-producing strains as Exiguobacterium aurantiacum.22 In another study reported by Zhao et al. and Shahin et al., they found two promising pigment-producing bacterial strain by using 16S rRNA sequencing analysis and they identified these strain as Micrococcus yunnanensis and Micrococcus lyale.24,25
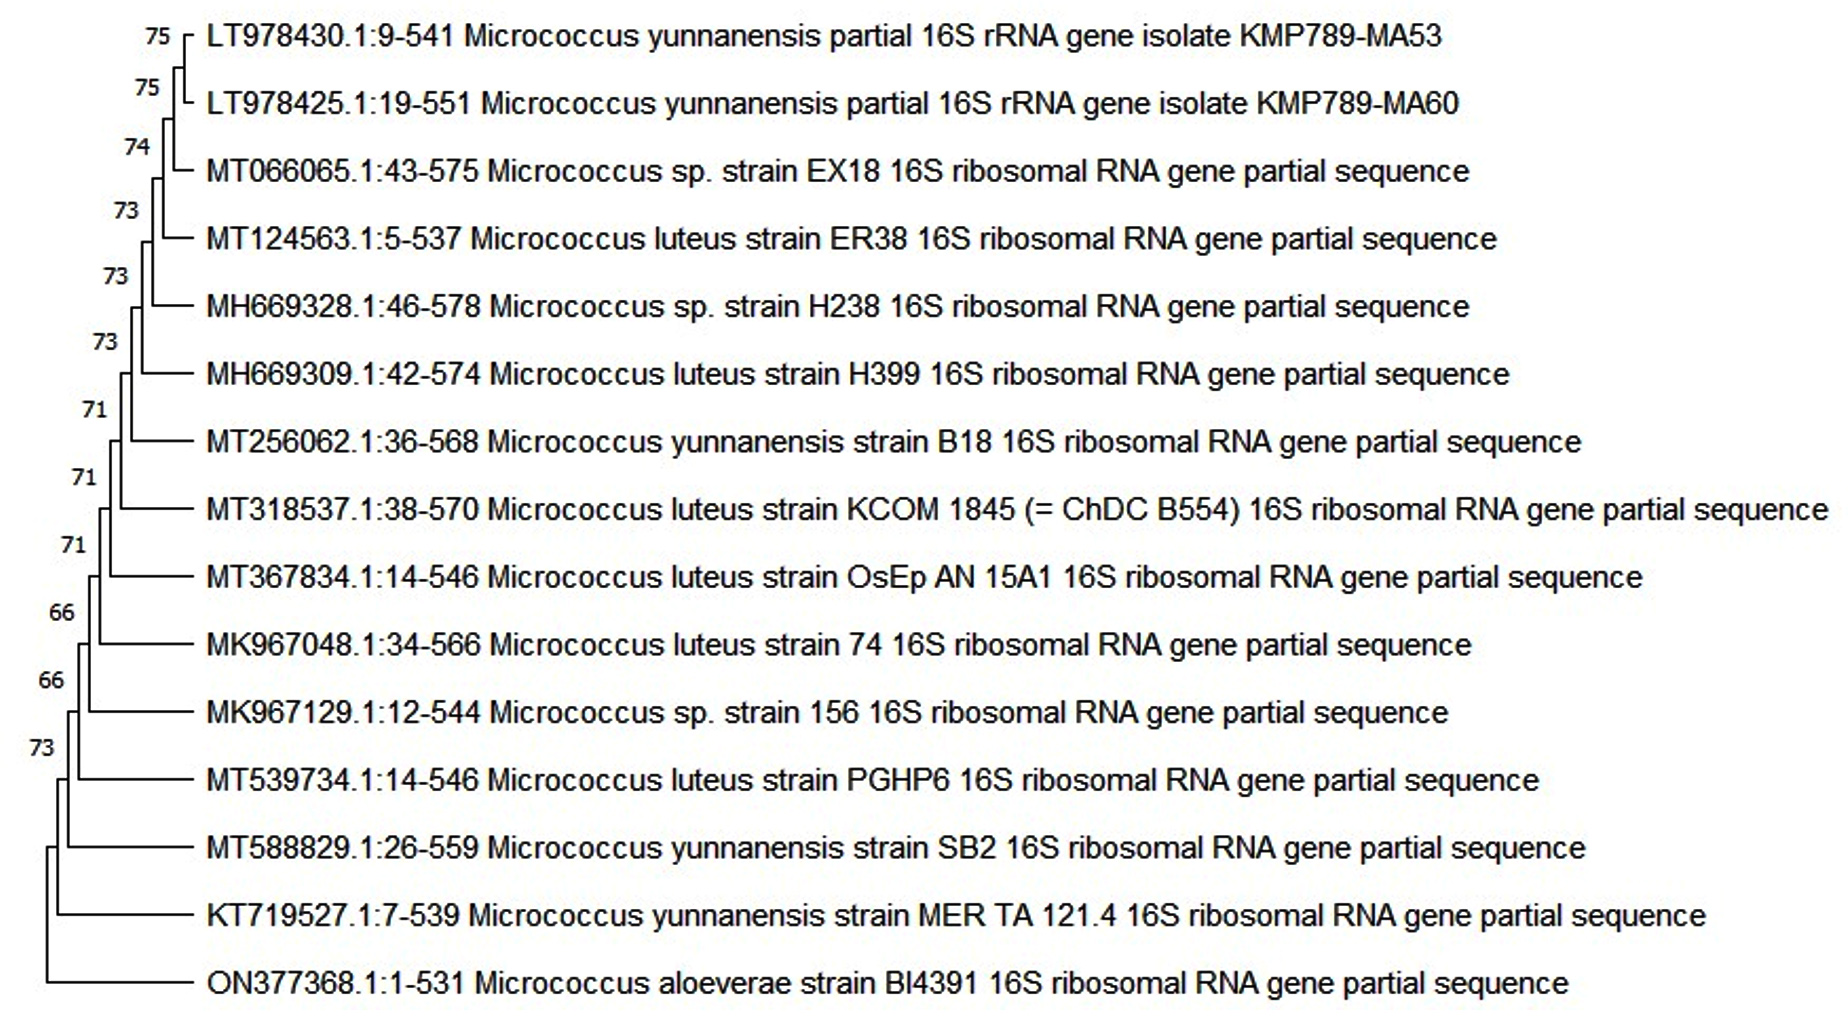
Figure 6. Phylogenetic tree of Micrococcus aloeverae
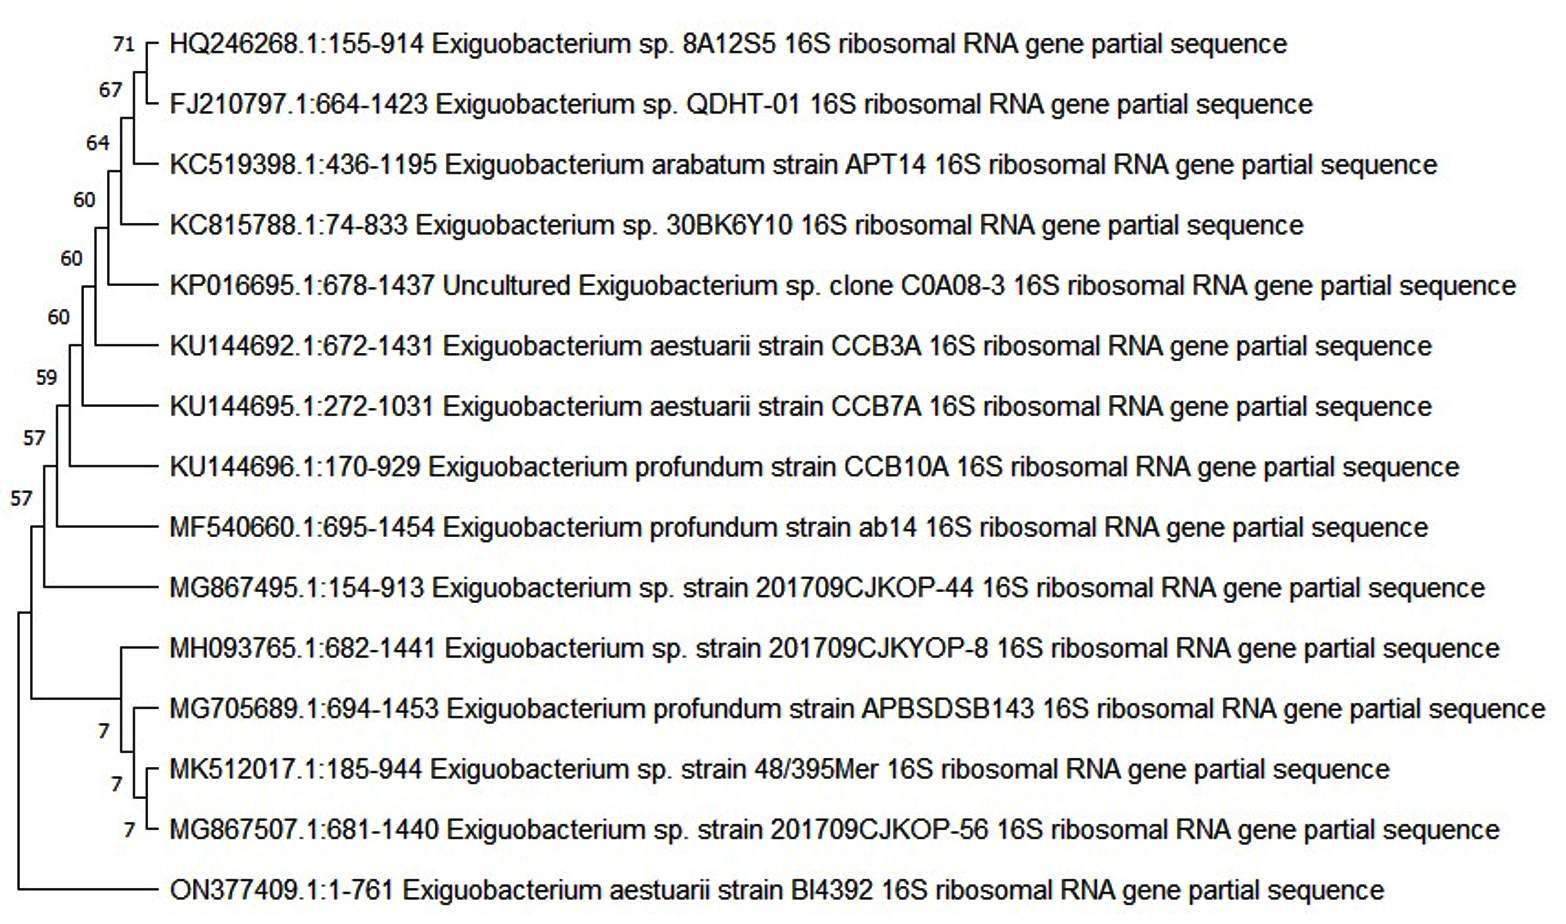
Figure 7. Phylogenetic tree of Exiguobacterium aestuarii
Growth curve of pigment-producing bacteria
The growth curve of pigment-producing bacterial strains of Micrococcus aloeverae and Exiguobacterium aestuarii were studied to understand their growth pattern. The strain shows specific growth rate, generation time and Packed cell volume (PCV) in 72 hours of growth condition in the Nutrient broth and also in solid media shows smooth, opaque and round colony (Table 5). In the growth curve characteristic study, the stationary phase was observed between 24 and 72 hrs (Figure 8). in both the isolates. The above result of the present study is similar to the results found by the researchers Margino et al. for Micrococcus sp. and Park et al. for Exiguobacterium sp. study.26,27
Table (5):
Effect of pH on pigment production
| Micrococcus aloeverae (S1) | Exiguobacterium aestuarii (S2) | |||
|---|---|---|---|---|
| pH levels | Biomass yield | Pigment yield | Biomass yield | Pigment yield |
| 2 | 3.4 ± 0.0192 | 8.2 ± 0.01581 | 3.7 ± 0.02702 | 8.4 ± 0.02074 |
| 4 | 4.0 ± 0.01581 | 9.8 ± 0.01817 | 4.0 ± 0.03847 | 10.6 ± 0.02739 |
| 6 | 7.9 ± 0.01483 | 15.2 ± 0.03050 | 8.2 ± 0.03033 | 22.1 ± 0.03050 |
| 8 | 3.6 ± 0.02074 | 8.1 ± 0.01924 | 3.9 ± 0.02864 | 9.9 ± 0.03782 |
| 10 | 2.2 ± 0.01140 | 6.0 ± 0.01393 | 2.4 ± 0.01673 | 5.3 ± 0.01924 |
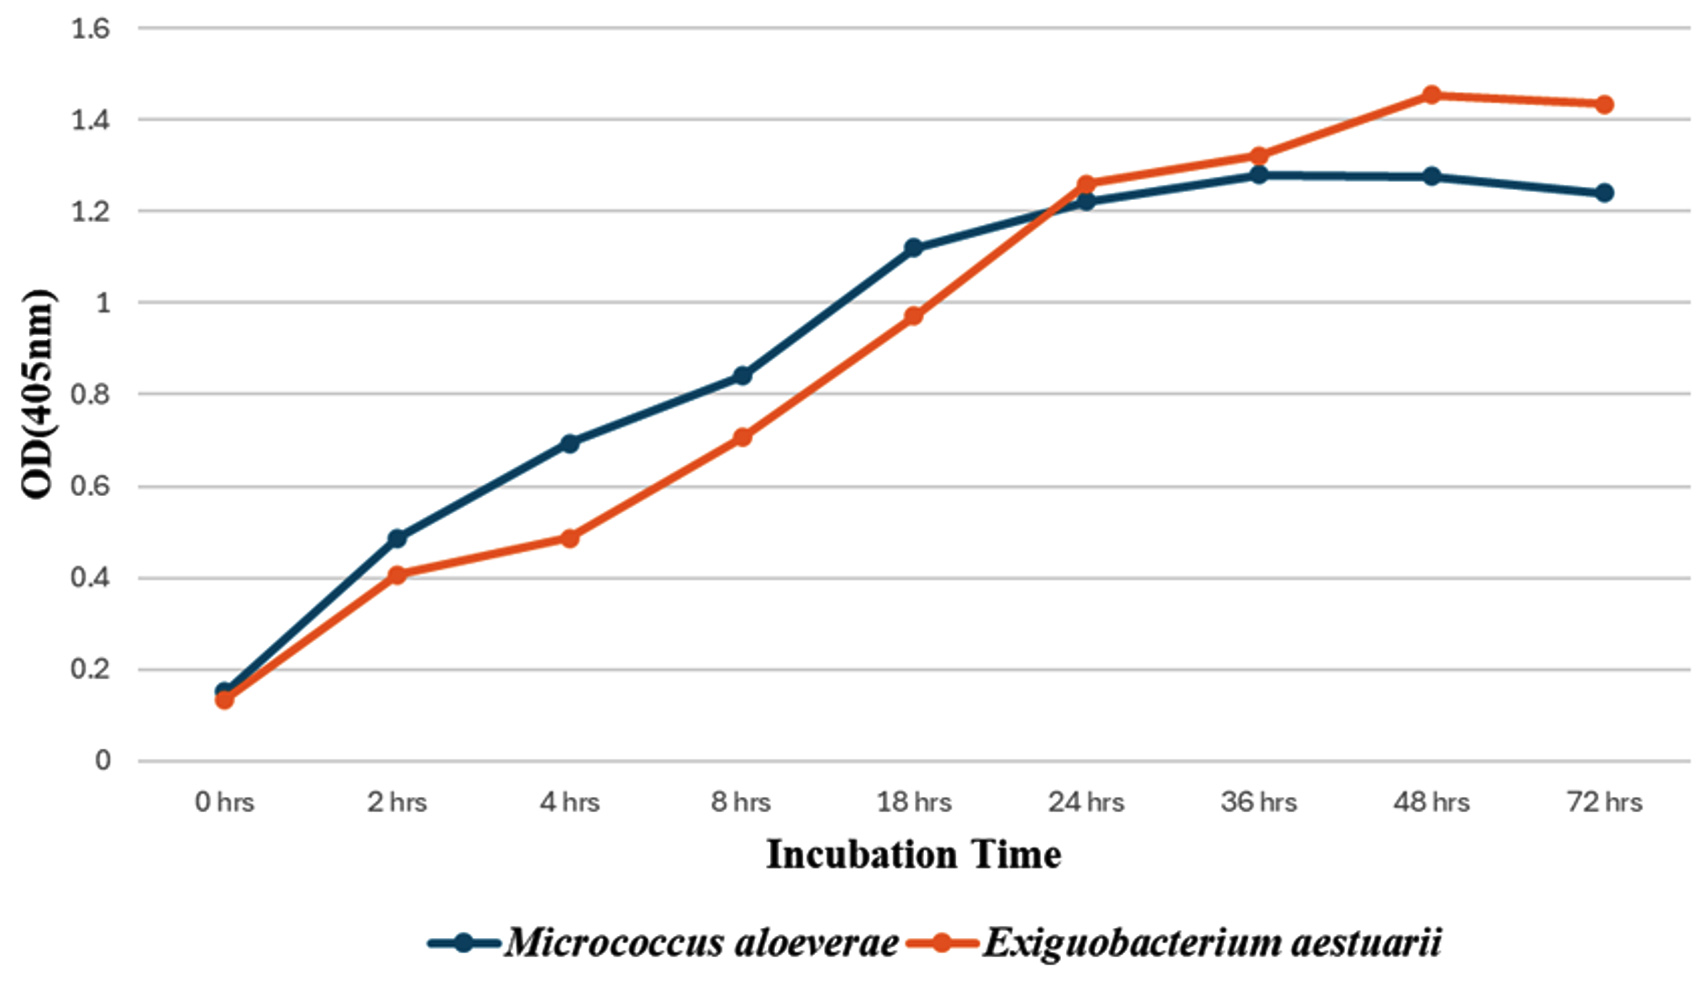
Figure 8. Growth curve of Micrococcus aloeverae and Exiguobacterium aestuarii
Optimization of different parameters for maximum production of pigment
Effect of temperature, pH, and NaCl concentration on pigment production
Generally, the production of pigments by the bacterial strains depends on several factors. For the effect of pH and temperature on Micrococcus aloeverae and Exiguobacterium aestuarii the maximum pigment yield was obtained at pH 6.0 and the best temperature was 37°C (Table 6, 7 and 8). When the pH level increased, the pigment production rate decreased sharply due to the decrease in the growth of the bacterial cells. A similar study on pigment production was conducted by Choubey et al. for Micrococcus sp., Kandaswamy and Kathirvel for Micrococcus luteus and Fatima and Anuradha for Exiguobacterium and Micrococcus sp. where they reported that pH 7 and temperature 37°C was good optimized condition for pigment production.21,28,29 According to Mohana et al., Micrococcus roseus grew best at pH 8 and 37°C.30 For the effect of NaCl concentration on Micrococcus aloeverae the maximum pigment yield was obtained at 1.50% NaCl concentrations and in the case of Exiguobacterium aestuarii the maximum pigment yield was obtained at 2% NaCl Concentrations. Other literature findings reported that the species belonging to the genus Micrococcus and Exiguobacterium showed the maximum pigment production at 2% and 4%, respectively.21
Table (6):
Effect of temperature on pigment production
| Micrococcus aloeverae (S1) | Exiguobacterium aestuarii (S2) | |||
|---|---|---|---|---|
| Temperature (°C) | Biomass yield | Pigment yield | Biomass yield | Pigment yield |
| 25 °C | 4.0 ± 0.01517 | 9.1 ± 0.02408 | 4.3 ± 0.01581 | 11.5 ± 0.03808 |
| 30 °C | 7.0 ± 0.01581 | 14.5 ± 0.02302 | 7.8 ± 0.04393 | 21.5 ± 0.03633 |
| 37 °C | 8.6 ± 0.02387 | 20.0 ± 0.07266 | 9.8 ± 0.02775 | 27.2 ± 0.03033 |
| 40 °C | 6.9 ± 0.01924 | 13.8 ± 0.02881 | 7.5 ± 0.11256 | 19.3 ± 0.04722 |
| 45 °C | 3.7 ± 0.02387 | 8.8 ± 0.03912 | 3.9 ± 0.05339 | 9.4 ± 0.04278 |
Table (7):
Effect of NaCl concentration on pigment production
| Micrococcus aloeverae (S1) | Exiguobacterium aestuarii (S2) | |||
|---|---|---|---|---|
| Concentration of salt (%) | Biomass yield | Pigment yield | Biomass yield | Pigment yield |
| 0.25 | 6.6 ± 0.02775 | 14.8 ± 0.01581 | 6.4 ± 0.02074 | 16.5 ± 0.30335 |
| 0.50 | 6.9 ± 0.01924 | 15.8 ± 0.01000 | 5.9 ± 0.04743 | 16.1 ± 0.15595 |
| 1.00 | 7.8 ± 0.03899 | 20.1 ± 0.05683 | 6.8 ± 0.03564 | 17.1 ± 0.03347 |
| 1.50 | 8.8 ± 0.05413 | 24.0 ± 0.04970 | 7.1 ± 0.01924 | 21.0 ± 0.03435 |
| 2.00 | 8.3 ± 0.01673 | 22.1 ± 0.01483 | 8.9 ± 0.01581 | 25.4 ± 0.03194 |
Table (8):
Statistical analysis for biomass and pigment yield
| Variables | Source of variation | Degrees of Freedom (DF) | Sum of square (SS) | Mean square | F-value | P-value |
|---|---|---|---|---|---|---|
| Biomass yields (pH) S1 | Between Groups | 92.969 | 4 | 23.242 | 83007.857 | < 0.001 |
| Within Groups | 0.006 | 20 | 0.000 | |||
| Total | 92.974 | 24 | ||||
| Pigment yields (pH) S1 | Between Groups | 242.534 | 4 | 60.634 | 106374.572 | < 0.001 |
| Within Groups | 0.011 | 20 | 0.001 | |||
| Total | 242.545 | 24 | ||||
| Biomass yields (pH) S2 | Between Groups | 96.149 | 4 | 24.037 | 28412.700 | < 0.001 |
| Within Groups | 0.017 | 20 | 0.001 | |||
| Total | 96.165 | 24 | ||||
| Pigment yields (pH) S2 | Between Groups | 816.080 | 4 | 204.020 | 260895.005 | < 0.001 |
| Within Groups | 0.016 | 20 | 0.001 | |||
| Total | 816.095 | 24 | ||||
| Biomass yields (NaCl) S1 | Between Groups | 17.841 | 4 | 4.460 | 3799.119 | < 0.001 |
| Within Groups | 0.023 | 20 | 0.001 | |||
| Total | 17.864 | 24 | ||||
| Pigment yields (NaCl) S1 | Between Groups | 312.041 | 4 | 78.010 | 62209.199 | < 0.001 |
| Within Groups | 0.025 | 20 | 0.001 | |||
| Total | 312.066 | 24 | ||||
| Biomass yields (NaCl) S2 | Between Groups | 25.036 | 4 | 6.259 | 6847.954 | < 0.001 |
| Within Groups | 0.018 | 20 | 0.001 | |||
| Total | 25.054 | 24 | ||||
| Pigment yields (NaCl) S2 | Between Groups | 314.024 | 4 | 78.506 | 3280.383 | < 0.001 |
| Within Groups | 0.479 | 20 | 0.024 | |||
| Total | 314.503 | 24 | ||||
| Biomass yields (Temperature) S1 | Between Groups | 89.103 | 4 | 22.276 | 41099.199 | < 0.001 |
| Within Groups | 0.011 | 20 | 0.001 | |||
| Total | 89.114 | 24 | ||||
| Pigment yields (Temperature) S1 | Between Groups | 421.675 | 4 | 105.419 | 60239.249 | < 0.001 |
| Within Groups | 0.035 | 20 | 0.002 | |||
| Total | 421.710 | 24 | ||||
| Biomass yields (Temperature) S2 | Between Groups | 124.831 | 4 | 31.208 | 8448.249 | < 0.001 |
| Within Groups | 0.074 | 20 | 0.004 | |||
| Total | 124.905 | 24 | ||||
| Pigment yields (Temperature) S2 | Between Groups | 1074.274 | 4 | 268.568 | 173269.935 | < 0.001 |
| Within Groups | 0.031 | 20 | 0.002 | |||
| Total | 1074.305 | 24 |
Statistical analysis
The post-hoc ANOVA analysis for biomass and pigment yields under different pH, NaCl concentrations, and temperature conditions are summarized in Table 8. The table presents the sources of variation (Between Groups and Within Groups), degrees of freedom (DF), sum of squares (SS), mean square (MS), F-value, and p-value for the respective factors and levels. In all the cases of this analysis was shown that the p-values are less than 0.001, indicating significant differences between groups. Additionally, the large F-values suggest strong evidence against the null hypothesis, indicating significant variability between groups compared to within groups. Therefore, the optimized conditions (pH, NaCl concentration, and temperature) significantly affect both biomass and pigment yields.
The result obtained from this study revealed that nature is the best habitat for microbial flora. Numbers of pigment-producing bacteria are present in the soil. In this study, the isolated pigment-producing bacteria were identified as Micrococcus aloeverae ON377368 (Orange) and Exiguobacterium aestuarii ON377409(Yellow). Both the isolates were collected from different soil habitats of Assam. These pigment-producing bacteria provide crucial information for the production of environmentally acceptable bio-color. Future research should concentrate on elucidating nature, and these pigments could be employed as a source of natural pigments for the food, pharmaceutical, and other cosmetic industries as well as for textiles.
ACKNOWLEDGMENTS
The authors are thankful to Assam down town University for providing laboratory facilities to carry out the research work.
CONFLICT OF INTEREST
The authors declare that there is no conflict of interest.
AUTHORS’ CONTRIBUTION
All authors listed have made a substantial, direct and intellectual contribution to the work, and approved it for publication.
FUNDING
None.
DATA AVAILABILITY
All datasets generated or analyzed during this study are included in the manuscript.
ETHICS STATEMENT
This study was approved by the Ethics Committee, Assam down town University, Guwahati, India, with the memo number AdtU/Ethics/Ph.D scholar/2021/056.
- Orna MV, Fontani M. The modernity of ancient pigments: a historical approach. Colorants. 2022;1(3):307-346.
Crossref - Azman AS, Mawang CI, Abubakar S. Bacterial pigments: The bioactivities and as an alternative for therapeutic applications. Nat Prod Commun. 2018;13(12):1747-1754.
Crossref - Venil CK, Dufossé L, Renuka Devi P. Bacterial pigments: sustainable compounds with market potential for pharma and food industry. Front Sustain Food Syst 4: 100. Published online 2020.
Crossref - Ramesh C, Vinithkumar NV, Kirubagaran R, Venil CK, Dufossé L. Multifaceted applications of microbial pigments: current knowledge, challenges and future directions for public health implications. Microorganisms. 2019;7(7):186.
Crossref - Pailliè-Jiménez ME, Stincone P, Brandelli A. Natural pigments of microbial origin. Front Sustain Food Syst. 2020;4:590439.
Crossref - Dikshit R, Tallapragada P. Comparative study of natural and artificial flavoring agents and dyes. In: Natural and Artificial Flavoring Agents and Food Dyes. Elsevier; 2018:83-111.
Crossref - Agarwal H, Bajpai S, Mishra A, et al. Bacterial Pigments and Their Multifaceted Roles in Contemporary Biotechnology and Pharmacological Applications. Microorganisms. 2023;11(3):614.
Crossref - Mussagy CU, Khan S, Kot AM. Current developments on the application of microbial carotenoids as an alternative to synthetic pigments. Crit Rev Food Sci Nutr. 2021;62(25):6932-6946.
Crossref - Novoveská L, Ross ME, Stanley MS, Pradelles R, Wasiolek V, Sassi JF. Microalgal carotenoids: A review of production, current markets, regulations, and future direction. Mar Drugs. 2019;17(11):640.
Crossref - Silva TR, Tavares RSN, Canela-Garayoa R, et al. Chemical characterization and biotechnological applicability of pigments isolated from Antarctic bacteria. Mar Biotechnol. 2019;21:416-429.
Crossref - Narsing Rao MP, Xiao M, Li WJ. Fungal and bacterial pigments: Secondary metabolites with wide applications. Front Microbiol. 2017;8(JUN):1113.
Crossref - Indra Arulselvi P, Umamaheswari S, Ranandkumar Sharma G, Karthik C, Jayakrishna C. Screening of yellow pigment producing bacterial isolates from various eco-climatic areas and analysis of the carotenoid produced by the isolate. J Food Process Technol. 2014;5(292):2.
Crossref - Devi M, Ramakrishnan E, Deka S, Parasar DP. Bacteria as a source of biopigments and their potential applications. J Microbiol Methods. Published online 2024:106907.
Crossref - Celedón RS, Díaz LB. Natural pigments of bacterial origin and their possible biomedical applications. Microorganisms. 2021;9(4):739.
Crossref - Parasar DP, Sarma HK, Kotoky J. Exploring the genealogy and phenomic divergences of indigenous domesticated yeasts cultivated by six ethnic communities of Assam, India. J Biol Sci. 2017;17:91-105.
Crossref - Padhan B, Poddar K, Sarkar D, Sarkar A. Production, purification, and process optimization of intracellular pigment from novel psychrotolerant Paenibacillus sp. BPW19. Biotechnol Reports. 2021;29:e00592.
Crossref - Breed RS, Murray EGD, Smith NR. Bergey’s manual of determinative bacteriology. Bergey’s Man Determ Bacteriol. 1957;(7th Edition).
- Moayedi A, Nowroozi J, Sepahy AA. Effect of fetal and adult bovine serum on pyocyanin production in Pseudomonas aeruginosa isolated from clinical and soil samples. Iran J Basic Med Sci. 2017;20(12):1331.
- Essar DW, Eberly LEE, Hadero A, Crawford IP. Identification and characterization of genes for a second anthranilate synthase in Pseudomonas aeruginosa: interchangeability of the two anthranilate synthases and evolutionary implications. J Bacteriol. 1990;172(2):884-900.
Crossref - Chaudhari VM, Jobanputra AH. Isolation, identification and characterization of novel pigment producing bacteria from distillery spent wash. Biotech Indian J. 2013;7(5):194-200.
- Fatima M, Anuradha K. Isolation, Characterization, and Optimization Studies of Bacterial Pigments. J Pure Appl Microbiol. 2022;16(2):1039-1048 .
Crossref - Arulselvi I, Sasidharan P, Raja R, Karthik C, Gurumayum RS. Isolation and characterization of yellow pigment producing Exiguobacterium sps. J Biochem Technol. 2013;4(4):632-635.
- Prakash O, Nimonkar Y, Munot H, et al. Description of Micrococcus aloeverae sp. nov., an endophytic actinobacterium isolated from Aloe vera. Int J Syst Evol Microbiol. 2014;64(Pt_10):3427-3433.
Crossref - Zhao GZ, Li J, Qin S, et al. Micrococcus yunnanensis sp. nov., a novel actinobacterium isolated from surface-sterilized Polyspora axillaris roots. Int J Syst Evol Microbiol. 2009;59(10):2383-2387.
Crossref - Shahin YH, Elwakil BH, Ghareeb DA, Olama ZA. Micrococcus lylae MW407006 pigment: production, optimization, nano-pigment synthesis, and biological activities. Biology (Basel). 2022;11(8):1171.
Crossref - Margino S, Martani E, Magdalena M. Superoxide dismutase of Micrococcus sp. S2 and its involve in Paraquat detoxification. Indones J Biotechnol. 2007;12:973-979.
- Park JH, Chon HT. Characterization of cadmium biosorption by Exiguobacterium sp. isolated from farmland soil near Cu-Pb-Zn mine. Environ Sci Pollut Res. 2016;23:11814-11822.
Crossref - Choubey S, Chapade SV, Garud SA. Optimization of pigment production by Micrococcus and Arthrobacter species isolated from soil and water. Int J Res Pharm Sci. 2021;12(3):1902-1907.
Crossref - Kandasamy GD, Kathirvel P. Production, characterization and in vitro biological activities of crude pigment from endophytic Micrococcus luteus associated with Avicennia marina. Arch Microbiol. 2024;206(1):26.
Crossref - Mohana DC, Thippeswamy S, Abhishek RU. Antioxidant, antibacterial, and ultraviolet-protective properties of carotenoids isolated from Micrococcus spp. Radiat Prot Environ. 2013;36(4):168-174.
Crossref
© The Author(s) 2024. Open Access. This article is distributed under the terms of the Creative Commons Attribution 4.0 International License which permits unrestricted use, sharing, distribution, and reproduction in any medium, provided you give appropriate credit to the original author(s) and the source, provide a link to the Creative Commons license, and indicate if changes were made.