

ISSN: 0973-7510
E-ISSN: 2581-690X
In vitro effect on chickpea seedling induced by biopriming of Trichoderma viride ie. the treatment T1(T. viride 5g/kg seed) was excelled overall significant superior performance by contributing 68%, 12.07cm, 16.37cm, 28.44cm, 0.592g, 1933.92 and 40.26 in germination, root length, shoot length, seedling length, dry weight, vigour index I and vigour index II, respectively. The highest protein content was observed in chickpea seedling that’s bioprimed by Trichoderma viride formulation (T. viride @5g/kg seeds) was estimated through Kelplus analizer was 0.41%. The protein quantification of chickpea seedlings was estimated through Lowry and Bradford method were 1.06 and 1.08 mg /ml. The protein profiling of chickpea seedling on SDS PAGE were observed maximum five bands, first band at 250 kda, second band at 100 kda, third band was lying between 75 to 50 kda, and fourth band was at 20 kda.
Chickpea seedling, biopriming, Trichoderma viride and vigour index
Chickpea, commonly known as Gram or Bengal gram is the most important pulse crop in India. It’s probable place of origin lies in south western Asia. The important gram growing countries are India, Pakistan, Ethiopia, Burma and Turkey. India ranks first in the world in respect of production as well as acreage followed by Pakistan. In India the major chickpea producing states are Madhya Pradesh, Rajasthan, Uttar Pradesh, Haryana, Maharashtra and Punjab. Chickpea (Cicer arietinum L.) is an important leguminous crop grown in diverse soils and agro-climatic conditions. Chickpea occupies about 38 per cent of area under pulses and contributes about 50 per cent of the total pulse production of India. In India Chickpea is cultivated on area 9.60 million ha with annual production (grains) of 8.83 million tonnes and average yield level is 920 kg/ha, (FAO STAT, 2013).
Chickpea is a good source of energy, protein, minerals, vitamins, fibre, and also contains potentially health-beneficial minerals and vitamins. The protein content ranged from 18.46 to 24.46 g/100g, oil content ranged from 5.68 to 9.01 g/100g and ash from 3.55 to 4.46 g/100g (Nobile et al. 2013). It is used for human consumption as well as for feeding to animals. It is eaten both whole fried or boiled and salted or more generally in the form of split pulse, which is cooked and eaten. Both husks and bits of the ‘dal’ are valuable cattle feed. Fresh green leaves are used as vegetable (sag). Straw of chickpea is an excellent fodder for cattle. The grains are also used as vegetable (chhole). Chickpea flour (besan) is used in the preparation of various types of sweets. Recent studies have also shown that they can assist in lowering of cholesterol in the bloodstream (Murty et al., 2010). Trichoderma sp. are well known as biopriming agent for biological suppression of several soil borne diseases. Thus the application of bio-control agents (BCAs)) for plant disease are currently being examined as alternatives to the synthetic pesticides due to their perceived increased level of safety and minimal environmental impacts (Cotxarrera et al., 2002; Brimner and Boland, 2003).
Freshly harvested seed of chickpea (Uday) was obtained from seed processing plant of C. S. Azad university of Agriculture & Technology, Kanpur. 50 seeds for each treatment were counted, weighted and soaked overnight in 100 ml water with different doses of biocontrol agent (T. viride (49CP), fungicide and pathogen in three replications. Treatments were as follows:
Treatment details
T1 : Seed biopriming @ 5g T. viride formulation/kg of seed.
T2 : Seed biopriming @ 10g T. viride formulation/kg of seed.
T3 : Seed biopriming @ 15g T. viride formulation/kg of seed.
T4 : Seed biopriming @ 20g T. viride formulation/kg of seed.
T5 : Seed biopriming @ 0.2% of Bavistin/ kg seed.
T6 : Seed inoculated @ 10 % Foc / kg seed.
T7 : Control (without Treatment).
Experimental details
Biocontrol agent used – Trichoderma viride (49CP)
Substrates used – crystal sand
Plastic tray size – 20×15’’
Crop – chickpea
Variety – Uday
Design – Completely Randomized Design (CRD)
No. of Treatments – 7
No. of Replications – 3
No. of plastic tray – 21
Date of sowing – 31-01-2015
Sterilization of crystal sands
Crystal sand was sterilized by placing it in poly bags (of 5kg. capacity) at 121.6 ºC (1.1kg/cm2) temp. for 30 minutes, in an autoclave.
Tray filling with sands and sowing of chickpea seeds
After sterilization, crystal sand was left overnight for proper cooling. Next day 21 plastic trays were filled with sterilized crystal sand @ 1kg per tray. In each tray 50 (10×5) bioprimed chickpea seeds were sown and covered with one thin layer of crystal sands.
Assessment of germination, root length, shoot length and vigour index of chickpea
After sowing of chickpea seed watering/spraying were done regularly at 3 days of interval through hand sprayer for maintained moisture in crystal sand. Number of geminated seeds was counted after 10 days of sowing and calculated germination percentage as following formula
Germination % = [ No. of germinated seeds / No. of total sown seeds ] × 100
Seedling length of the seed was recorded 20 days after treatments in all the experiments. Shoot and root lengths of the seeds were recorded on the basis of randomly selected ten plants per treatment in lab experiment (Dubey et al. 2011).
The dry weight of the seedling were measured on the basis of randomly selected 10 germinated seeds per experiment were placed in hot air oven at 60º C for 36 hours.
Two recommended methods were used as described by (Abdul Baki and Anderson1973) for calculation of vigour index I and vigour index II was
Vigour index I = Germination per cent × seedling length
Vigour index II = Germination per cent × dry weight
Protein analysis of chickpea seedling through Kjeldahl method
Total protein content of chickpea seedling of different treatments were estimated by Kel plus (Pelican –ultima Deo Dist.) nitrogen analyzer. Total protein and nitrogen estimated by this method, multiplied by a factor for estimating the total protein content. About 1g dried and well-powdered sample was accurately weighting on a piece of filter paper and transfer along with the filter paper to 30ml micro Kjeldahl digestion tube. Then 15ml of conc. H2So4 and 3g digestion mixture (C4SO4 K2SO4 5:1) added to digestion tube. Sample was digestion an electric heater at 4000C for 2h.
After cooling, the digest transferred to micro Kjeldahl distillation apparatus using successive small quantities of water. 20ml of 2.5 per cent NaOH solution poured in it and NH3 liberated by steam distillation was collected in 100ml conical flask containing 20ml of 40 per cent boric acid solution in which few drops of mixed indicator added. Boric acid containing ammonium borate was titrated against N/10 standard HCL until the first appearance of pink colour at the endpoint. A reagent blank with filter paper (no sample, only digestion mixture and H2SO4) also run and titrated value for blank recorded. Percent N in the sample calculated by using following formula:
Nitrogen % = ((1.4 x N x V)/W) x 100
Protein % = Nitrogen % x 6.25
Where,
N = Normality of HCL
V = Titre value of sample – Titre value of blank
W = Weight of the sample
Protein estimation of chickpea seedling by Bradford method
The 4mg/ml of the BSA was used as standard. Different dilutions of the standard were made (0.5, 1, 2, 3 and 4mg) into tube 1 aliquot 100µl of D.W., this was served as blank. To each tube of standard and sample add 1ml of the Bradford reagent was added and mixed. All tubes were incubated at RT for 2min. After incubation period optical density was taken at 595nm by using spectrophotometer (Bio-Rad). Calibration curve was constructed by plotting absorbance reading on Y axis against standard protein concentration (mg/ml). Sample conc. was calculated using standard graph as a reference.
Protein estimation of chickpea seedling by Lowry method
The 4mg/ml of BSA standard was used. Different dilutions of the standard were made (0.5, 1, 2, 3 and 4mg). To each tube of standard and sample 2ml of complex forming reagent was added and kept for 10 min. at RT. After 10 minutes of incubation period, 0.2ml of Folin-Ciocalteu reagent solution was added to each tube and incubates for 20-30 minutes. After incubation period sample absorbance was taken at 660nm by using spectrophotometer (Bio-Rad). Calibration curve was constructed by plotting absorbance reading on Y axis against standard protein concentration (mg/ml). Sample concentration was calculated using standard graph as a reference.
Protein profiling of chickpea seedling through SDS-PAGE
Total protein was extracted using developed method by (Goggin et al. 2011). 0.5 g of Plant leaves were frozen by liquid nitrogen, grinding to a fine powder using mortar and pestle then transferred to a fresh centrifuge tube. Add two ml of extraction buffer (Tris-HCl 1M, pH 8, EDTA, 0.25), SDS, 10%, glycerol, 50%) and mix well. Centrifuge the content of the tubes at 12000rpm for 20 min at 4ºc after centrifugation process completes discard the supernatant. Mix the pellets with 1ml of sample buffer (80% Acetone, 0.07%â- mercaptoethanol and 2mM EDTA) and centrifuge it at 12000 rpm for 15 minutes. Repeat this process until chlorophyll removes. When clear pellet comes mix this with mili Q water and store it at -20 Protein concentration of samples were determined using Bradford assay (Bradford,1976) and Lowry assay (Lowry et al.1951). BSA was used as a standard.
Chickpea seeds were bioprimed with bioagent fungicide and pathogen, for assessment of germination per cent, root and shoot length, seedling length, dry weight, vigour index I and vigour index II. The data recorded are presented in Table 1.
Table (1):
In vitro effect on chickpea seeds induced by biopriming of T. viride (49CP)
Treatment |
Germination % |
Root length(cm) |
Shoot length(cm) |
Seedling length(cm) |
Dry weight of seedling(g) |
Vigour index I |
Vigour index II |
|---|---|---|---|---|---|---|---|
T1 |
68 |
12.07 |
16.37 |
28.44 |
0.592 |
1933.92 |
40.26 |
T2 |
58 |
11.25 |
15.25 |
26.50 |
0.550 |
1537.00 |
31.90 |
T3 |
57 |
10.00 |
14.50 |
24.50 |
0.518 |
1396.50 |
29.53 |
T4 |
56 |
8.70 |
14.35 |
23.05 |
0.495 |
1290.80 |
27.72 |
T5 |
49 |
8.68 |
14.85 |
23.53 |
0.484 |
1151.50 |
23.72 |
T6 |
45 |
8.09 |
13.15 |
21.24 |
0.499 |
955.80 |
22.46 |
T7 |
47 |
8.11 |
15.60 |
23.71 |
0.539 |
1114.370 |
25.33 |
CD@ 5% |
5.455 |
2.711 |
1.345 |
– |
0.061 |
– |
– |
The treatment T1was found to be significantly superior and effective in maximum germination (68%) of chickpea followed by T2 (58%), T3 (57%), T4 (56%), T5 (49%) and T7 (47%) whereas T6 (45%) has given the lowest germination per cent. Similarly, the beneficial impact of seed biopriming was also recorded for root length, shoot length, seedling length and dry weight vigour index-I and vigour-II in which T1 treatment excelled overall significant superior performance by contributing 12.07cm, 16.37cm, 28.44cm, 0.592g, 1933.92 and 40.26 in root length, shoot length, seedling length, dry weight, vigour index I and vigour index II, respectively. Whereas, T6 treatment(10% Foc) were recorded for all these lowest physiological attributes by contributing 8.09cm, 13.15cm, 21.24cm, 0.499mg, 955.80 and 22.46.
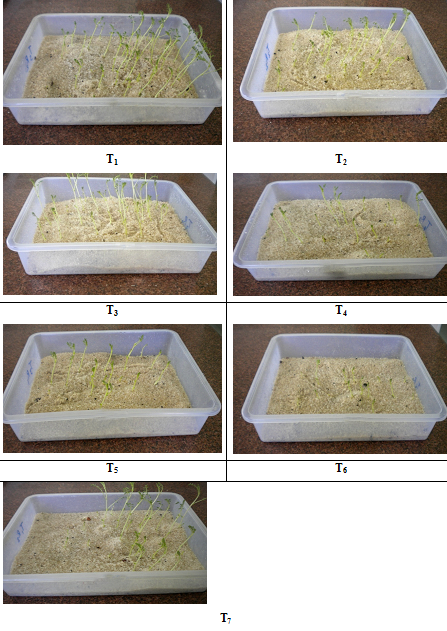
Fig. 1. In vitro germination of chickpea seeds
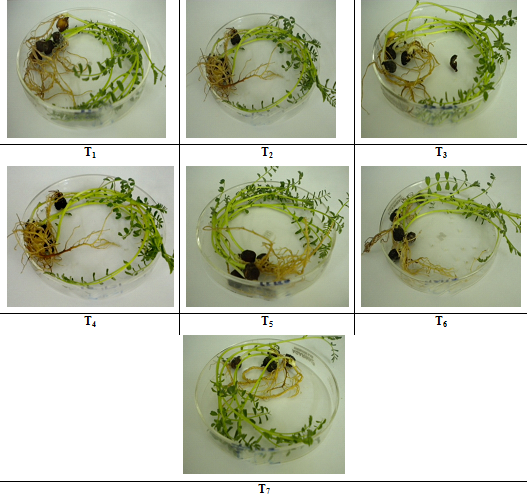 Fig. 2. In vitro seedlings of chickpea
Germination and seedling length along with seedling dry weight are important attributes, which determine the quality of seed of any seed lot. Besides quality seed parameters, seed vigour index also plays very crucial role in predicting the fate of any seed lot under biotic and abiotic stress conditions.
Data presented in Table1 also revealed that over all superior performance was contributed by T1 treatment achieving the higher vigour index-I as well as vigour index –II. Whereas T7 treatment (control) showed least superior impact than T6 treatment (10% Foc) on germination per cent, root length, seedling length as well as vigour index- I and vigour index-II.
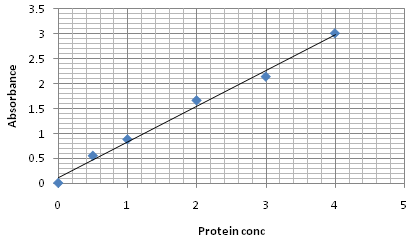
Fig. 3. BSA standard curve of Lowry method
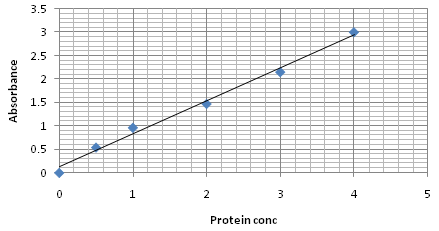
Fig. 4. BSA standard curve of Bradford method
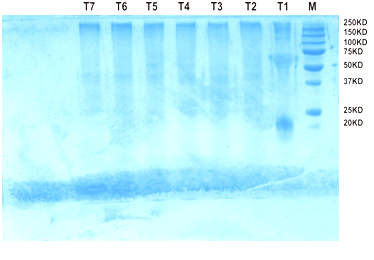
Fig. 5. Protein profiling of chickpea seedling on SDS PAGE
Total protein content was determined by multiplying a factor with the observed nitrogen values and presented in Table 2. A perusal of the data presented in Table 2, revealed that T1 treatment showed having the highest nitrogen content (0.067%) followed by T2 (0.063%), T3 (0.057%), T4 (0.051%), T5 (0.046%), T7 (0.044%) and T6 (0.040%). Similarly, well as the highest protein content in T1 (0.41%) followed by T2 (0.39%), T3 (0.35%), T4 (0.31%), T5 (0.28%), T7 (0.27%) and T6 (0.25%).
Table (2):
Protein analysis of chickpea seedling) through Kelplus analizer
Treatment |
Titration reading |
Nitrogen % |
Protein% |
|---|---|---|---|
T1 |
0.740 |
0.067 |
0.41 |
T2 |
0.710 |
0.063 |
0.39 |
T3 |
0.670 |
0.057 |
0.35 |
T4 |
0.655 |
0.051 |
0.31 |
T5 |
0.590 |
0.046 |
0.28 |
T6 |
0.550 |
0.040 |
0.25 |
T7 |
0.580 |
0.044 |
0.27 |
CD@ 5% |
0.061 |
– |
Protein quantification of chickpea seedling by Lowry and Bradford method
The total protein content analyzed by Lawry and Bradford method showed (Table 3) variation in all the studied treatments. The higher levels of protein content recorded in the treatment T1 that was 1.06 and 1.08 mg /ml. whereas the lowest protein content was observed in treatment T6 was 0.73 and 0.63. Quantitave estimation clearly showed that the highest amount of protein content is present in Treatment T1 in which chickpea seedlings were treated with bioformulation of T. viride @ 5g/kg seed.
Table (3):
Protein quantification of chickpea seedling Lowry and Bradford method
Treatment |
Lowry method (660nm) Protein content (mg/ml) |
Bradford method (595nm) Protein content (mg/ml) |
|---|---|---|
T1 |
1.06 |
1.08 |
T2 |
1.02 |
1.01 |
T3 |
1.01 |
1.00 |
T4 |
1.00 |
0.89 |
T5 |
0.98 |
0.82 |
T6 |
0.63 |
0.73 |
T7 |
0.96 |
0.80 |
Protein profiling of chickpea seedling on SDS PAGE
The chickpea protein profiles are shown in Fig. 3. In treatment T1 five bands were observed, first band at 250 kda, second faint band at 100 kda, third band was lying between 75 and 50 kda, and fourth band was at 20 kda. In treatment 2 to 7 first band was occurred at 250 kda and second band between 50 and 37. In treatment T5 a faint band occurred at 50 kda. From this study we can conclude that the application of formulation of Trichoderma viride @ 5g /kg seeds has induced some PR proteins in the chickpea seedlings. These PR proteins play an important role during abiotic and biotic stress conditions.
In vitro effect on chickpea seedling induced by biopriming of Trichoderma viride ie. the treatment T1(T. viride 5g/kg seed) excelled overall significant superior performance by contributing 68%, 12.07cm, 16.37cm, 28.44cm, 0.592g, 1933.92 and 40.26 in germination, root length, shoot length, seedling length, dry weight, vigour index I and vigour index II, respectively. Similar results find with Amna et al. (2014) investigate the effect of Trichoderma sp. on growth activity of chickpea seedling. Germination percentage (90, 70) and vigour index-I (1657.8, 1364.3) were enhanced by T. harzianum and T. viride respectively.
Kumar et al. (2014) Chickpea seeds were treated with different concentrations of Trichoderma bioformulation such as 5%, 10%, 20% gm/kg seed followed by treatment with 0.2% Bavistin. As a result, the percentage of seed germination was found to be higher in T. harzianum (Th. azad) & Trichoderma viride (01PP) treated seeds with 5% bioformulation as compared to the other concentrations. Various attributes with their observations include seed germination (92% and 90%), root length (12.38 and 12.19 cm) shoot length (4.97 and 4.32 cm) seedling length (17.38 and 16.50 cm), dry weight (1.19 and 1.88 cm), vigour index I (5197.12 and 1485) and vigour index II (109.48 and 169.20). Among all treatments, control showed the poorest performance for all seven seed quality attributes.
The highest nitrogen and protein content was observed in chickpea seedling that’s bioprimed by Trichoderma viride formulation was estimated through Kelplus analizer showed treatment T1 (0.067%) nitrogen and protein (0.41%) compared to control T7 (0.044%) nitrogen and (0.27%) protein. Similar finding supported with Shahid et al, (2015) studied that Biochemical effect of mycolytic enzymes produced by Trichoderma which enhanced nitrogen (0.304%) and protein content (1.89%) of chickpea seedlings compare to control, when seeds were treated with Trichoderma. Trichoderma treated plant showed a significant stimulatory effect on all the tested eight parameters (germination %, root length shoot length dry weight,vigour inex I and vigour index II) as compared to control.
Lowry and Bradford method showed variation in all the studied treatments. The higher levels of protein content recorded in the treatment T1 that was 1.06 and 1.08mg /ml. whereas the lowest protein content was observed in treatment T6 was 0.73mg/ml and 0.63mg/ml. Quantitative estimation clearly showed that the highest amount of protein content is present in Treatment T1 in which chickpea seedlings were treated with bioformulation of Trichoderma viride @ 5g/kg seeds.
The protein profiling of chickpea seedling on SDS PAGE were observed, in treatment T1 five bands, first band at 250kda, second band at 100kda, third band was lying between 75 to50kda, fourth band was at 20 kda. From Treatment 2 to 7 the banding pattern is same. From this study we can conclude that the application of formulation of Trichoderma viride @ 5g/kg seeds has induced some PR proteins in the chickpea seedlings. These PR proteins play an important role during abiotic and biotic stress conditions. Rajik et al.,(2012) found maximum increase in soluble protein content was in (T1) T. harzianum (Kan.) treated plant showing 35.04 mg/g of fresh leaves against 20.49 mg/g of fresh leaves in case of control-II. A high content of phenols which are the indication of first stage of defense mechanism was also recorded in treated plant with T. harzianum (Kan.) treatment representing 2.62 g/mg of fresh leaves against 1.38 in control-I at 20 days of inoculation. The disease severity showed negative correlation with soluble protein (r = -0.6364) and total phenol (r = -0.7653). Protein profiling by sodium dodecyl sulfate polyacrylamide gel electrophoresis (SDS-PAGE) revealed that the soil treated with T. harzianum (Kan.) to synthesize some new protein representing maximum number of 22 bands.
Yadav et al. (2015) reported 14 per cent disease incidence was recorded from salicylic acid treated plants. Challenge inoculation with abiotic inducers sensitized the seedlings to produce increased level of soluble proteins. Maximum increase of soluble protein content (24.26 and 24.72mg/g of fresh leaves) was found with salicylic acid treated plant at 5 and 10 days after pathogen inoculation. Similarly, phenol content was (24.26 and 24.72mg/g of fresh leaves) also found to be maximum in salicylic acid treated plant at 5 and 10 days of inoculation. Protein profiling by SDS-PAGE revealed that foliar spray with salicylic acid induced the synthesis of new proteins; however, such new proteins were not recorded in control.
ACKNOWLEDGMENTS
The authors are grateful for the financial support granted by Department of Science and Technology (DST) under the Inspire Fellowship. Authors are also thankful to Biocontrol Lab, CSAUA&T, Kanpur for providing facilities.
- Abdul B.A.A., and Anderson J.D.; Vigour determination in soybean seed by multiple criteria. Crop Sci; 1973; 13: 630-633.
- Ali A., Haider, Muhammad S. and Ashfaq M.;Effect of culture filtrates of Trichoderma spp. on seed germination and seedling growth in chickpea – an in-vitro study. Pak. J. Phytopathol;2014; 26(1): 01-05
- Bradford M.M.; A rapid and sensitive method for the quantification of microgram quantities of protein utilizing the principle of protein-dye binding. Analytical biochemistry; 1976; 72: 248-254.
- Brimner T.A. and Boland G.J.; A review of the non-target effect of fungi used to biologically control plant diseases, Agriculture, Ecosystem and environment; 2003;100. 3-16.
- Cotxarrera L., M.I. Trillas-Gay, C. Steinberg and C. Alabouvette,;Use of sewage sludge compost and Trichoderma asperellum isolates to suppress Fusarium wilt of tomato, Soil Biology and Biochemistry; 2002; 34 : 467–476.
- Dubey S.C., Tripathi A, Bhavani R and Singh B.; Evaluation of seed dressing and soil application formulations of Trichoderma species for integrated management of dry root rot of chickpea, Biocontrol Science and Technology; 2011;21: 93-100.
- FAO STAT;2013; Statistical database http://faostat.fao.org.
- Goggin D.E., Powles S.B., and Steadman K.J.;Selection for low or high primary dormancy in Lolium rigidum Gaud seeds results in constitutive differences in stress protein expression and peroxidase activity, Journal of Experimental Botany; 2011; 62: 1037-1047.
- Kumar V.,Shahid M., Srivastava M., Singh, A., Pandey S., and Sharma A.; Enhancing seed germination and vigor of chickpea by using potential and effective strains of Trichoderma species, Virology & Mycology; 2014;3: 128. doi: 10.4172/2161-0517.1000128.
- Lowry O.H., Rosebrough N.J., Farr A.L., and Randall R.J.; Protein measurement with the Folin phenol reagent, Journal of Biological Chemistry; 1951;193: 265-275.
- Murty C., Pittaway J. K., and Ball, M. J.; Chickpea supplementation in an Australian diet affects food choice, satiety and bowel health, Appetite; 2010; 54(2): 282-288.
- Nobile, C. G. M., Carrera, J., Grosso R.; Inga M.; Silva, M.; Aguilar R.; Allende, M. J., Badini R. and Martinez M. J.; Proximate composition and seed lipid components of “kabuli”-type chickpea (Cicer arietinum L.) from Argentina, Agricultural Sciences; 2013; 4(12): 729-737.
- Rajik, M.,Biswas, S. K., and Shiv S.; Biochemical basis of defense response in plant against Fusarium wilt through bio-agents as an inducer, African Journal of Agricultural Research; 2012; 7(43): 5849-5857.
- Shahid, M., Srivastava M., Pandey S., Kumar V., Singh A., Trivedi S., Srivastava Y.K. and Shiv R.; Management of Fusarium wilt using mycolytic enzymes produced by Trichoderma harzianum (Th. Azad), African Journal of Biotechnology; 2015;14 (38): 2748-2754.
- Yadav S.P., Prasad R., Kumar S., Shahid M., Pandey S., Srivastava M. and Kumar S.; Induction of defense response in Indian mustard against Alternaria blight through abiotic inducers, African Journal of Microbiology Research;2015; 9(1): 47-52.
© The Author(s) 2016. Open Access. This article is distributed under the terms of the Creative Commons Attribution 4.0 International License which permits unrestricted use, sharing, distribution, and reproduction in any medium, provided you give appropriate credit to the original author(s) and the source, provide a link to the Creative Commons license, and indicate if changes were made.