


ISSN: 0973-7510
E-ISSN: 2581-690X
The main aim of the current work was to build up a new mathematical modelling approach in predictive food microbiology field for the prediction of growth kinetics of microorganisms. For this purpose, the bacterial growth data of Pseudomonas spp. in whole fish (gilt-head seabream) subjected to isothermal and non-isothermal storage temperatures were collected from previously published growth curves. Maximum specific growth rate (1/h) and lag phase duration (h) were described as a function of storage temperature using the direct two-step, direct one-step and inverse dynamic modelling approaches based on various meta-heuristic optimization algorithms. The fitting capability of the modelling approaches and employed optimization algorithms was separately compared, and the one-step modelling approach for the direct methods and the Bayesian optimization method for the used algorithms provided the best goodness of fit results. These two were then further processed in validation step. The inverse dynamic modelling approach based on the Bayesian optimization algorithm yielded satisfactorily statistical indexes (1.02 > Bias factor > 1.09 and 1.07 > Accuracy factor > 1.13), which indicates it can be reliably used as an alternative way of describing the growth behaviour of Pseudomonas spp. in fish in a fast and efficient manner with minimum labour effort.
Inverse dynamic modelling; meta-heuristic optimization; growth behaviour; predictive microbiology
Predictive food microbiology is a relatively new field of theoretical research in food microbiology that describes the behaviour of microorganisms in food under variable environmental conditions by employing mathematical functions and statistical assessment.1 Using models in predictive food microbiology, the conditions prevailing in food products that can decrease or delay adverse effects (e.g., spoilage) resulting from microbial load in food can be determined. Mathematical functions for prediction of microorganism behaviour are generally grouped into two categories, as primary and secondary models.2 Microorganism behaviour under a static environmental condition is described by primary models as a function of time, while the secondary models are used to determine the effects of environmental factor and/or food matrixes on model factors. Temperature is a critical external factor that plays a key role in microorganism behaviour in food products.
The two-step modelling method in which primary and secondary models are serially used is the most applied modelling approach in predictive microbiology. In this approach, the first step is to fit the bacterial growth data points with primary model by time. Afterward, microorganism kinetic parameters derived from the first step are defined as a function of external factors for example temperature, pH, and water activity with the secondary model.3
Even though this modelling approach usually provides acceptable predictions, there are some drawbacks. The major disadvantage is accumulated errors resulting from applying two times nonlinear regression process.4 The one-step modelling approach is an alternative way of describing growth behaviour by overcoming the weaknesses of a two-step process. In this approach, all data points from different conditions were described by simultaneously employing primary and secondary models.5-7 Furthermore, bacterial counts collected under dynamic conditions can be also described using the one-step modelling approach. This enables to define the kinetic parameters by performing only dynamic experiments that are more reflective of microbial behaviour rather than various static experiments which are frequently time consuming and labour-intensive.8,9
Two-step and one-step modelling approaches are considered as direct fitting procedures by which primary and secondary models for static conditions either separately or simultaneously can be developed. Then predictive capabilities of these models can be assessed considering bacterial growth counts collected for changing environmental conditions. The inverse dynamic modelling approach is a new modelling method, an alternative to direct modelling methods. In this modelling process, the bacterial growth counts obtained from dynamic environmental conditions are directly used for model fitting by jumping of the first step of direct methods including static experiments which are often time-consuming and labour-intensive. Therefore, the inverse dynamic modelling approach can minimise experimental effort in a single step and be considered as a fast and inexpensive way of modelling.8 So, the inverse dynamic modelling approach has a considerable potential as a simulation tool to predict growth behaviour of microorganisms and can pave a new alternative way for doing experimental plan in predictive food microbiology field.9 In this regard, the advantages of the inverse dynamic modelling approach have been increasingly aroused interests in predictive food microbiology field, and some inspirational works have been published recently.9-11
The real-world optimization problems are becoming more complex and simple local optimization algorithms often remain insufficient. When there are no optimum solutions better than a local optimum, the latter can be regarded as the global solution (i.e., gold standard), which leads false predictions. Especially for nonlinear problems, there might be numerous local optimal solutions near the gold standard, and finding the global optimal point is a crucial step for the inverse dynamic modelling approach due to its nonlinearity and complexity. Therefore, for the implementation of the inverse dynamic modelling approach global optimization algorithms are necessary. Meta-heuristic optimization algorithms are trying to find a global optimum point by avoiding multiple local solutions. Meta-heuristic optimization algorithms attract huge amount of interest due to their strong and obvious advantages over traditional optimization algorithms.12
The main goal of this study was to comprehensively assess the prediction capability of the inverse dynamic modelling approach based on various meta-heuristic optimization algorithms by considering growth kinetic parameters of Pseudomonas spp. in whole fish (gilt-head seabream) subjected to isothermal and non-isothermal storage temperatures.
The work took place in five separate steps: i) the growth data points of Pseudomonas spp. in fish subjected to isothermal and non-isothermal storage temperatures were collected, ii) for the direct modelling approach, two-step and one-step modelling methods based on the Baranyi and the Ratkowsky models were employed to find growth kinetics, iii) for the inverse modelling approach, the dynamic versions of the same models were applied. iv) the growth kinetics obtained from the direct and inverse modelling approaches were compared and v) maximum growth rate and lag phase duration values were used for model validation. The flow chart outlining the main steps followed in the current study is given in Fig. 1. Details of the stages in this work are described in the following subsections.
Data collection
The bacterial growth data of Pseudomonas spp. under isothermal and non-isothermal storage conditions in fish were gathered from the growth curves in the relevant published study of KOUTSOUMANIS.13 The detail experimental procedure for acquiring Pseudomonas spp. growth data was explained in detail in the previous work. Briefly, fish samples were obtained from a fish industry in Athens and then immediately transferred to the laboratory. Storage temperatures of 0°C, 2°C, 5°C, 8°C, 10°C and 15°C were set and controlled in high-accuracy low-temperature incubators for isothermal conditions. Experiments were conducted at suitable time intervals depending on their storage temperatures to effectively analyse the effect of temperature on bacterial growth. Traditional bacterial enumeration of Pseudomonas spp. was performed onto cetrimide Fucidin cephaloridine (CFC) agar using the spread plate method. Incubators used and supplier information for CFC agar are referred in the original work of KOUTSOUMANIS.13 Minimum three replicates were performed for each of the growth data points. In the present study, Pseudomonas spp. growth data were gathered from the growth curves which were given in the work of KOUTSOUMANIS,13 with GetData Graph Digitizer 2.26 software (Digital River, Cologne, Germany).
Modelling
Primary models
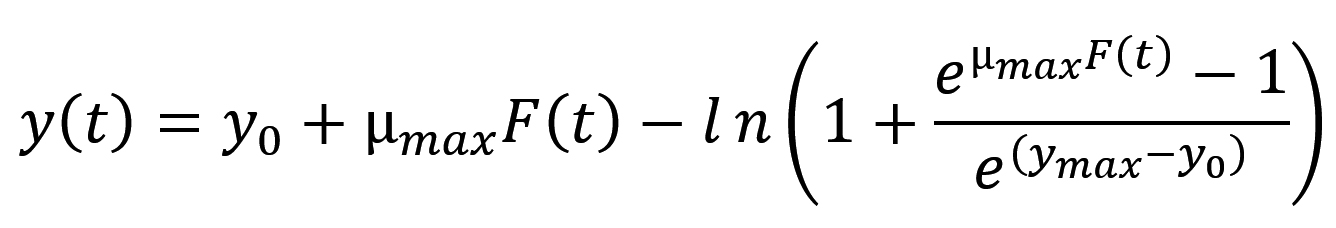
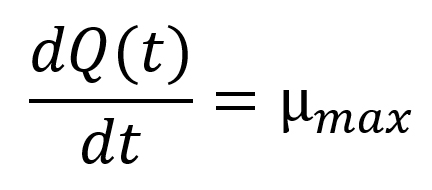
The Baranyi model14 was employed for fitting of the growth data points obtained from isothermal temperatures using the Eqs. (1) and (2), and from non-isothermal storage temperatures using the Eqs. (3) and (4):
…. (1)
![]()
….(2)
where t is the time (h), y(t) is the concentration of bacterial populations (ln CFU/g) at time t, y0 is the initial concentration of bacterial populations (ln CFU/g), ymax is the maximum population density (ln CFU/g), µmax is the maximum specific bacterial growth rate (1/h), l is the duration of lag phase (h) and v is the rate of increase of limiting substrate, assumed to be equal to µmax.
![]() …. (3)
…. (3)
…(4)
where Q(t) is the natural logarithm of q(t), a dimensionless variable related to physiological state of the cells, ymax is the maximum population concentration (ln CFU/g) obtained from the global model, and µmax (h-1) is a function of both temperature (T) and time (t). The initial conditions applied to solve Eqs. (3) and (4) were y(0) = y0 (i.e. the initial population concentration (ln CFU/g)) and Q(0) = lnq0, respectively.
Secondary Models
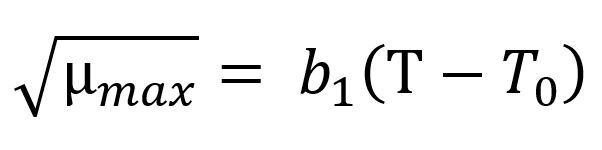
The Ratkowsky model15 was applied for defining µmax as a function of temperature via the Eq. (5):
…. (5)
where T is the storage temperature (°C), T0 is the theoretical lowest bacterial growth temperature (°C), µmax is the maximum specific bacterial growth rate (1/h), b1 is the regression coefficient.
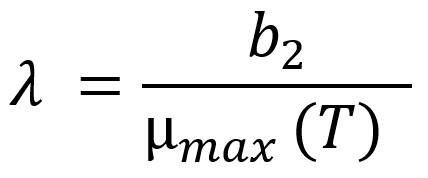
Additionally, l (lag phase duration) was defined as a function of µmax with respect to temperature using the Eq. (6)16:
…(6)
where b2 is the regression coefficient, µmax(T) is a function of temperature, which leads l to be defined as a function of storage temperature.
Parameter estimation
In order to determine the kinetic parameters of Pseudomonas spp. in fish, NonLinearModel command which uses Levenberg Marquardt algorithm in the Matlab 8.3.0.532 (R2014a) software (MathWorks, Natick, Massachusetts, USA) was employed considering the direct two-step and one-step modelling approaches.
For the inverse dynamic modelling approach, each of the parameters (b1, b2 and T0) was estimated by minimising the difference between fitted and observed bacterial growth counts by using the Eq. (7):
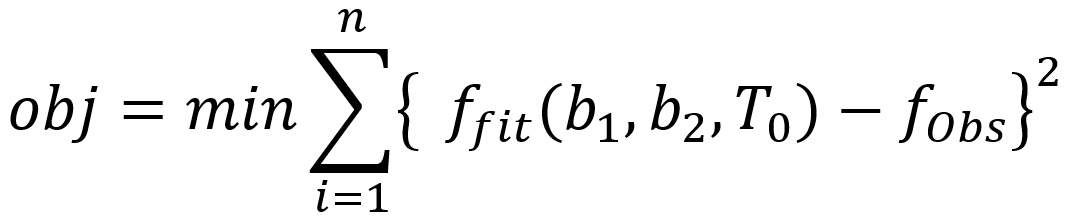
…(7)
where obj is the objective function, minimization of difference between ffit and fobs, ffit is the fitted values that satisfy the objective function, fobs is the observed growth data and n is the number of experiments.
The optimization process was done with various algorithms (Simulated Annealing, Genetic, Bayesian, Particle Swarm and Quasi-Newton Algorithms) in the Global Optimization Toolbox in the Matlab software. Genetic is an evolutionary algorithm which uses the mutation to prevent from being stuck in local optimum while transferring knowledge to new epochs. Simulated Annealing and Particle Swarm optimization can be classified as global search metaheuristics. Quasi-Newton Algorithms can be defined as local search-based algorithms. Bayesian Optimization is a global optimizer which constructs a proxy function (such as Gaussian process approximation) that gives close results to the objective function with less computational cost. Therefore, different optimization algorithms are suggested to measure the efficiency of the inverse dynamic modelling approach.
Since the ordinary differential equations in the dynamic model of Baranyi has not an analytical solution,8 numerical solution was obtained using the function ode23 existing in Matlab software, which is based on the Runge–Kutta method.
The 95% confidence intervals (CI) of the model parameters were calculated using the Eq. (8)17: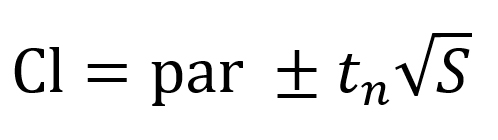
…(8)
where par is the parameter estimated by the fitting, tn is calculated using the inverse of Student’s t cumulative distribution function, S is a vector of the diagonal elements from the estimated covariance matrix of the coefficient estimates, (XTX)−1s2, X is the Jacobian of the fitted values with respect to the parameters, XT is the transpose of X, s2 is the mean squared error.
Comparison of the goodness of fit
The evaluation of prediction capability of the models was performed by considering the root mean square error (RMSE), adjusted coefficient of determination (R2adj), corrected Akaike information criterion (AICc) and Bayesian information criterion (BIC) using Eqs. (9), (10), (11) and (12) respectively:
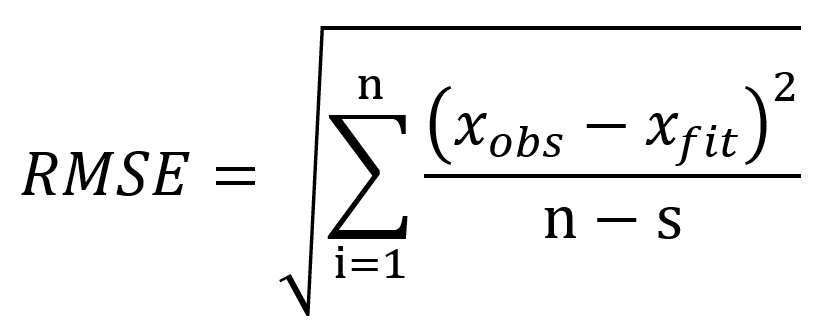 …. (9)
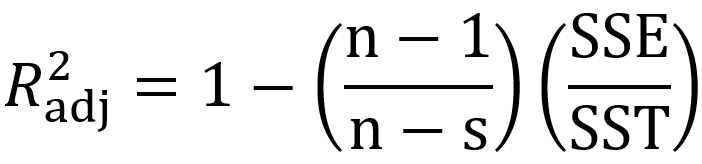 …. (10)
![]() …. (11)
…. (11)
 …(12)
…(12)
where xobs is the experimental bacterial growth, xfit is the fitted value, n is the number of experiments, s is the number of parameters of the model, SSE is the sum of squares of errors and SST is the total sum of squares.
Statistical analysis
Growth kinetic parameters obtained from the direct modelling approaches and inverse dynamic modelling approach were statistically evaluated by using t-test analysis via the Matlab software. Statistical differences between various modelling approaches were considered as significant once p was found less than 0.05.
Validation of the models
The prediction capability of different modelling approaches and employed optimization algorithms was evaluated through maximum specific growth rate data of Pseudomonas spp. in fish gathered from the study of KOUTSOUMANIS.13 The comparison was done considering each of the global models’ factors corresponding to the bias (Bf) and accuracy (Af) factors18 given in Eqs. (13) and (14), respectively:
 …. (13)
 … (14)
where xpred refers to predicted µmax (1/h) and l (h), xobs refers to experimental µmax (1/h) and l (h), n refers to the number of experimental growth data.
The experimental Pseudomonas spp. counts collected from previously published curves for fish13 at the storage temperatures of 0°C, 2°C, 5°C, 8°C, 10°C and 15°C were used to implement the two-step and one-step modelling approaches based on the Baranyi model (Fig. 2). The initial bacterial counts of Pseudomonas spp. were on average 3.3 ± 0.4 log CFU•g-1 for all temperatures. Storage duration was directly related to storage temperature and ranged from 360 to 72 h (15 to 3 days) with an increase in storage temperature from 0 to 15°C. The Pseudomonas spp. counts could reach the level of 8.3 ± 0.3 log CFU•g-1 at the end of storage depending on the storage temperature. This demonstrated that the growth potential of Pseudomonas spp. in fish was not affected with the increasing storage temperature.

Fig. 1. The flow chart outlining the main steps followed in the present study.

Fig. 2. The observed and fitted Pseudomonas spp. in fish using direct a) two-step and b) one-step modelling approach.
The goodness-of-fit of Baranyi model involved in direct two-step and one-step modelling approaches was evaluated by calculating their statistical indices (RMSE, R2adj, AICc and BIC). The RMSE values obtained from direct two-step and direct one-step modelling approaches were 0.570 and 0.450, respectively, and R2adj values obtained from the direct two-step and direct one-step modelling were 0.910 and 0.940, respectively (Table 1). In addition, the AICc and BIC indices of direct two-step modelling approach were -78.2, -69.8, respectively, and the AICc and BIC indices of direct one-step modelling approach were -112.7 and -104.2, respectively (Table 1). These results presented that one-step modelling approach enhanced the fitting performance of the Baranyi model and could be more reliably used for estimation of Pseudomonas spp. in fish. Additionally, the lack of fitting capability of the direct two step modelling approach for 10 and 15°C was eliminated with the implementation of the direct one-step modelling approach (Fig. 2).
Table (1):
Growth kinetic parameters (with 95% confidence interval) estimated using different modelling approaches.
| Fitting method | Model parameters | RMSE | R2adj | AICc | BIC | |||
|---|---|---|---|---|---|---|---|---|
| T0 (°C) | b1 | b2 | ||||||
| Direct approach | Two-step | -11.56 (-12.19, -10.93) | 0.019 (0.018, 0.021) | 1.78 (1.63, 1.83) | 0.570 | 0.910 | -78.2 | -69.8 |
| One-step | -8.58 (-9.04, -8.12) | 0.024 (0.023, 0.025) | 1.41 (0.71, 2.10) | 0.450 | 0.940 | -112.7 | -104.2 | |
| Inverse approach | Simulated Annealing | -7.98 (-8.37, -7.58) | 0.025 (0.024, 0.025) | 2.68 (2.52, 2.84) | 0.330 | 0.973 | -100.5 | -97.8 |
| Genetic | -6.32 (-6.52, -6.12) | 0.027 (0.026, 0.028) | 2.33 (2.17, 2.48) | 0.307 | 0,977 | -107.7 | -105.0 | |
| Bayesian | -12.46 (-13.17, -11.75) | 0.018 (0.018, 0.019) | 1.78 (1.64, 1.92) | 0.300 | 0.986 | -115.8 | -113.1 | |
| Particle Swarm | -5.59 (-6.00, -5.19) | 0.029 (0.027, 0.030) | 2.84 (2.69, 3.00) | 0.350 | 0.970 | -95.0 | -92.3 | |
| Quasi-newton | -13.45 (-14.62, -12.27) | 0.017 (0.016, 0.018) | 1.18 (1.05, 1.31) | 0.303 | 0.978 | -108.8 | -106.1 | |
RMSE – root mean square error, R2adj – adjusted coefficient of determination, AICc – corrected Akaike information criterion and BIC – Bayesian information criterion were calculated based on bacterial count of log CFU/g.
The degrees of freedom of the one-step modelling approach proposed in this study were 71 (the number of observations – the number of parameters in the global model), while the degrees of freedom of the traditional two-step modelling approach used by KOUTSOUMANIS,13 were only 4 for the Ratkowsky model and were maximum 10 for the primary models at various temperatures ranging from 0 to 15°C. It is important to underline that especially the Ratkowsky model with a low degree of freedom might be regarded as giving results which are of low accuracy and uncertain. From this point of view, the one-step modelling approach followed has increased degrees of freedom, which decreases confidence intervals and uncertainty of the parameters compared to the traditionally used two-step modelling approach. Therefore, the one-step modelling approach significantly (p < 0.05) improved the prediction capability of the models for the quantitative description of Pseudomonas spp. in fish.
The experimental Pseudomonas spp. counts in fish at the dynamic storage temperatures ranging from 0 to 15°C were used for dynamic inverse modelling approach based on the Baranyi’s model and various optimization algorithms (Fig. 3). RMSE, R2adj, AICc and BIC values of used optimization algorithms in inverse dynamic modelling approach were calculated. The RMSE and R2adj values were in range of 0.300 to 0.330 and 0.970 to 0.986, respectively (Table 1). Additionally, the AICc and BIC indices were calculated in range of -115.8 to -95.0 and -92.3 to -113.1, respectively. Although each of the optimization algorithms in the inverse dynamic modelling approach yielded better fitting performances compared to direct modelling approaches (two-step and one-step modelling approaches), Bayesian optimization algorithm was the best in the inverse dynamic modelling approach (Table 1).

Fig. 3. The observed and fitted Pseudomonas spp. in fish using inverse dynamic modelling approach for different temperature profiles. The dashed line shows the changing temperature during storage.

Fig. 4. The effect of storage temperature on a) the maximum growth rate and b) the lag phase duration calculated with different modelling approach.
T0 and b1 are the Ratkowsky parameters showing the relationship between temperature and maximum growth rate of microorganism. T0 was equal to -12.46°C, and b1 was found to be 0.018°C-1.h0.5 in the inverse dynamic modelling approach. These results are in a good agreement with the work conducted by KOUTSOUMANIS,13 who reported the values of T0 and b1 ranging from -12.96 to -10.64°C and 0.018 to 0.205°C-1. h0.5, respectively with 95% confidence interval. Additionally, in this work T0 and b1 were calculated ranging from -12.19 to -10.93°C and from 0.018 to 0.021°C-1.h0.5, respectively when the traditionally used direct modelling approach was employed. All these results showed that dynamic inverse modelling approach based on the Bayesian optimization algorithm could estimate the minimum temperature for the growth of Pseudomonas spp. counts in fish.
Another parameter, b2 directly relating to the lag phase duration of microorganism, was calculated as 1.78 ± 0.14 (mean ± 95% confidence interval) for the Bayesian optimization algorithm in dynamic inverse modelling approach. These results are within the range of findings reported by KOUTSOUMANIS,13 who calculated b2 with average value of 1.62 to 2.25, suggesting that the inverse dynamic modelling approach based on the Bayesian optimization algorithm can predict b2 parameter of Pseudomonas spp. counts in fish.
µmax and l are the most important critical parameters to describe the growth behaviour of microorganisms in food, and temperature is a key determinant for both growth parameters.9,19 The kinetic parameters including µmax and l belonging to Pseudomonas spp. counts in fish for each modelling approach are presented in Fig. 4. As it is expected, the figures demonstrate that µmax increased and l decreased because of rising storage temperature. Additionally, µmax and l values of Pseudomonas spp. counts in fish obtained from the inverse dynamic modelling approach on the Bayesian optimization algorithm are within the range of findings obtained from two-step direct modelling approach considering 95% confidence interval. These results indicated that the inverse dynamic modelling approach on the Bayesian optimization algorithm can be used for predicting µmax and l parameters of Pseudomonas spp. counts in fish and is an alternative way to traditionally used two-step modelling approach for estimating growth parameters of microorganisms.
The validation of the models is the fundamental process by which the prediction ability of developed models can be tested using previously published or new generated data. In this regard, internally collected µmax and l parameters of Pseudomonas spp. in fish,13 were used for assessing the prediction power of the direct one-step modelling approach, which gave better goodness of fitting results between direct modelling approaches and the Bayesian optimization algorithm in inverse dynamic modelling approach considering Bf and Af (Table 2). The statistical indices of Bf were 0.97 and 1.45 for the µmax and l parameters using the direct one-step modelling approach, respectively. A Bf factor of 1 indicates no structural deviation of the model. The Bf factor of 0.97 for µmax parameter indicated that the one-step modelling approach underestimated 3% whereas the Bf factor of 1.45 for l parameter indicated that the one-step modelling approach overestimated 45% when the direct one-step modelling approach was employed. Additionally, the direct one-step modelling approach provided statistical indices of Af 1.10 and 1.45 for the µmax and l parameters, respectively, meaning that on average the predicted values were 10% and 45% different from the observed values for the µmax and l parameters, respectively. On the other hand, the inverse dynamic modelling approach based on the Bayesian optimization algorithm yielded suitably statistical indexes (1.02 > Bf > 1.09 and 1.07 > Af > 1.13) confirming that the inverse dynamic modelling approach based on the Bayesian optimization algorithm considerably improved models’ prediction capability of µmax and l parameters and can be reliably used as an alternative way of describing the growth behaviour of Pseudomonas spp. in fish.
Table (2):
Observed and predicted kinetic parameters of Pseudomonas spp. in fish stored at various temperatures.
| Storage temperature (°C) | Observed kinetic parameters a | Predicted kinetic parameters | ||||
|---|---|---|---|---|---|---|
| Direct one-step modelling approach | Inverse dynamic modelling approachb | |||||
| Maximum growth rate (log CFU/h) | Lag time duration (h) | Maximum growth rate (log CFU/h) | Lag time duration (h) | Maximum growth rate (log CFU/h) | Lag time duration (h) | |
| 0 | 0.054 ± 0.002 | 37.2 ± 5.9 | 0.042 | 33.7 | 0.051 | 34.9 |
| 2 | 0.064 | 30.8 | 0.064 | 22.2 | 0.069 | 25.9 |
| 3 | 0.070 | 30.3 | 0.076 | 18.5 | 0.079 | 22.7 |
| 5 | 0.103 ± 0.007 | 19.9 ± 2.8 | 0.105 | 13.4 | 0.100 | 17.8 |
| 7 | 0.130 | 12.5 | 0.138 | 10.2 | 0.124 | 14.3 |
| 8 | 0.137 ± 0.008 | 13.0 ± 2.5 | 0.156 | 9.0 | 0.138 | 12.9 |
| 10 | 0.191 ± 0.009 | 11.8 ± 1.2 | 0.196 | 7.2 | 0.166 | 10.7 |
| 15 | 0.269 ± 0.026 | 8.1 ± 0.6 | 0.316 | 4.5 | 0.248 | 7.2 |
| Bf | 0.97 | 1.45 | 1.02 | 1.09 | ||
| Af | 1.10 | 1.45 | 1.07 | 1.13 | ||
aObserved kinetic parameters of Pseudomonas spp. in fish were collected from the work of Koutsoumanis, (2001).
bPredicted kinetic parameters of Pseudomonas spp. in fish were obtained by Bayesian optimization algorithm.
Bf – Bias factor and Af – Accuracy factor were calculated based on bacterial count of log CFU/g.
In this work, the Baranyi model was used for evaluating fitting capabilities of direct two-step, one-step and inverse dynamic modelling approaches. The direct one-step modelling approach improved the fitting capability of the Baranyi model used in two-step direct modelling approaches. The inverse dynamic modelling approach based on each of the used optimization algorithms provided better goodness of fit results compared to direct modelling approaches (two-step and one-step modelling approaches), but the Bayesian optimization algorithm was the best. The inverse dynamic modelling approach based on the Bayesian optimization algorithm provided similar results for the parameters of µmax and l of Pseudomonas spp. in fish to two-step direct and one-step direct modelling approaches, meaning that the inverse dynamic modelling approach based on the Bayesian optimization algorithm has a considerable potential to be used as an alternative simulation method to the direct two-step modelling approach, most commonly used in predictive microbiology, by which the microbiological quality of the food products can be accurately and fast monitored.
ACKNOWLEDGMENTS
None.
CONFLICT OF INTEREST
The authors declare that there is no conflict of interest.
AUTHORS’ CONTRIBUTION
All authors listed have made a substantial, direct and intellectual contribution to the work, and approved it for publication.
FUNDING
None.
ETHICS STATEMENT
Not applicable.
AVAILABILITY OF DATA
All datasets generated or analyzed during this study are included in the manuscript.
- Perez-Rodriguez F, Valero A. Predictive Microbiology in Foods. 1st ed. New York: Springer, 2013. ISBN: 9781461455202.
Crossref - Whiting RC. Microbial modeling in foods. Crit Rev Food Sci. 1995;35(6):467-494.
Crossref - Tarlak F, Ozdemir M, Melikoglu M. Mathematical modelling of temperature effect on growth kinetics of Pseudomonas spp. on sliced mushroom (Agaricus bisporus). Int J Food Microbiol. 2018;266:274-281.
Crossref - Martino KG, Marks BP. Comparing uncertainty resulting from two-step and global regression procedures applied to microbial growth models. J Food Prot. 2007;70(12):2811-2818.
Crossref - Tarlak F. Development and validation of one-step modelling approach for the prediction of mushroom spoilage. J Food Nutr Res. 2020;59(4):281-289.
- Tarlak F, Khosravi-Darani K. Development and validation of growth models using one-step modelling approach for determination of chicken meat shelf-life under isothermal and non-isothermal storage conditions. J Food Nutr Res. 2021;60:76-86.
- Acai P, Valik L, Medvedova A. One- and two-step kinetic data analysis applied for single and co-culture growth of Staphylococcus aureus, Escherichia coli, and Lactic Acid Bacteria in milk. Applied Sciences. 2021;11(18):8673.
Crossref - Huang L. Dynamic identification of growth and survival kinetic parameters of microorganisms in foods. Curr Opin Food Sci. 2017;14:85-92.
Crossref - Liu Y, Wang X, Liu B, Dong Q. One-Step Analysis for Listeria monocytogenes Growth in Ready-to-Eat Braised Beef at Dynamic and Static Conditions. J Food Protect. 2019;82(11):1820-1827.
Crossref - Jia Z, Huang L, Wei Z, Yao Y, Fang T, Li C. Dynamic kinetic analysis of growth of Listeria monocytogenes in pasteurized cow milk. J Dairy Sci. 2021;104(3):2654-2667.
Crossref - Huang L, Hwang CA. Dynamic analysis of growth of Salmonella Enteritidis in liquid egg whites. Food Control. 2017;80:125-130.
Crossref - Gupta SK, Ramteke M. Applications of genetic algorithms in chemical engineering II: Case studies. In: Applications of Metaheuristics in Process Engineering. Springer, Cham, 2014:61-87.
Crossref - Koutsoumanis K. Predictive modeling of the shelf life of fish under nonisothermal conditions. Appl Environ Microbiol. 2001;67(4):1821-1829.
Crossref - Baranyi J, Roberts TA. A dynamic approach to predicting bacterial growth in food. Int J Food Microbiol. 1994;23(3-4):277-294.
Crossref - Ratkowsky DA, Olley J, McMeekin TA, Ball A. Relationship between temperature and growth rate of bacterial cultures. J Bacteriol. 1982;149(1):1-5.
Crossref - Robinson TP, Ocio MJ, Kaloti A, Mackey BM. The effect of the growth environment on the lag phase of Listeria monocytogenes. Int J Food Microbiol. 1998;44(1-2):83-92.
Crossref - Longhi DA, Dalcanton F, de Aragao GMF, Carciofi BAM, Laurindo JB. Assessing the prediction ability of different mathematical models for the growth of Lactobacillus plantarum under non-isothermal conditions. J Theor Biol. 2013;335:88-96.
Crossref - Ross T. Indices for performance evaluation of predictive models in food microbiology. J Appl Bacteriol. 1996;81(5):501-508.
Crossref - Matejcekova Z, Liptakova D, Spodniakova S, Valik L. Characterization of the growth of Lactobacillus plantarum in milk in dependence on temperature. Acta Chimica Slovaca. 2016;9:104-108.
Crossref
© The Author(s) 2022. Open Access. This article is distributed under the terms of the Creative Commons Attribution 4.0 International License which permits unrestricted use, sharing, distribution, and reproduction in any medium, provided you give appropriate credit to the original author(s) and the source, provide a link to the Creative Commons license, and indicate if changes were made.