


ISSN: 0973-7510
E-ISSN: 2581-690X
 , Fataou Agoton2, Raïhanatou Olabode1, Cyrille A.J. Vodounon1 and Jacques K. Fatombi2
Road, sea, and river transport of petroleum products contributes to pollution of aquatic and terrestrial ecosystems, often leading to ecological disasters that are harmful to human health and the environment. Added to this is the dumping of waste oil from combustion engines directly into nearby aquatic and terrestrial ecosystems. In most developing countries, dealing with water and land pollution from petroleum products became a major concern. This study involved collecting and characterizing surface water and soil samples contaminated with petroleum products from Natitingou and Bohicon, in the Republic of Benin, and then evaluating the growth response of Pseudomonas aeruginosa and Escherichia coli in a hydrocarbon containing mineral medium supplemented with TotalEnergies Quartz 5000 mineral oil. Physico-chemical and microbiological characterization of the samples revealed concentrations of petroleum hydrocarbons (1298 ± 282.84 mg/L- 18338 ± 70.71 mg/L and 4918 ± 84.85 mg/L- 23358 ± 42.43 mg/L), dissolved oxygen (3.18 ± 0.07 mg/L- 6.39 ± 0.04 mg/L and 1.37 ± 0.06 mg/L – 3.61 ± 0.01 mg/L), Conductivity (212.73 ± 0.35 µs/cm – 1674.67 ± 0.58 µs/cm and 150.30 ± 0.65 µs/cm – 272.77 ± 0.06 µs/cm), TDS (142.60 ± 0.20 mg/L- 1121.67 ± 0.58 mg/L and 100.73 ± 0.38 mg/L- 182.73 ± 0.06 mg/L), Nitrates (0.71 ± 0.02 mg/L- 3.55 ± 0.01 mg/L and 0.90 ± 0.01 mg/L – 3.35 ± 0.04 mg/L), nitrites (0.13 ± 0.01 mg/L- 0.47 ± 0.01 mg/L and 0.14 ± 0.01 mg/L – 0.50 ± 0.01 mg/L), Ammonium (0.21 ± 0.01 mg/L- 0.25 ± 0.01 mg/L and 0.08 ± 0.01 mg/L – 0.49 ± 0.01 mg/L), Phosphates (0.058 ± 0.01 mg/L- 0.16 ± 0.01 mg/L and 0.06 ± 0.01 mg/L – 0.35 ± 0.01 mg/L) and TOC (0.44 ± 0.03% – 8.60 ± 0.15%) respectively in water and soil samples including bacteria such as total coliforms, Pseudomonas aeruginosa, Staphylococcus aureus, Bacillus cereus, Bacillus subtilis, and fungi such as Aspergillus sp., Penicillium sp., and Trichophyton sp. Growth tests conducted for 336 hrs in a hydrocarbon-containing mineral medium showed increases in OD600 from 0.312 to 0.988 for P. aeruginosa and from 0.010 to 1.099 for E. coli, with specific growth rates of 0.018 and 0.037 h-1, respectively. The study showed that Pseudomonas aeruginosa and Escherichia coli can grow in a hydrocarbon-containing mineral medium. Further studies are needed to assess their ability to utilize or transform specific petroleum hydrocarbons.
Total Petroleum Hydrocarbons, Soils and Waters Polluted, Bacterial Growth, UV-VIS Spectrophotometry
Rapid population growth has led to significant increases in industrialization and a diversification of transport methods, most of which rely on combustion engines. Operating these industries and modes of transport requires large volumes of petroleum products, the transportation, exposure, and use of which contribute to the pollution of aquatic and terrestrial ecosystems.1 Spills of petroleum products in these environments cause high concentrations of aliphatic, aromatic, and heterocyclic compounds, as well as heavy metals such as lead, zinc, and chromium, all of which are toxic to the animals and plants living in these environments.2-4 Concentrations of these various pollutants in fish and produce consumed by humans can cause numerous diseases, including cancer.5 In 2012, direct or indirect exposure in aquatic or terrestrial ecosystems contaminated by emerging pollutants, including petroleum hydrocarbons, caused the deaths of more than 8.4 million people worldwide. Populations in developing countries are the most affected.6 In most developing countries, the dilapidated state of crude oil drainage infrastructure, the proliferation of artisanal and clandestine crude oil refineries, inadequate means of transport, and the handling of petroleum products by populations with very little precaution are among the many factors contributing to the pollution of terrestrial and aquatic ecosystems, posing a potential risk to human health.7,8 Given all the ecological disasters and health risks associated with oil spills in the environment, there is an urgent need to promote easily accessible and widely available analytical techniques for monitoring oil in the environment, as well as less costly, effective purification technology based on the use of local products that are environmentally friendly. Analytical procedures used in monitoring petroleum hydrocarbons in water and soil include: gravimetric analysis,9 infrared spectrophotometry,10 ultraviolet fluorescence spectrophotometry,11 fluorescence spectrophotometry12 and gas chromatography.13 Among these processes, ultraviolet spectrophotometry appears to be one of the most commonly used analytical methods due to its wide availability, simplicity, and good repeatability.14 Technologies for remediating ecosystems contaminated by petroleum products often involve physical, chemical, and microbial processes.15 Among these processes, physical and chemical methods require significant investment and are complex to implement.15 Although these processes have yielded satisfactory results in terms of oil/water separation, challenges remain. The significant fouling of membranes limits their practical applications.1 Furthermore, these processes are not well suited to the remediation of soil contaminated by petroleum products.1 The microbial remediation method, however, appears to be an environmentally friendly process due to its high efficiency, low implementation cost, environmental friendliness, and ease of use.16 The biological process is based on the self-purification of ecosystems by microorganisms. Indeed, certain microorganisms can break down petroleum pollutants into non-toxic substances through their metabolism, degrading petroleum pollutants to generate the energy necessary for their multiplication.16 Heavy metal removal rates for chromium, zinc, and cadmium varied between 90.80% and 98.58%, while those for hydrocarbons ranging from 88.11%-97.31% by using fungi such as Aspergillus in the decontamination of soil polluted by crude oil.17 Applying a mixed community of bacteria and fungi such as Bacillus, Pseudomonas, Escherichia, Aspergillus, and Penicillium in the decontamination of polluted water led to reductions of approximately 99.90% in total hydrocarbon content and 98.8% in biochemical oxygen demand (BOD).18,19
This study assessed petroleum hydrocarbon residues in surface water and soil using UV-Vis spectrophotometry and evaluated the growth response of Escherichia coli and Pseudomonas aeruginosa in a hydrocarbon-containing mineral medium.
Reagents
All reagents used in this study are of analytical grade. They are: Sulphanic acid (NH2C6H4SO3H), Pure anhydrous sodium carbonate (Na₂CO₃), Nickel chloride hexahydrate (NiCl₂·6H₂O), Disodium acetic acid salt (C₁₀H₁₄N₂Na₂O₈·2H₂O), Ammonium nitrate (NH₄NO₃), Disodium phosphate (Na₂HPO₄), Monopotassium phosphate (KH₂PO₄), Potassium sulfate (K₂SO₄), Magnesium sulfate heptahydrate (MgSO₄·7H₂O), Ethylenediaminetetraacetic acid (EDTA), Zinc sulfate (ZnSO₄), Manganese(II) sulfate (MnSO₄), Boric acid (H₃BO₃), Nickel(II) chloride (NiCl₂), Cetrimide agar base, Sabouraud dextrose agar with chloramphenicol (RDM-SDA-02), Chromatic coli coliform, Mannitol salt agar base, Bacillus cereus agar base (Mossel).
Absorption spectrum
5 g of TotalEnergies Quartz 5000 crude mineral motor oil manufactured by Nigeria PLC and used mineral oil were dissolved in 50 mL of dichloromethane and then stirred for 10 minutes until completely homogenized. The absorption spectra of the oil samples and dichloromethane solvent were recorded using a Bioevopeak SP-MUV8000T UV-Vis spectrophotometer, and the results are presented in Figure 1.
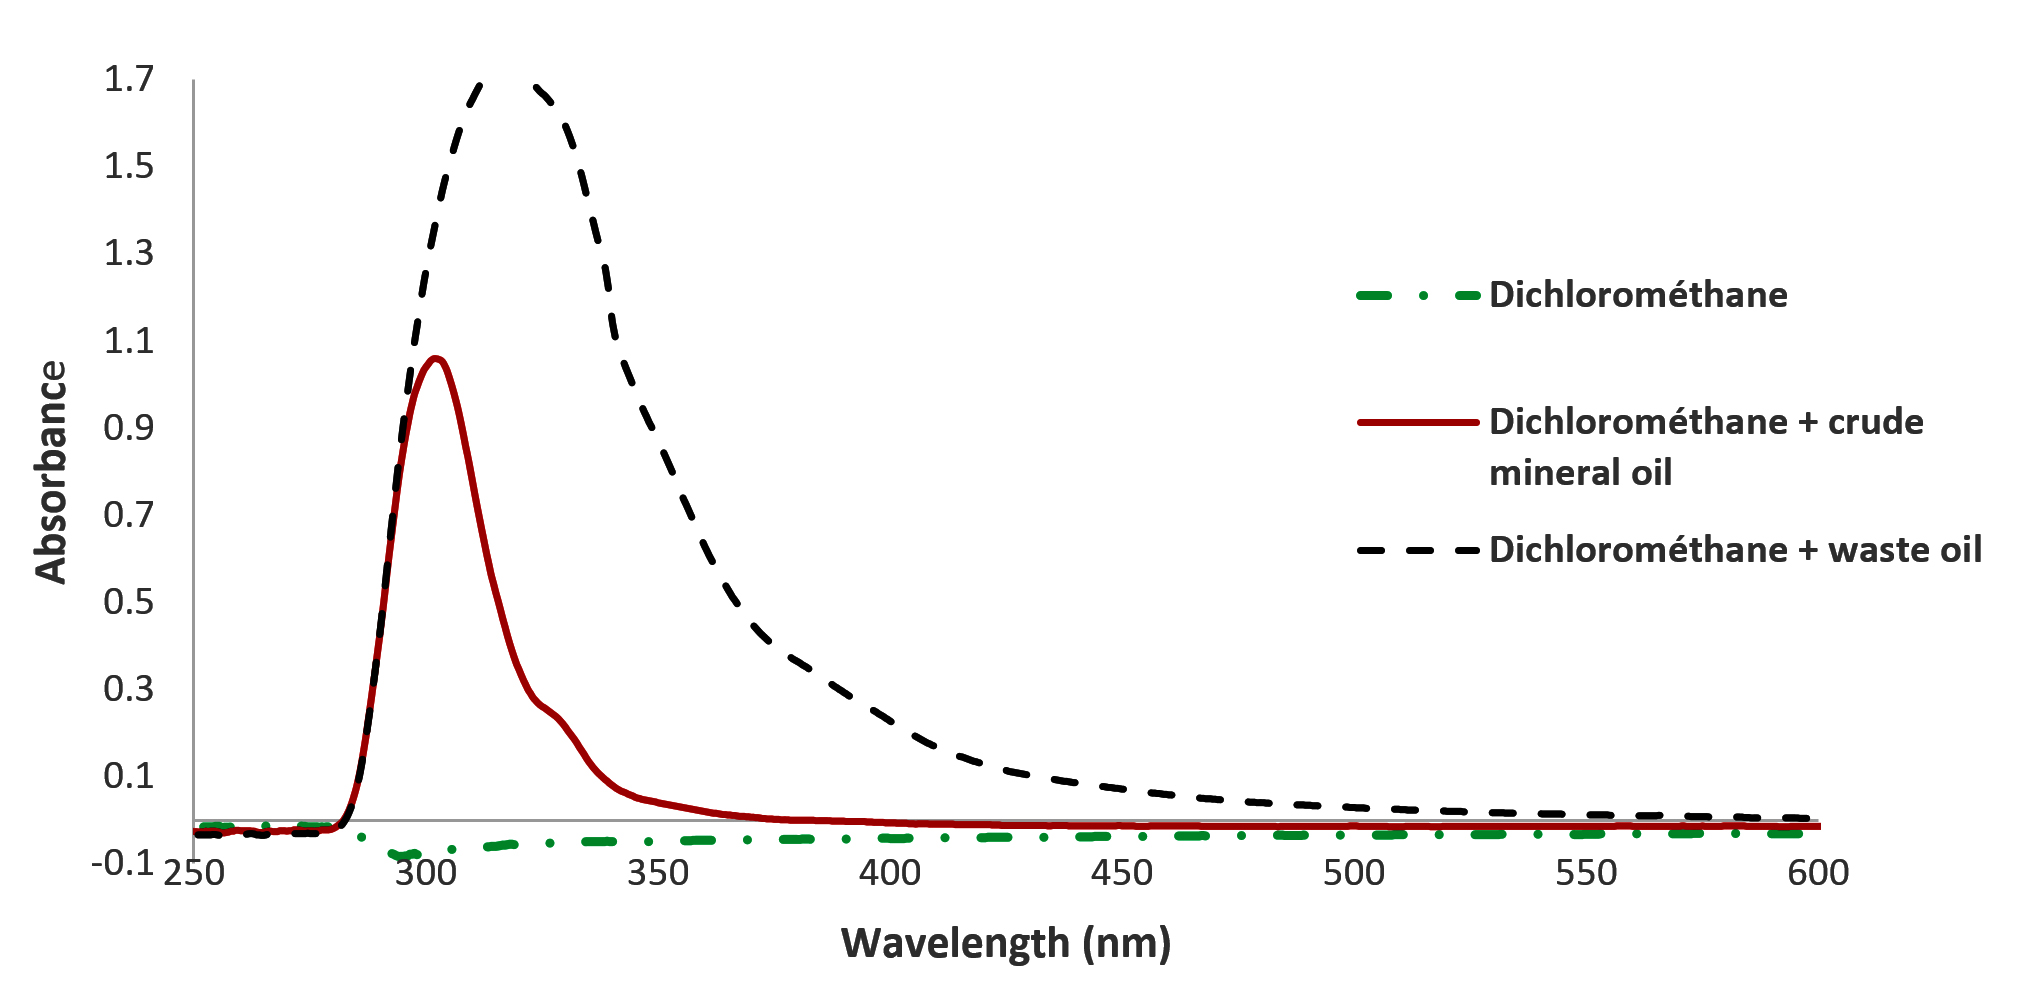
Figure 1. Absorption spectrum of samples
Calibration curve
Increasing amounts of crude mineral engine oil ranging from 30-240 mg were weighed in a 50 mL calibrated flask, then the volume was adjusted with dichloromethane up to the graduated line. This mixture was then stirred for 10 minutes until it was completely homogenized, and its absorbance was measured at 317 nm using a Bioevopeak SP-MUV8000T UV-Vis spectrophotometer. The measured absorbance values were used to establish the calibration curve shown in Figure 2.
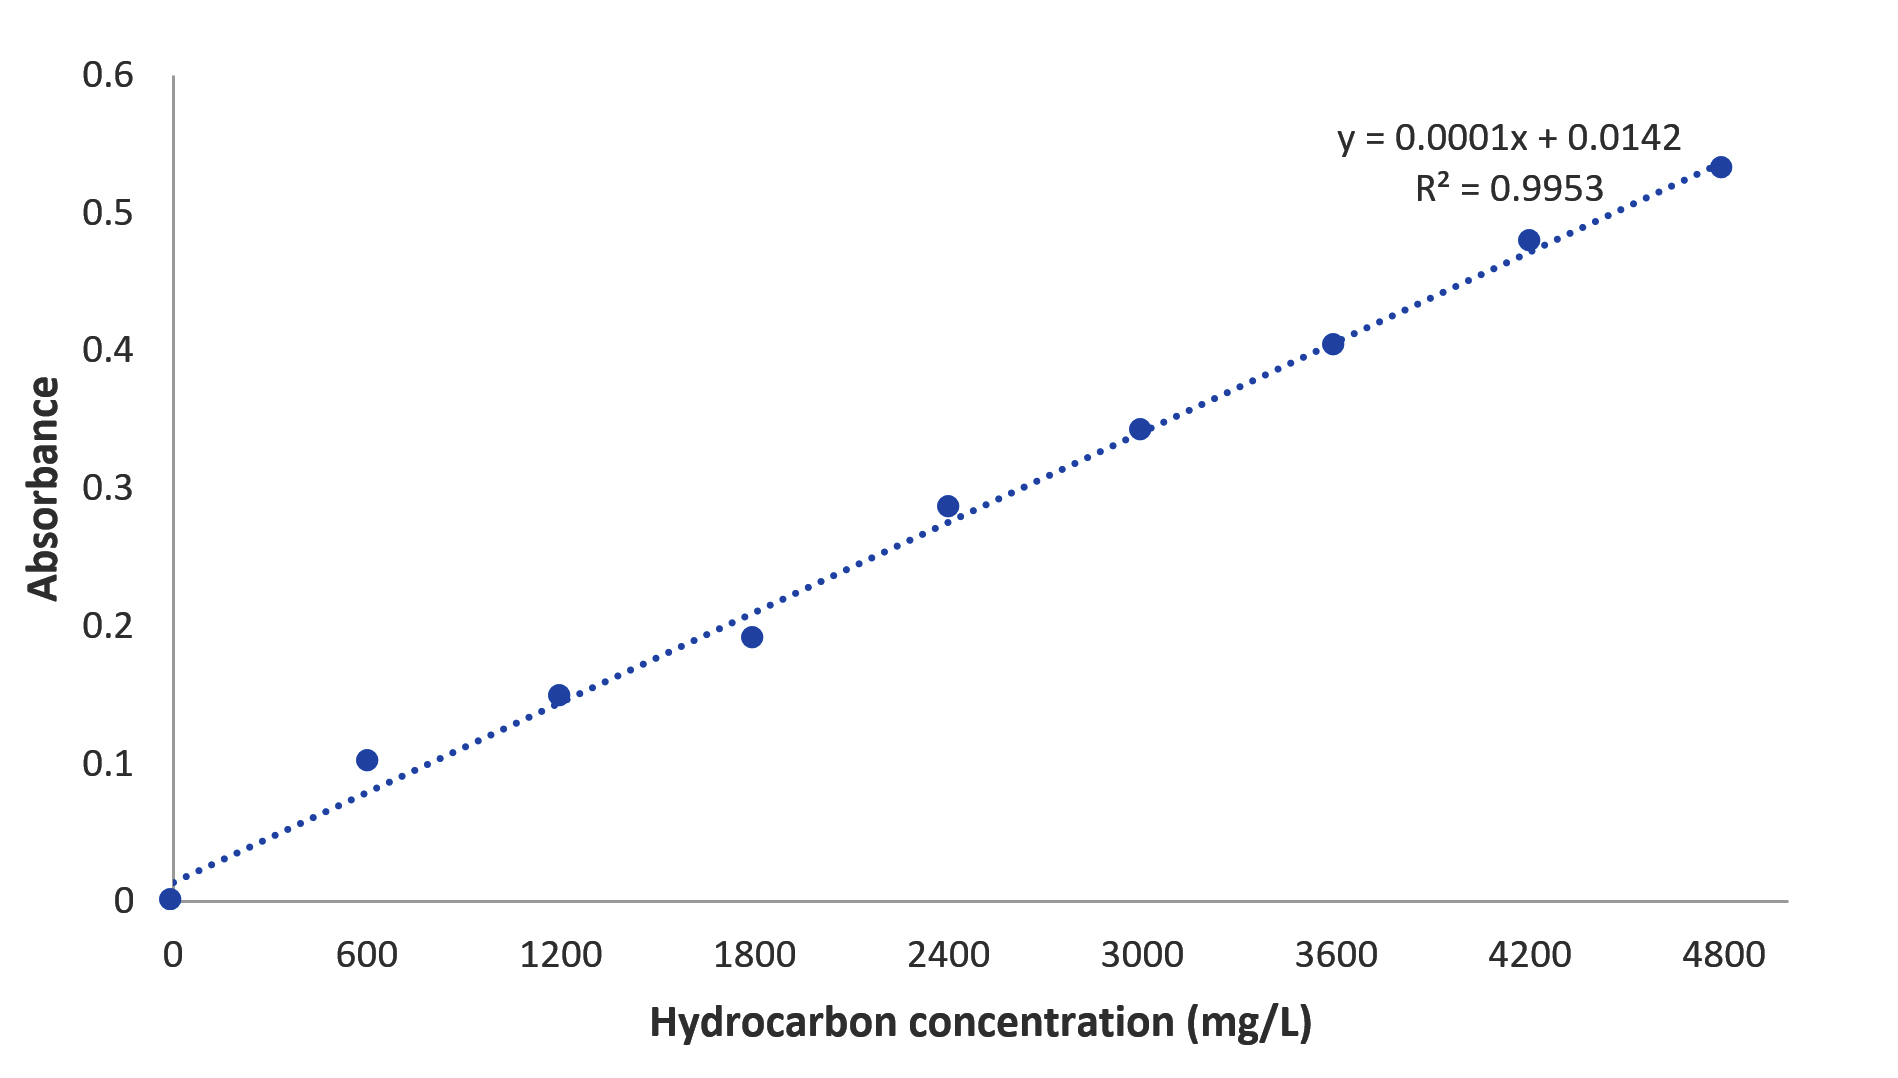
Figure 2. Calibration curve
Sampling
For this study, samples of polluted soil and water were collected from repair shops for combustion engine vehicles and from aquatic ecosystems that collect petroleum products in the cities of Natitingou and Bohicon in Benin. A Total of 12 samples, consisting of 6 contaminated soil samples and 6 contaminated water samples, were collected between January 2025-August 2025. Water samples were taken 3 cm from the surface in 100 mL amber borosilicate bottles previously sterilized in a Trade Raypa steam sterilizer autoclave at 121 °C for 1 hour, and soil samples were collected in sterile zip-lock bags at depths of 0-15 cm and then 15-30 cm using a sterile manual auger. Then, each sample was sealed, labeled, wrapped in aluminum foil to prevent further oxidation reactions, stored at 4 °C in a cooler, and transported to the laboratory for analysis. The geographical locations of the sampling sites in Natitingou and Bohicon, Benin, are shown in Figure 3.
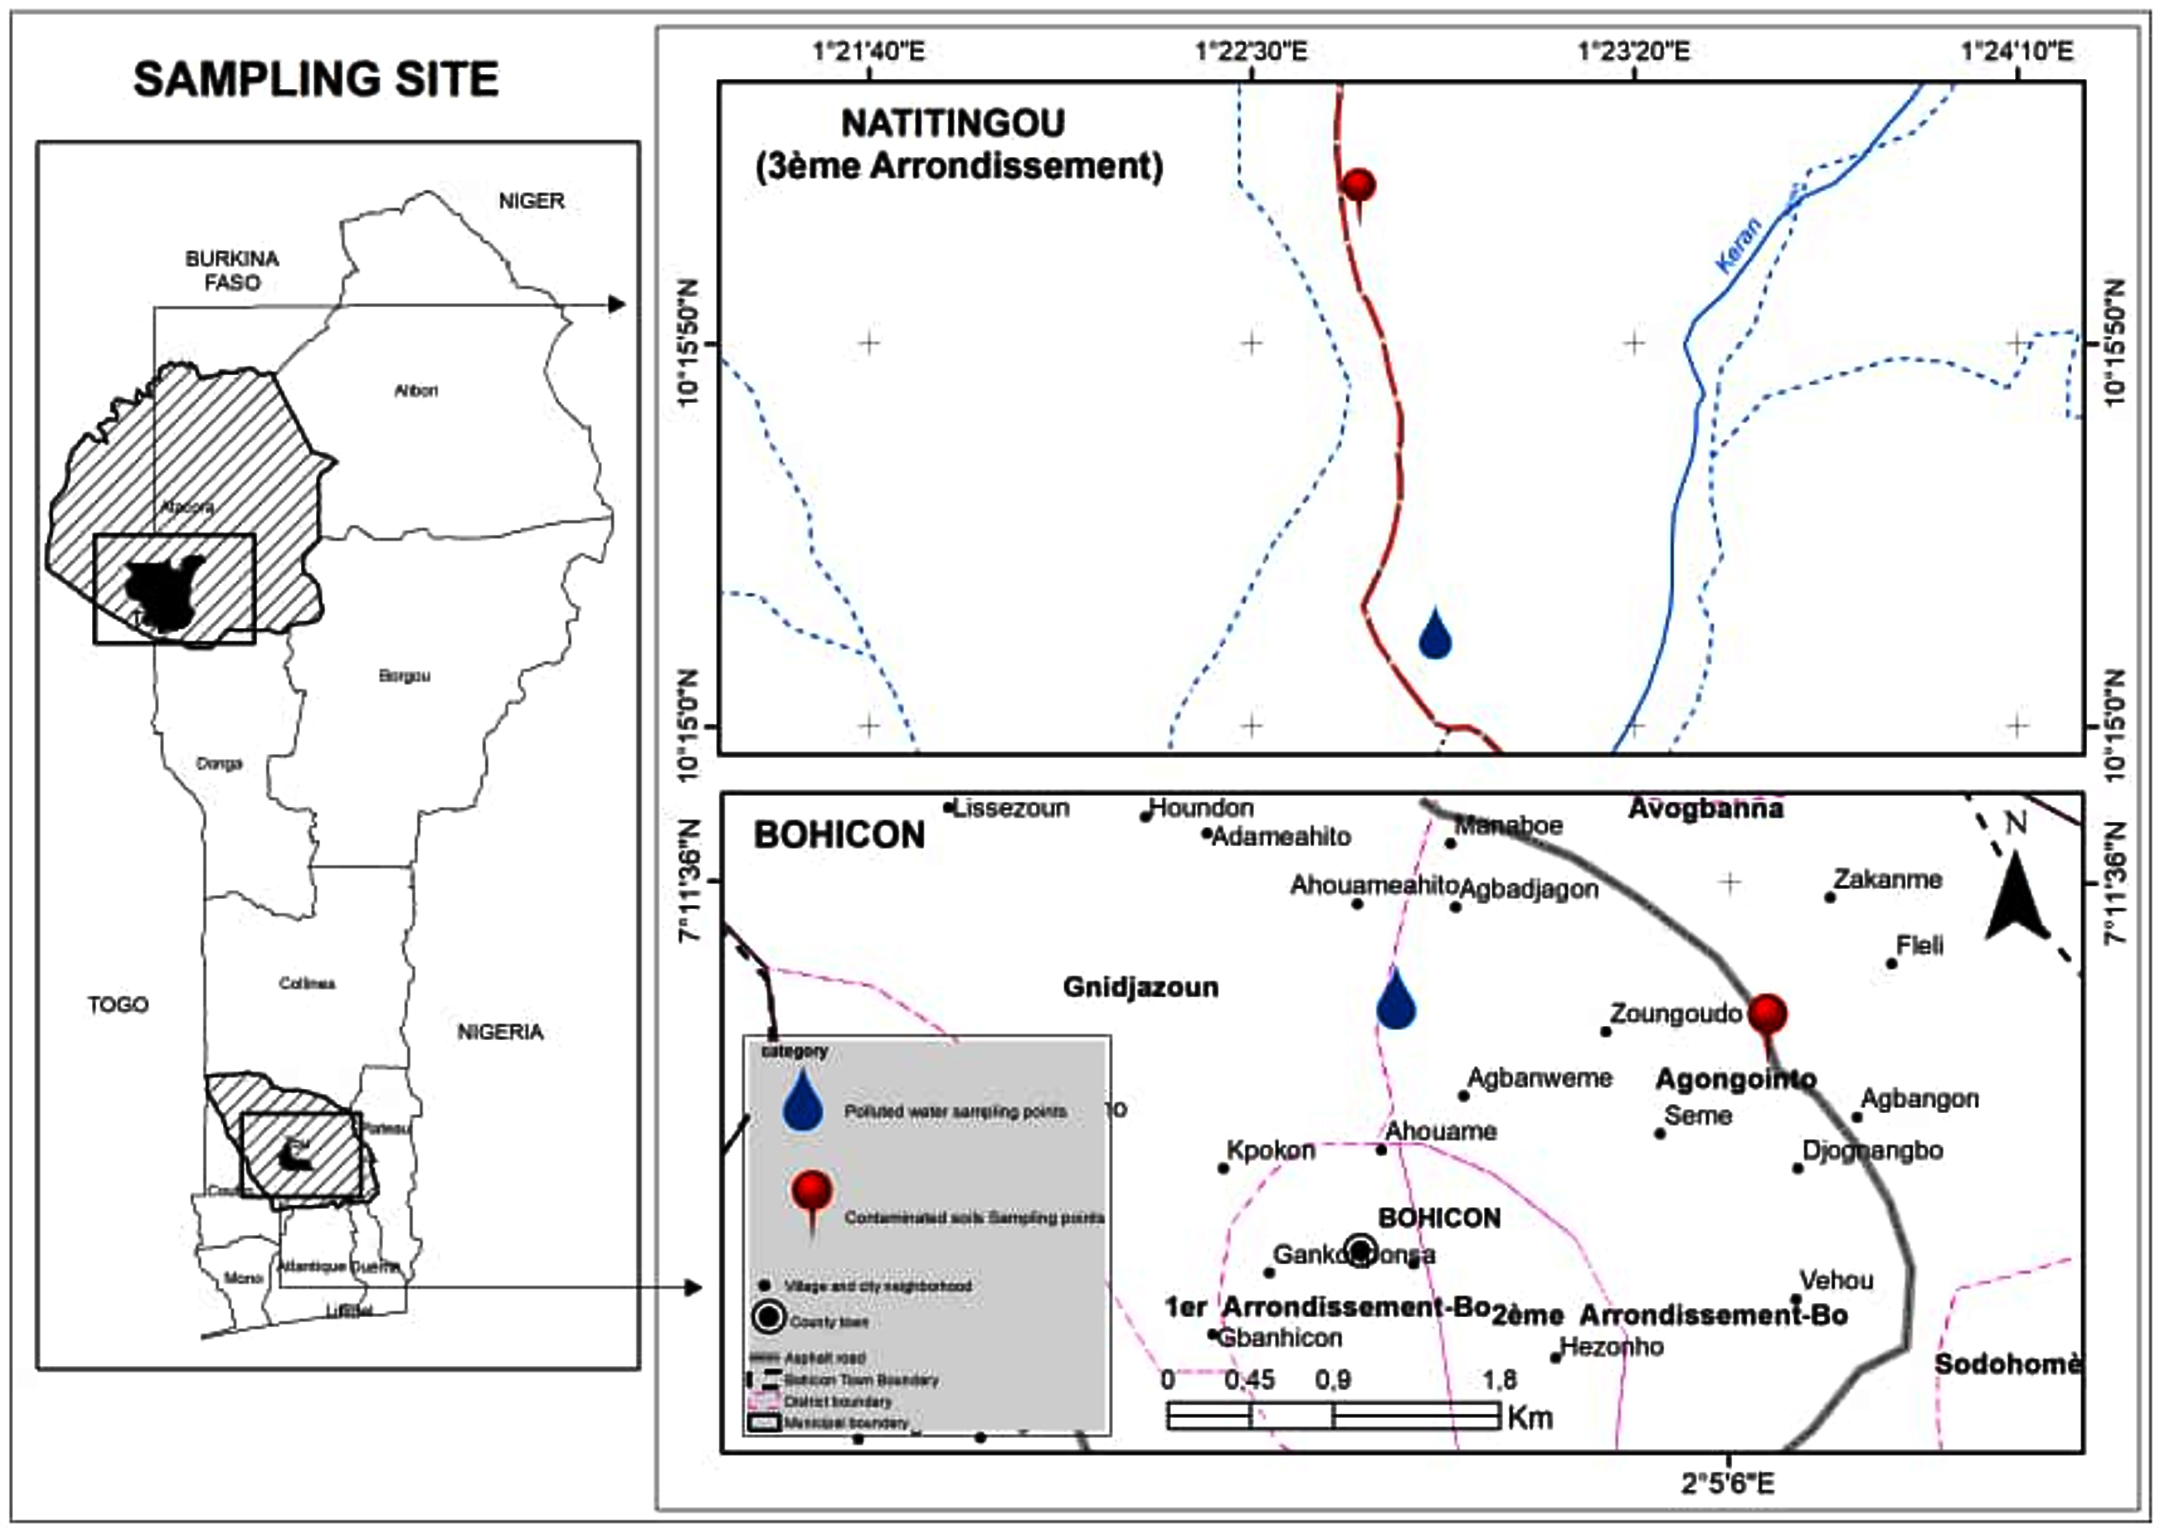
Figure 3. Geographical location of the sampling sites in Natitingou and Bohicon, Benin.
(Source: Geographic coordinates were recorded by the authors during field surveys using Google Maps)
Physico-chemical analyses of polluted water and soil samples
Petroleum hydrocarbon-contaminated soil samples were dried at 60 °C to constant weight, ground, and sieved through a 2 mm mesh. An aqueous extract was prepared using a soil to distilled water ratio of 1:10 (w/v). The suspension was agitated for 1 hrs and allowed to stand for 2 hrs. The supernatant was then collected and filtered through filter paper before being used for physicochemical analyses, following the same analytical procedures applied to the water samples.20 Physico-chemical parameters such as pH, temperature, electrical conductivity, TDS, and dissolved oxygen of the samples were measured using Hanna HI 991001 pH meter, Hanna HI 99300 multiparameter conductivity meter, and WTW OXI 3205 oxygen meter, respectively. Concentrations of nitrites and nitrates were determined spectrophotometrically using UV/Vis Spectrometer Bioevopeak SP-MUV8000T respectively with sulfanilic acid at 435 nm and sodium salicylate at 416 nm, while phosphates and ammonium were quantified with ammonium molybdate at 708 nm and Nessler’s reagent at 400 nm, respectively. Biochemical Oxygen Demand (BOD) of analyzed water samples was assessed using a manometric BOD meter in a biochemical incubator FSPX-150BIII. Chemical Oxygen Demand (COD) and Total Organic Carbon (TOC) were found by hot potassium dichromate oxidation. Polluted water and soil samples were analyzed to determine their total petroleum hydrocarbon content by weighing 5 g of the sample into a 250 ml beaker containing 50 ml of dichloromethane. This mixture was covered with aluminum foil and shaken for 10 minutes. A Pasteur pipette was then used to collect the supernatant in a glass cuvette, and its absorbance was measured by spectrophotometry at 317 nm. The sample’s concentration (mg/L) of petroleum hydrocarbons was calculated from the measured absorbance (A) according to the following expression:
C = (A – 0.0142) / (0.001)
Microbiological analyses of polluted water and soil samples
Agar spread plating was used to isolate viable bacteria and fungi from water and soil samples contaminated with petroleum hydrocarbons. In triplicate, 100 µL of decimal dilutions ranging from 10-1 to 10-6 of water or soil samples were seeded on appropriate selective agar plates. Suspicious bacterial isolates were identified using standard biochemical tests and confirmed on API gallery, while fungi were identified under an optical microscope after being fixed in 1% methylene blue, based on the structure of the hyphae, the morphology of the cells and spores, and the nature of the fruiting bodies. Initial sample concentration was determined by multiplying the number of colonies found in a dilution by the dilution factor, and the result is expressed in CFU/100 mL for water samples and in CFU/100 g for soil samples. The identified colonies are stored in Eppendorf tubes with 5% glycerol at 20 °C for later use. Microorganisms sought and identification operating conditions are presented in Table 1.
Table 1. Operative conditions of identification
| Microorganisms | Culture media | Temp./ incubation time | Colony Morphology | Control tests |
|---|---|---|---|---|
| Total coliforms | Chromogenic Coliform Agar | 37 °C/24 hrs | – | Gram, oxidase, API 20E gallery |
| S. aureus | Mannitol Salt Agar | 37 °C/24 hrs | Yellow colonies with yellow halos around them | Gram, coagulase and DNase tests |
| B. cereus | Bacillus cereus Agar | 30 °C/24 hrs | Pink colonies with a halo yellow colonies without a halo |
Gram, catalase, API 50 CHB gallery, API 50 CH gallery |
| B. subtilis | ||||
| P. aeruginosa | Cetrimide | 41 °C/24 hrs | Greenish blue to yellowish green colonies | Gram, oxidase, API 20NE gallery |
| Aspergillus spp. | Sabouraud Dextrose Agar with Chloramphenicol | 28 °C/ 5-7 days | Milk colour cottony growth with radial surface and yellow reverse | Columnar bunched philiades branching conidia, with septate hyphae |
| Penicillium spp. | Radially furrowed blue-green velvety growth with white periphery and yellow reverse | Septate hyphae, with branched conidiophores bearing phialides. Conidia, arranged in chains on the phialides | ||
| Trichophyton spp. | White lawny growth with radial surface and red reverse side | Septate branching hyphae, with microconidia formed along hyphae |
Bacterial growth assays
Bacterial growth tests on petroleum hydrocarbons were carried out in accordance with the protocol described by AlKaabi et al.,19 with a few modifications. Indeed, 2-3 pure colonies of Pseudomonas aeruginosa or Escherichia coli previously isolated from water and soil samples contaminated with petroleum hydrocarbons were suspended in 15 mL of nutrient broth and incubated at 37 °C for 24 hours. Then, a 10 mL inoculum was taken and centrifuged at 3000 rpm for 20 minutes. The resulting pellet is then resuspended in 2 mL of liquid MSN medium and centrifuged at 3000 rpm for 20 minutes to wash the bacterial strains. This washing process is repeated three times, after which the bacterial strains are ready for growth testing. For hydrocarbon growth tests, the previously washed bacterial pellet is resuspended in 40 mL of liquid MSN medium at pH 6.7 and contaminated with 0.5% (v/v) crude mineral engine oil, then incubated at 30 °C in the dark with constant agitation for 14 days. Optical density of the mixture is measured at 600 nm using a spectrophotometer every 24 hours throughout the experiment. MSM culture medium composition is 4.0 g/L NH4NO3, 2.0 g/L Na2HPO4, 0.53 g/L KH2PO4, 0.17 g/L K2SO4, 0.10 g/L MgSO4.7H2O, 1 g/L EDTA, 0.42 g/L ZnSO4, 1.78 g/L MnSO4, 0.5 g/L H3BO3, and 1 g/L NiCl2.
Data analysis
All experiments were triplicated, and the mean values of each result were calculated and compared to each other using R software.
Physico-chemical and microbiological parameters of polluted water and soil samples
Oil-contaminated surface water and soil samples collected in Natitingou and Bohicon, Benin, were characterized. Results of the physicochemical and microbiological characterizations are presented in Tables 2-5. The results showed that the surface water and soil samples exhibited slightly acidic to neutral pH values. These variations indicate differences in the physicochemical conditions of the investigated environments. Similar associations between physicochemical characteristics and microbial populations have been reported in petroleum-contaminated environments.21 Previous studies have suggested that the transformation of petroleum hydrocarbons through biological and chemical processes may influence the physicochemical conditions of contaminated environments, including pH.22,23
Table 2. Physico-chemical parameters of samples from Natitingou
| Parametres | Samples | ||||
|---|---|---|---|---|---|
| Surface water | Units | Soil (depth in cm) | Units | ||
| 0-15 | 15-30 | ||||
| Temperature | 28.10 ± 0.01 | °C | – | – | – |
| pH | 6.83 ± 0.03 | 6.35 ± 0.02 | 6.63 ± 0.01 | – | |
| Dissolved oxygen | 6.39 ± 0.04 | mg/L | 3.65 ± 0.01 | 3.16 ± 0.03 | mg/L |
| Electrical conductivity | 212.73 ± 0.35 | µS/cm | 272.77 ± 0.06 | 171.23 ± 0.81 | µS/cm |
| Salinity | 0.10 ± 0.01 | ppt | 0.10 ± 0.01 | 0.10 ± 0.01 | ppt |
| TDS | 142.60 ± 0.20 | mg/L | 182.73 ± 0.06 | 114.73 ± 0.55 | mg/L |
| Nitrates | 0.71 ± 0.02 | mg/L | 0.90 ± 0.01 | 0.93 ± 0.01 | mg/L |
| Nitrites | 0.13 ± 0.01 | mg/L | 0.42 ± 0.01 | 0.14 ± 0.01 | mg/L |
| Ammonium | 0.21 ± 0.01 | mg/L | 0.32 ± 0.01 | 0.08 ± 0.01 | mg/L |
| Phosphates | 0.058 ± 0.01 | mg/L | 0.29 ± 0.01 | 0.06 ± 0.01 | mg/L |
| Chemical Oxygen Demand | 106.72 ± 6.56 | mg/L | – | – | – |
| Total Organic Carbon | – | – | 8.60 ± 0.15 | 1.68 ± 0,03 | % |
| Total hydrocarbon content | 1298 ± 282.84 | mg/L | 23358 ± 42.43 | 22178 ± 70.71 | mg/L |
Table 3. Physico-chemical parameters of samples from Bohicon
| Parameters | Samples | ||||
|---|---|---|---|---|---|
| Surface water | Units | Soil (depth in cm) | Units | ||
| 0 – 15 | 15 – 30 | ||||
| Temperature | 26.80 ± 0.10 | °C | – | – | – |
| pH | 7.14 ± 0.04 | 6.38 ± 0.02 | 7.17 ± 0.02 | – | |
| Dissolved Oxygen | 3.18 ± 0.07 | mg/L | 1.37 ± 0.06 | 1.367 ± 0.19 | mg/L |
| Electrical Conductivity | 1674.67 ± 0.58 | µS/cm | 150.30 ± 0.61 | 201.33 ± 1.33 | µS/cm |
| Salinity | 0.80 ± 0.01 | ppt | 0.10 ± 0.01 | 0.10 ± 0.01 | ppt |
| TDS | 1121.67 ± 0.58 | mg/L | 100.73 ± 0.38 | 134.93 ± 0.90 | mg/L |
| Nitrates | 3.55 ± 0.01 | mg/L | 1.62 ± 0.02 | 3.35 ± 0.04 | mg/L |
| Nitrites | 0.474 ± 0.01 | mg/L | 0.47 ± 0.01 | 0.50 ± 0.02 | mg/L |
| Ammonium | 0.25 ± 0.01 | mg/L | 0.494 ± 0.01 | 0.491 ± 0.01 | mg/L |
| Phosphates | 0.16 ± 0.01 | mg/L | 0.35 ± 0.01 | 0.29 ± 0.01 | mg/L |
| Chemical Oxygen Demand | 180.96 ± 8.41 | mg/L | – | – | – |
| DBO5 | 195.15 ± 17.61 | mg/L | – | – | – |
| Total Organic Carbon | – | – | 3.45 ± 0.03 | 0.44 ± 0.03 | % |
| Total hydrocarbon content | 18338 ± 70.71 | mg/L | 21533 ± 63.64 | 4918 ± 84.85 | mg/L |
Table 4. Microbiological parameters of samples from Natitingou
| Microorganisms | Samples | ||||
|---|---|---|---|---|---|
| Surface water | Units | Soil (depth in cm) | Units | ||
| 0 – 15 | 15 – 30 | ||||
| Total coliforms | 7.50 ± 0.71 x 10⁷ | CFU/100 mL | 2.40 ± 0.21 x 10⁵ | 1.60 ± 0.11 x 10⁵ | CFU/100 g |
| Staphylococcus aureus | 1.33 ± 0.71 x 10⁴ | CFU/100 mL | 3.50 ± 0.71 x 10⁵ | 4.10 ± 0.01 x 10⁵ | CFU/100 g |
| Bacillus cereus | 4.00 ± 1.41 x 10⁵ | CFU/100 mL | 8.50 ± 2.12 x 10⁵ | 2.50 ± 0.71 x 10⁴ | CFU/100 g |
| Bacillus subtilis | 5.00 ± 1.41 x 10⁵ | CFU/100 mL | 2.50 ± 0.71 x 10⁵ | 7.00 ± 1.41 x 10⁴ | CFU/100 g |
| Pseudomonas aeruginosa | <1 | CFU/100 mL | 4.00 ± 2.83 x 10⁵ | <1 | CFU/100 g |
| Aspergillus spp. | 8.50 ± 2.12 x 10⁶ | CFU/100 mL | <1 | 3.90 ± 0.28 x 10⁶ | CFU/100 g |
| Penicillium spp. | 1.40 ± 0.42 x 10⁶ | CFU/100 mL | <1 | <1 | CFU/100 g |
| Trichophyton spp. | <1 | CFU/100 mL | <1 | 2.45 ± 0.21 x 10⁶ | CFU/100 g |
Table 5. Microbiological parameters of samples from Bohicon
| Microorganisms | Samples | ||||
|---|---|---|---|---|---|
| Surface water | Units | Soil (depth in cm) | Units | ||
| 0 – 15 | 15 – 30 | ||||
| Total coliforms | 2.30 ± 0.28 x 10⁶ | CFU/100 mL | <1 | <1 | CFU/100 g |
| Staphylococcus aureus | 7.95 ± 1.20 x 10⁴ | CFU/100 mL | 1.45 ± 0.49 x 10⁴ | 1.65 ± 0.01 x 10⁵ | CFU/100 g |
| Bacillus cereus | 1.40 ± 0.41 x 10⁴ | CFU/100 mL | 3.30 ± 0.14 x 10⁴ | 2.10 ± 0.14 x 10⁴ | CFU/100 g |
| Bacillus subtilis | 2.55 ± 0.21 x 10⁴ | CFU/100 mL | 2.90 ± 0.28 x 10⁴ | 7.45 ± 0.35 x 10⁴ | CFU/100 g |
| Pseudomonas aeruginosa | 1.15 ± 0.07 x 10³ | CFU/100 mL | <1 | <1 | CFU/100 g |
| Aspergillus spp. | 5.95 ± 0.21 x 10⁴ | CFU/100 mL | 8.90 ± 1.55 x 10⁴ | 1.85 ± 0.12 x 10⁵ | CFU/100 g |
| Penicillium spp. | 4.20 ± 0.14 x 10³ | CFU/100 mL | 3.10 ± 0.28 x 10⁴ | <1 | CFU/100 g |
| Trichophyton spp. | 5.75 ± 0.49 x 10⁴ | CFU/100 mL | 2.05 ± 0.07 x 10⁴ | 2.20 ± 0.14 x 10⁴ | CFU/100 g |
Mean dissolved oxygen values measured vary between 1.33 ± 0.06 mg/L and 6.39 ± 0.04 mg/L. Low values of dissolved oxygen are observed in samples heavily polluted by petroleum hydrocarbons, with maximum concentrations reaching 18338 ± 70.61 mg/L in the surface water samples analyzed and 23358 ± 42.43 mg/L in the soil samples analyzed. These levels far exceed the Beninese standard for total hydrocarbon emissions into the environment, which is 10 mg/L. Petroleum hydrocarbons form a film on the surface of the water, reducing exchanges at the air-water interface.24 In the soil, they occupy the soil pores, preventing air circulation.25 The reduction in dissolved oxygen content in ecosystems contaminated by petroleum hydrocarbons causes varying degrees of damage to microorganisms, slowing down biodegradation.22 The microbiological parameters of the contaminated surface water and soil samples are presented in Tables 4 and 5. These show that both surface water and soil samples have bacteria like total coliforms (2.30 ± 0.28 x 10⁶ CFU/100 mL to 7.50 ± 0.71 x 10⁷ CFU/100 mL and 1.45 ± 0.49 x 10⁴ CFU/100 g to 2.40 ± 0.21 x 10⁵ CFU/100 g), Pseudomonas aeruginosa (1.15 ± 0.07 x 10³ CFU/100 mL then 4.00 ± 2.71 x 10⁷ CFU/100 g), Staphylococcus aureus (1.33 ± 0.71 x 10⁴ CFU/100 mL to 7.95 ± 1.20 x 10⁴ CFU/100 mL then from 1.45 ± 0.49 x 10⁴ CFU/100 g to 4.10 ± 0.01 x 10⁵ CFU/100 g), Bacillus cereus (1.40 ± 0.41 x 10⁴ CFU/100 mL to 4.00 ± 1.41 x 10⁵ CFU/100 mL then from 2.10 ± 0.14 x 10⁴ CFU/100 g to 8.50 ± 2.12 x 10⁵ CFU/100 g), Bacillus subtilis (2.55 ± 0.21 x 10⁴ CFU/100 mL to 5.00 ± 1.41 x 10⁵ CFU/100 mL then from 2.50 ± 0.71 x 10⁵ CFU/100 g to 7.45 ± 0.35 x 10⁴ CFU/100 g) and fungi such as Aspergillus spp. (5.95 ± 0.21 x 10⁴ CFU/100 mL to 8.50 ± 2.12 x 10⁶ CFU/100 mL then from 1.85 ± 0.12 x 10⁵ CFU/100 g to 3.90 ± 0.28 x 10⁶ CFU/100 g), Penicillium spp. (1.40 ± 0.42 x 10⁶ CFU/100 mL to 4.20 ± 0.14 x 10³ CFU/100 mL then 3.10 ± 0.28 x 10⁴ CFU/100 g), Trichophyton spp. (5.75 ± 0.49 x 10⁴ CFU/100 mL then from 2.05 ± 0.07 x 10⁴ CFU/100 g to 2.45 ± 0.21 x 10⁶ CFU/100 g). Similar observations have been made by other authors such as Khanafer et al. and Oguzie et al.26,27 Microorganisms living in waters and soils polluted by petroleum products are genetically adapted to such environments.
Bacterial Growth Response
We evaluated the growth response of Pseudomonas aeruginosa and Escherichia coli in a mineral medium containing 0.5% (v/v) TotalEnergies Quartz 5000 engine oil as the hydrocarbon substrate, in the absence of any other carbon or energy source, at pH 6.7. The results are shown in Figure 4. According to this figure, the growth curves of Pseudomonas aeruginosa and Escherichia coli are similar in the presence of TotalEnergies Quartz 5000 crude mineral engine oil. A lag phase was observed, during which OD600 changed only slightly, from 0.312-0.270 for Pseudomonas aeruginosa and from 0.001-0.075 for Escherichia coli over the first 48 hrs. This initial phase may reflect bacterial adaptation to the hydrocarbon-containing medium before active growth.28 An exponential growth phase was subsequently observed, with OD600 increasing from 0.270-0.988 for Pseudomonas aeruginosa and from 0.075-1.061 for Escherichia coli between 48 and 120 hrs. This increase in bacterial growth indicates the ability of both strains to grow in the presence of petroleum hydrocarbons. Finally, there is a plate-out or stationary phase marked by nutrient depletion and the accumulation of toxic metabolites in the reaction medium. The results showed that Pseudomonas aeruginosa and Escherichia coli were able to grow in the presence of TotalEnergies Quartz 5000 engine oil, with different growth rates. Pseudomonas aeruginosa exhibited a specific growth rate (μ) of 0.018 h-1, corresponding to a generation time of 38.5 hrs, whereas Escherichia coli showed a higher growth rate (μ) of 0.037 h-1, with a generation time of 18.8 hrs. These findings indicate differences in the growth responses of the two strains under hydrocarbon-containing conditions and warrant further investigation of their ability to utilize or transform specific petroleum hydrocarbons.
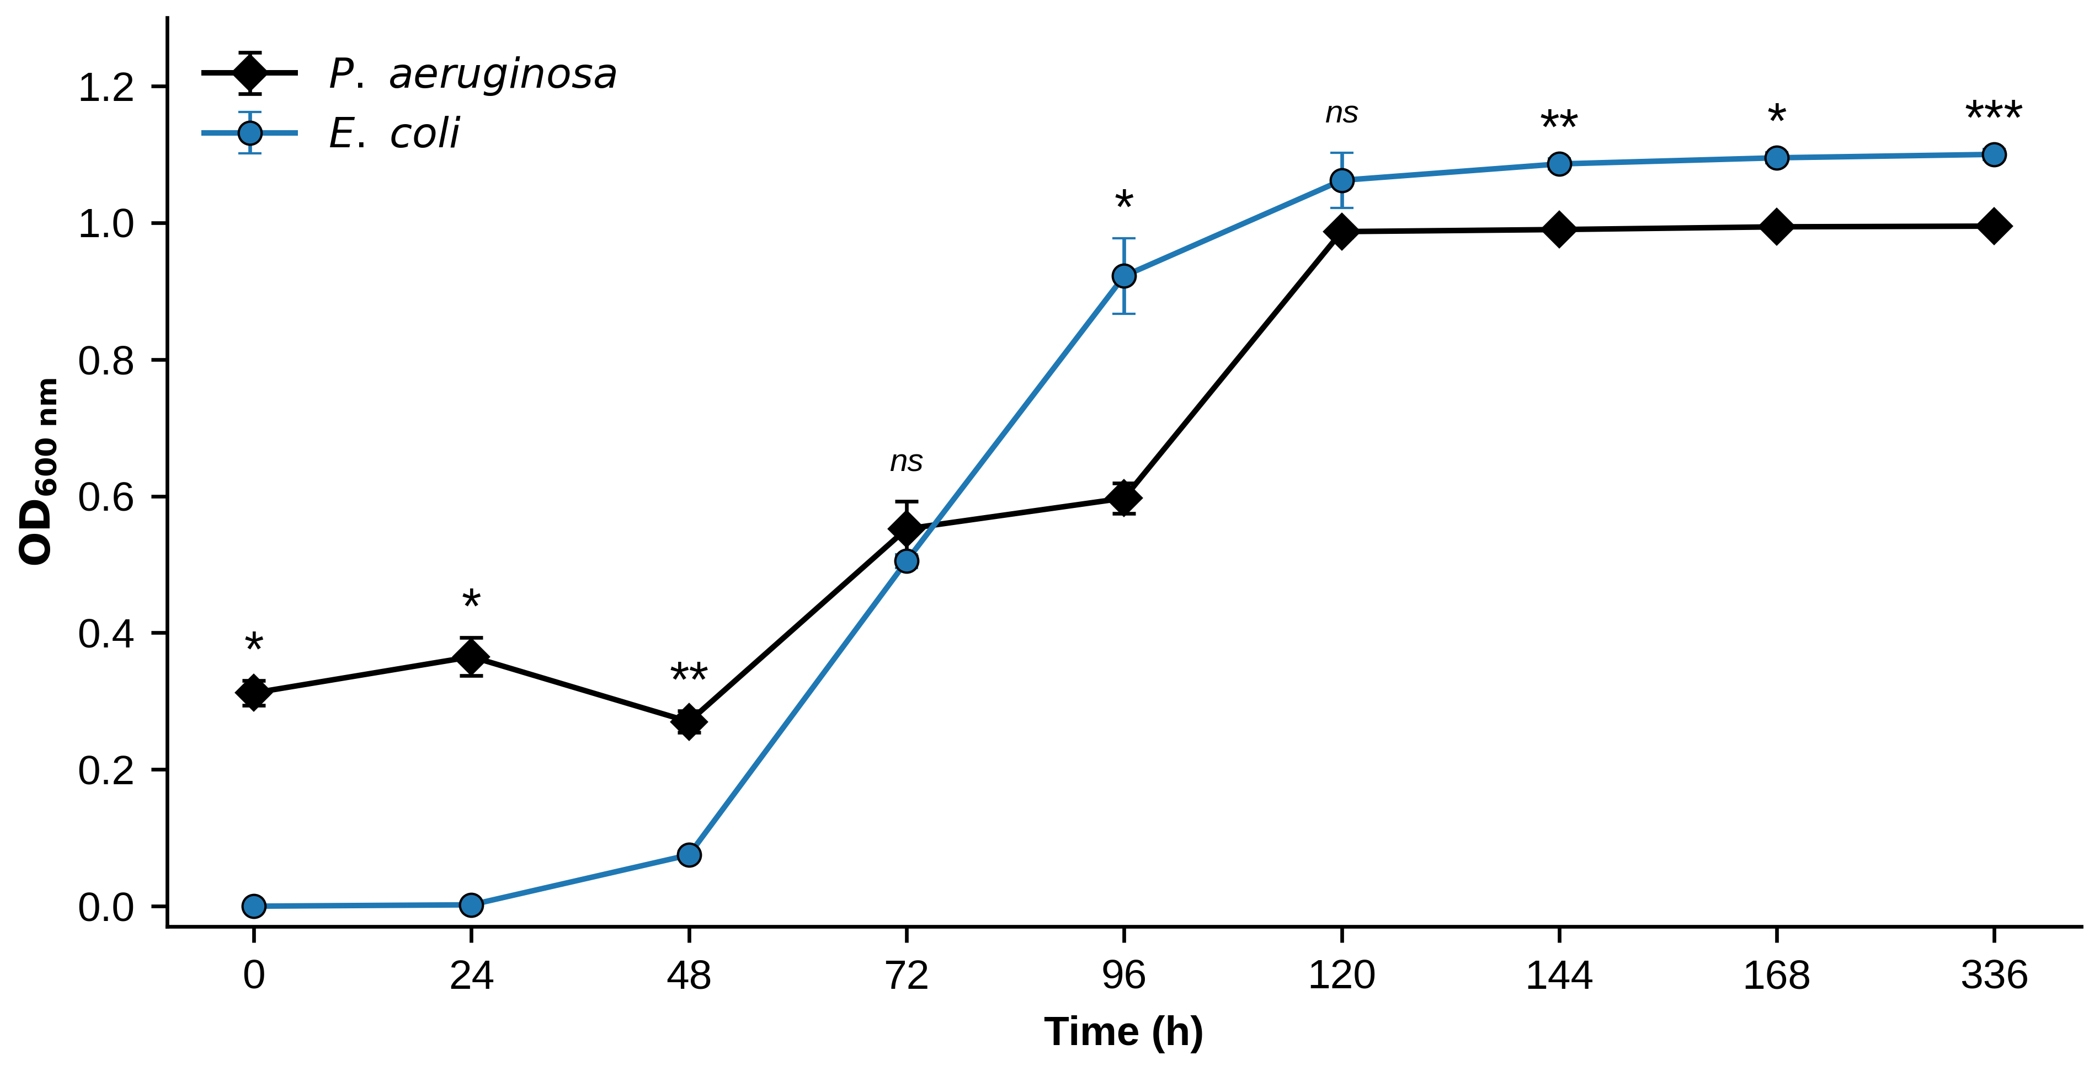
Figure 4. Bacterial Kinetics at pH 6.7 and 0.5% (v/v) crude mineral oil
Values are presented as means ± standard deviation (n = 3). One-way ANOVA revealed a highly significant effect of incubation time on bacterial growth for both strains (P. aeruginosa: F(8,9) = 454.3, P < 0.001; E. coli: F(8,9) = 959.8, P < 0.001). Asterisks indicate statistically significant differences between P. aeruginosa and E. coli at each time point, as determined by Welch’s t-test (*P < 0.05;**P < 0.01;***P < 0.001; ns, not significant)
Contaminated surface water and soil samples from Natitingou and Bohicon, Benin, were characterized for their physicochemical and microbiological properties. The samples contained petroleum hydrocarbon residues and diverse microorganisms, including total coliforms, Pseudomonas aeruginosa, Staphylococcus aureus, Bacillus cereus, Bacillus subtilis, Aspergillus sp., Penicillium sp., and Trichophyton sp. Growth assays in a hydrocarbon-containing mineral medium showed that Pseudomonas aeruginosa and Escherichia coli were able to grow in the presence of TotalEnergies Quartz 5000 engine oil. Further studies using specific hydrocarbon analyses are required to determine whether the observed bacterial growth is associated with the utilization or transformation of petroleum hydrocarbons.
ACKNOWLEDGMENTS
The authors gratefully acknowledge the administrative authorities of Higher Normal School of Natitingou, Benin, for facilitating this study.
CONFLICT OF INTEREST
The authors declare that there is no conflict of interest.
AUTHORS’ CONTRIBUTION
All authors listed have made a substantial, direct and intellectual contribution to the work, and approved it for publication
FUNDING
This study was funded by the Doctoral School of the National University of Science, Technology, Engineering and Mathematics (ED-UNSTIM), under the Competitive Funds Research Support Programme (Funding Agreement No. 0434-2024/R-UNSTIM/VR-RU/SG/AC/D-EDSTIM/SA, dated 9 December 2024).
DATA AVAILABILITY
The datasets generated and/or analysed during the current study are available from the corresponding author on reasonable request.
ETHICS STATEMENT
This article does not contain any studies on human participants or animals performed by any of the authors.
- Cheng H, Li Z, Li Y, et al. Multi-functional Magnetic Bacteria as Efficient and Economical Pickering Emulsifiers for Encapsulation and Removal of Oil from Water. J Colloid Interface Sci. 2020;560:349-358.
Crossref - Kazemi A, Parvaresh H, Ghanatghestani MD, Ghasemi S. A study on source identification of contaminated soil with total petroleum hydrocarbons (aromatic and aliphatic) in the Ahvaz oil field. Environ Monit Assess. 2024;196(9):776.
Crossref - Hosseini K, Taghavi L, Ghasemi S, Ghanatghestani MD. Health risk assessment of total petroleum hydrocarbons and heavy metals in groundwater and soils in petrochemical pipelines. Int J Environ Sci Technol. 2023;20(2):1411-1420.
Crossref - Wang S, Li C, Zhang L, Chen Q, Wang S. Assessing the ecological impacts of polycyclic aromatic hydrocarbons petroleum pollutants using a network toxicity model. Environ Res. 2024;245:117901.
Crossref - Ikelle II, Nworu SJ, Amitaye NA. Petroleum hydrocarbon carcinogens in organs of commercially available fish species from crude oil polluted Escravos River in Delta State, Nigeria. Acta Chem Malays. 2024;8(1):31-38.
Crossref - Kakde P, Sharma J. Microbial Bioremediation of Petroleum Contaminated Soil: Structural Complexity, Degradation Dynamics and Advanced Remediation Techniques. J Pure Appl Microbiol. 2024;18(4):2244-2261.
Crossref - Sam K, Pegg S, Oladejo AO. Mining from the pipeline: artisanal oil refining as a consequence of failed CSR policies in the Niger Delta. J Environ Manage. 2024;352:120038.
Crossref - Suku PG, Ugwoha E, Orikpete OF. Artisanal Crude Oil Refining in the Niger Delta: Environmental Impacts, Health Outcomes, and Strategies for Sustainable Mitigation. J Earth Environ Sci Res. 2024;220(6):2-9.
Crossref - United States Environmental Protection Agency. Analytical Method Guidance for EPA Method 1664A Implementation and Use (40 CFR Part 136). National Technical Information Service; 2000.
- Ateshan HM, Talib AH. Biodegradation Aromatic Hydrocarbons of Naphthalene by Aspergillus flavus and Penicillium fumigates. Eur J Sci Innov Technol. 2025;5(4):100-112. https://www.ejsit-journal.com/index.php/ejsit/article/view/701
- Louzon M, Bertoncini T, Casanas N, et al. Laser-Induced Solid-Phase UV Fluorescence Spectroscopy for Rapid Detection of Polycyclic Aromatic Hydrocarbons in the Land Snail Bioindicator, Cantareus aspersus. Biosensors.2025;15(7):450.
Crossref - Tian M, Muhammad T, Li Y, et al. Application of synchronous fluorescence spectroscopy in the analysis of polycyclic aromatic hydrocarbons in petroleum and coal. Appl Spectrosc Rev. 2025; 60(7):611-637.
Crossref - Auyrzhan A, Mereke A, Rebeca L, Yerkanat S. Green analytical procedure index assessment for total petroleum hydrocarbons determination methods in soil and sediments. A review. Trends Environ Anal Chem. 2025;46:e00262.
Crossref - Yue Z, Shi Q, Ai J, Peng S, Miao X, Wang Z. A review on analytical methods of petroleum hydrocarbons in water and sediment of aquatic systems. IOP Conf Ser.: Earth Environ Sci. 2021;621:012011.
Crossref - Natarajan S, Subbiah M, Manam VK, et al. Microbial-mediated remediation of crude oil-contaminated soil. In: Karnwal A, Mohammad Said Al-Tawaha AR, eds. Microbial Applications for Environmental Sustainability. Springer; 2024.
Crossref - Dai X, Lv J, Fu P, Guo S. Microbial remediation of oil-contaminated shorelines: a review. Environ Sci Pollut Res. 2023;30(41):93491-93518.
Crossref - Ameen F, Alsarraf MJ, Abalkhail T, Stephenson SL. Evaluation of resistance patterns and bioremoval efficiency of hydrocarbons and heavy metals by the mycobiome of petroleum refining wastewater in Jazan with assessment of molecular typing and cytotoxicity of Scedosporium apiospermum JAZ-20. Heliyon. 2024;10(12):e32954.
Crossref - Obahiagbon KO, Owabor CN. Bio-treatment of crude oil polluted water using mixed microbial populations of P. aureginosa, Penicillium notatum, E. coli and Aspergillus niger. Adv Mater Res. 2009;62-64:802-807.
Crossref - AlKaabi N, Al-Ghouti MA, Jaoua S, Zouari N. Potential for native hydrocarbon-degrading bacteria to remediate highly weathered oil-polluted soils in Qatar through self-purification and bioaugmentation in biopiles. Biotechnol Rep. 2020;28:e00543.
Crossref - Crespo-Toledo T, Avelar-Gonzalez F, Guerrero-Barrera A, Mitchell K, Yamamoto-Flores L, Flores-Amaro O. Integrative assessment of heavy metal risks in mining polluted sediments and soils of Aguascalientes, Mexico. Case Stud Chem Environ Eng. 2025;11:101130.
Crossref - Devi SP, Jha DK. Screening of bacteria isolated from refinery sludge of Assam for hydrocarbonoclastic activities. J Pure Appl Microbiol. 2020;14(2):1453-1465.
Crossref - Alim MB, Oves M, Jamal MT, Kunarso K. Comparative Hydrocarbon Biodegradation by Bacillus haikouensis and Cytobacillus kochii: Pure Culture versus Consortium Performance. J Pure Appl Microbiol. 2025;19(3):2069:2086.
Crossref - Mohanta S, Pradhan B, Behera ID. Impact and Remediation of Petroleum Hydrocarbon Pollutants on Agricultural Land: A Review. Geomicrobiol J. 2024;41(4):345-359.
Crossref - Ma Y, Zhu H, Liu H, et al. Degrading characteristics of oil-degrading bacteria and its study of petroleum hydrocarbon metabolites. CLEAN–Soil, Air, Water. 2024;52(2):2300163.
Crossref - Mambwe M, Kalebaila KK, Johnson T. Remediation technologies for oil contaminated soil.Global J Environ Sci Manage. 2021;(7)3:419-438.
Crossref - Khanafer M, Husain A, Samir R. Coliform bacteria for bioremediation of waste hydrocarbons. BioMed Res Int. 2017;1:1838072.
Crossref - Oguzie GP, Williams JO, Aleruchi O. Microbiological and physicochemical characteristics of soil contaminated with crude oil in Port Harcourt. Int J Microbiol Appl Sci. 2024;3(1):303-312.
- Ren L, Zhang J, Geng B, Zhao J, Jia W, Cheng L. Ecological Shifts and Functional Adaptations of Soil Microbial Communities Under Petroleum Hydrocarbon Contamination. Water. 2025;17(8):1216.
Crossref
© The Author(s) 2026. Open Access. This article is distributed under the terms of the Creative Commons Attribution 4.0 International License which permits unrestricted use, sharing, distribution, and reproduction in any medium, provided you give appropriate credit to the original author(s) and the source, provide a link to the Creative Commons license, and indicate if changes were made.