


ISSN: 0973-7510
E-ISSN: 2581-690X
 , Mamounata Diao1 , Iliassou Mogmenga2, Hemayoro Sama1,3, Yerobessor Dabire1, Samson Guenne1,3, Crepin Ibingou Dibala1, Abdoudramane Sanou1,4, Kabakde Kabore1,5, Sophie Nadege Gnangui6, Kiessoun Konate1,4 and Mamoudou Hama Dicko1
Bacterial cellulase production remains limited by suboptimal culture conditions, resulting in high production costs and restricting its industrial applications. This research aimed to determine γ-haemolytic degrading bacteria cellulose and to optimize cellulase production. Of 42 strains isolated on a reconstituted medium supplemented with carboxymethylcellulose used as the exclusive carbon source, only 19 showed significant cellulose hydrolysis capacity. Following morphological and metabolic characteristics analyses, together with haemolysis tests, 16S rRNA gene sequencing identified four promising strains belonging to three bacterial species: Paenibacillus dendritiformis (PQ845045) and Bacillus altitudinis (PQ845085 and PQ845089), all γ-haemolytic, as well as Mammaliicoccus lentus (PQ845126), a β-haemolytic strain. Cellulase production by Paenibacillus dendritiformis was optimized using a single-factor approach and a central composite experimental design. The results showed optimal activity at pH 7, with this activity increasing as the concentrations of the various carbon and nitrogen compounds increased. The statistical model, which was generally significant, allowed for a maximum activity of 3.32 IU/mL, representing an approximately 6-fold increase compared to the non-optimized medium. This activity was obtained in a medium containing 25 g/L of carboxymethylcellulose, 3 g/L of yeast extract, and 2.5 g/L of NaCl at 32.5 °C. Response surface analysis identified temperature as the main factor significantly influencing cellulase production. These results highlight the cellulolytic potential of P. dendritiformis B17C and position this strain as a promising candidate for the biotechnological production of cellulase.
Cellulolytic Bacteria, Optimization, Paenibacillus dendritiformis, 16S rRNA Sequencing, Response Surface Methodology
Cellulose is among the most abundant polysaccharides found in the natural environment, constituting the main structural element of cell walls of plants.1 It provides cell rigidity, regulates intracellular water exchange, and forms a barrier against pathogens.2 It consists of a linear chain of glucose monomers joined through β-(1→4)-glycosidic linkages. Its water-attracting and highly crystalline structure confers increased resistance and reduces its susceptibility to enzymatic hydrolysis compared to other cell wall polysaccharides.3 This resistance poses specific technological challenges in certain industries, particularly the fruit juice industry. Indeed, its presence in cell walls impedes juice release from cells, thereby affecting production yield, nutrient bioavailability, and the overall nutritional quality of the finished products. It can also cause persistent turbidity and alter the texture of fruit juices and purees.4 Other problems, such as the cellulosic nature of the fibers present in juices, can clog the production line and lead to significant industrial losses.5 To overcome these constraints, the food industry has traditionally used chemical agents such as benzoic acid, sodium benzoate, sorbic acid, or sulfur dioxide for clarification and stabilization.6 However, prolonged use of these chemicals can lead to undesirable organoleptic changes, altered nutritional quality, and raise health concerns regarding their safety for human consumption.7 In contrast, the enzymatic degradation of cellulose by cellulase offers a more respectful and sustainable approach. Cellulases constitute a complex enzymatic system. These enzymes are unique in that they degrade an insoluble polysaccharide. They primarily include endoglucanases, exoglucanases (cellobiohydrolases), and β-glucosidases. Endoglucanases [EC 3.2.1.4] hydrolyze the internal β-(1→4)-glycosidic bonds of cellulose chains, generating new reducing and non-reducing ends. Exoglucanases act processively from these ends and primarily release cellobiose. They include cellobiohydrolases acting from the non-reducing end [EC 3.2.1.91] and those acting from the reducing end [EC 3.2.1.176]. Finally, β-glucosidases [EC 3.2.1.21] hydrolyze cellobiose and other glucose-soluble β-D-glucosides, thus completing the saccharification process of cellulose.8,9 Their use, particularly in food processing industries and more specifically in the fruit and vegetable juice industry, helps to improve extraction yield, clarify juices, stabilize turbidity and texture, decrease the viscosity of fruit nectars, and influence other sensory characteristics, including aroma and flavor, in the final product.4,10-12 They are also used for cereal pretreatment and agricultural silage to enhance the nutritional value of livestock feed. They also find application for the extraction of olive oil and phenolic compounds derived from tea, as well as in other industries such as papermaking, biofuels, and textiles, where they play a fundamental role.9,11,13,14 Due to their numerous applications in various industrial fields, cellulases are the subject of intensive research. Although fungi are extensively studied for their cellulases, their slow growth and high production cost limit their industrial use.15 Bacteria, on the other hand, are readily cultured and exhibit weak feedback inhibition. They produce enzymes more rapidly and can be genetically modified.16 Therefore, various cellulose-rich sources, such as soil, plant debris, and ruminant excrement, were explored to identify bacteria with remarkable properties.15,17-19 In the present study, four bacteria with good cellulose-hydrolysis capabilities were identified by 16S rRNA gene sequencing as Paenibacillus dendritiformis, Bacillus altitudinis (two strains), and Mammaliicoccus lentus. In addition to its high cellulolytic activity, Paenibacillus dendritiformis also exhibited a γ-haemolytic phenotype, considered a favorable preliminary indicator of its safety, although this alone does not guarantee its safety for food applications.
The BRENDA database separately lists the different cellulase groups and provides information on substrate specificity, kinetic parameters, and optimal pH and temperature conditions for many producing bacteria.21 Although this database and the scientific literature document cellulase production in several species of the genus Paenibacillus, specific studies on Paenibacillus dendritiformis cellulases remain limited.10,22-24 Previous work on this species has mainly focused on other enzymatic activities.25,26 Paenibacillus dentritiformis could thus constitute a promising source of bacterial cellulases, the production conditions and properties of which require in-depth characterization. Moreover, the low enzyme yields frequently observed in natural strains necessitate the optimization of culture parameters. Statistical approaches, such as response surface methodology, allow for the simultaneous study of the effects of multiple factors and their interactions, while reducing the number of experiments required.27 They thus constitute a relevant strategy for improving enzyme production without necessarily resorting to genetic modification of the microorganism.19
In this context, the present study aims to contribute to the valorization of microbial resources from tropical niches for potential biotechnological applications. Specifically, it consisted of isolating cellulolytic bacteria from rotten fruit and sombala, characterizing the selected strains at the molecular level, identifying the strain exhibiting both a γ-haemolytic phenotype and the highest cellulolytic activity, and then optimizing the enzymatic production conditions of P. dentritiformis using response surface methodology.
Research site
The present study was carried out at the Laboratory of Biochemistry, Biotechnology, Food Technology, and Nutrition (LABIOTAN) and the Laboratory of Microbiology and Microbial Biotechnology (LAMBM) at Joseph KI-ZERBO University in Ouagadougou, Burkina Faso, where all microbiological analyses were performed.
Collection of samples
The samples used in this study were sourced from multiple local markets in Ouagadougou (Burkina Faso), with approximately 1 kg collected for each sample type (Figure 1A). The investigated substrates included banana, mango, orange, cashew apple, and Soumbala (Figure 1B). For each fruit type, as well as Soumbala, a single composite sample was prepared from healthy fruits randomly collected from 5-7 vendors across different markets in Ouagadougou, the capital of Burkina Faso. After collection, the samples were aseptically packed in sterile polyethylene bags and transferred to the laboratory. Fruits were stored at room temperature for 21 days, until visible signs of deterioration appeared, before being used to isolate cellulolytic bacteria. Soumbala, being a traditionally fermented product, was used directly after random collection from five vendors.
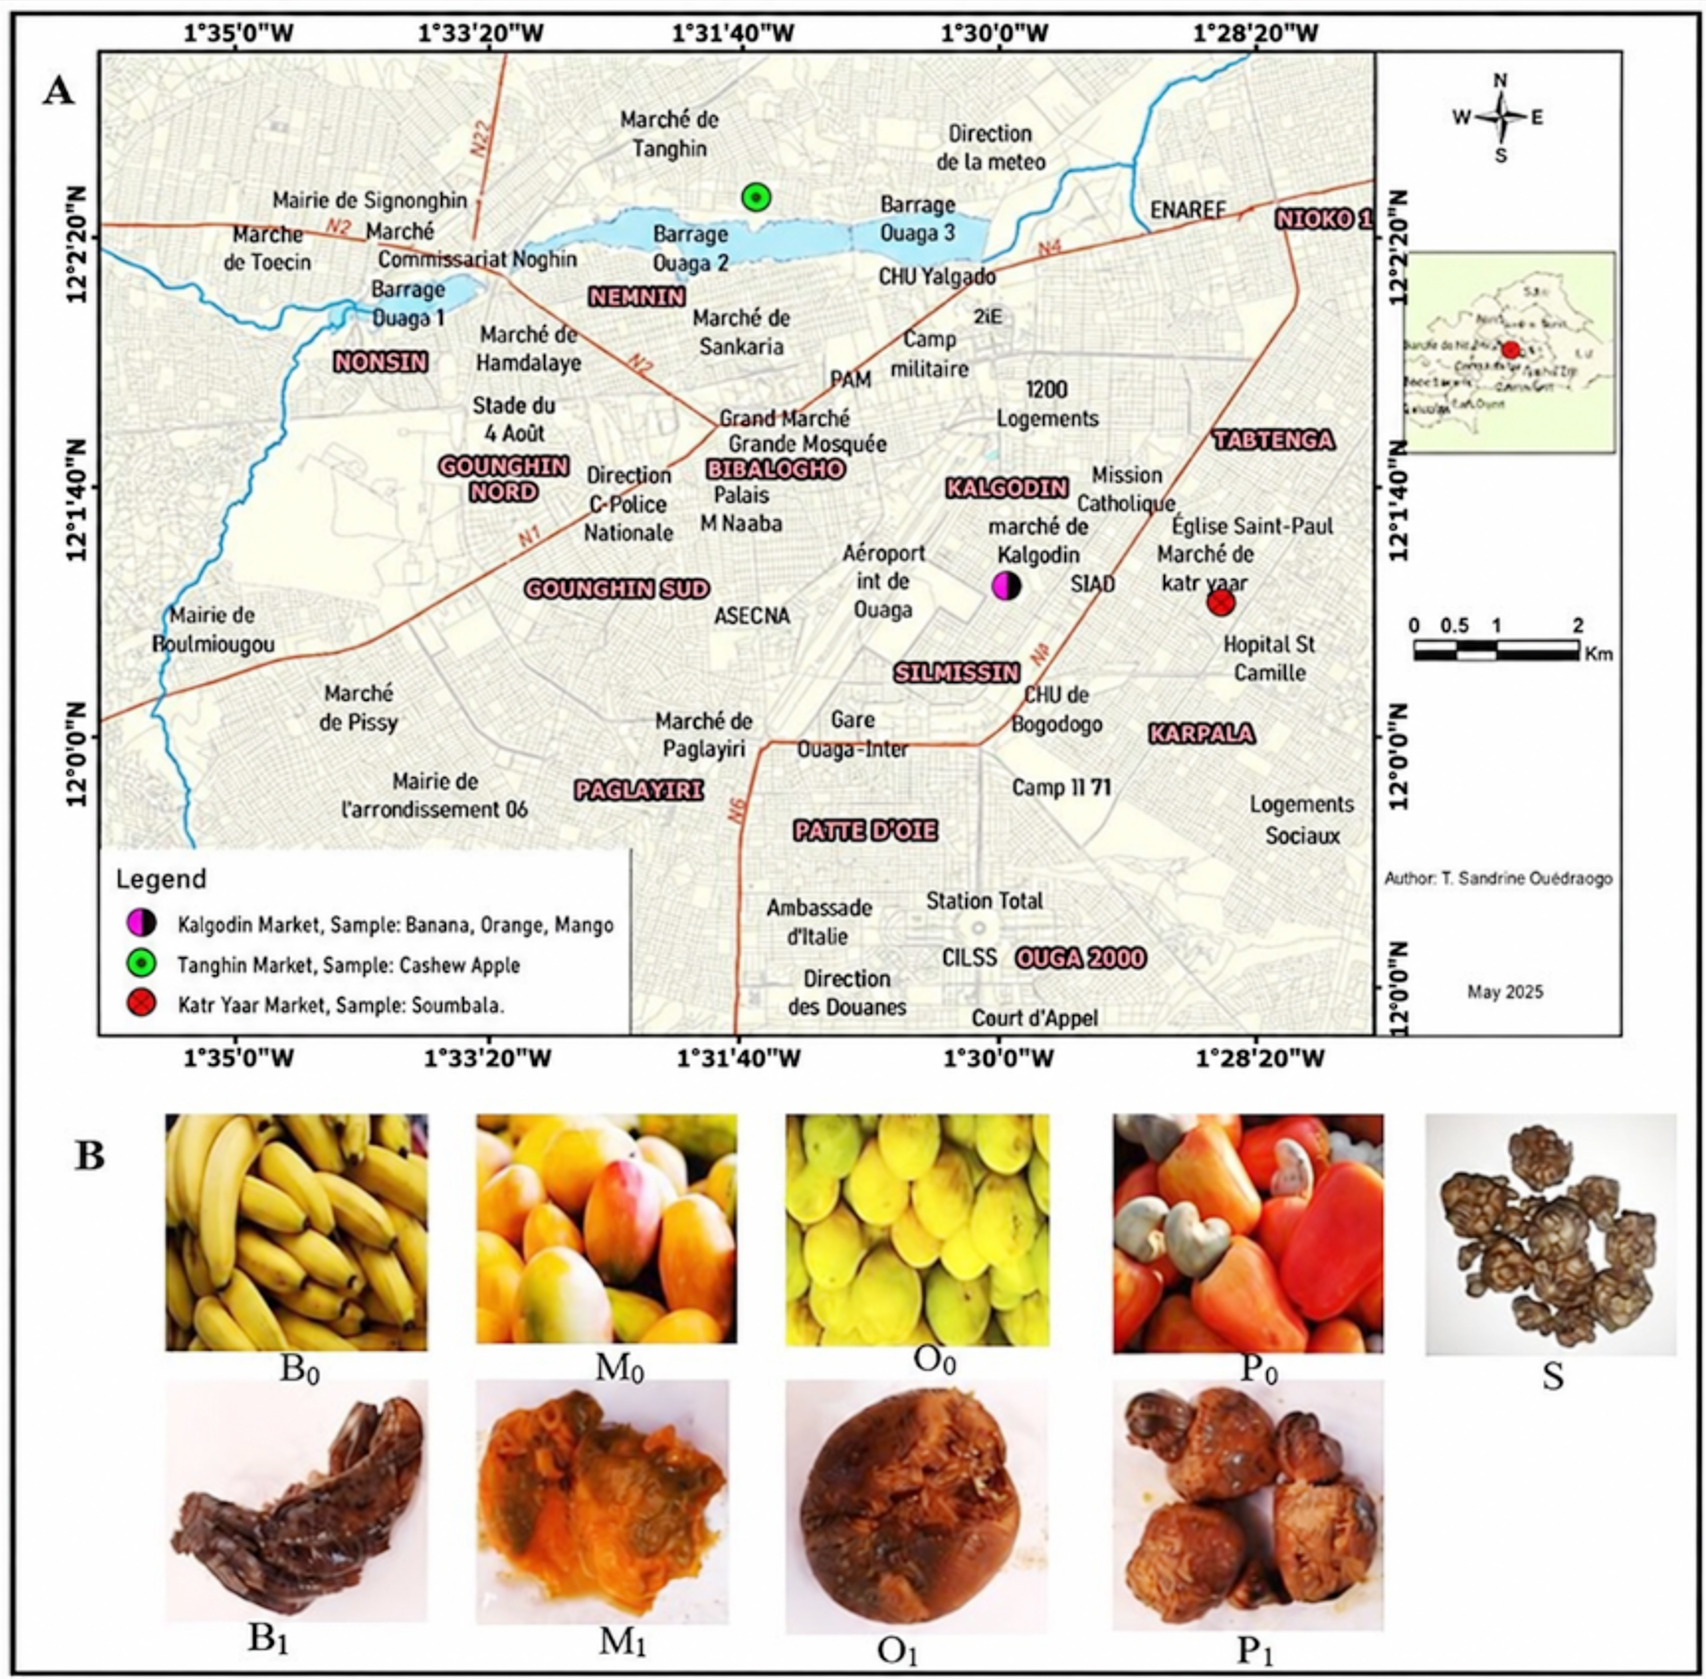
Figure 1. Localization of sampling site (A) and Samples (B) used for the isolation of cellulase-producing bacteria. B0: Fresh bananas, B1: Rotten bananas, M0: Fresh mangoes, M1: Rotten mangoes, O0: Fresh Oranges, O1: Rotten oranges, P0: Fresh Cashew apples, P1: Rotten cashew apples, S: Soumbala20
Isolation of bacteria and screening for cellulase-producing strains
Cellulolytic bacteria were isolated on reconstituted medium containing CMC as the sole carbon source, according to the method described by Kasana et al.28 For sample processing, 10 g of each decomposed fruit or Soumbala sample was aseptically transferred into 90 mL of sterile sodium chloride solution 0.9% (w/v) and subjected to thorough homogenization. Tenfold serial dilutions were then prepared, and 100 µL aliquots from each dilution were spread onto CMC agar plates. The plates were incubated at 37 °C for 96 hrs. Distinct colonies were selected and purified through repeated subculturing on CMC agar plates. Pure isolates were preserved at 4 °C in nutrient broth supplemented with 15% (v/v) glycerol for subsequent analyses. To detect cellulase activity, pure bacterial isolates were inoculated by spot deposition on the surface of CMC agar. After incubation at 37 °C for four days, Congo red solution (0.1% w/v) was poured over the plates for several minutes and subsequently washed with NaCl, 1 M, for 15-20 minutes to eliminate excess stain. Clear halo formation surrounding bacterial colonies revealed cellulose hydrolysis and, therefore, positive cellulolytic activity, according to the method described by Gautam et al.29 The diameters of the hydrolysis zones were measured using a vernier caliper, and the cellulolytic index (IC) was determined using the following equation:
Cellulolytic index = (Clear zone diameter -Bacterial colony diameter) / (Bacterial colony diameter)
The different cellulolytic activities are classified according to the value of the cellulolytic index : if the IC < 1: low activity, if 1 < IC <2, moderate activity, if the IC > 2, high activity
Phenotypic and biochemical characterization of isolates
Purified bacterial isolates were subjected to morphological, phenotypic, and biochemical analyses in order to achieve a preliminary classification. Morphological characterization involved macroscopic observation of colony features, including shape, color, surface appearance, and edge morphology. Microscopic examination was carried out on fresh preparations as well as after Gram staining, using a light microscope, following standard procedures.30 Biochemical profiling included catalase and oxidase activity assays conducted according to established protocols. In addition, the carbohydrate fermentation characteristics of the isolates were assessed using the API 20E identification system (bioMerieux, Marcy leֹtoile, France), following the manufacturer’s instructions. Preliminary identification was achieved by interpreting the biochemical profiles through a digital probabilistic approach, as described by Hudson et al.31
Assessment of haemolytic activity
The haemolytic properties of the bacterial isolates were examined using Columbia blood agar medium (OXOID Ltd., Wesel, Germany); pH 7.5 supplemented with 5% (v/v) defibrinated sterile sheep blood. Bacterial suspensions were inoculated by spot inoculation onto the surface of the agar, then incubated at 37 °C for 48 hrs.32 Haemolytic activity was determined according to the appearance of halos surrounding the colonies. The appearance of a clear zone indicated β-haemolysis, whereas a greenish discoloration corresponded to α-haemolysis. Isolates showing no visible halo were classified as γ-haemolytic (non-haemolytic), in accordance with previously described criteria.33 These non-haemolytic isolates were considered potentially safe and were therefore selected for subsequent analyses.
Molecular characterization of strains
Extraction and preparation of genomic DNA for sequencing
A cell culture of each isolate was obtained by streak plating on CMC agar medium and incubating under aerobic condition at 37 °C for 24 hrs. From a single colony per isolate, total genomic DNA was extracted using the heat shock technique, according to the method described by Dashti et al.34 The extracted DNA was then amplified by PCR, followed by Sanger sequencing according to the chain-termination methodology described by Sanger et al.35 This service was provided by Genoscreen, Lille, France. PCR amplification of the 16S rRNA gene was included in this service, targeting the region encoding the 30S subunit of the bacterial ribosome. The variable regions V1-V5 (Figure 2) were specifically targeted to discriminate between different bacterial populations by sequence alignment with a global reference database. This approach allows reliable molecular identification of isolates at the genetic level.
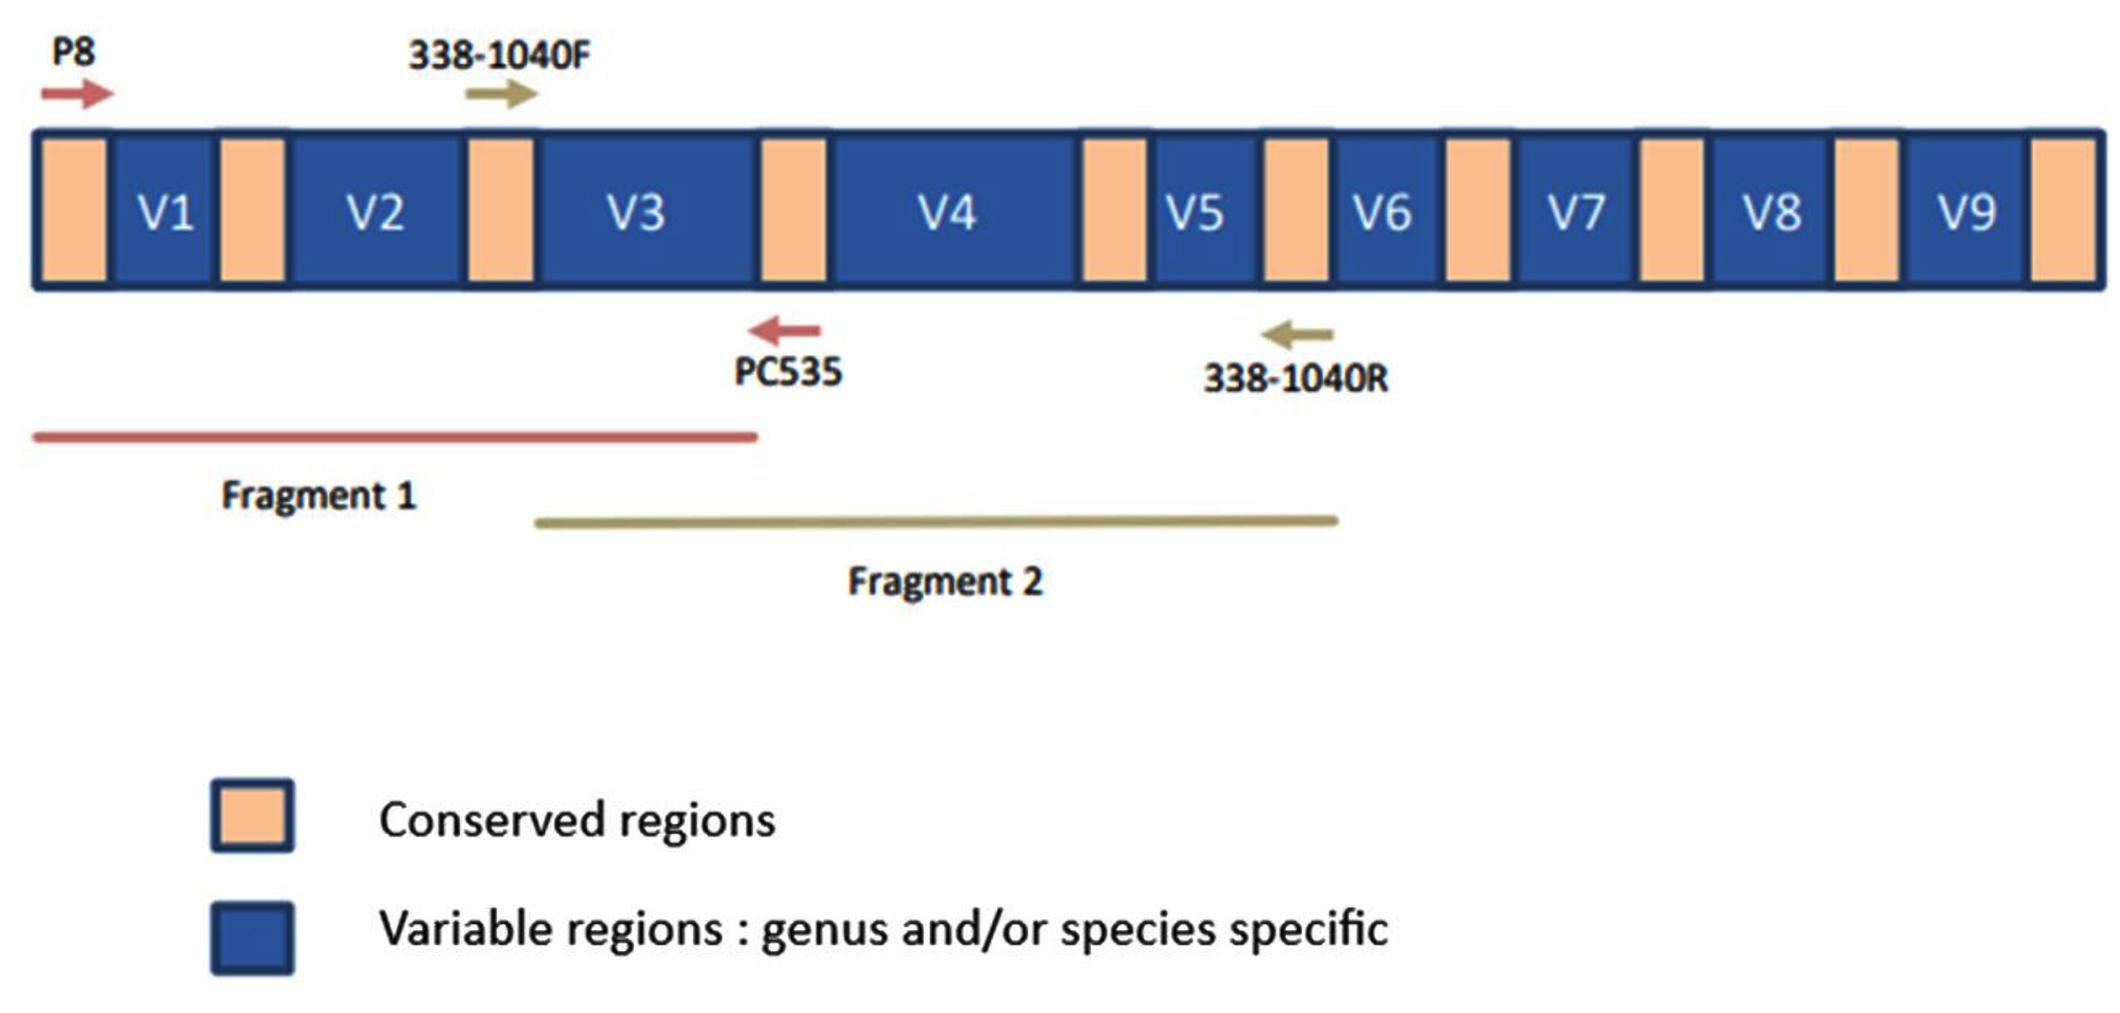
Figure 2. 16S rRNA gene sequence showing primer binding sites and amplified regions in fragments 1 and 2
PCR amplification of bacterial 16S rRNA genes
The amplification of 16S ribosomal RNA gene sequences was carried out for all bacterial isolates using two sets of universal primers targeting conserved regions of the bacterial genome. The primer pairs P8 (5′-AGAGTTTTGATCCTTGGCTCAG-3′)/P535 (5′-GTATTACCGCGGCTGCTGGCAC-3′) and 338 – 1040R (5′-GACACGAGCTGACGACA-3′) were employed, allowing the amplification of fragments of about 550 bp and 750 bp, respectively. Together, the oligonucleotide primers target highly conserved regions and enable the amplification of nearly the full-length 16S rRNA gene from the genomic DNA of each isolate. PCR reactions were prepared separately for each primer set in a final volume of 50 µL containing 0.3 mM of each deoxynucleotide triphosphate (dNTPs; Fermentas, Germany), 0.5 mM MgCl2, 0.5 pmol·µL-1 of each primer, 0.24 µL of DreamTaq™ DNA polymerase (1.25 U·µL-1), and 2 µL of genomic DNA template. The reaction volume was adjusted with sterile Milli-Q water. Each PCR run included both positive and negative controls to confirm the reliability of the reaction. PCR amplification was carried out in a thermal cycler under the following conditions: initial denaturation at 95 °C for 12 min, followed by 40 cycles of denaturation at 95 °C for 30 sec, primer annealing at 58 °C for 30 sec, and extension at 72 °C for 10 min. A final extension was performed at 72 °C for 10 min. The amplified products were subsequently maintained at 4 °C until further analysis. The success of PCR amplification was initially verified by electrophoretic separation with 10 µL of each PCR product on a agarose gel, 1.5% (w/v), prepared in 1x TBE buffer and run at 100 V for 1 hrs. Amplicon sizes were estimated using a 50-1500 bp DNA ladder (QIAGEN). The amplified PCR products were purified with the GFXTM PCR DNA purification and Gel Band Kit following the manufacturer’s protocol. The efficiency of the amplification and the quality of the fragments were confirmed by loading 1 µL of each purified PCR product onto a QIAxcel capillary electrophoresis system (QIAGEN) using the rapid DNA analysis parameters. The purified and validated PCR products were then sequenced.
Sequencing of the 16S rRNA gene
Following membrane-based PCR product purification amplicons using a commercial kit (Macherey-Nagel), purified products were assessed for quality and quantity via a fluorescence-based assay with SYBR Green dye. Bidirectional sequencing was subsequently performed using the same primers employed for PCR amplification, in accordance with an optimized sequencing protocol. Sequencing reaction products were purified via Sephadex G-50 columns, followed by analysis using an ABI 3730XL capillary DNA sequencer.
Bioinformatics data analysis and processing
Sequencing chromatograms were first analyzed and optimized with Auto Peak Trace 6 RP software. High-quality sequences were then assembled into consensus contigs with Sequencher version 4.9 (Gene Codes Corporation). The 16S rRNA sequences obtained were analyzed by comparison with NCBI GenBank reference sequences via the BLASTn tool.36 Additional taxonomic validation was conducted using the EZBioCloud database which is specialized in bacterial 16S rRNA gene sequences,37 to accurately determine the phylogenetic assignment of the isolates. The sequences obtained were carefully checked and edited in BioEdit version 7.2, followed by alignment in MEGA X with the muscle algorithm.38
Cellulase production: Modeling and optimization
Given its cellulolytic index and lack of haemolytic activity, isolate B17C, identified as Paenibacillus dendritiformis PQ845045, isolated from rotting banana, was used to optimize cellulase production.
Optimization of cellulase production through one factor on time
The effect of different carbon and nitrogen sources, as well as pH, on cellulase production was evaluated in a liquid culture medium containing MgSO4, K2HPO4, KH2PO4, and NaCl as basic mineral constituents. This enabled us to determine the preferred carbon and nitrogen sources and the pH conditions for optimal performance. The different media were prepared in 250 mL Erlenmeyer flasks, each containing 100 mL of culture broth, to promote bacterial growth and cellulase production, as described by Bhati et al.17
Effect of various carbon sources
To the basal medium, individual carbon sources, namely glucose, sucrose, carboxymethylcellulose (CMC), or arabinose, were added separately at concentrations of 5.00, 15.00, and 25.00 g/L. As described previously, yeast extract was employed as the nitrogen source.39,40 The pH of the medium was adjusted to 7 before sterilization. Each flask was inoculated with 5% (v/v) of a bacterial suspension standardized to an optical density of 0.6 at 600 nm and then incubated at 37 ± 2 °C for 72 hours under continuous agitation at 200 RPM (revolutions per minute). At the end of the incubation period, cellulase activity was measured, and the carbon source yielding the highest enzymatic activity was selected for subsequent experiments.
Effect of various nitrogen sources
To identify the most suitable nitrogen source for cellulase production, an experimental design similar to that described above was employed. Various nitrogen source, namely yeast extract, peptone and ammonium sulfate ((NH4)2SO4), were individually incorporated into the basal medium at concentrations of 2.00, 3.00, and 5.00 g/L. In this assay, CMC was used as the sole carbon source, and the medium was buffered at pH 7, following previously established protocols.41 Cultures were incubated under shaking conditions for three days, after which cellulase activity was evaluated.
Effect of pH
The effect of pH on cellulase production was determined by culturing the bacterial strains in media adjusted to different pH values using appropriate buffer systems. Citrate–phosphate buffers were used to adjust the medium to pH 2-6, phosphate buffer to pH 7 and Tris-HCl buffer to pH 8-9. The culture media were prepared using the previously optimized sources of carbon and nitrogen, along with the basal components MgSO4 and NaCl. The cultures were maintained at 37 °C for 72 hrs under continuous agitation. Following incubation, all culture broths were centrifuged at 6,000 RPM for 30 min at 4 °C. Cell-free supernatants, containing extracellular enzymes, were harvested and used to assess cellulase activity.
Table 1. Coded levels and actual values of independent variables
Independent variables |
Symbol code |
-α |
Low level (-1) |
Level (0) |
High level (+1) |
+α |
|---|---|---|---|---|---|---|
CMC (g/L) |
X1 |
15 |
20 |
25 |
30 |
35 |
Yeast extract (g/L) |
X2 |
1 |
2 |
3 |
4 |
5 |
Temperature (°C) |
X3 |
17.5 |
25 |
32.50 |
40 |
47.5 |
NaCl (g/L) |
X4 |
2.5 |
5 |
7.5 |
10 |
12.5 |
CMC: Carboxymethylcellulose
Optimizing culture conditions using an experimental design approach
Based on single-factor experiments, carboxymethylcellulose and yeast extract were chosen as the most suitable carbon and nitrogen sources, respectively. A central composite experimental design with four independent variables—carboxymethylcellulose (X1), yeast extract (X2), temperature (X3), and sodium chloride (X4) was used to evaluate the combined effects of these variables on bacterial cellulase production. Each variable was associated with five distinct levels (Table 1) for optimization.42 The design was developed using a factorial approach with 30 experiments. Each experiment was conducted in triplicate, and the mean values were used for data analysis. Response surface methodology was employed to evaluate interactions among independent variables and identify optimal conditions for cellulase production using a minimal number of experiments. The results were fitted to a second order polynomial model, yielding regression coefficients.
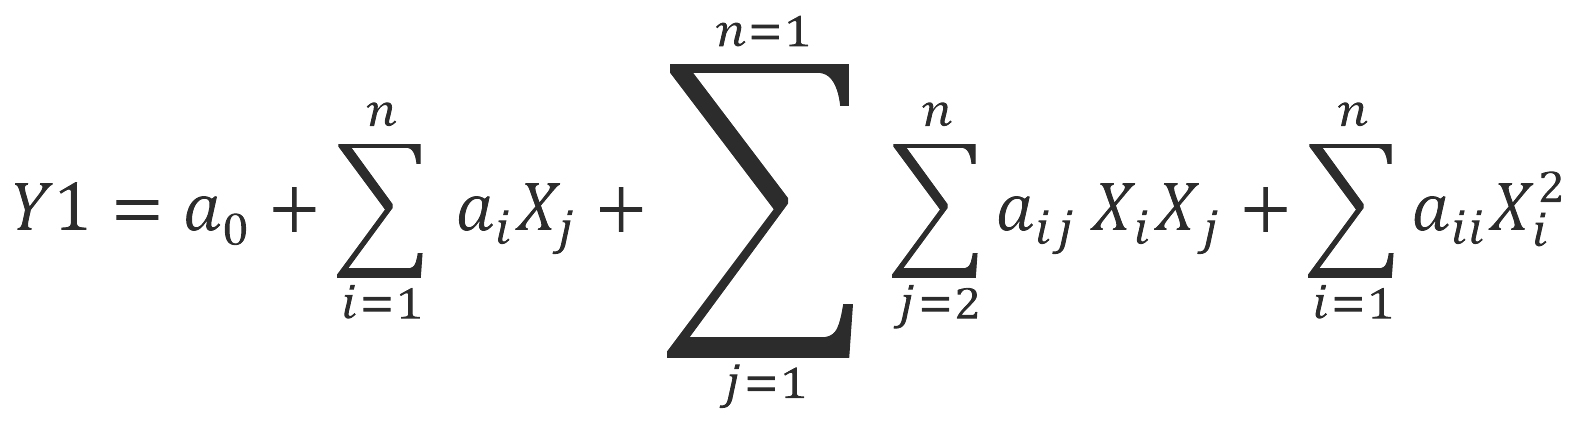 Y1 represents the response variable, Xi and Xj denote the independent variable and the total number of variables tested was 4. The coefficient a0 corresponds to the model constant, while ai, aii and aij represent the coefficients associated with the linear, quadratic, and interaction effects, respectively. The significance of the model and its goodness of fit were evaluated by an analysis of variance (ANOVA). Statistical analyses, three-dimensional response surface representations, and contour lines were generated using Design-Expert software, version 7.0.
The cellulase activity values obtained from 30 experiments were used in the equation, and predicted values were calculated.43
Cellulase activity determination
Following each culture performed as part of the single-factor and multi-factor optimization trials, the culture media were centrifuged at 6,000 RPM for 30 min at 4 °C. The various supernatants were then collected and used as crude enzyme extracts containing the extracellular cellulases of isolate B17C, identified as Paenibacillus dendritiformis PQ845045.
Cellulolytic activity was determined by colorimetry using carboxymethylcellulose (CMC) as the substrate. The reaction mixture contained 1 mL of enzyme solution (diluted or undiluted) and 1 mL of 1% (w/v) CMC prepared in 50 mM citrate phosphate buffer (pH 5). The mixture was incubated at 45 °C for 30 min. Following incubation, 3 mL of 3,5-dinitrosalicylic acid (DNS) reagent was added, and the mixture was heated in a boiling water bath at 100 °C for 10 min. After cooling, the amount of reducing sugars released was measured at 540 nm. Glucose concentration was determined using a Biotek Instruments Inc. Epoch TM spectrophotometer (Highland Park, Winooski, VT 05404-0998, USA). Carboxycellulotytic activity was expressed as the amount of enzyme required to release 1 µmol of glucose per mL per minute under standard assay conditions.44
Statistical analysis
Statistical analyses were performed using XLSTAT software (version 2016.02.27444). One way analysis of variance (ANOVA) was applied to evaluate differences among the studied parameters, with statistical significance defined at P < 0.05. When significant effects were observed, mean values were compared using the Newman-Keuls post hoc test. Data obtained from the central composite design were further analyzed using RSM.
All experimental assays were performed in triplicate. Each isolate was cultured independently in three Petri dishes to determine the cellulolytic index, while isolate B17C, identified as Paenibacillus dendritiformis, was cultured in three separate tubes in liquid medium for each experimental assay. A measurement was taken for each independent culture, and the results are expressed as mean ± standard deviation. Comprehensive data analysis, including ANOVA, regression modelling, response surface analysis, and optimization of experimental conditions, was conducted using Design Expert software (version 7.0.0)
Isolation of cellulolytic bacteria from fruit and soumbala samples
From samples of decaying fruit (banana, mango, and orange) and soumbala seeds, 115 bacterial colonies were initially isolated on a reconstituted medium containing carboxymethylcellulose (CMC) as the sole source of carbon and energy (Table 2 and Figure 3A). Initial colony selection was based on morphological characteristics. After three successive subcultures on the same medium to obtain pure cultures, 42 bacterial isolates exhibiting distinct morphotypes were selected. Of these isolates, 18 originated from banana samples, 13 from mango, 6 from orange, and 5 from soumbala (Table 2). However, no strain was obtained from the cashew apple samples. After Congo red staining, 19 of them, or approximately 45.23%, exhibited clear hydrolysis zones around their colony, indicating their ability to degrade cellulose (Table 2 and Figure 3B). This proportion suggests that decomposing fruit is a valuable source of cellulase-producing bacteria. Their presence could be explained by the high cellulose content of these matrices, which may favor the selection of microorganisms capable of using them as a carbon source. This rate of cellulolytic isolates is comparable to those observed in other environments rich in decomposing organic matter, where cellulase-producing bacteria are often found.24,45
Table 2. Cellulolytic index, hemolytic property, and morphological characteristics of isolated cellulolytic bacteria
| Isolated strains | Bacterial colonies with clear areas | Colony diameter (mm) | Diameter of cellulolytic zone (mm) | Cellulolytic index | Haemolytic property | Shape | Grouping mode | Color | Size |
|---|---|---|---|---|---|---|---|---|---|
| B1C to B45C | B6C | 3.333 ± 0.47b | 4.667 ± 0.47f | 0.444 ± 0.31b | β-haemolysis | Stick | Isolated | White | Small |
| B10C | 4.000 ± 0.00ab | 5.333 ± 0.47ef | 0.333 ± 0.11b | β-haemolysis | Circular | Chain | White | Small | |
| B14C | 4.000 ± 0.00ab | 5.667 ± 0.94def | 0.416 ± 0.23b | β-haemolysis | Stick | Isolated | White | Small | |
| B15C | 3.333 ± 0.47b | 5.000 ± 0.00ef | 0.527 ± 0.19b | β-haemolysis | Stick | Chain | Yellowish | Small | |
| B17C | 4.333 ± 0.47ab | 14.333 ± 0.47a | 2.333 ± 0.23a | γ-haemolysis | Circular | Chain | White | Medium | |
| B18C | 6.000 ± 2.16ab | 9.333 ± 1.89bcde | 0.644 ± 0.27b | β-haemolysis | Oval | Isolated | White | Medium | |
| B25C | 7.333 ± 2.05ab | 10.000 ± 1.63abcd | 0.409 ± 0.16b | β-haemolysis | Stick | Isolated | White | Large | |
| B31C | 7.667 ± 0.94ab | 10.667 ± 0.94abc | 0.397 ± 0.04b | γ-haemolysis | Stick | Isolated | White | Large | |
| B42C | 4.667 ± 1.25ab | 13.667 ± 0.94ab | 2.144 ± 0.84a | γ-haemolysis | Stick | Isolated | White | Medium | |
| M1C to M30C | M10C | 6.333 ± 0.94ab | 9.333 ± 1.70bcde | 0.467 ± 0.07b | β-haemolysis | Circular | Chain | White | Medium |
| M18C | 7.667 ± 0.94ab | 11.000 ± 1.41abc | 0.434 ± 0.01b | β-haemolysis | Circular | Chain | White | Large | |
| M19C | 7.333 ± 0.47ab | 10.000 ± 0.00abcd | 0.369 ± 0.08b | β-haemolysis | Stick | Isolated | White | Large | |
| M20C | 7.833 ± 0.62 a | 10.000 ± 0.00abcd | 0.285 ± 0.10b | γ-haemolysis | Oval | Isolated | Yellowish | Large | |
| M27C | 6.667 ± 0.62ab | 10.000 ± 0.00abcd | 0.513 ± 0.13b | γ-haemolysis | Stick | Chain | White | Medium | |
| O1C to O25C | O1C | 5.500 ± 1.87abcd | 8.000 ± 2.16abc | 0.500 ±0.13ab | β-haemolysis | Stick | Isolated | White | Medium |
| O7C | 5.667 ± 1.89abcd | 8.000 ± 2.16abc | 0.460 ± 0.15ab | β-haemolysis | Ovale | Isolated | White | Medium | |
| S1C to S15C | S4C | 3.667 ± 1.43abcd | 5.667 ± 0.94bc | 0.734 ± 0.54ab | γ-haemolysis | Stick | Isolated | White | Small |
| S10C | 6.833 ± 0.84abc | 12.333 ± 1.25a | 0.810 ± 0.04ab | β-haemolysis | Circular | Isolated | White | Medium | |
| S12C | 3.667 ± 0.94abcd | 5.667 ± 0.94bc | 0.577 ± 0.12ab | γ-haemolysis | Stick | Chain | White | Small | |
| Pr > F | 0.000 | 0.000 | 0.015 | – | – | – | – | – | |
| Significatif | Yes | Yes | Yes | – | – | – | – | – |
Legend: B = Bananas; M = Mangoes; O = Oranges; S = Soumbala.
Values on the same line with different lowercase letters in superscript are significantly different at P < 0.05
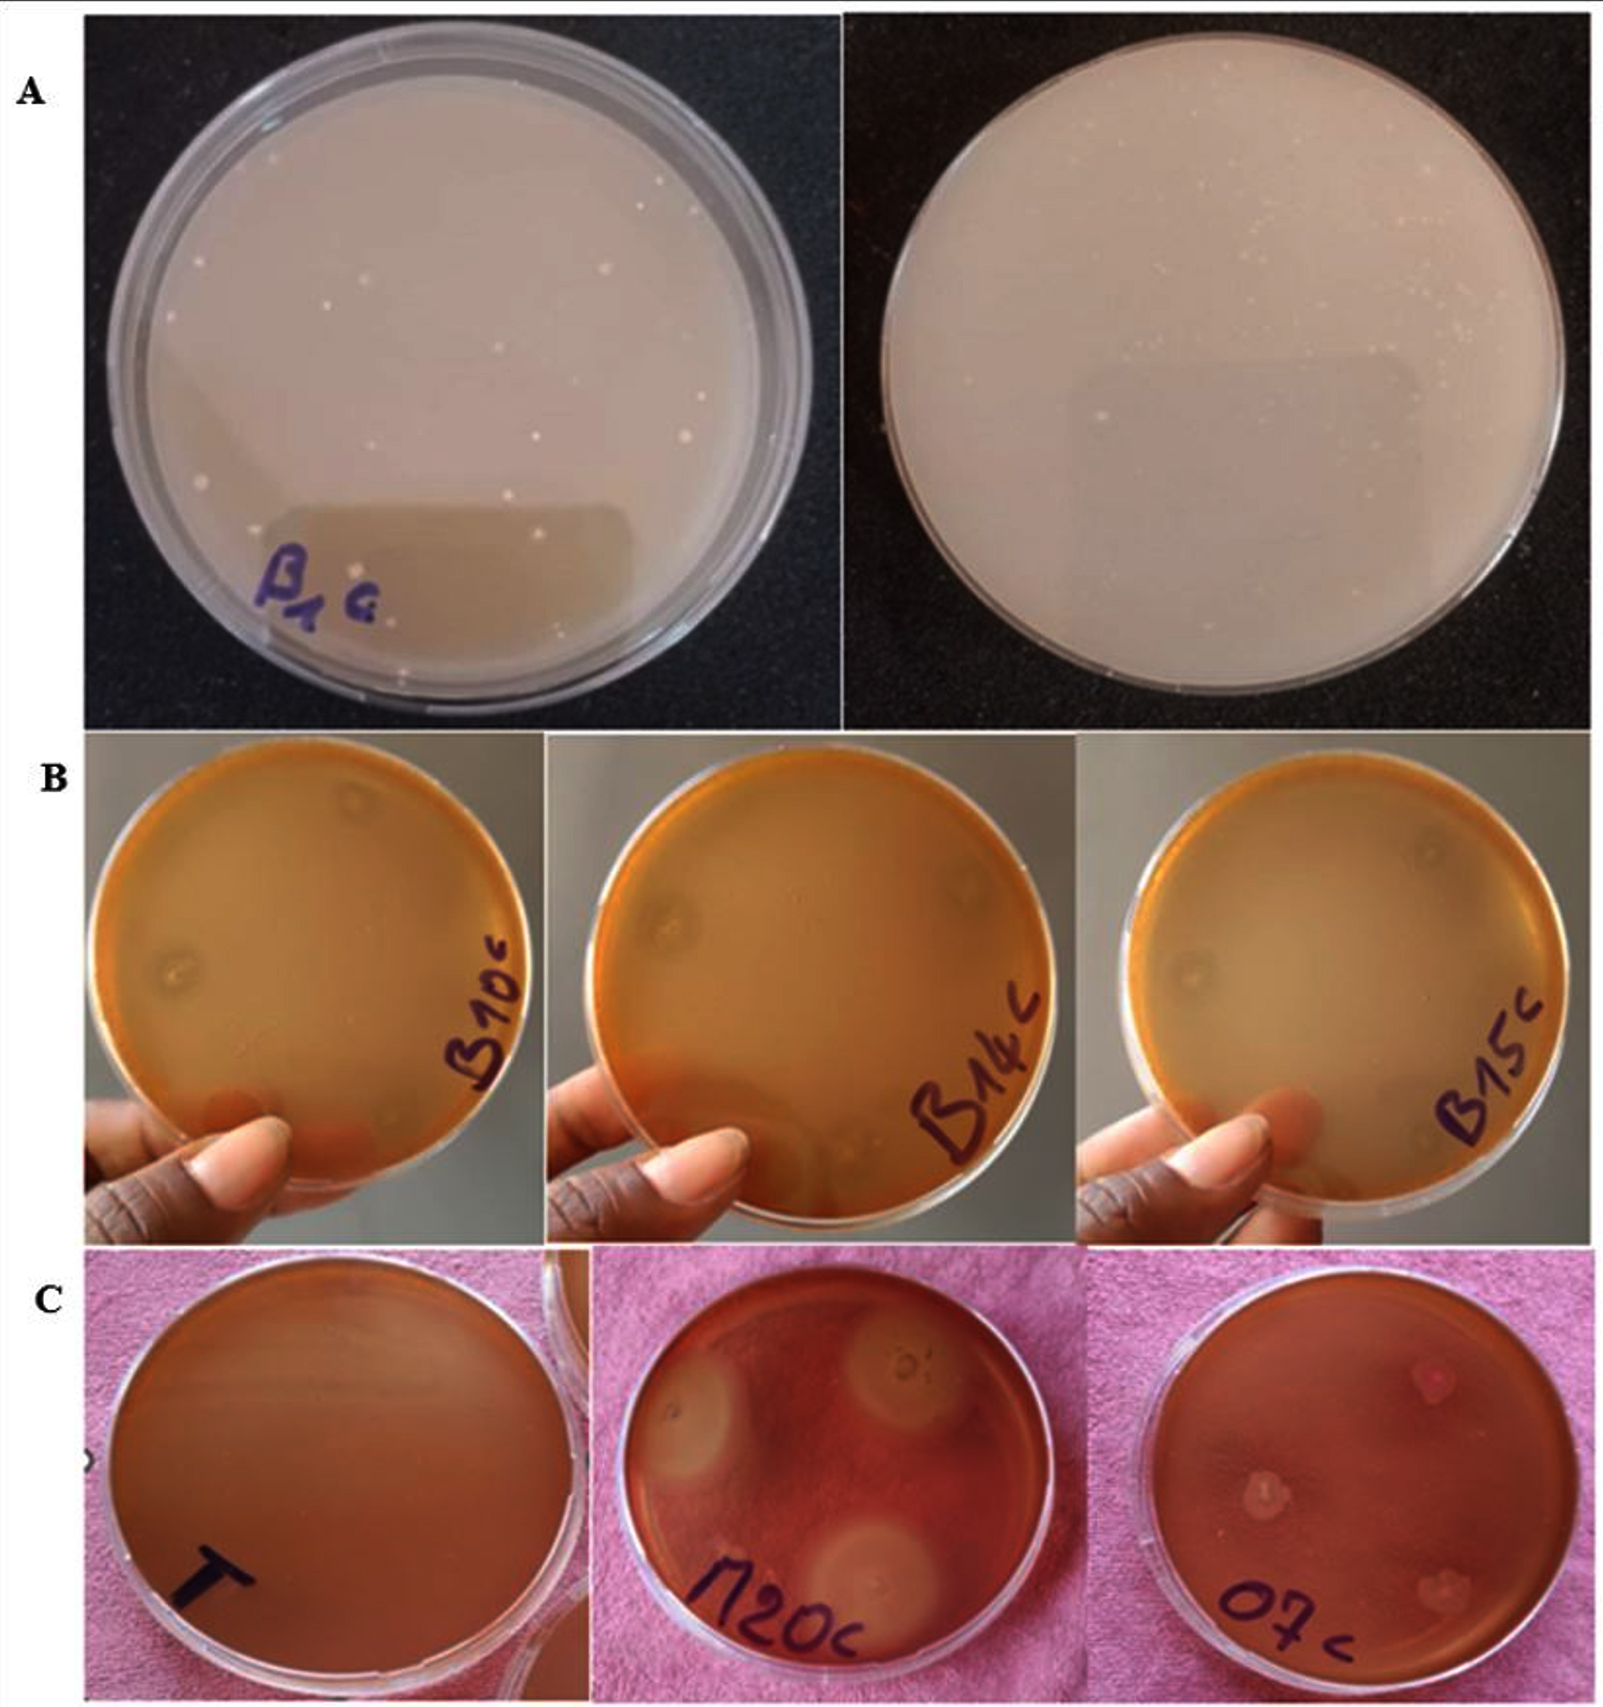
Figure 3. Macroscopic aspects of cellulase-producing bacterial colonies. (A) on reconstituted medium (agar, carboxymethylcellulose, yeast extract, MgSO4⋅7H2O, K2HPO4, NaCl); (B) on reconstituted medium, then flooded with Congo red; (C) on columbia agar containing 5% sheep blood. Legend: T = negative control, M20C = Example of a γ-haemolysis strain, O7C = example of a β-haemolysis strain
Screening of cellulase-producing bacterial isolates
A total of 19 isolates with positive cellulolytic activity were selected for further enzymatic characterization. The results in Table 2 reveal significant variations among these strains in terms of hydrolysis zone diameter, colony size and cellulolytic index (Table 2). These variations observed between strains reflect a heterogeneity in their growth capacity and their ability to degrade cellulose. Strains B17C, B42C, and S10C exhibited the best hydrolysis zone diameters with values of 14.33 mm, 13.66 mm and 12.33 mm, respectively . The maximum diameter of the cellulose degradation zone observed in this study (14.33 mm) is slightly smaller than that previously reported which is 14.5 mm.46 Conversely, the lowest cellulolytic zone diameter (4.66 mm) was recorded for strain B6C, followed by B10C (5.33 mm). Regarding colony size, the largest value (7.83 mm) was obtained with strain M20C, followed by strains B31C (7.66 mm) and M18C (7.66 mm). In contrast, the smallest colony size (3.33 mm) was obtained with B6C and B15C, followed by B10C and B14C (4.00 mm). These values remain higher than those previously described, which range from 1.20 mm to 2.35 mm.18 The cellulolytic index (ICs) varied between 0.28 and 2.30, and strain B17C presented the best index which was 2.30. The lowest cellulolytic index (0.28) was obtained with M20C. However, these indices remain significantly lower than those reported in other studies, in which indices up to 8 have been observed for some bacterial strains.45 Similarly, the cellulolytic activity measured in this study appears, overall, to be lower than that described in other comparable investigations.18,46 The statistically significant variability (P £ 0.05) between the ICs of the strains tested confirms the interest of targeted screening to select the most efficient strains, particularly for industrial applications such as juice clarification, the valorization of agriculture biomass or pilot scale enzyme production.
Morphological characteristics of cellulase-producing isolates
The morphological characteristics of the 19 cellulolytic bacterial isolates (Table 2) reveal that, among all the strains identified, 17 exhibited whitish pigmentation and 2 displayed yellowish coloration, indicating relative chromatic homogeneity among the isolates. Regarding cell morphology, microscopic observations revealed that 5 isolates were circular, 11 bacillus-shaped, and 3 ovals. Colony size also revealed significant variability. Thus, 8 were medium-sized, 5 large, and 6 small. These observations are consistent with previously reported results, which describe a similar morphological diversity in terms of shape, color, and size of bacterial colonies isolated from rich organic substrates.18 Indeed, the prevalence of bacillary forms (11 isolates) has been reported by many authors, who indicate that rod-shaped bacteria are dominant among cellulolytic microorganisms because of their ability to efficiently secrete extracellular enzymes.47,48 Circular (coccoid) and oval shapes, although less frequent, demonstrate taxonomic diversity that may reflect variation in cellulase production or regulation mechanisms.17 Colony size, on the other hand, provides indirect evidence of strain growth rate and vitality. Isolates from Large colonies could reflect fast-growing bacteria, often adapted to environments rich in carbon substrates. Conversely, small colonies may correspond to slower-growing strains, but whose specific enzymatic activity could be higher, as observed in some cases.49
Biochemical characteristics and presumptive identification of isolates
The results of the biochemical analyses of the 19 cellulolytic isolates (Table 3) revealed a common profile, characterized by Gram-positive staining and a positive catalase reaction. This phenotypic profile indicates that these isolates possess an enzymatic system enabling them to degrade hydrogen peroxide and constitutes a starting point for their taxonomic classification.
Table 3. Biochemical tests of bacterial isolates and molecular identification of isolated strains based on 16S rRNA sequences similarity with EZBioCloud database sequences
| Tests performed | Isolated cellulolytic bacteria | ||||||||||||||||||
|---|---|---|---|---|---|---|---|---|---|---|---|---|---|---|---|---|---|---|---|
| B6c | B10c | B14c | B15c | B17c | B18c | B25c | B31c | B42c | M10c | M18c | M19c | M20c | M27c | O1c | O7c | S4c | S10c | S12c | |
| Gram staining | + | + | + | + | + | + | + | + | + | + | + | + | + | + | + | + | + | + | + |
| Mobility test | + | – | – | – | – | + | + | – | + | – | + | + | + | – | + | – | – | – | – |
| ONPG | – | – | – | – | – | + | – | + | + | + | + | + | + | + | – | – | + | + | + |
| ADH | – | + | – | – | – | – | – | + | – | – | – | + | – | – | – | – | – | – | – |
| LDC | – | – | – | – | – | – | – | – | – | – | – | – | – | – | – | – | – | – | – |
| ODC | – | – | – | – | – | – | – | – | – | – | – | – | – | – | – | – | – | – | – |
| Citrate | + | – | – | – | – | + | + | – | – | + | – | + | – | – | + | + | – | + | + |
| H2S | – | – | – | – | – | + | – | – | – | – | – | + | – | + | + | – | – | – | – |
| Ureate | – | – | – | – | – | – | – | – | – | – | – | – | – | – | – | – | – | – | – |
| TDA | + | + | + | + | + | + | + | + | + | + | + | + | + | + | + | + | + | + | – |
| Indole | – | + | – | – | – | – | – | – | – | – | – | – | – | + | – | – | – | – | + |
| V-P | – | + | + | + | + | + | – | – | + | + | + | – | + | – | + | + | + | + | + |
| Gelatinase | – | + | + | + | + | – | – | + | + | – | + | + | – | + | – | – | + | + | + |
| Glucose | – | + | + | + | + | + | – | + | + | + | + | – | – | – | – | – | + | + | + |
| Mannitol | – | + | + | + | + | + | – | + | + | – | + | – | + | – | – | – | + | + | + |
| Inositol | – | + | + | + | + | + | – | – | + | – | + | – | + | + | – | – | + | + | + |
| Sorbitol | – | + | + | + | + | + | – | – | – | – | + | – | – | – | + | – | + | + | + |
| Rhamnose | – | – | + | – | – | – | – | – | – | – | + | – | + | – | – | – | + | + | – |
| Saccharose | – | + | + | + | + | + | – | + | + | + | + | + | + | – | – | – | + | + | – |
| Melibiose | – | – | + | – | + | – | – | – | + | – | – | – | + | + | – | – | + | – | – |
| Amygdaline | – | + | + | + | + | + | – | + | + | + | + | + | + | + | – | – | + | + | + |
| Arabinose | – | – | + | + | + | – | – | + | + | + | + | – | + | + | – | – | + | – | – |
| Catalase | + | + | + | + | + | + | + | + | + | + | + | + | + | + | + | + | + | + | + |
| Identified species | |||||||||||||||||||
| Strain | Identified species | Top-hit strain | Similarity (%) | Number base pairs (pb) | GenBank accession number of deposited sequences | ||||||||||||||
| B17C | Paenibacillus dendritiformis | AY359885 | 100 | 1471 | PQ 845045 | ||||||||||||||
| B31C | Bacillus altitudinis | ASJC01000029 | 99.90 | 1934 | PQ 845085 | ||||||||||||||
| B42C | Bacillus altitudinis | ASJC01000029 | 100 | 1943 | PQ 845089 | ||||||||||||||
| S10C | Mammaliicoccus lentus | D83370 | 100 | 1943 | PQ 845126 | ||||||||||||||
where, ONPG = Ortho Nitro Phenyl Galactopyranoside, ADH = Arginine dihydrolase, LDC = Lysine decarboxylase, ODC = Ornithine decarboxylase, TDA = Tryptophan deaminase; H2S = Hydrogen sulfide, V-P = Vogue-Proskauer.
Furthermore, all isolates were negative for lysine decarboxylase (LDC), ornithine decarboxylase (ODC), and urease, indicating the absence of lysine and ornithine decarboxylation activity and urea hydrolysis. In contrast, 18 of the 19 isolates were positive in the tryptophan dehydration test. This high frequency indicates that the ability to deaminate tryptophan is a metabolic trait widely shared among the cellulolytic isolates studied. Beyond these common characteristics, some biochemical tests revealed differences between the isolates. Twelve isolates fermented glucose, while seven did not, reflecting the physiological diversity of the strains studied. Furthermore, ten isolates showed a positive result and nine a negative result in the arabinose fermentation test; thirteen isolates showed a positive result and six a negative result in the sucrose fermentation test. These differences in sugar utilization reflect metabolic heterogeneity and constitute useful criteria for their biochemical differentiation, suggesting physiological diversity that may influence cellulase production. The ability to ferment glucose observed in most isolates could indicate efficient exploitation of simple carbon sources derived from cellulose degradation. Differences in motility were also observed: eight isolates were motile and eleven were non-motile. The motility observed in eight isolates reflects the ability of some strains to actively explore their environment, which can be advantageous on heterogeneous substrates such as decaying fruit. Conversely, the eleven non-motile isolates could belong to spore-forming species or species with slower metabolism. Based on all the observed morphological, physiological, and biochemical characteristics, a probabilistic numerical method was used to establish the presumptive identification of the 19 isolates. Comparison of their profiles with reference taxonomic characters allowed all the isolates to be assigned to the genus Bacillus, with varying degrees of similarity. To refine the taxonomic identity of the selected isolates, molecular identification and evaluation of their hemolytic activity were performed.
Evaluation of haemolytic activity
Although all 19 isolates exhibited cellulolytic activity, assessing their safety is a crucial step before any biotechnological application, particularly in the food industry. Indeed, some strains may also possess virulence factors. Haemolytic activity was studied as a preliminary phenotypic indicator of the isolates’ ability to lyse erythrocytes and to assess their potential safety. The presence of partial (α-haemolysis) or complete (β-haemolysis) on blood agar suggests the possible production of toxic factors, particularly phospholipases, that are involved in cell membrane lysis. β-haemolysis reflects high enzymatic activity, which can compromise the strain’s safe use in the agro-industry, particularly by depleting haemoglobin, a source of iron.50,51 In this study, the evaluation of the haemolytic activity of the isolates showed that out of the 19 isolates identified, 12 exhibited β-haemolytic activity, characterized by a clear zone around the colonies, indicating complete lysis of erythrocytes, while the other seven were γ-haemolytic showing no haemolytic activity (absence of halo), indicating that they do not read blood cells (Table 2 and Figure 3C). The high proportion of β-haemolytic isolates indicates that several cellulolytic strains can also lyse erythrocytes, a characteristic that may be associated with the production of virulence factors. Previous studies have also reported a high frequency of hemolytic activity among bacterial isolates exhibiting cellulolytic activity.52 Conversely, the absence of hemolysis observed in the seven γ-haemolytic isolates constitutes a favorable phenotypic trait for potential biotechnological applications, particularly in the food sector. However, the absence of haemolytic activity alone is insufficient to demonstrate a strain’s safety; further analyses are necessary before considering food applications.
Molecular characterization of isolates
To confirm and refine the presumptive identification obtained by phenotypic and biochemical methods, the selected isolates were subjected to molecular identification based on PCR amplification and sequencing of the 16S rRNA gene.
In the present study, the 16S rRNA gene of strains B17c, B31c, B42c, and S10c was sequenced. Comparison of the obtained sequences with those available in the EZBioCloud and NCBI databases revealed similarity levels ranging from 99.81%-100% with the corresponding type species (Table 3). Isolate B17C has a maximum identity of 100% with Paenibacillus dendritiformis (MT256092.1). As for isolates B31C and B42C, they have a maximum identity of 99.90% and 100%, respectively, with Bacillus altitudinis (PP818882.1). Isolate S10C, a β-hemolytic strain, has a similarity of 99.81% with Mammaliicoccus lentus (MK439492.1). The phylogenetic history of the isolates was reconstructed using the Neighbor-Joining method,53 which is known for its speed and ability to produce reliable trees from large distance matrices. The optimal phylogenetic tree obtained has a sum of branch lengths equal to 144.28, reflecting the genetic divergence between the different sequences analyzed. Evolutionary distances, expressed as the number of base substitutions per site, were estimated using the composite maximum likelihood method. The analysis included 39 nucleotide sequences, after removing ambiguous positions using the pairwise deletion method. Phylogenetic analysis revealed that several isolates exhibited a close evolutionary relationship to known species. Strain B17C (PQ845045) was phylogenetically related to Paenibacillus dendritiformis, B31C (PQ845085) to Bacillus altitudinis, B42C (PQ845089) to Bacillus altitudinis and S10C (PQ845126) to Mammaliicoccus lentus (Figure 4).
Our results are consistent with those of other studies that have highlighted the taxonomic diversity of cellulolytic bacteria. Cellulolytic strains belonging to the genus Bacillus, Priestia, and Lysinibacillus have notably been identified by 16S rRNA gene sequencing in the rumen of the sheep Ovis aries.47 Similarly, cellulase-producing bacterial species, such as Bacillus megaterium and Paracoccus yeei, have been described in the gut flora of termites.46 These observations show that cellulolytic activity is widely distributed among different bacterial groups colonizing environments rich in plant substrates. Although 16S rRNA gene sequencing is considered a reliable identification tool, the strains exhibited high similarity to a different type species in GenBank.54 In addition, some strains were assigned to Bacillus altitudinis due to the relatively low similarity levels (ranging from 99.81%-100%). These observations highlight the limitation of 16S rRNA gene sequencing for accurate microbial identification. Currently, microorganism identification from diverse sources is enhanced by combining 16S rRNA gene sequencing with techniques such as MALDI-TOF-MS, chemometric analysis, or whole genome sequencing. Accordingly, the identification of the strains in this study could be refined through such multifactorial approaches.
Cellulase production: Modeling and optimization
Optimization of culture conditions through a single factor approach
Culture parameters, including carbon and nitrogen sources and pH, were varied to determine their effects on cellulase activity. Figure 4 shows significant variation in activity across the different media. This demonstrates a significant influence of each factor on enzymatic activity.
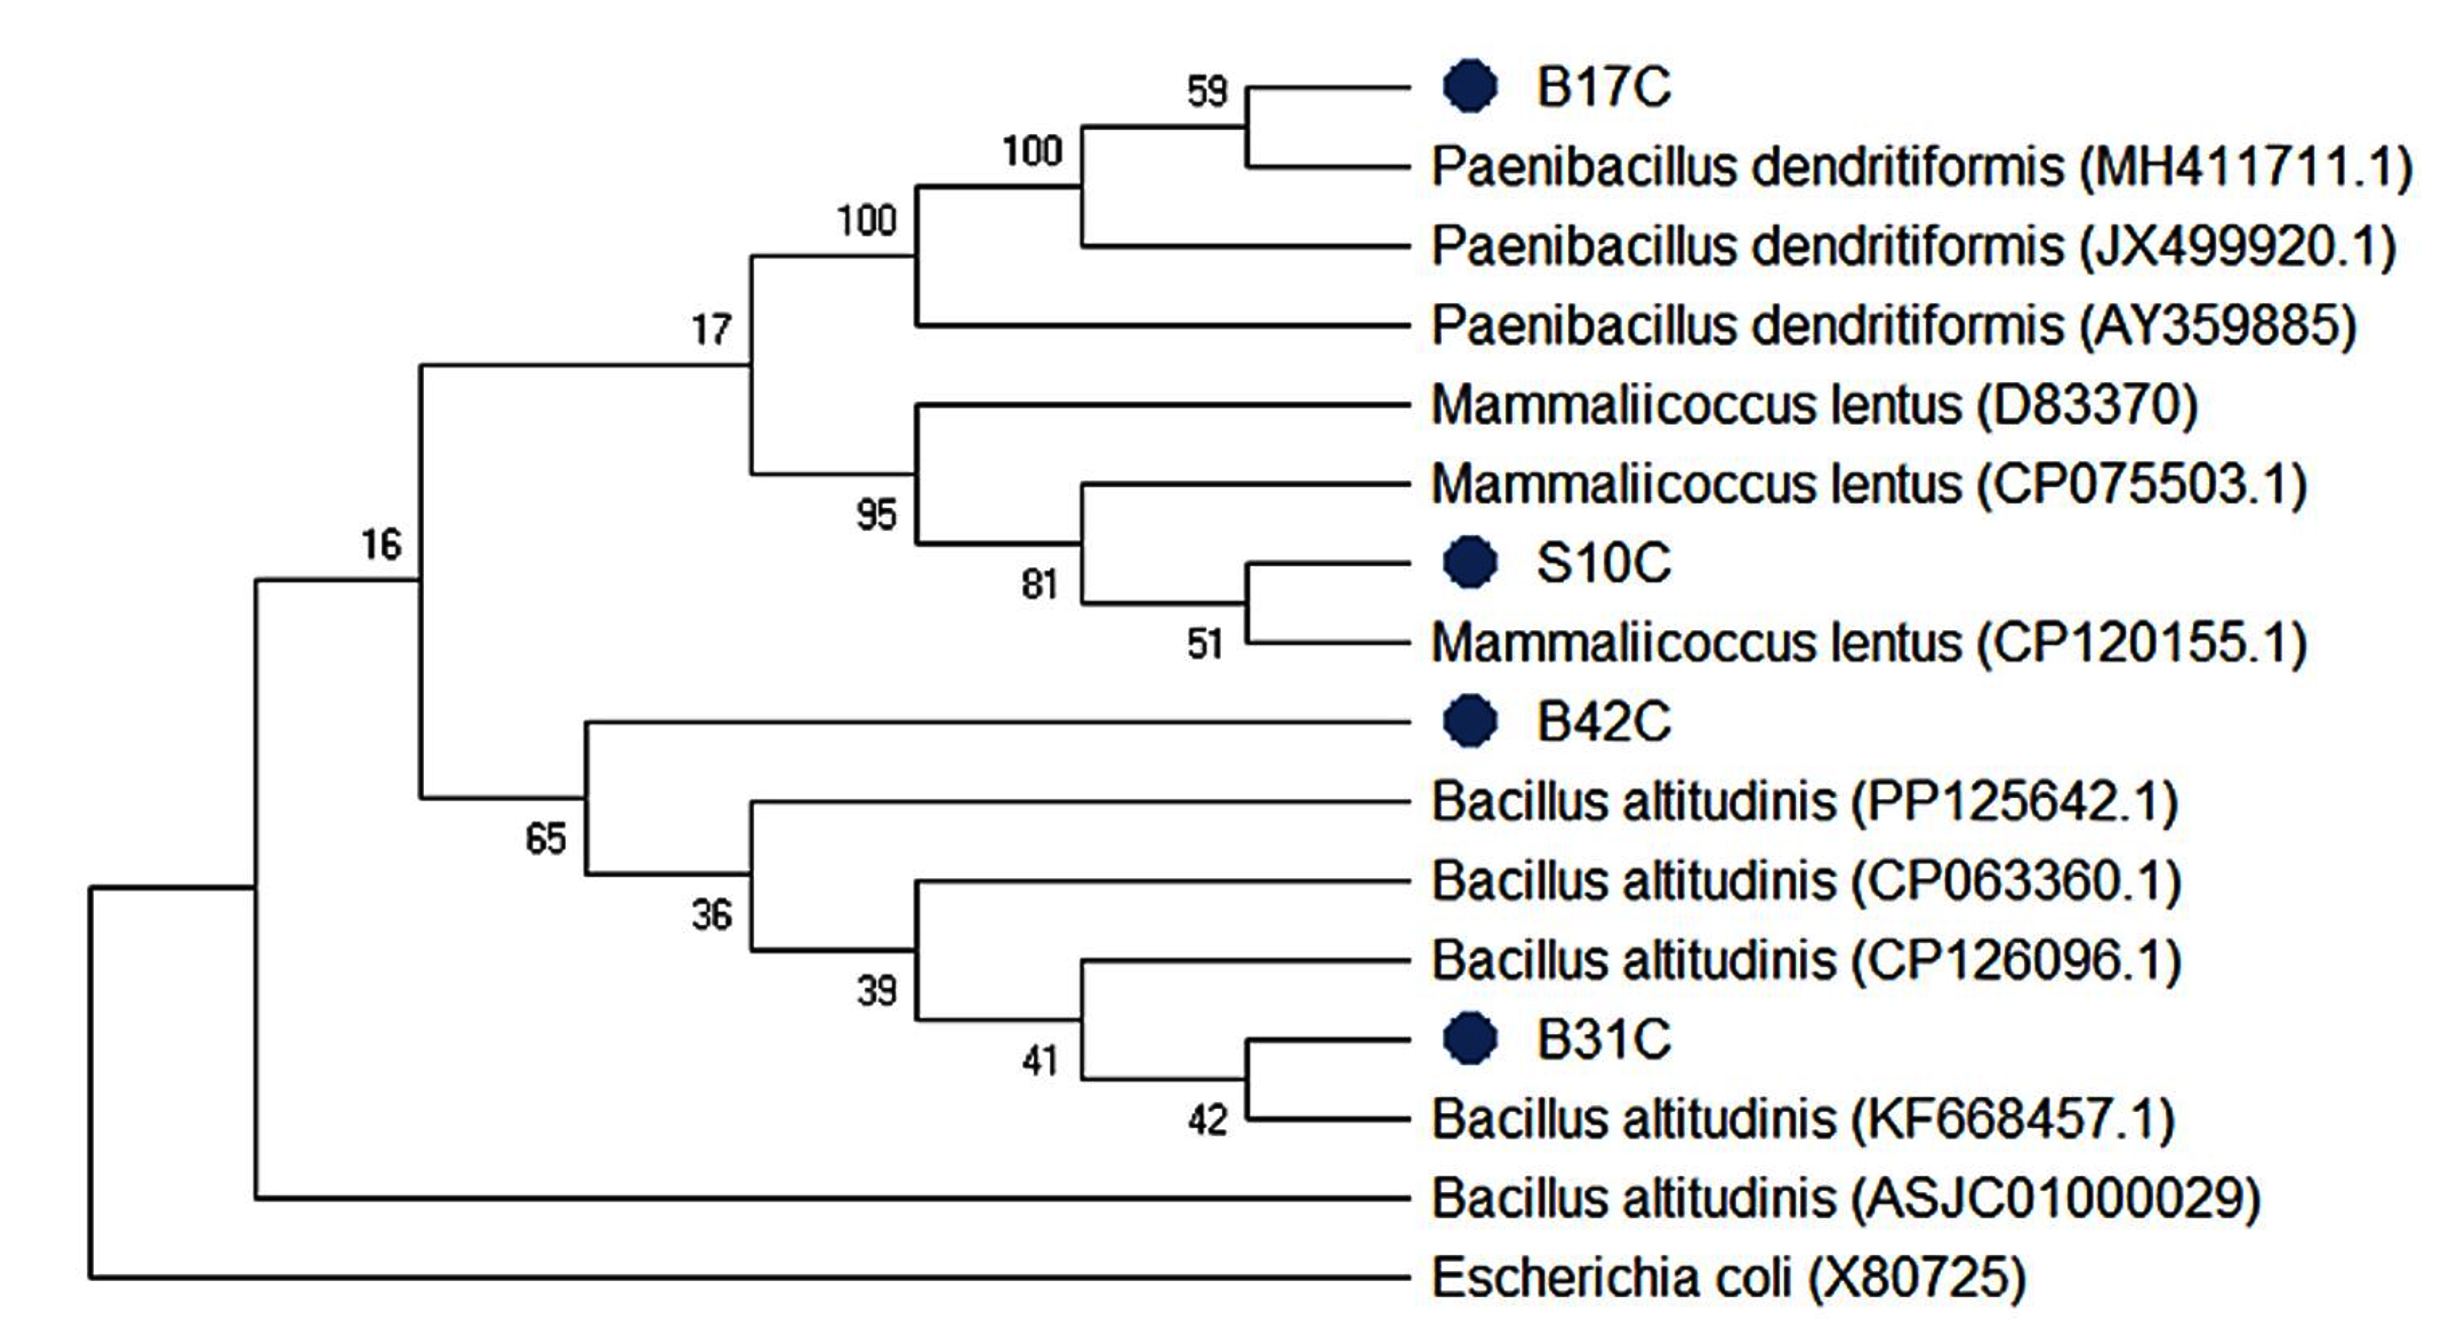
Figure 4. Phylogenetic tree using the neighbour-joining method
Influence of different carbon sources
Paenibacillus dendritiformis PQ845045 showed strong cellulolytic activity in the medium containing carboxymethylcellulose (CMC), followed by glucose (Figure 5A). The lowest activity was observed with arabinose. Enzyme activity also increased with rising concentrations of each carbon source. The maximum activity (2.77 IU/mL) was obtained in the medium containing 25 g/L CMC. These results are consistent with those reported by several authors, who found that CMC is the best carbon source for optimal cellulase production.10,55,56 This is thought to be because this carbon compound is highly soluble in water, thus facilitating access to the enzymes.10 In contrast, previous studies have reported higher activity with glucose as the carbon source.57,58 Other studies have reported significant cellulase production by Aspergillus terreus when CMC is replaced with maize cobs.59
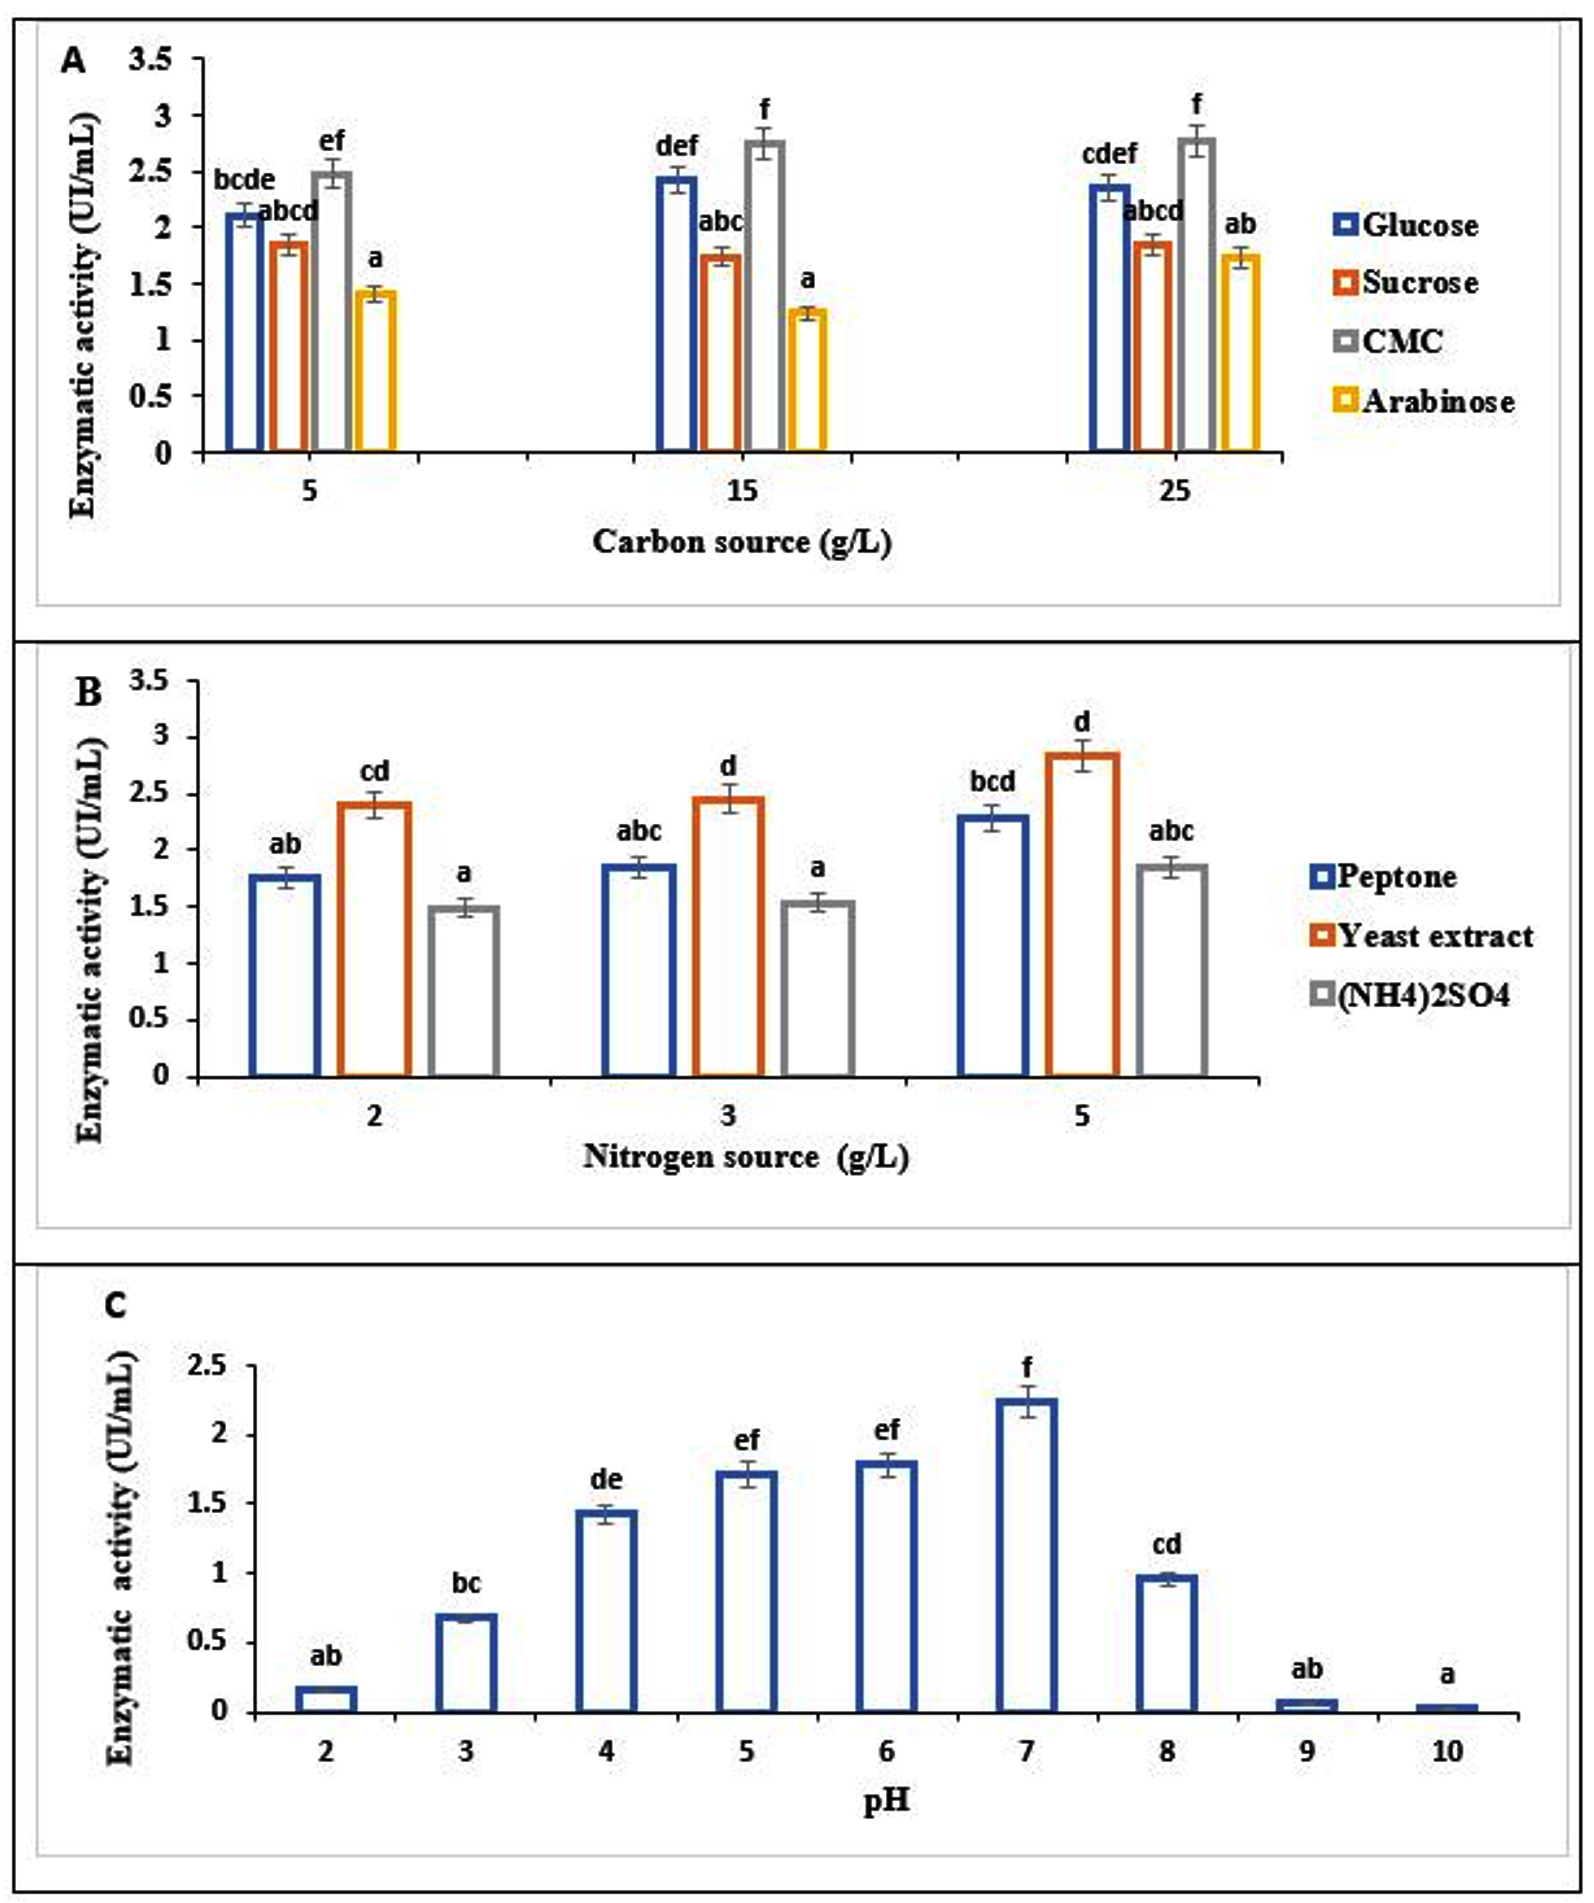
Figure 5. Influence of different carbon sources (A), different nitrogen sources (B) and different pH values (C) on cellulase activity. The data were analyzed by ANOVA, and within a group, values followed by different lowercase letters indicate significant differences at P < 0.05
Influence of various nitrogen sources
The influence of yeast extract, peptone, and ammonium sulfate (NH4)2SO4), three nitrogen compounds, was investigated to identify the best nitrogen source. As illustrated in Figure 5B, optimal cellulase activity (2.24 IU/mL) was observed at a yeast extract concentration of 5 g/L. At the same time, low production was observed in the medium where ammonium sulfate (NH4)2SO4 served as the nitrogen source. This study shows that organic nitrogen sources are more effective than inorganic ones. These results corroborate those reported on the mushrooms Pleurotus ostreatus and Phanerochaete chrysosporium.55 This stimulating effect of the yeast extract may be attributable to its abundance of amino acids and vitamins.60 Conversely, other studies suggest higher activity with peptone than with yeast extract.48
Influence of pH
In this study, different pH values were tested. As illustrated in Figure 5C, pH influenced cellulase activity. Maximum activity was recorded at neutral pH. Furthermore, the strain is effective within a pH range of 4-6. However, above pH 7, activity was reduced by more than 60%. The maximum activity at neutral pH is advantageous because many industrial processes are conducted at this pH. Our results corroborate those of several authors who have reported 7 as the optimum pH.10,13,58,61,62 Previous studies have reported optimal activity at pH 8 48 and pH 9.63
Therefore, in submerged fermentation, a medium containing CMC as the carbon source and yeast extract as the nitrogen source, at pH 7 used, may be suitable for good cellulase production. These variables were incorporated into the culture medium formulation to assess their cumulative effect.
Table 4. Design of experiments and results
Run |
X1 |
X2 |
X3 |
X4 |
Predicted Value |
Cellulase activity (UI/ml) |
|---|---|---|---|---|---|---|
1 |
20 |
2 |
25 |
10 |
2.9499 |
3.21422 |
2 |
20 |
4 |
40 |
10 |
1.2910 |
1.40084 |
3 |
25 |
3 |
32.5 |
7.5 |
2.5585 |
1.70865 |
4 |
30 |
2 |
25 |
10 |
2.4355 |
2.79601 |
5 |
25 |
3 |
32.5 |
7.5 |
2.5585 |
2.94656 |
6 |
25 |
3 |
32.5 |
7.5 |
2.5585 |
2.92656 |
7 |
25 |
3 |
47,5 |
7.5 |
0.2708 |
1.22687 |
8 |
30 |
2 |
40 |
5 |
1.4519 |
1.083 |
9 |
30 |
2 |
40 |
10 |
1.1778 |
1.02947 |
10 |
35 |
3 |
32.5 |
7.5 |
2.4428 |
2.60865 |
11 |
30 |
4 |
25 |
5 |
2.6965 |
2.86627 |
12 |
20 |
4 |
25 |
10 |
2.7812 |
2.6856 |
13 |
25 |
3 |
32.5 |
2.5 |
2.5537 |
3.32463 |
14 |
15 |
3 |
32.5 |
7.5 |
2.4829 |
2.96329 |
15 |
30 |
4 |
40 |
5 |
1.9507 |
1.50456 |
16 |
25 |
5 |
32.5 |
7.5 |
1.9437 |
2.30753 |
17 |
20 |
2 |
25 |
5 |
2.8342 |
2.52835 |
18 |
25 |
3 |
32.5 |
7.5 |
2.5585 |
2.33095 |
19 |
20 |
2 |
40 |
10 |
1.1586 |
0.52427 |
20 |
30 |
4 |
25 |
10 |
2.5428 |
2.44805 |
21 |
25 |
3 |
32.5 |
7.5 |
2.5585 |
2.42798 |
22 |
30 |
2 |
25 |
5 |
2.4988 |
2.20716 |
23 |
20 |
4 |
25 |
5 |
2.7559 |
2.7224 |
24 |
25 |
3 |
32.5 |
12.5 |
2.3050 |
2.1804 |
25 |
25 |
1 |
32.5 |
7.5 |
1.6136 |
1.89601 |
26 |
25 |
3 |
17.5 |
7.5 |
2.8080 |
2.49824 |
27 |
20 |
4 |
40 |
5 |
1.4764 |
0.65141 |
28 |
30 |
4 |
40 |
10 |
1.5863 |
1.42761 |
29 |
20 |
2 |
40 |
5 |
1.2536 |
1.16664 |
30 |
25 |
3 |
32.5 |
7.5 |
2.5585 |
3.01013 |
Optimization of cellulase production using response surface methodology
MSR coupled with a centered composite design was used to study the combined effects of four independent factors, the amount of CMC (X1), the amount of yeast extract (X2), the temperature (X3), and the amount of NaCl (X4), with their competence levels (-α, -1, 0, +1, +α) on cellulase activity. These components were selected based on a one-way analysis. A series of 30 experiments was conducted, and the results highlighted the conditions that significantly optimized cellulase production. Table 4 presents the composition of the experimental designs and the observed and predicted responses. Enzyme activity varied from 0.52-3.32 IU/mL (Table 4) depending on the combination, corresponding to an optimization factor of 6.16. This result demonstrates the influence of the different factors and their levels of competence on activity. Slight variations were observed between the observed and predicted data. This once again demonstrates the model’s accuracy. An optimization factor of 2.43, lower than that obtained in the present study, has been previously reported for E. faecium, where authors considered pH, temperature, inoculum volume, and incubation time as the main parameters influencing enzyme production.64 Furthermore, activity increases of up to a factor of 60 compared to non-optimized conditions have also been described following appropriate optimization strategies.58
Experimental results were modeled using a multiple Y-axis regression approach with Design Expert 7.0.0, including linear and quadratic effects and interactions between factors.
Y = +2.56 – 0.010X1 + 0.082X2 – 0.63X3 – 0.62X4 + 0.69X1X2 + 0.13X1X3 – 0.045X1X4 + 0.075X2X3 – 0.023X2X4 – 0.053X3X4 – 0.024X12 – 0.19X22 -0.25X32 – 0.032X42
The model fit was evaluated using analysis of variance (ANOVA), and the results are shown in Table 5. The overall model showed a significant effect (P < 0.05; F = 2.63) on the evaluated response, namely, cellulase activity. The significant effect of the model (P = 0.0365) provides confidence, as there is only 3.65% probability that such a large F value occurred by chance. Furthermore, the non-significant lack-of fit statistic (0.3253), along with the R² (0.71) and adjusted R² (0.44) values, confirms that the mathematical model (Y) was adequate for predicting cellulase activity across different combinations of variable values. A non-significant lack of fit (0.57) has also been previously reported, highlighting the relevance of this approach for optimizing experimental conditions.64 The linear effect of X3, representing temperature, is also significant, indicating that temperature has a major impact on cellulase production by the bacterium. However, the quadratic model (X32) and their interaction coefficients did not show a significant effect under the conditions studied. In contrast, significant effects of carboxymethylcellulose (CMC) on cellulase production have been reported in other studies on cellulolytic yeasts.65 Similarly, the determining influence of the carbon source on the optimization of cellulase production has been demonstrated in certain bacterial species.58 Furthermore, a significant effect of yeast extract on enzymatic activity has also been reported in several previous studies. The negative coefficient associated with indicates that an increase in temperature decreases the response. X3² is also significant (P < 0.05). The negative coefficient of this quadratic term demonstrates a curvature that reflects an optimum temperature beyond which activity decreases. These results align with previous observations highlighting a comparable effect of temperature on cellulase production in Enterococcus faecium.64 The highest activity was obtained with combination N°13. This medium consisted of 25 g/L CMC, 3 g/L yeast extract, and 2.5 g/L NaCl and the culture was maintained at 32.5 °C. The production predicted under this condition was nearly identical to the observed value, demonstrating the model’s accuracy. Combinations N°1 and N°30 also yielded relatively high activities of 3.21 IU/mL and 3.01 IU/mL, respectively. Trial 30 differs from trial 13 only in its NaCl concentration, which is 7.5 g/L. Trial 1 consisted of 20 g/L of CMC, 2 g/L of yeast extract, 10 g/L of NaCl, and an incubation temperature of 25 °C. The lowest activities, below 0.70 IU/mL, were observed in trials 19 and 27, which used media containing 20 g/L of CMC and were incubated at 40 °C. All other media incubated at 40 °C also exhibited relatively low enzymatic activities. In contrast, maximum cellulase productivity has been reported at temperatures above 40 °C in other studies.64 This difference could be explained by genetic factors influencing thermotolerance and the ability of the bacteria to adapt to temperature fluctuations in the culture medium. Previous work has also demonstrated the value of statistical approaches in optimizing enzyme production by various microorganisms. Among these, the centred composite design has been successfully used to determine the optimal conditions for enzyme production by different bacteria.48,64,66 Several studies have highlighted the crucial role of temperature as a parameter influencing the statistical optimization of cellulase production.64 Furthermore, Significant optimization of cellulase production was achieved in Trichosporum insectorum by the combined variation of three influencing factors: Carbon source concentration, incubation temperature and pH.65 Other statistical optimization designs conducted with various influencing have enabled the optimization of cellulase production from several microorganisms, such as Aspergillus flavus,67 Trichoderma viride,68 and Enterococcus faecium.64 An activity of 170.55 IU/ml has been reported for Bacillus cereus cellulase after optimization under the following four experimental conditions: culture time, temperature, pH, and inoculum volume.69 Three dimensional response surface plots were constructed to evaluate the combined effects of two independent variables on enzyme production, with the remaining factors held at their median values. Figure 6 presents 3D response surfaces generated to evaluate the combined effect of two variables and the possible interactions between these variables on enzyme activity. Figure 6A illustrates the evolution of cellulolytic activity as a function of carboxymethylcellulose and yeast extract concentrations, at a temperature maintained at 32.5 °C and a NaCl concentration of 7.5 g/L. The response surface exhibits a curvature reflecting a non-linear variation of cellulolytic activity as a function of CMC and yeast extract concentrations within the experimental range studied. Furthermore, the contour lines show a nearly parallel arrangement, suggesting the absence of a marked synergistic or antagonistic interaction between CMC and yeast extract. This observation is consistent with the non-significant nature of the interaction term (P > 0.05). Similarly, the linear effects of CMC (X1) and yeast extract (X2), as well as their respective quadratic effects ( and ), were not statistically significant (P > 0.05). Thus, within the studied concentration range, variations in CMC and yeast extract did not result in statistically significant changes in activity. The visible variations observed on the contour lines and response surface should be considered as trends predicted by the model and do not, on their own, allow us to conclude that each factor has an independent effect or that there is a significant optimum. Comparable observations were reported by Irfan et al.70 who noted the non-significance of several linear terms despite the overall significance of the model. Figure 6B illustrates the combined effect of CMC concentration (X1) and temperature (X3) on activity, with yeast extract (3 g/L) and NaCl (7.5 g/L) concentrations held constant. The response surface shows an upward slope as the CMC concentration increases from 20-30 g/L, indicating an increase in cellulolytic activity within the studied concentration range. However, since the linear (X1) and quadratic (X12) effects of CMC are not statistically significant (P > 0.05), this trend suggests a prediction of the statistical model rather than a true effect of CMC concentration. The response surface shows a decrease in activity with increasing temperature from 25-40 °C. This trend is consistent with the significance of the linear term; P < 0.05). Furthermore, the absence of a significant quadratic effect of temperature (X32 P > 0.05) indicates that this variation is primarily linear and does not allow for the identification of a significant thermal optimum. The contour lines are nearly parallel and closely spaced. This presentation is consistent with the lack of significance of the interaction terms between CMC and temperature. Thus, despite the overall significance of the model, analysis of the individual coefficients shows that only temperature exerts a statistically significant influence on activity within the experimental ranges studied. The decreases in predicted activity with increasing temperature suggest that lower temperatures are more favorable for cellulase production. A similar trend has been reported by Steiner and Margesin,71 where optimal activity was obtained between 20 and 25 °C. Figure 6C shows the effect of CMC and NaCl concentrations on cellulolytic activity. The response surface is relatively flat, indicating little variation in activity as CMC and NaCl concentrations increase. The contour lines are gently curved and nearly parallel. The linear effects X1 and X4, the quadratic effects X12 and X42, and the X1 X4 interaction were not statistically significant, suggesting the absence of an optimal concentration and interaction between the two variables. Similar results were obtained by Waheeb et al.19 who showed that NaCl concentration did not have a statistically significant effect on cellulase production in S. thermodiastaticus. Figure 6D shows the combined effect of yeast extract concentration (X2) and temperature (X3) on cellulolytic activity. Unlike the previous surfaces, it exhibits a more pronounced curvature, indicating a greater variation in activity. A decrease in activity is observed with increasing temperature, consistent with the results of the analysis of variance showing a significant linear effect of X3. The response surface also shows an increase in activity as the yeast extract concentration increases to intermediate levels. However, since the linear (X2) and quadratic (X22) effects are not statistically significant, this trend should be considered a predicted trend. Furthermore, the contour lines have a distinctly curved shape, potentially suggesting an interaction between the two variables. However, this interaction is not statistically significant due to the lack of significance of the interaction term. Thus, among the effects represented, only the linear influence of temperature on activity is statistically established. Figure 6E shows the variation of activity as a function of combined variations in NaCl (X4) and yeast extract (X2) concentrations. The response surface exhibits moderate curvature, with an apparent nonlinear evolution of activity. Activity increases up to the intermediate level of the two factors, then decreases slightly to the highest concentrations. This pattern suggests the presence of optimum concentration. However, this trend is not statistically significant, as neither the linear nor the quadratic terms are significant. The contour lines are relatively spaced and not very concentric, indicating low sensitivity of the activity to concentration variations, as well as a moderate interaction between the two variables. Figure 6F shows the evolution of activity under the combined effect of temperature (X3) and NaCl concentration (X4). The response surface shows a downward trend in activity as the temperature increases from 25-40 °C, consistent with the significant linear effect of X3 (P < 0.05). In contrast, variations in NaCl concentration have little influence on the response, which is consistent with the non-significant linear effect of X4. The contour lines are almost parallel, indicating that the effect of temperature varies very little with NaCl concentration, consistent with the absence of a significant X3X4 interaction (P > 0.05).
Table 5. Analysis of variance of independent variables and processing of experimental data
Source |
Sum of squares |
df |
Mean square |
F-Value |
P-value |
|---|---|---|---|---|---|
Model |
12.98 |
14 |
0.93 |
2.6318078 |
0.0365* |
X1-CMC |
0.0024 |
1 |
0.0024 |
0.0067516 |
0.9356 |
X2-Yeast Extract |
0.16 |
1 |
0.16 |
0.465182 |
0.5056 |
X3-Temperature |
9.66 |
1 |
9.66 |
27.415923 |
0.0001* |
X4-NaCl |
0.093 |
1 |
0.093 |
0.2642014 |
0.6147 |
X1X2 |
0.076 |
1 |
0.076 |
0.2155854 |
0.6491 |
X1X3 |
0.28 |
1 |
0.28 |
0.8072411 |
0.3831 |
X1X4 |
0.032 |
1 |
0.32 |
0.0904808 |
0.7677 |
X2X3 |
0.091 |
1 |
0.091 |
0.2566467 |
0.6198 |
X2X4 |
0.0082 |
1 |
0.0082 |
0.0229203 |
0.8817 |
X3X4 |
0.045 |
1 |
0.045 |
0.1255753 |
0.7280 |
X12 |
0.016 |
1 |
0.016 |
0.0446147 |
0.8356 |
X22 |
1.04 |
1 |
1.04 |
2.9615538 |
0.1058 |
X32 |
1.78 |
1 |
1.78 |
5.0568631 |
0.0400* |
X42 |
0.028 |
1 |
0.028 |
0.0812482 |
0.7795 |
Residual |
5.28 |
15 |
0.35 |
||
Lack of fit |
4.00 |
10 |
0.40 |
1.5613582 |
0.3253** |
Pure error |
1.28 |
5 |
0.26 |
||
Cor total |
18.26 |
29 |
CMC: Carboxymethylcellulose; *Significant terms; ** no significant
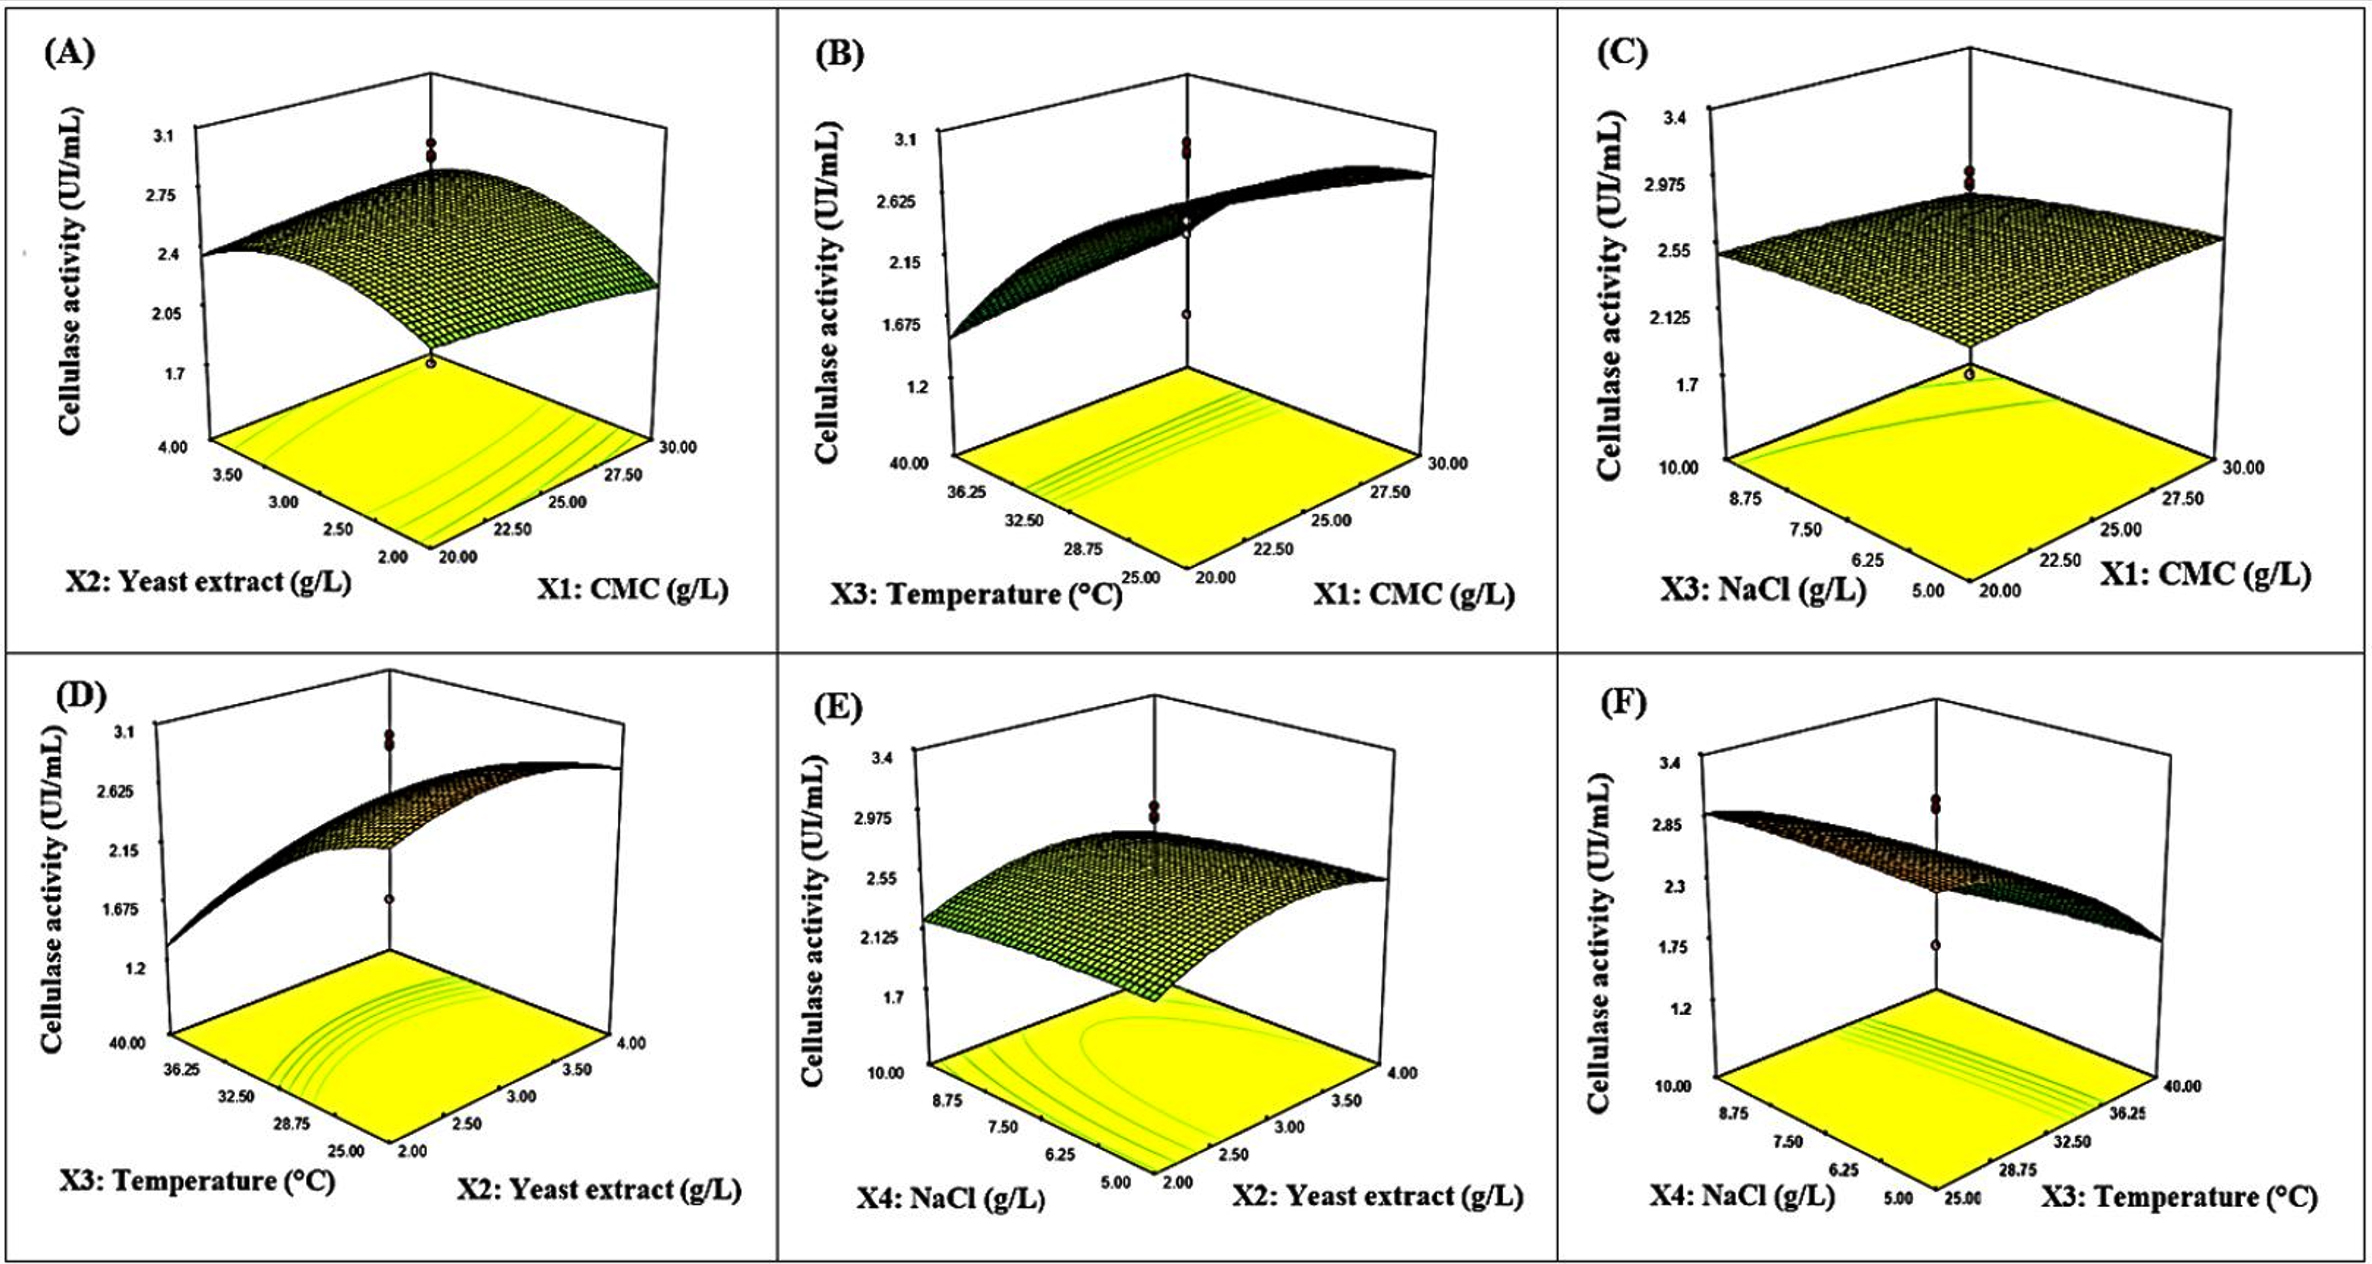
Figure 6. Three-dimensional response surface plots showing the interaction effect of variables for cellulase activity. (A) Effect of the interaction between carboxymethylcellulose and yeast extract on enzyme activity; (B) Effect of the interaction between carboxymethylcellulose and temperature on enzyme activity; (C) Effect of the interaction between carboxymethylcellulose and NaCl on enzyme activity; (D) Effect of the interaction between temperature and yeast extract on enzyme activity; (E) Effect of the interaction between NaCl and yeast extract on enzyme activity; (F) Effect of the interaction between NaCl and temperature on enzyme activity
The statistical model obtained in this study was globally significant, although the linear effects of CMC, yeast extract, and NaCl, as well as the quadratic and interaction terms between factors, were not significant. Only the linear effect of temperature proved significant, indicating that this parameter was the main factor influencing cellulase production in P. dendritiformis B17C under the conditions studied. A similar situation was reported by Wang et al.,62 in which the overall model was significant, whereas the interactions among the factors studied were not. The importance of temperature in cellulase production has also been reported in cellulase production in Bacillus subtilis.70 Thus, the identification of temperature as a significant factor in the present study, combined with the significant improvement in activity after optimization, reinforces the cellulolytic potential of P. dendritiformis B17C.
At the end of this study, nineteen cellulolytic bacterial strains were isolated from rotten fruit and soumbala. Among them, three strains, named B17C, B31C, and B42C, all from rotten bananas, stood out due to their high cellulolytic activity and γ-haemolytic phenotype. Molecular identification of these strains allowed them to be assigned to Paenibacillus dendritiformis (PQ845045), Bacillus altitudinis (PQ845085), and Bacillus altitudinis (PQ845089), respectively. A fourth strain with high cellulolytic activity, S10C, isolated from soumbala (fermented carob paste), was identified as Mammaliicoccus lentus (PQ845126) but was distinguished by a β-haemolytic phenotype. The statistical optimization model for the culture conditions of Paenibacillus dendritiformis was found to be globally significant (P < 0.05) and resulted in a maximum activity of 3.32 IU/mL, representing an approximately 6-fold increase compared to the non-optimized medium. Response surface analysis identified temperature as the main factor influencing cellulase production. In contrast, variations in the concentrations of CMC, yeast extract, and NaCl did not significantly affect activity, and no statistically significant synergistic or antagonistic interactions were observed between the variables studied. These results highlight the ability of P. dendritiformis B17C to efficiently produce cellulase and support its interest as a particularly promising candidate for the development of biotechnological processes for cellulase production. Further research is recommended, focusing on the purification and biochemical characterization of the cellulase produced by this strain, particularly by evaluating its thermal stability, pH stability, and kinetic properties. Pilot and larger-scale trials using real-world matrices, especially for juice clarification and the valorization of plant residues, are recommended to determine the conditions for potential biotechnological applications. Finally, a thorough safety assessment of the strain, including screening for virulence factors, should be conducted before any food application.
ACKNOWLEDGMENTS
The authors thank Uppsala University for partially supporting this research through the ISP/IPICS/RABIOTECH project.
CONFLICT OF INTEREST
The authors declare that there is no conflict of interest.
AUTHORS’ CONTRIBUTION
TSO, MD, YD and IM conceptualized and designed the study. TSO and IM collected the samples. TSO, HS, YD, SG and IM carried out the experimental work. MD, IM, AS, and SNG performed data analysis and interpretation of results. OTS, MI and KaK wrote the manuscript. CID, MD., KiK., and MHD reviewed and edited the manuscript. All authors read and approved the final manuscript for publication.
FUNDING
This study was funded by the West African Biotechnology Network (RABIOTECH, ISP/IPICS Project N°172 600 000).
DATA AVAILABILITY
The datasets generated and/or analysed during the current study are available in the NCBI GenBank database and are accessible under the following accession numbers PQ845045, PQ845085, PQ845089 and PQ845126.
ETHICS STATEMENT
This article does not contain any studies on human participants or animals performed by any of the authors.
- McNamara JT, Morgan JL, Zimmer J. A Molecular description of cellulose biosynthesis. Annu Rev. Biochem. 2015;84:895-921.
Crossref - Jakob M, Mahendran AR, Gindl-Altmutter W, et al. Strength and stiffness of oriented wood and cellulose-fibre materials: A review. Prog Mater Sci. 2022;125:100916.
Crossref - Kulasinski K, Keten S, Churakov SV, Derome D, Carmeliet J. A comparative molecular dynamics study of crystalline, paracrystalline and amorphous states of cellulose. Cellulose.2014;21(3):1103-1116.
Crossref - Ejaz U, Sohail M, Ghanemi A. Cellulases: from bioactivity to a variety of industrial applications. Biomimetics. 2021;6(3):44.
Crossref - Anoop Kumar V, Suresh Chandra Kurup R, Snishamol C, Nagendra Prabhu G. Role of Cellulases in Food, Feed, and Beverage Industries. In: Parameswaran, B., Varjani, S., Raveendran, S. (eds) Green Bio-processes. Energy, Environment, and Sustainability. Springer, Singapore. 2019;
Crossref - Cortez R, Luna-vital DA, Margulis D, Mejia EGD. Natural Pigments: Stabilization Methods of Anthocyanins for Food Applications. Compr Rev Food Sci Food Saf. 2016;16(1):180-198.
Crossref - Bhardwaj N, Kumar B, Agrawal K, Verma P. Current perspective on production and applications of microbial cellulases: a review. Bioresour Bioprocess. 2021;8(1):95.
Crossref - Matsuzawa T. Plant polysaccharide degradation-related enzymes in Aspergillus oryzae. Biosci Biotechnol Biochem. 2024;88(3):276–282.
Crossref - Sutaoney P, Rai SN, Sinha S, et al. Current perspective in research and industrial applications of microbial cellulases. Int J Biol Macromol. 2024;264(Pt 1):130639.
Crossref - Doan CT, Tran TN, Pham TP, et al. Production, Purification, and Characterization of a Cellulase from Paenibacillus elgii. Polymers. 2024;16(14):2037.
Crossref - Kuhad RC, Gupta R, Singh A. Microbial Cellulases and Their Industrial Applications. Enzyme Research. 2011;2011:280696.
Crossref - Qamar SA, Qamar M, Bilal M, et al. Cellulose-deconstruction potential of nano-biocatalytic systems: A strategic drive from designing to sustainable applications of immobilized cellulases. Int J Biol Macromol. 2021;185:1-19.
Crossref - Boondaeng A, Keabpimai J, Trakunjae C, Vaithanomsat P, Srichola P, Niyomvong N. Cellulase production under solid-state fermentation by Aspergillus sp. IN5: Parameter optimization and application, Heliyon. 2024;10(5):e26601.
Crossref - Singh A, Bajar S, Devi A, Pant D. An overview on the recent developments in fungal cellulase production and their industrial applications. Bioresour Technol Rep. 2021;14:100652.
Crossref - Ikram H, Khan HA, Ali H, et al. Evaluation, Characterization and Molecular Analysis of Cellulolytic Bacteria from Soil in Peshawar, Pakistan. Microbiol. Biotechnol. 2022;50(2):245-254.
Crossref - Yang P, Condrich A, Lu L, et al. Genetic Engineering in Bacteria, Fungi, and Oomycetes, The CRISPR Journal. 2024;4:427-454.
Crossref - Bhati N, Shreya, Sharma AK. Isolation, screening, and optimization of cellulase production by a novel bacterial isolate, Enterococcus durans. Appl Biol Chem J. 2022;3(4):71–78.
Crossref - Demissie MS, Legesse NH, Adgo A, Id T. Isolation and characterization of cellulase-producing bacteria from forest, cow dung, Dashen brewery, and agro-industrial waste. Plos One. 2024;19(4):e0301607.
Crossref - Waheeb MS, Elkhatib WF, Yassien MA, Hassouna NA. Optimized production and characterization of a thermostable cellulase from Streptomyces thermodiastaticus strain. AMB Expr. 2024;14(1):129.
Crossref - Ouedraogo TS, Diao M, Kaboré B, et al. Molecular identification of pectinolytic bacteria isolated from rotten fruit and optimization of pectinase production using response surface methodology. Nov Res Microbiol J. 2024; 10(3): 331-352.
Crossref - Hauenstein J, Jeske L, Jode A, et al. BRENDA in 2026: a Global Core Biodata Resource for functional enzyme and metabolic data within the DSMZ Digital Diversity. Nucleic Acids Res. 2026;54(D1):527-534.
Crossref - Almuharef I, Rahman MS, Qin W. High production of cellulase by a newly isolated strain Paenibacillus sp. IM7. Waste Biomass Valor. 2020;11(9):6085-6094.
Crossref - Borthakur I, Devi RP, Karthikeyan S, Ramesh D, Murugananthi D. Microbial Cellulase Production: Current Technologies and Future Prospects. J Pure Appl Microbiol. 2024;18(4):2188-2204.
Crossref - Liang L, Zhang Z, Wu M, Wu Y, Feng X. Isolation, Screening, and Identification of Cellulolytic Bacteria from Natural Reserves in the Subtropical Region of China and Optimization of Cellulase Production by Paenibacillus terrae ME27-1. BioMed Res Int. 2014;2014:512497.
Crossref - Masi C, Tadesse D, Ayele A. Potential use of proteolytic bacteria Paenibacillus dendritiformis (BT7) isolated from Batu tannery effluents for the detergent industry. KIJOMS 2022;8(4):670-681.
Crossref - Srivastava S, Dafale NA, Purohit HJ. Functional genomics assessment of lytic polysaccharide mono-oxygenase with glycoside hydrolases in Paenibacillus dendritiformis CRN18. Int J Biol Macromol. 2020;164:3729-3738.
Crossref - Bezerra MA, Santelli RE, Oliveira EP, Villar LS, Escaleira LA. Response surface methodology (RSM) as a tool for optimization in analytical chemistry. Talanta. 2008;76(5):965-977.
Crossref - Kasana RC, Salwan R, Dhar H, Dutt S, Gulati A. A rapid and easy method for the detection of microbial cellulases on agar plates using Gram’s iodine. Curr Microbiol. 2008;57(5):503–507.
Crossref - Gautam SP, Bundela PS, Pandey AK, Jamaluddin, Awasthi MK, Sarsaiya S. Diversity of cellulolytic microbes and the biodegradation of municipal solid waste by a potential strain. Int J Microbiol. 2012;2012(1):325907.
Crossref - Moir A. How do spores germinate? J Appl Microbiol. 2006;101(3):526–530.
Crossref - Hudson LK, Chaggar HK, Schamp CN. Phenotypic characterization and analysis of complete genomes of two distinct strains of the proposed species “L. swaminathanii”. Sci Rep. 2022;12(1):9137.
Crossref - Lee Y, Kang J, Hwang J, Shin DM, Han SG, Yoon Y. Selection of Debaryomyces hansenii isolates to improve quality of dry fermented sausage. International Journal of Food Properties. 2023;26(1):2433–2454.
Crossref - Kavitha M, Raja M, Perumal P. Evaluation of probiotic potential of Bacillus spp. isolated from the digestive tract of freshwater fish Labeo calbasu (Hamilton, 1822). Aquac Rep. 2018;11:59–69.
Crossref - Dashti AA, Jadaon MM, Abdulsamad AM, Dashti HM. Heat Treatment of Bacteria: A Simple Method of DNA Extraction for Molecular Techniques. Kuwait Med J. 2009;41(2):117-122.
- Sanger F, Nicklen S, Coulson AR. DNA sequencing with chain-terminating inhibitors. Proc Natl Acad Sci USA. 1977;74(12):5463-5467.
Crossref - Zhang QH, Ye M, Wu XY, et al. Cloning and functional analysis of cDNAs with open reading frames for 300 previously undefined genes expressed in CD34+ hematopoietic stem/progenitor cells. Genome Res. 2000;10(10):1546-1560.
Crossref - Yoon S, Ha S, Kwon S, et al. Introducing EzBioCloud: a taxonomically united database of 16S rRNA gene sequences and whole-genome assemblies. Int J Syst Evol. Microbiol.2017;67(5):1613–1617.
Crossref - Kumar S, Stecher G, Li M, Knyaz C, Tamura K. MEGA X: Molecular evolutionary genetics analysis across computing platforms. Mol biol evol. 2018;35(6):1547–1549.
Crossref - Yin LJ, Lin HH, Xiao ZR. Purification and characterization of a cellulase from Bacillus subtilis YJ1. J Mar Sci Technol. 2010;18(3):466–471.
Crossref - Parkhey P, Gupta P, Eswari JS. Optimization of Cellulase Production from Isolated Cellulolytic Bacterium: Comparison between Genetic Algorithms, Simulated Annealing, and Response Surface Methodology. Chem Eng Commun. 2017;204(1):28–38.
Crossref - Islam F, Roy N. Isolation and Characterization of Cellulase-producing Bacteria from Sugar Industry Waste. Am J BioSci. 2019;7(1):16–24.
Crossref - Khonchaisri R, Sumonsiri N, Prommajak T, et al. Optimization of Ultrasonic-Assisted Bioactive Compound Extraction from Green Soybean (Glycine max L.) and the Effect of Drying Methods and Storage Conditions on Procyanidin Extract. Foods. 2022;11(12):1775.
Crossref - Singhal A, Kumar M, Bhattacharya M, et al. Pretreatment of Leucaena leucocephala wood by acidified glycerol: optimization, severity index and correlation analysis. Bioresour Technol. 2018;265:214–223.
Crossref - Imran M, Arshad MS, Butt MS, Kwon JH, Arshad MU, Sultan MT. Mangiferin: a natural miracle bioactive compound against lifestyle related disorders. Lipids Health Dis. 2017;16(1):1–17.
Crossref - Shamshitov A, Decorosi F, Viti C, Fornasier F, Kadiene G, Suproniene S. Characterisation of Cellulolytic Bacteria Isolated from Agricultural Soil in Central Lithuania. Sustainability. 2023;15(1):598.
Crossref - Ferbiyanto A, Rusmana I, Raffiudin R. Characterization and Identification of Cellulolytic Bacteria from gut of Worker Macrotermes gilvus. HAYATI J Biosci. 2015;22(4):197–200.
Crossref - Ben Ghalib K, Chadli M, Dastan SD, Elmtili N. Isolation and molecular identification of cellulose-degrading bacteria from rumen sheep “‘Ovis aries’” and evaluation of their cellulase production. Sci Afr. 2024;26:e02439.
Crossref - Maravi P, Kumar A. Isolation, Screening and Identification of Cellulolytic Bacteria from Soil. Biotechnol. J. Int. 2020;24(1):1–8,
Crossref - El-Khamisi EF, Soliman EAM, El-Sayed GM, Nour SA, Abdel-Monem MO, Hassan MG. Optimization, gene cloning, expression, and molecular docking insights for enhanced cellulase enzyme production by Bacillus amyloliquefaciens strain elh1. Microb Cell Fact. 2024;23:191.
Crossref - Nwagu TN, Ugwuodo CJ, Onwosi CO, Inyima O, Uchendu OC, Akpuru C. Evaluation of the probiotic attributes of Bacillus strains isolated from traditional fermented African locust bean seeds (Parkia biglobosa), “daddawa.” Ann. Microbiol. 2020;70:20.
Crossref - Seker E. Identification of Candida Species Isolated from Bovine Mastitic Milk and Their In Vitro Hemolytic Activity in Western Turkey. Mycopathologia. 2010;169(4):303-308.
Crossref - Taufiqurrahman MD, Jatmiko YD. Screening and phylogenetic analysis of cellulolytic Bacillus spp. isolated from fermented brown algae (Sargassum sp.). BIO Web of Conf. 2025;177:07003.
Crossref - Zhang W, Sun Z. Random local neighbor joining: A new method for reconstructing phylogenetic trees. Mol. Phylogenet. Evol. 2008;47(1):117-28.
Crossref - Dabire Y, Somda NS, Somda MK, et al. Molecular identification and safety assessment of Bacillus strains isolated from Burkinabe traditional condiment “soumbala.” Ann Microbiol. 2022;72:10.
Crossref - Datsomor O, Yan Q, Opoku-Mensah L, Zhao G, Miao L. Effect of Different Inducer Sources on Cellulase Enzyme Production by White-Rot Basidiomycetes Pleurotus ostreatus and Phanerochaete chrysosporium under Submerged Fermentation. Fermentation. 2022;8(10):561.
Crossref - Shen J, Zhang K, Ren Y, Zhang J. The Optimization of Culture Conditions for the Cellulase Production of a Thermostable Cellulose-Degrading Bacterial Strain and Its Application in Environmental Sewage Treatment. Water. 2025;17(15):2225.
Crossref - Nathan VK, Rani ME, Rathinasamy G, Dhiraviam KN, Jayavel S. Process optimization and production kinetics for cellulase production by Trichoderma viride VKF3. SpringerPlus. 2014;3(1):1–12.
Crossref - Tawseef A, Anshula S, Gaganjot G, et al. Response surface optimization of cellulase production from Aneurinibacillus aneurinilyticus BKT-9: An isolate of urban Himalayan freshwater. Saudi J Biol Sci. 2020;27(9):2333-2343.
Crossref - Abdella MAA, Ahmed NE, Hasanin MS. Green ecofriendly enhancement of cellulase productivity using agricultural wastes by Aspergillus terreus MN901491: statistical designs and detergent ability on cotton fabrics. Microb Cell Fact. 2024;23(1):109.
Crossref - Jonathan SG, Fasidi IO. Effect of carbon, nitrogen and mineral sources on growth of Psathyerella atroumbonata (Pegler), a Nigerian edible mushroom. Food Chem. 2001;72(4):479-483.
Crossref - Ji J, Escobar M, Cui S, et al. Isolation and Characterization of a Low-Temperature, Cellulose-Degrading Microbial Consortium from Northeastern China. Microorganisms. 2024;12(6).
Crossref - Wang J, Bao F, Wei H, Zhang Y. Screening of cellulose-degrading bacteria and optimization of cellulase production from Bacillus cereus A49 through response surface methodology. Sci Rep. 2024;14:1–14.
Crossref - Tabssum F, Irfan M, Shakir HA, Qazi JI. RSM based optimization of nutritional conditions for cellulase mediated Saccharification by Bacillus cereus. J Biol Eng. 2018;12:7.
Crossref - Shaikh M, Makarani N, Kumar K. Response surface optimization for cellulase production from Enterococcus faecium and Stutzerimonas stutzeri isolated from Gossypium arboretum and Solanum melongena soil. Sci Rep. 2025;15:24080.
Crossref - Touijer H, Benchemsi N, Irfan M, et al. Statistical Optimization and Purification of Cellulase Enzyme Production from Trichosporon insectorum. Fermentation. 2024;10(9):453.
Crossref - Echesi, Ajuluchukwu S, Ire FS, Odu NN. Optimization of Pectinase Production from Bacillus Subtilis PSE-8 Using Cassava Peels As Substrate in Submerged Fermentation through Response Surface Methodology (RSM). J Adv Microbiol.2022;22(11):55-66.
Crossref - Singhal A, Kumari N, Ghosh P, et al. Optimizing cellulase production from Aspergillus flavus using response surface methodology and machine learning models. Environ. Technol. Innov. 2022;27:102805.
Crossref - El Baz AF, Shetaia YMH, Shams Eldin HA, ElMekawy A. Optimization of Cellulase Production by Trichoderma viride Using Response Surface Methodology. Curr Biotechnol. 2018;7(1):19–25.
Crossref - Zhang G, Dong Y. Design and application of an efficient cellulose-degrading microbial consortium and carboxymethyl cellulase production optimization. Front Microbiol. 2022;13:1–17.
Crossref - Irfan M, Mushtaq Q, Tabssum F, Shakir HA, Qazi JI. Carboxymethyl cellulase production optimization from newly isolated thermophilic Bacillus subtilis K-18 for saccharification using response surface methodology. AMB Expr. 2017;7(1):29.
Crossref - Steiner E, Margesin R. Production and partial characterization of a crude cold-active cellulase (CMCase) from Bacillus mycoides AR20-61 isolated from an Alpine forest site. Ann Microbiol. 2020;70:67.
Crossref
© The Author(s) 2026. Open Access. This article is distributed under the terms of the Creative Commons Attribution 4.0 International License which permits unrestricted use, sharing, distribution, and reproduction in any medium, provided you give appropriate credit to the original author(s) and the source, provide a link to the Creative Commons license, and indicate if changes were made.