

ISSN: 0973-7510
E-ISSN: 2581-690X
 , Asha Abraham2 and N.M. Vanitha3
 Pigment-producing bacteria are valuable bioresources for industrial applications. This study investigated the isolation of pigment-producing bacteria from three locations of the Netravathi River estuary (NRE-1, NRE-2, and NRE-3) in Mangaluru. Estuarine soil and water samples were collected concurrently with the measurements of physicochemical parameters, including temperature, pH, and salinity. The total viable count and total heterotrophic bacteria (THB) were analyzed. THB populations were differentiated into non-pigmented heterotrophic bacteria (NPHB) and pigmented heterotrophic bacteria (PHB). The PHB/NPHB % recorded was 8.08%, 38.42%, and 20.26% of the isolates at NRE-1, NRE-2, and NRE-3, respectively. With colony-forming units showing minimal variation across different growth media, the PHB recorded was 37.03% of total bacterial isolates. Phylogenetic classification of the pigmented bacteria from the NRE revealed four classes: Alphaproteobacteria (35%), Actinobacteria (30%), Gammaproteobacteria (30%), and Chitinophagia (5%). Based on the Gompertz growth curve model, three strains, Erythrobacter sp. RANMB8, Qipengyuania sp. RANM35, and Zooshikella sp. RANM57, were selected from NRE-1, NRE-2, and NRE-3. The UV absorption spectrum of Zooshikella sp. RANM57, Erythrobacter sp. RANMB8, and Qipengyuania sp. RANM35 exhibited peaks between 430 and 490 nm. Fourier-transform infrared spectroscopy (FTIR) spectrum analysis of Qipengyuania sp. RANM 35 and Erythrobacter sp. B8 exhibited an observed value of 3423.97 with a structure closely related to the standard β-carotene, while Zooshikella sp. RANM57 exhibited a peak at 3339.41, which closely resembled that of the standard for prodigiosin. The isolated pigmented bacteria exhibited seven distinct colors: brown (28%), yellow (21%), red (16%), pink (16%), orange (15%), black (2%), and blue (2%). Gram staining revealed that 45% of the colonies were Gram-negative, 31% Gram-positive, and 16% Gram-positive rods in chains. The remaining 8% displayed varied characteristics, with 16% Gram-positive bacteria belonging to the Actinobacterial family, owing to their slow growth rate. Isolation of pigmented bacteria from NRE poses several challenges. This study revealed that the selected isolates have the potential to produce pigments that can be exploited for bioprospecting in the pigment industry.
Pigmented Bacteria, Netravathi Estuaries, Erythrobacter, Qipengyuania, Zooshikella
Synthetic dyes have been used in the pigment industry and have raised many concerns, including environmental risks. Microbial pigments, categorized as secondary metabolites, may serve as alternatives to synthetic dyes and colorants. The search for natural pigment-producing bacteria from the estuaries of the Netravathi River was an attempt to identify the production of pigments under stressful estuarine conditions. Subterranean estuaries are intricate ecosystems characterized by the continuous interaction and mixing of solid aquifers, freshwater, and seawater.1 This dynamic environment plays a crucial role in nutrient availability,2 positively influencing bacterial growth and the diversity of the bacterial population.3 The transition zones, where freshwater meets saline water from the ocean, create a gradient environment with varying levels of nutrients, salinity, and other physicochemical factors.
Cultivating bacteria from diverse environments requires specialized media that can accommodate the specific growth requirements of the bacteria, providing appropriate carbon, nitrogen, phosphorus, and other essential trace elements while mimicking their nutrient requirements. However, this remains a challenge.
Fluctuating salinity in estuarine environments is a critical factor influencing the growth, diversity, and distribution of estuarine bacteria.4-6 Appropriate substitution of natural seawater, which contains natural chemical components, with the required amount of trace minerals, is crucial for the growth of indigenous estuarine bacteria.7,8
The isolation of estuarine bacteria requires a balanced carbon, nitrogen sources and buffers to sustain the growth of marine bacteria. Duran et al.9 suggested that familiar carbon sources, such as glucose, sodium acetate, sodium pyruvate, and sodium succinate, as well as ethanol, glycerol, and nitrogen sources including ammonium chloride, potassium nitrate, or combinations of multiple nitrogen compounds,10 phosphate buffers and iron supplementation are essential for the optimal growth of many marine bacteria.11,12
The Netravathi River estuary (NRE) is a subterranean estuary that is inhabited by vibrant and diverse bacterial communities along the Netravathi River in Mangaluru, Dakshina Kannada District, Karnataka, India, which joins the Arabian Sea, as shown in Figures 1 and 2. The increasing demand for microbial pigments in the global market has led to the identification of bacteria for pigment production. The current work focuses on identifying potential bacteria that could help us develop green earth knowledge of pigment resources that are safe for human and environmental use.
Isolation of estuarine bacteria
Estuarine sediment and water samples were collected from the estuarine delta of the Nethravathi River, which joins the Arabian Sea on the southwestern coast. Sample 1 (12.838199°, 74.869138°), Sample 2 (12.834654°, 74.834654°), and Sample 3 (12.837458°, 74.869352°) were collected from various depths in the top layers to a depth of 10 cm using a gardening spatula and a specially designed grab sampler and then deposited in a Ziplock bag. The estuarine water samples were also collected from the exact location where the soil sample was collected in sterile polypropylene bottles,13 transported to the lab and stored at 4 °C. Physiological factors, such as temperature, pH, and salinity, were recorded to analyze their variation during sample collection.
The soil samples were plated using the standard procedure with Soyabean Casein Digest Medium, Tryptone Soya Agar (TSA), Nutrient Agar (NA), R-2A Broth (R-2A), and Zobell Marine Broth 2216 (ZA), as described by Jung et al.14 They were obtained from HiMedia Laboratories, Mumbai, India. The plates were incubated at 28 ± 2 °C and observed for 6-7 days for the appearance of pigmented colonies. Pigmented colonies were subcultured in isolation media. Colony purification was performed by quadrant streaking to isolate single colonies. The pure culture was stored at -20 °C in a 25% glycerol stock solution.
Phylogenetic analysis
Genomic DNA of the purified colonies was analyzed using a modified protocol described by Edulamudi et al.15 A single pure colony from the bacterial plate was suspended in 100 µL of 0.05 M NaOH, vortexed for 5 min, and then heated at 95 °C for 5 min. The suspension was cooled, and the supernatant containing the templated DNA was separated and mixed with 900 µL of deionized water. It was then stored at -20 °C. The extracted DNA was subjected to a PCR reaction in a 50 µL reaction volume mixture. The mixture included 5 µL of 10 x Taq buffer, 1 µl of 10 mM dNTPs mix, 1 µL of each of universal bacterial primers, forward 27F (5′-AGAGTTTGATCCTGGCTCAG-3′) and reverse 1492R (5′-TACGGYTACCTTGTTACGACTT-3′), 2 µl of template DNA, 0.5µl of Taq polymerase (Sigma Aldrich), 3 µl of 25 mM MgCl2, and 36.5 µl of MilliQ water. Thirty-five cycles of the reaction were carried out with denaturation at 95 °C for 2 minutes, annealing at 55 °C for 1 minute, and extension at 72 °C for 1 minute, followed by a final extension at 72 °C for 10 minute and holding at 4 °C until the purity of the product was analyzed.
The purity of the product was analyzed by 1.0% agarose gel electrophoresis, which revealed a single band of approximately 1400 bp, corresponding to a 1500 bp DNA ladder. After confirming the purity of the PCR product, it was sent to HiMedia, HiSeq, Mumbai, and Sakhala Enterprises, Bangalore, for identification by Sanger sequencing. The first ten sequences of a closely related family were selected and aligned using the multiple sequence alignment program CLUSTALW based on the maximum identity score. A distance matrix and phylogenetic tree were constructed using MEGA11 software, and the phylogenetic tree was constructed using the neighbor-joining method.16
Primary screening for bacterial growth
The growth curves of the nine selected strains from the NRE were examined. In NB (HiMedia) for NRE-1 with Gordonia terrerae RANMB1, Aquimonas voraii RANMB0, Erythrobacter tepidarius RANMB8, and NRE-2 with Flavihumibacter cheonanensis RANM27, Falsiroseomonas sp. RANM36, Qipengyuania sp. RANM36. Zobell Marine Broth 2216 (ZMB) (HiMedia) was used for organisms isolated from the NRE-3 Zooshikella sp. RANM57, Zooshikella ganghwensis RANM51, and Hahella chejuensis RANM59 to analyze the growth curves of the isolates. In a 150 mL PerkinElmer flask, 50 mL of sterile NB and ZMB media was prepared with the pH adjusted to 7.5 ± 0.2 using 1 N HCl and NaOH. The flasks were then autoclaved at 121 °C for 15 min and cooled. Then, 100 µL of the overnight broth culture of the sterile organism was inoculated into sterile media and incubated at 30 ± 2 °C in a shaker incubator (Orbitex, Scigenics Biotech) at 100 rpm.
The optical density (OD) of the blank was recorded at zero hr. In addition to the test organisms, three uninoculated conical flasks were used as controls. The OD was measured every 5 hrs for 48 hrs. The growth curve was analyzed using the Gompertz model, estimating three key growth parameters: the maximum specific growth rate (µm), the lag phase duration (λ), and the upper asymptote representing maximum population density (YM or A), collectively providing a comprehensive description of the bacterial growth trajectory.17,18 To enhance the predictive accuracy, the Gompertz model integrated machine learning algorithms, nonlinear regression combined with algorithm-driven parameter optimization to minimize residual error, thereby improving the reliability of the growth curve fitting across selected strains.19 The machine learning approach has been augmented with classical growth models by capturing nonlinear interactions among physicochemical variables to improve growth prediction reliability under variable estuarine conditions.20
UV spectroscopy analysis
The extracted pigments were dissolved in methanol, with methanol serving as a blank, and analyzed under UV-absorption spectroscopy using a Multiskan SkyHigh 2.0035 Thermo Scientific instrument, which covers a wavelength range of 200-800 nm (λmax) to determine the absorption spectrum.21
FTIR analysis
The extracted pigment was analyzed using Fourier transform infrared spectroscopy (FTIR), PerkinElmer Spectrum IR 10.7.2. The FTIR was used to investigate the functional groups of bacterial pigments, asymmetric, symmetric, and stretching vibrations, as well as double and triple bond frequencies observed in the IR bands (OH, N-H, C=C, C-H, C-N, C-H, and C-O).22 The 500-1500 region contains a molecular fingerprint region in the mid-IR as given for carotenoids (Figure 1), which is unique to specific compounds and cannot be faked (Table 1).
Table 1. FTIR Peak assignment for carotenoids
No. |
Frequency Range (CM-1) |
Functional Group |
|---|---|---|
1 |
3200-3400 |
O-H stretch |
2 |
3300 |
alkyne stretch |
3 |
3000 |
alkenyl C-H stretch |
4 |
3000 |
alkyl C-H stretch |
5 |
2850-3100 |
C-H stretch |
6 |
2100-2260 |
C≡C or C≡N stretch |
7 |
1650-1800 |
C=O stretch |
FTIR frequency range and functional groups23
Isolation of bacteria from Netravathi estuaries
The sampling areas along the estuaries of the Netravathi River comprised three locations: NRE-1, NRE-2, and NRE-3. The first spot was on Adam Kudru Island (Figures 1 and 2) located south of the Netravathi bridge (12.8381810°, 74.8691150°), which was NRE-1. This zone is characterized by abundant vegetation. Three rhizosphere and water samples were collected from this area. The second spot, also in the south (12.834654°, 74.870481°) was chosen from the area opposite Adam Kudru Island (Figures 1 and 2) along the banks of the Netravathi River and designated as NRE-2. The third sampling area in the southwestern region was NRE-3, with coordinates 12.8374580°, 74.8693520° (Figures 1 and 2).
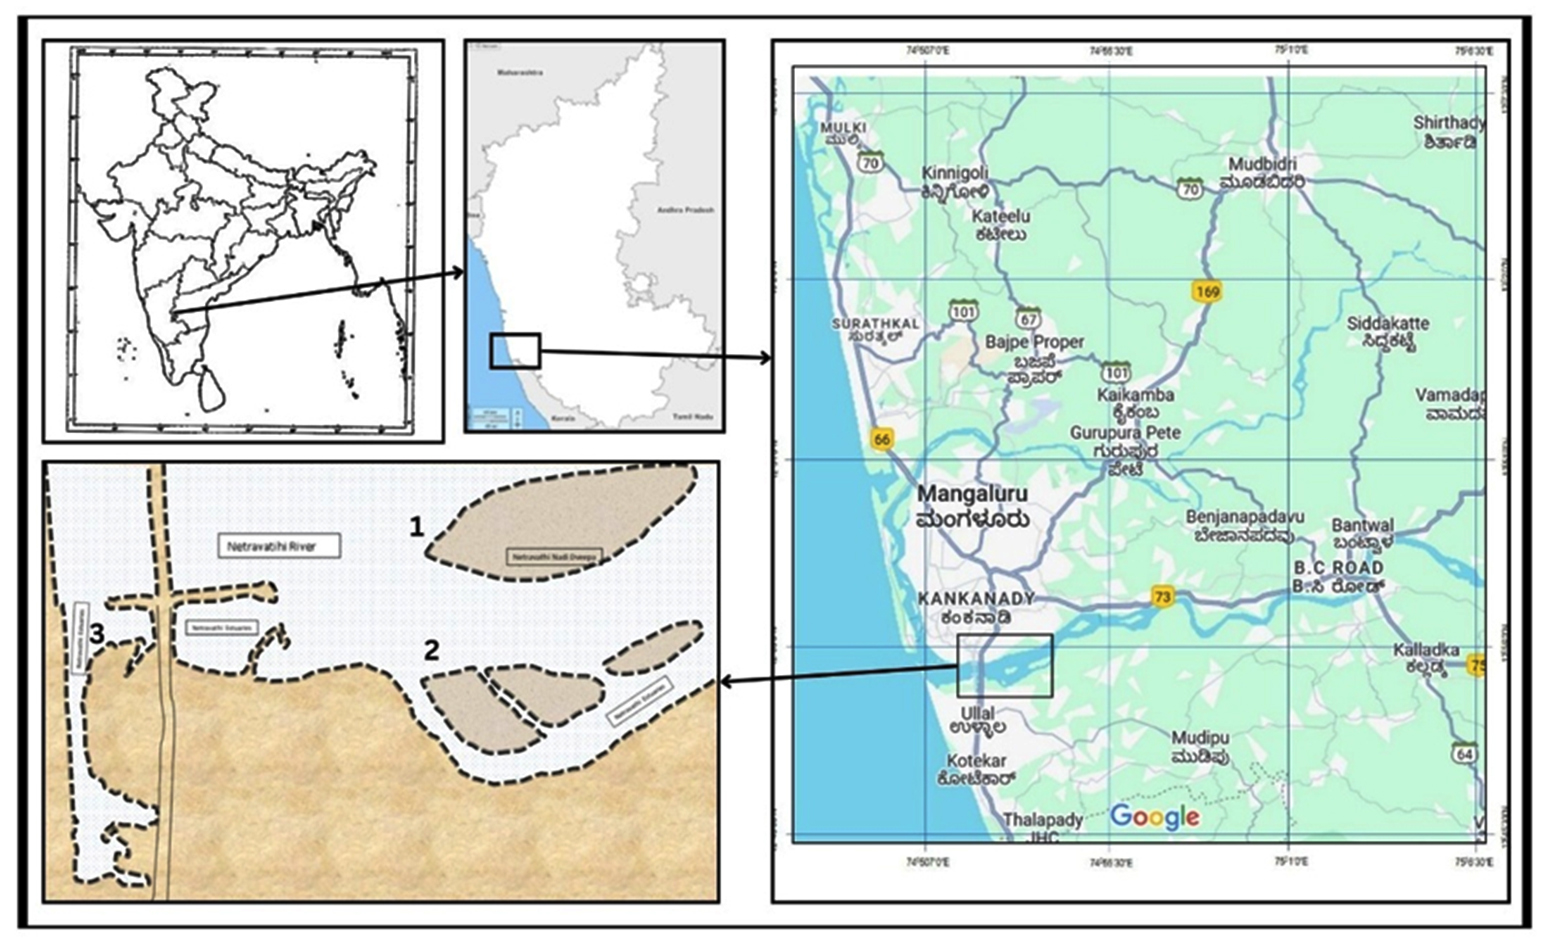
Figure 1. The graphical representation of the sampling sites along the River Netravathi, Mangaluru, Dakshina Kannada District, State of Karnataka, India. 1 = NRE-1, 2 = NRE-2 and 3 = NRE4
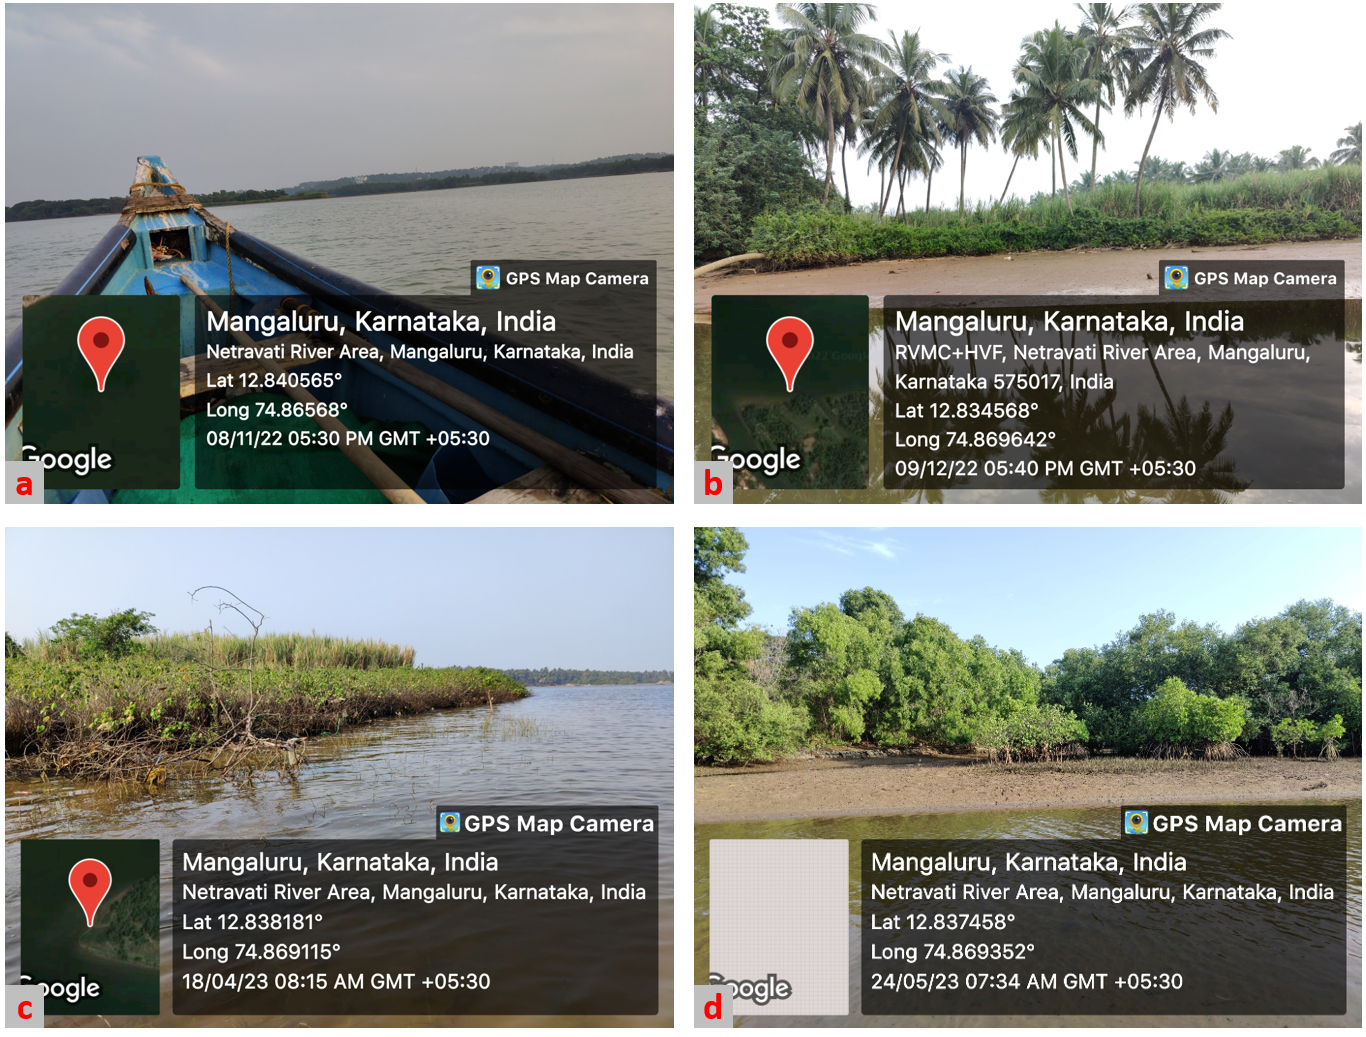
Figure 2. Geographical location of the sampling places in the Netravathi River Estuaries (NRE); (a) NRE; (b) NRE-1, (3) NRE-2 and (d) NRE-3
One sampling location was chosen from the three designated sites, NRE-1, NRE-2, and NRE-3, and sampling was conducted six times, from December to May, after the monsoon season. During the monsoon period, intensified riverine flow rendered sampling at NRE-1 and NRE-2 hazardous, consistent with observations of elevated hydrodynamic disturbance in the estuarine systems during high-discharge events.24 The less disturbed habitat NRE-2 and undisturbed NRE-3 may have created more stable physicochemical conditions, potentially favoring the pigmented heterotrophic bacteria (PHB) (Table 2).25,26 In contrast, NRE-1 exhibited pronounced fluctuations in water influx driven by continuous monsoon discharge, which likely contributed to the comparatively lower PHB recorded.
Table 2. Characteristics of samples collected from the Netravathi estuaries, Mangaluru, Karnataka, India
No. |
Location |
Temp. |
pH |
Salinity |
|---|---|---|---|---|
1. |
Location 1 |
31.2 °C |
6.8 |
32.11 ppm |
2. |
Location 2 |
28 °C |
7.6 |
53 ppm |
3. |
Location 3 |
29.3 °C |
6.8 |
83 ppm |
Total viable count of bacteria
Estuarine sediment and water samples were plated onto four standard bacteriological media, ZA, R-2A, NA, and TSA, each supplemented with salt substitutions, to simulate estuarine ionic conditions and facilitate the selective isolation of heterotrophic bacteria. The total viable count (TVC) of total heterotrophic bacteria (THB) enumerated across the three sampling locations (NRE-1, NRE-2, and NRE-3) is presented in Figure 2. The THB population was further resolved into non-pigmented heterotrophic bacteria (NPHB) and PHB (Figure 2; Table 3), reflecting a spatial gradient consistent with the differential physicochemical conditions observed across the sampling zones.
Table 3. The CFU abundance of THB and PHB in various locations of NRE
NRE-1 |
NRE-2 |
NRE-3 |
|
|---|---|---|---|
THB CFU |
1.351 × 10⁷ |
3.239 × 10⁶ |
6.028 × 10⁷ |
NPHB CFU |
1.25 × 10⁷ |
2.34 × 10⁶ |
5.03 × 10⁷ |
PHB CFU |
1.01 × 10⁶ |
8.99 × 10⁵ |
9.98 × 10⁶ |
PHB/NPHB% |
8.08% |
38.42% |
20.26% |
Assessment of colony-forming units (CFU log10/mL) across individual media revealed that TSA supported the highest proportion of cultivable bacteria (29%), followed by NA (27%) and R-2A (26%) and ZA (18%) (Figure 3a), suggesting that the nutrient-rich media favor the recovery of a broader heterotrophic bacterial community.27 The TVC of CFU log10/mL across different sampling locations is presented in Figure 3b.
Analysis of the total PHB fraction within the TVC demonstrated a marked spatial variation across the sampling locations (Table 3), indicating habitat-driven differences in the distribution of pigment-producing bacterial populations.26 The THB to PHB ratio varied considerably across the media: 16.07:11.08% for TSA, 13.62:6.99% for ZA, 16.13:9.74% for R-2A, and 16.11:10.29% for NA (Figure 3b). The notably elevated PHB recovery on R-2A may reflect the low nutrient composition of this oligotrophic medium, which is known to selectively enrich slow-growing, pigment-producing bacteria over fast-growing copiotrophic organisms.28 Despite these inter-media differences in PHB proportions, CFU counts did not exhibit statistically significant variation across the four media, suggesting broadly comparable culturability under the tested conditions. Of the THB recovered, 61.92% were classified as NPHB and 38.10% as PHB, highlighting the considerable pigment-producing potential of the NRE bacterial communities.
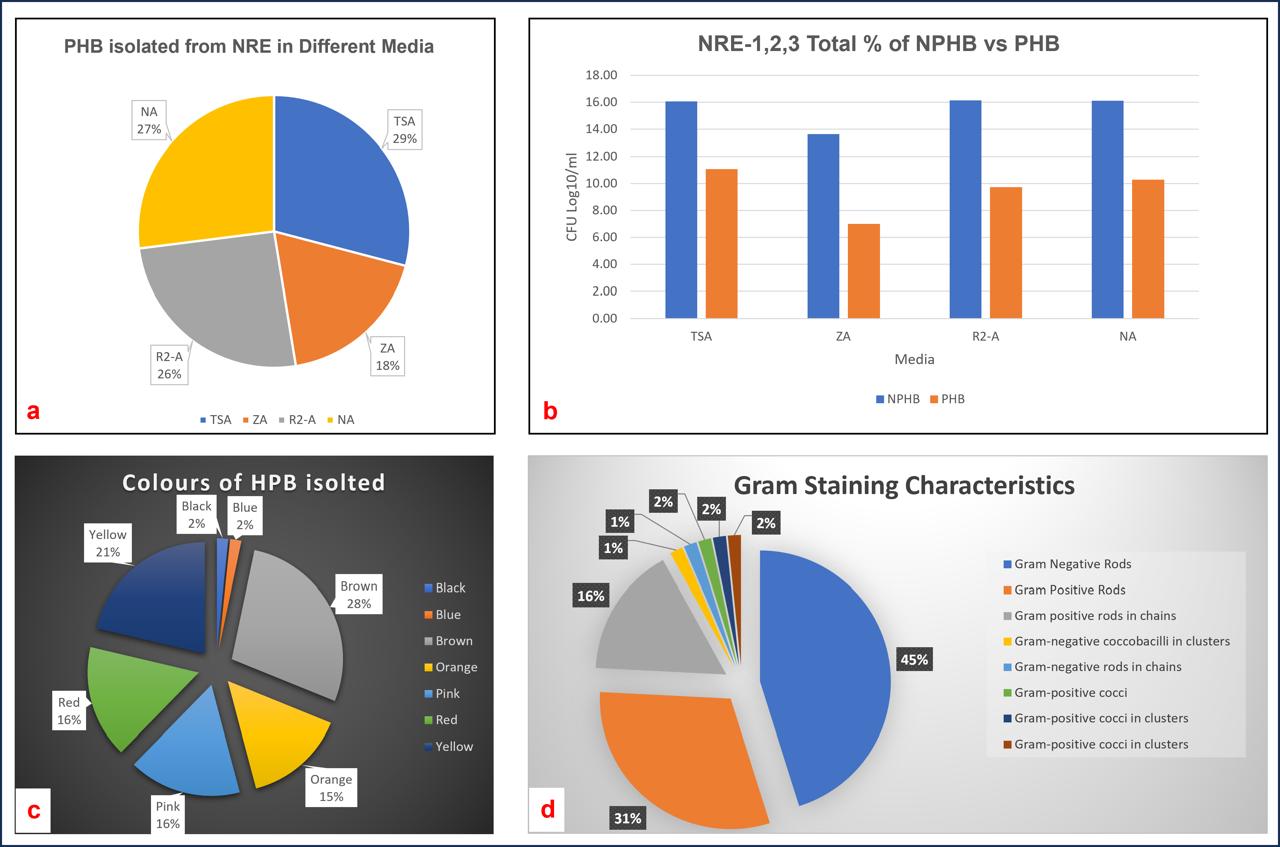
Figure 3. Graphical representation of PHB in different media: PHB vs NPHB, colour and Gram staining characteristics
(a) Total percentage of PHB in CFU log10/ml isolated in different media such as NA, TSA, R-2A, and ZA. (b) PHB vs NPHB frequency of isolation in different locations, values based on CFU log10/ml. (c) Colours of PHB isolated in percentage (d) Gram staining characteristics of the pigmented bacteria in percentage
Total pigmented heterotrophic bacteria
Analysis of the total CFU log10/mL of the PHB in four different media is shown in Table 4. A comparative analysis of the percentages of THB CFU and PHB for individual estuaries revealed that NRE-1 had 8.08%, NRE-2 had 38.426%, and NRE-3 had 20.26% (Table 3). Du et al.29 in their study on the isolation of PHB in the marine environments of the Yangtze River Estuary, East China Sea, and Eastern Tropical North Pacific Ocean, found the CFU/PHB percentage ranged from 17.22%-39.60%. The results for NRE-2 and NRE-3 are consistent with the aforementioned findings. Therefore, the percentage of PHB in the NRE shows a significant and consistent presence of PHB.
Table 4. The CFU of total THB isolated from NRE
TSA |
ZA |
R2-A |
NA |
Total |
|
|---|---|---|---|---|---|
NRE-1 |
2.45 × 10⁶ |
1.62 × 10⁶ |
4.88 × 10⁶ |
3.53 × 10⁶ |
1.25 × 10⁷ |
NRE-2 |
7.68 × 10⁵ |
3.83 × 10⁵ |
0.00 |
1.19 × 10⁶ |
2.34 × 10⁶ |
NRE-3 |
1.08 × 10⁷ |
3.05 × 10⁶ |
1.49 × 10⁷ |
5.85 × 10⁶ |
3.47 × 10⁷ |
THB isolated |
4.95 × 10⁷ |
Table 5. The CFU of total PHB isolated on different media
TSA |
ZA |
R2-A |
NA |
Total |
|
|---|---|---|---|---|---|
NRE-1 P |
2.40 × 10⁵ |
2.10 × 10⁵ |
2.30 × 10⁵ |
3.30 × 10⁵ |
1.01 × 10⁶ |
NRE-2 P |
3.29 × 10⁵ |
1.65 × 10⁵ |
0.00 |
4.05 × 10⁵ |
8.99 × 10⁵ |
NRE3-P |
2.44 × 10⁶ |
2.47 × 10⁵ |
3.50 × 10⁶ |
8.38 × 10⁵ |
7.03 × 10⁶ |
Total PHB isolated |
8.93 × 10⁶ |
The THB isolated is 4.95 × 10⁷ cells/mL (Tables 4 and 5), while it closely resembles the isolate literature of the Krka River estuary, which has recorded aerobic anoxygenic phototrophic bacteria (AAP) abundances of 23.45 × 10⁴ cells mL-1,30,31 AAP with 1.94 × 10⁵ cells mL-1 at the Pacific Ocean, and Heterotrophic bacterial abundance ranged from 1.57 × 10⁵ cells mL-1.32
Morphological analysis
The isolated pigmented bacteria belonged to seven different colors, with the maximum being brown (28%), followed by yellow (21%), red and pink (16% each), orange (15%), and 2% each of black and blue colonies (Figure 3c). Gram staining of the bacterial colonies revealed that 45% were Gram-negative, 31% were Gram-positive, and 16% were Gram-positive rods in chains. The other 1%-2% of the remaining 8% had varied characteristics and Gram reactions (Figure 3d).
Phylogenetic relatedness among pigmented bacteria
Phylogenetic analysis of the 16S rRNA gene sequences of the 20 pigmented bacterial isolates from the NRE revealed four major taxonomic groups spanning three bacterial phyla (Figure 4). The isolates were distributed across the phyla Proteobacteria (classes Alphaproteobacteria and Gammaproteobacteria, representing 65% of the total isolates), Actinomycetota, class Actinomycetes (30%), and Bacteroidota, class Chitinophagia (5%) (Table 6). Phylogenetic diversity reflects bacterial adaptability to diverse estuarine environments characterized by fluctuating salinity, nutrient availability, and redox conditions.33,34
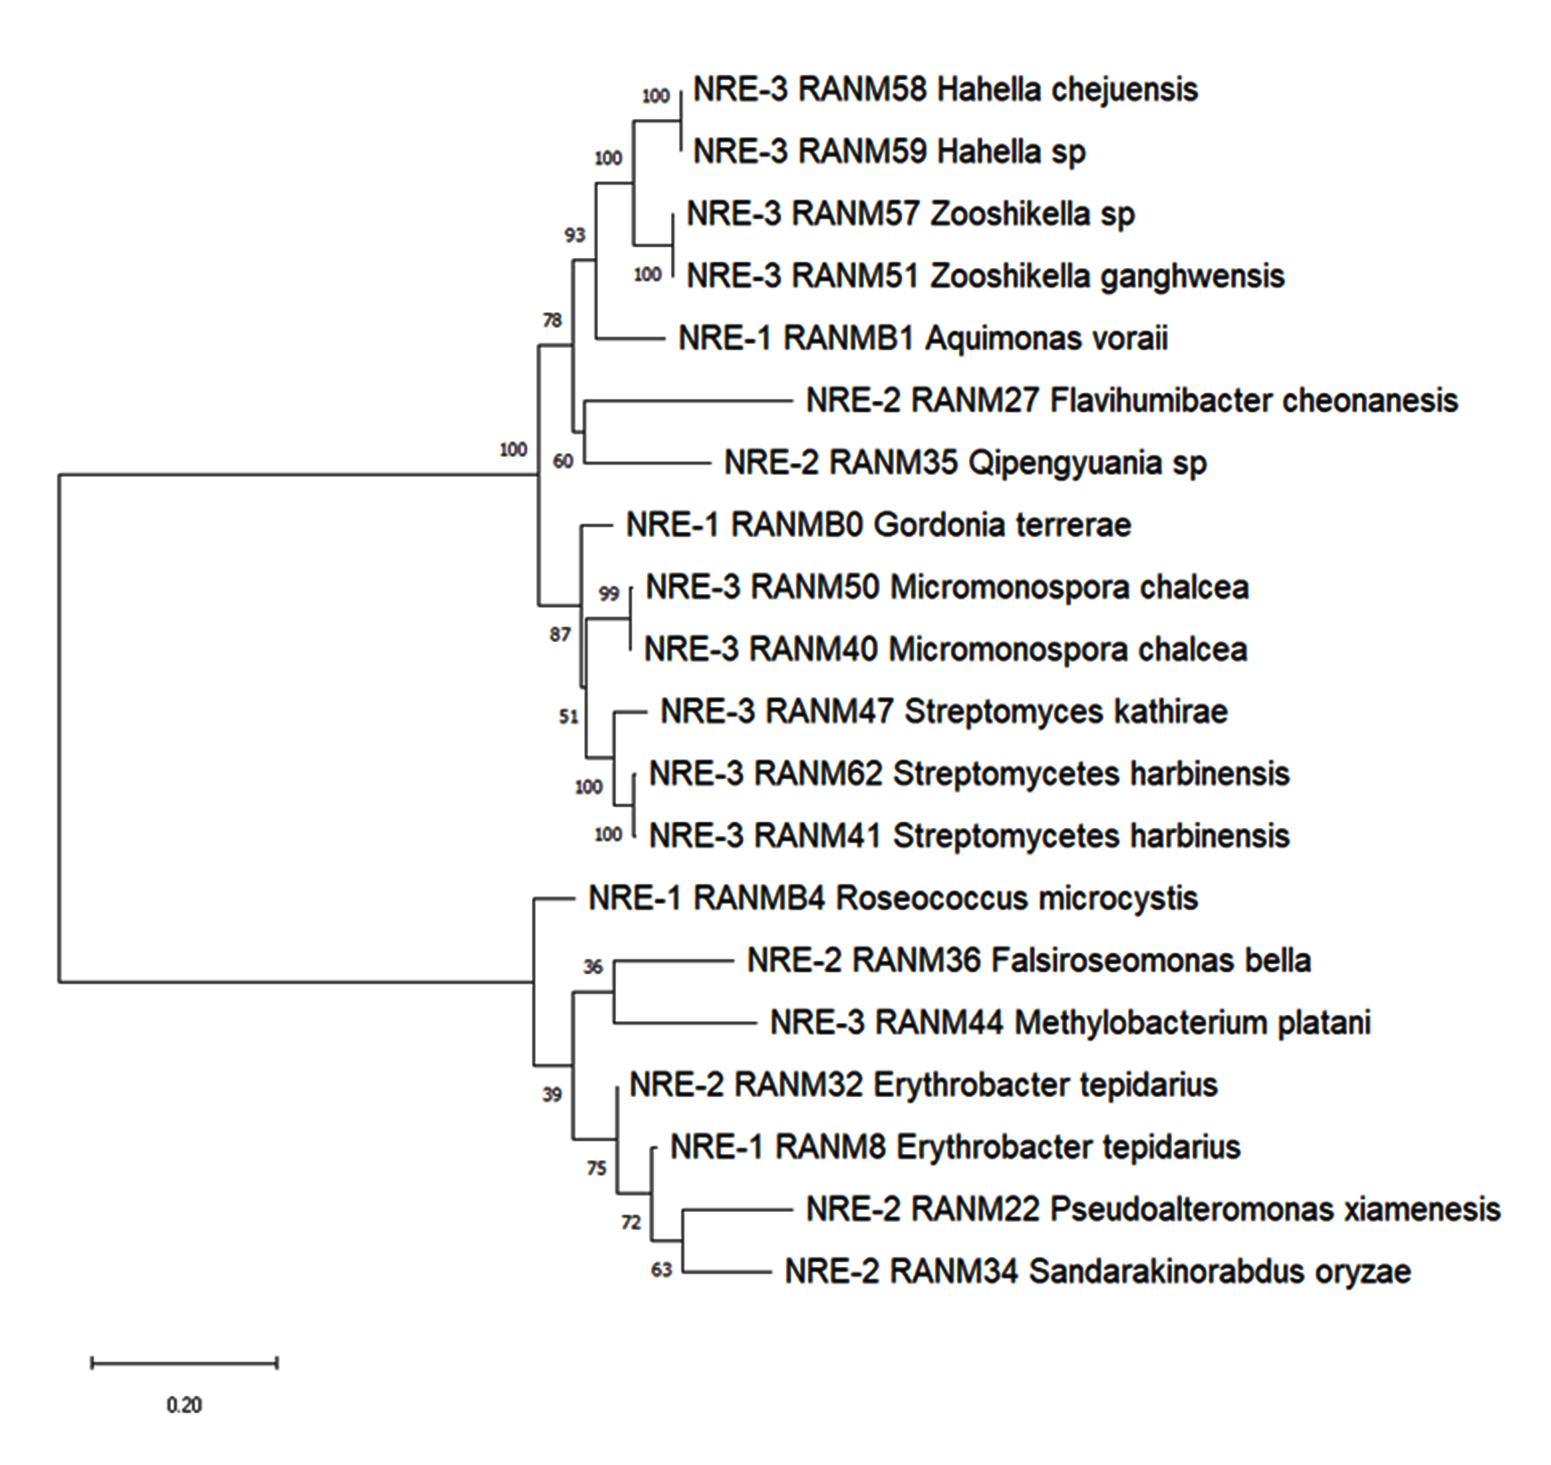
Figure 4. Neighbour joining method of phylogenetic tree constructed based on the area of isolation.
Note: The neighbour-joining (NJ) Method is a distance-based method that connects the smallest genetic difference with a star-like tree and iteratively pairs the “neighbours” until a fully resolved tree is formed. The bootstrap values are displayed at the nodes, providing statistical support for the grouping or clade. The phylogenetic tree is constructed based on the location from which the organism is isolated. The scale bar, representing 0.20, corresponds to the genetic distance, measured by branch length, which is equivalent to nucleotide substitutions per site. The tree shows a bifurcation at its root, dividing all the strains into two main superclades, indicating significant evolutionary divergence
Table 6. Details of isolated pigmented bacteria
No. |
Pigmented Bacterial Strain |
colour |
Family |
Identified as |
Sequence similarity % |
GenBank accession Number |
|---|---|---|---|---|---|---|
1 |
RANM27 |
Yellow |
Chitinophagaceae |
Flavihumibacter cheonanesis |
99.377 |
OR835444 |
2 |
RANM50 |
Brown |
Micromonosporaceae |
Micromonospora chalcea |
99.86 |
OR841111 |
3 |
RANM40 |
Brown |
Micromonospora chalcea |
99.86 |
ND |
|
4 |
RANM47 |
Yellow |
streptomycetaceae |
Streptomyces kathirae |
99.72 |
OR842306 |
5 |
RANM41 |
Brown |
Streptomyces harbinensis |
99.05 |
ND |
|
6 |
RANM61 |
Brown |
Streptomyces harbinensis |
99.05 |
ND |
|
7 |
RANMB1 |
Red |
Gordoniaceae |
Gordonia terrerae |
100 |
OR841335 |
8 |
RANM57 |
Magenta |
Zooshikellaceae |
Zooshikella sp. |
99.513 |
OR841272 |
9 |
RANM51 |
Magenta |
Zooshikella ganghwensis |
99.5 |
OR841273 |
|
10 |
RANM59 |
Magenta |
Hahellaceae |
Hahella chejuensis |
100 |
OR841274 |
11 |
RANM58 |
Magenta |
Hahella |
100 |
ND |
|
12 |
RANM22 |
Magenta |
Pseudoalteromonadaceae |
Pseudoalteromonas xiamenensis |
98.94 |
OR540729 |
13 |
RANMB0 |
Brown |
Rhodanobacteraceae |
Aquimonas voraii |
99.21 |
OQ372962 |
14 |
RANM36 |
Red |
Erythrobacteraceae |
Falsiroseomonas bella |
96.50 |
ND |
15 |
RANMB8 |
Orange |
Erythrobacter sp. |
99.16 |
OR841334 |
|
16 |
RANM32 |
Orange |
Erythrobacter tepidarius |
99.76 |
ND |
|
17 |
RANM35 |
Yellow |
Qipengyuania sp. |
95.16 |
JAVBXE 000000000 |
|
18 |
RANMB4 |
Red |
Acetobacteraceae |
Roseococcus microcystis |
97.1 |
OR841318 |
19 |
RANM44 |
Pink |
Methylobacteriaceae |
Methylobacterium platani |
99.712 |
ND |
20 |
RANM34 |
Brown |
Sphingosinicellaceae |
Sandarakinorhabdus oryzae |
98.52 |
OR841082 |
Within the class Alphaproteobacteria (35% of isolates), seven genera were identified, all belonging to the family Erythrobacteraceae: Erythrobacter (formerly Porphyrobacter), Qipengyuania, Sandarakinorhabdus, Roseomonas, Falsiroseomonas, Roseococcus, and Methylobacterium35,36 The class Gammaproteobacteria (30% of isolates) comprised four genera from multiple families within the orders Oceanospirillales and Alteromonadales: Zooshikella, Hahella, Pseudoalteromonas, and Aquimonas.37 The class Actinomycetes (30% of isolates) was represented by three families: Micromonosporaceae (Micromonospora chalcea), Streptomycetaceae (Streptomyces kathirae, S. harbinensis), and Gordoniaceae (Gordonia terrae).38 A single isolate (5%) belonged to the class Chitinophagia (genus Flavihumibacter cheonanensis) within the phylum Bacteroidota.39
The maximum-likelihood phylogenetic tree was resolved into two major clusters, each with a distinct evolutionary history and ecological association (Figure 4). Bootstrap analysis performed with 1,000 replicates provided quantitative support for nodal relationships, with values >70% considered reliable, >95% indicating strong support, and 50%-70% representing moderate support.40
The upper cluster comprised members of the class Gammaproteobacteria, phylum Actinobacteria, and family Chitinophagaceae (phylum Bacteroidota), suggesting convergent ecological strategies despite distant phylogenetic origins. Within this cluster, strains RANM58 and RANM59 exhibited strong phylogenetic affinity (bootstrap >95%) within the Hahella and Zooshikella clades, respectively, both isolated from sampling site NRE-3. Strain RANM59 showed 100% 16S rRNA gene sequence similarity to Hahella chejuensis, a known producer of prodigiosin analogs and exopolysaccharides.41 The tight clustering of RANM57 and RANM51 (bootstrap >90%) within the Zooshikella clade, also from NRE-3, further reinforced the site-specific phylogenetic structure.
Hahella and Zooshikella displayed a shared ancestor (bootstrap >85%), indicating an evolutionary trajectory within the family Hahellaceae.37 This clade is metabolically versatile and capable of producing secondary metabolites that are advantageous in estuarine environments. Strain RANMB1, identified as Aquimonas voraii with moderate bootstrap support (65%), occupied an outgroup position within Gammaproteobacteria, reflecting its phylogenetic distance from the Hahellaceae clade and its distinct ecological niche as a brown pigmented, potentially oxidative stress-adapted bacterium.34
Strains RANM27 and RANM35 formed a moderately supported, distinct branch (bootstrap 68%) within the upper cluster and isolated from NRE-2. RANM35, identified as Qipengyuania sp., produces yellow carotenoid pigments with absorption peaks at 454 and 482 nm, characteristic of the family Erythrobacteraceae.36 However, its placement in the upper cluster alongside Gammaproteobacteria suggests either phylogenetic reconstruction artifacts due to horizontal gene transfer or long-branch attraction, warranting further genomic analysis.
The Actinobacteria representatives in this cluster included strain RANM47, which formed a clearly identifiable Streptomyces clade with solid bootstrap support (>80%). Streptomyces kathirae RANM47 produces actinorhodin, a blue polyketide antibiotic, with yellow colony pigmentation, which reflects the renowned biosynthetic capacity of the genus.42 Strains RANM62 and RANM41 exhibited strong clustering (bootstrap >88%), whereas the Streptomyces clade as a whole showed robust support. The Micromonospora and Streptomyces clades demonstrated less support (bootstrap 55%-65%), but were well supported (bootstrap >75%) in their divergence from Gordonia terrae RANMB0, which produces orange carotenoid pigments and occupies a distinct phylogenetic position within the family Gordoniaceae.43
The lower cluster was dominated by members of the class Alphaproteobacteria, primarily from the family Erythrobacteraceae, reflecting the evolutionary radiation of this group in marine and estuarine environments.33 Strains RANM50 and RANM40 exhibited a close phylogenetic relationship (bootstrap >92%), suggesting recent divergence or shared ecological pressures. Strains RANM32 and RANMB8 formed a strongly supported pair (bootstrap >90%), with RANMB8 identified as Erythrobacter sp., a carotenoid producer with absorption peaks at 260 and 450 nm, indicative of bacteriochlorophyll a and carotenoid production.44
Strains RANM22 and RANM34 formed a moderately supported pair (bootstrap = 62%). RANM22, identified as Pseudoalteromonas xiamenensis, produced red pigmentation, whereas RANM34 (Sandarakinorhabdus oryzae) produced brown pigmentation, highlighting the diversity of pigment biosynthetic pathways, even within closely related lineages.45,46 Strains RANM44, RANMB4, and RANM36 occupied an early branching lineage within Alphaproteobacteria with uncertain relationships (bootstrap <50%), suggesting either rapid diversification or insufficient phylogenetic signals in the 16S rRNA gene to resolve deep nodes within this class.
Primary screening for bacterial growth
At the location NRE-1 among the three strains, RANMB8 recorded the highest cell density (YM ≈ 0.8494), despite exhibiting a lower K value (0.1146 hr-1) relative to RANMB1 (K = 0.1593 hr-1), which demonstrated the highest maximum specific growth rate within this group. RANMB0 exhibited the lowest YM (≈ 0.5149). RANMB8 and RANMB0 exhibited a lag phase of 9-12 hrs, whereas RANMB1 entered the exponential phase at 6-9 hrs. Gompertz model fit was excellent across all NRE-1 strains (R² = 0.9533-0.9824), confirming reliable parameter estimation (Figure 5a).
The three organisms chosen in the location NRE-2, where RANM35 achieved the highest cell density (YM ≈ 0.90-0.95; R² = 0.9787), while RANM27 recorded the highest K value (0.1904 hr-1; R² = 0.9551), indicating a faster but lower-yield growth trajectory. RANM36, however, yielded a markedly poor Gompertz fit (R² = 0.2737) with a negligible K value and minimal growth (YM ≈ 0.64) accounting for only ~27% of observed variance (Figure 5b).
At NRE-3, the organism RANM57 recorded the highest overall cell density across all nine strains (YM ≈ 1.162) with a moderate Gompertz fit (R² = 0.8710). RANM59 demonstrated the best model fit across the entire dataset (R² = 0.9902) but produced elevated levels of polysaccharides and reduced pigmentation, limiting its selection. RANM51 exhibited intermediate values (YM ≈ 0.8532; R² = 0.9187) (Figure 5c).
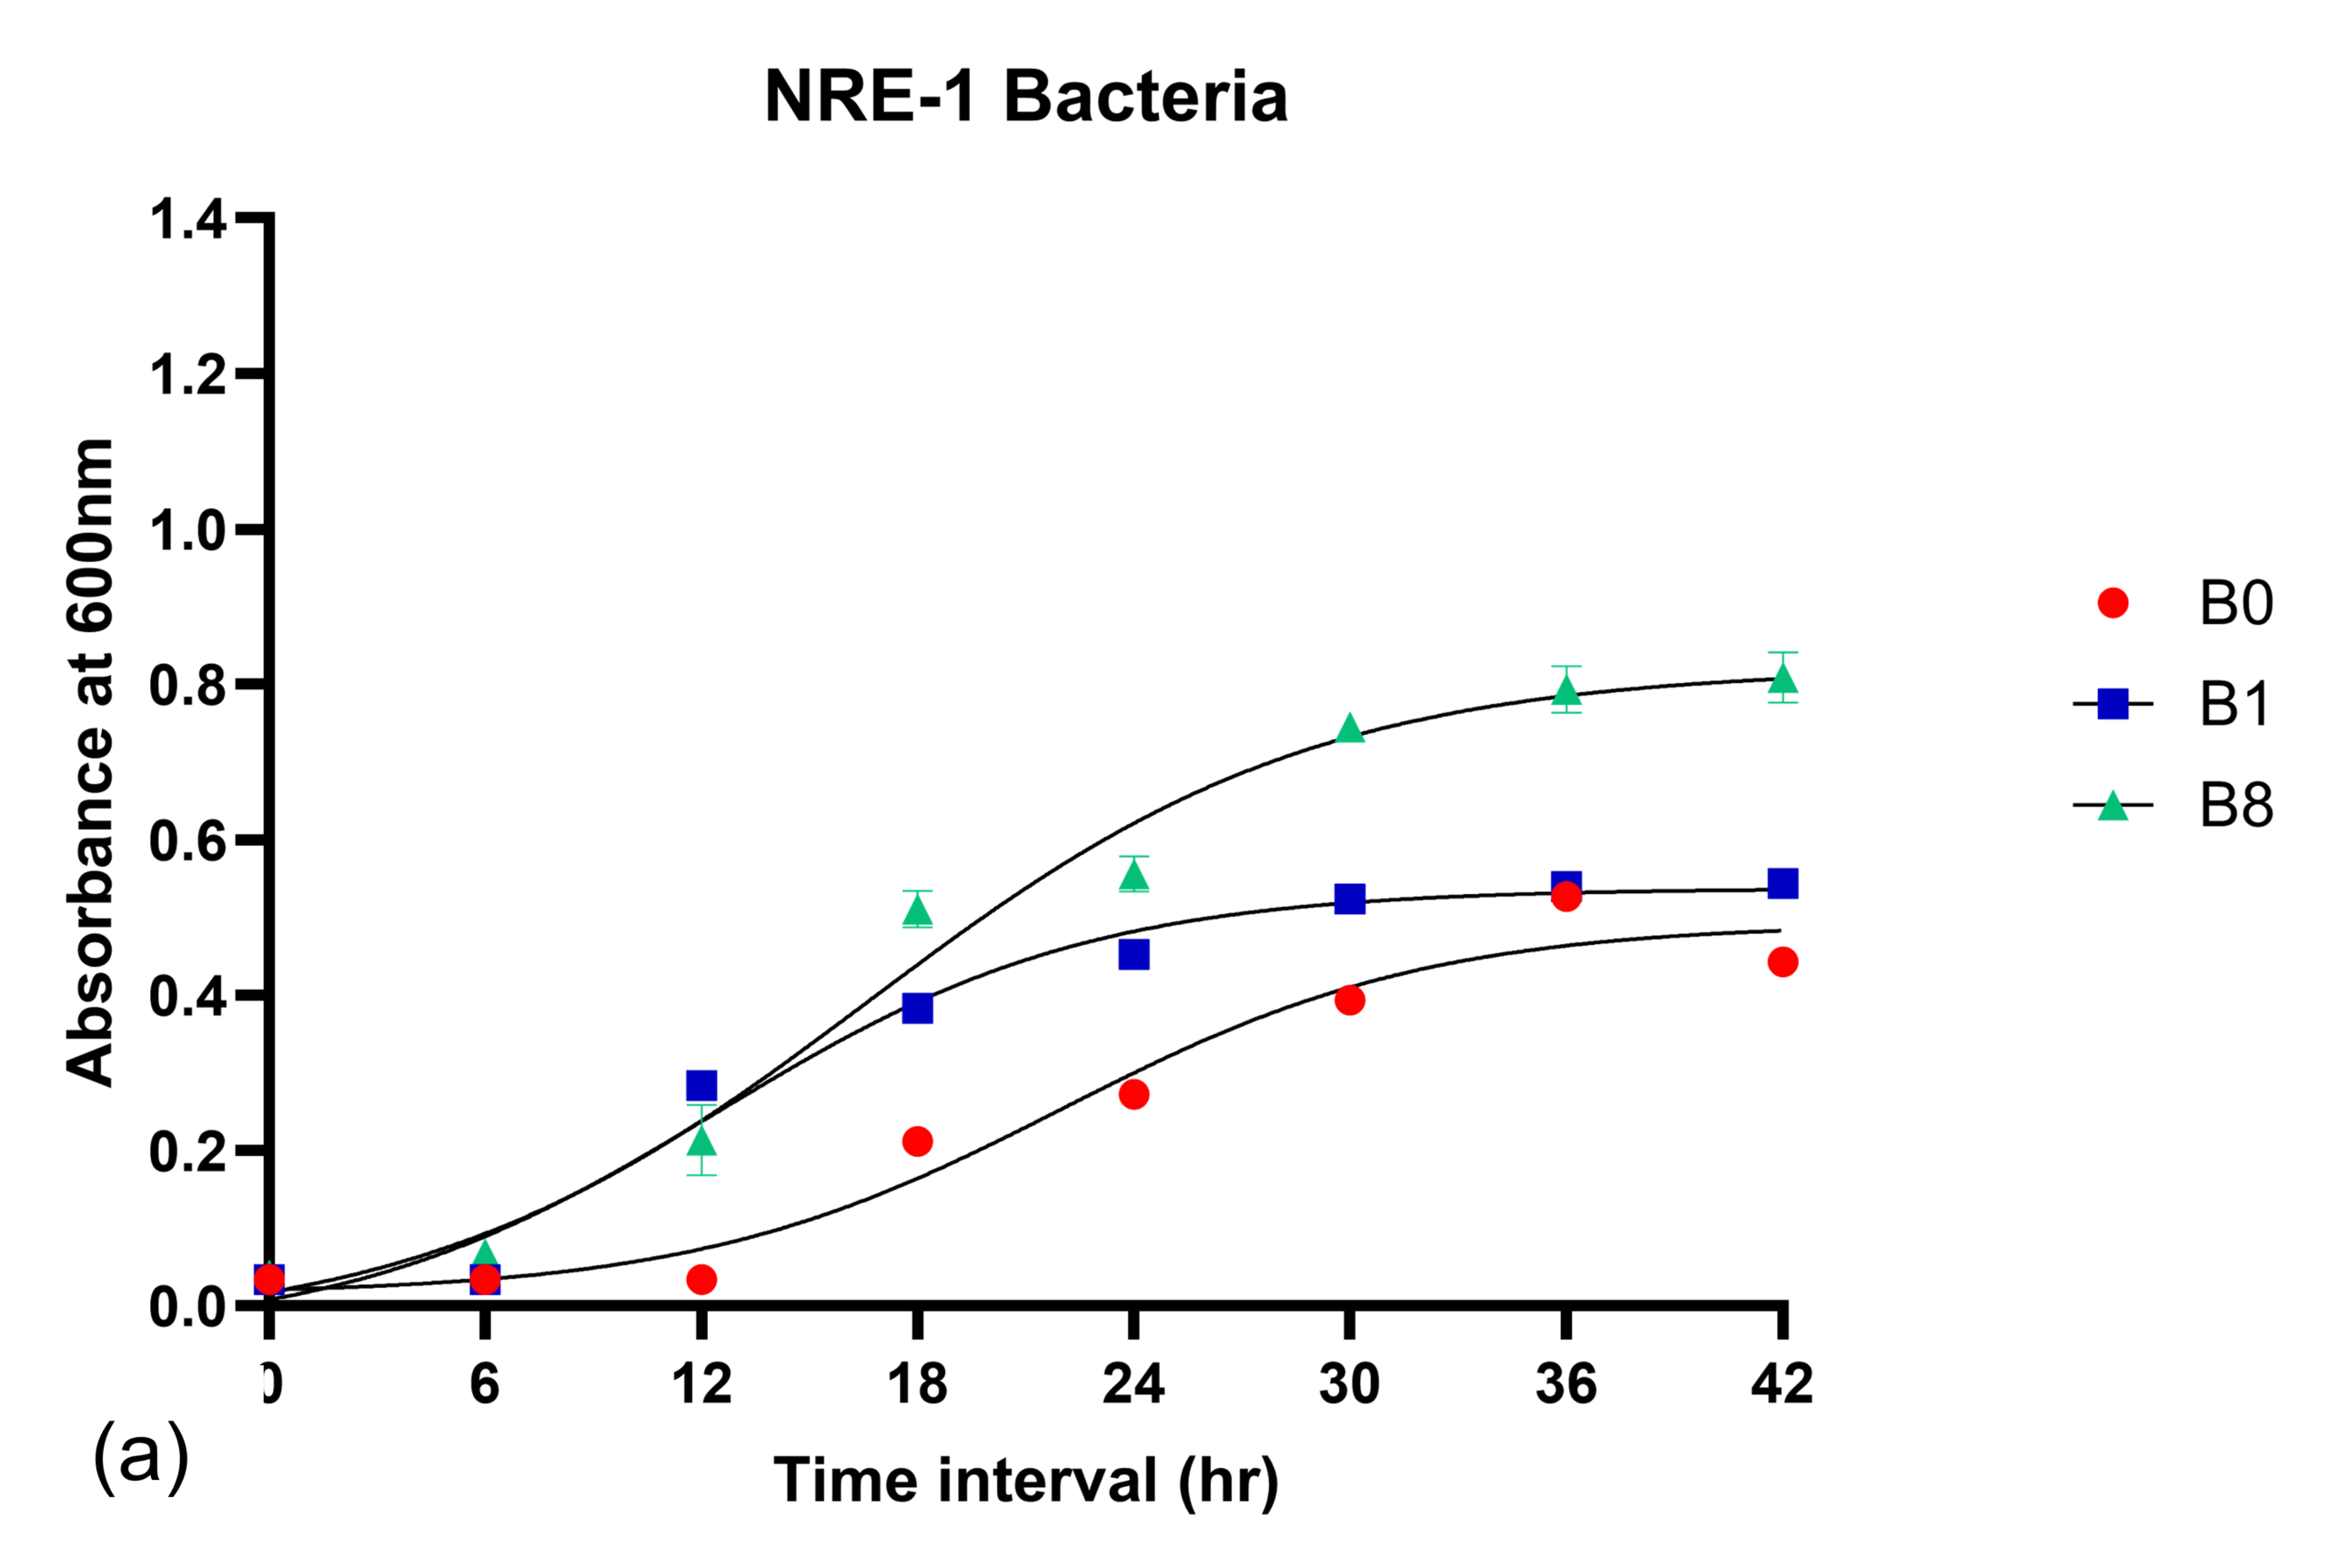
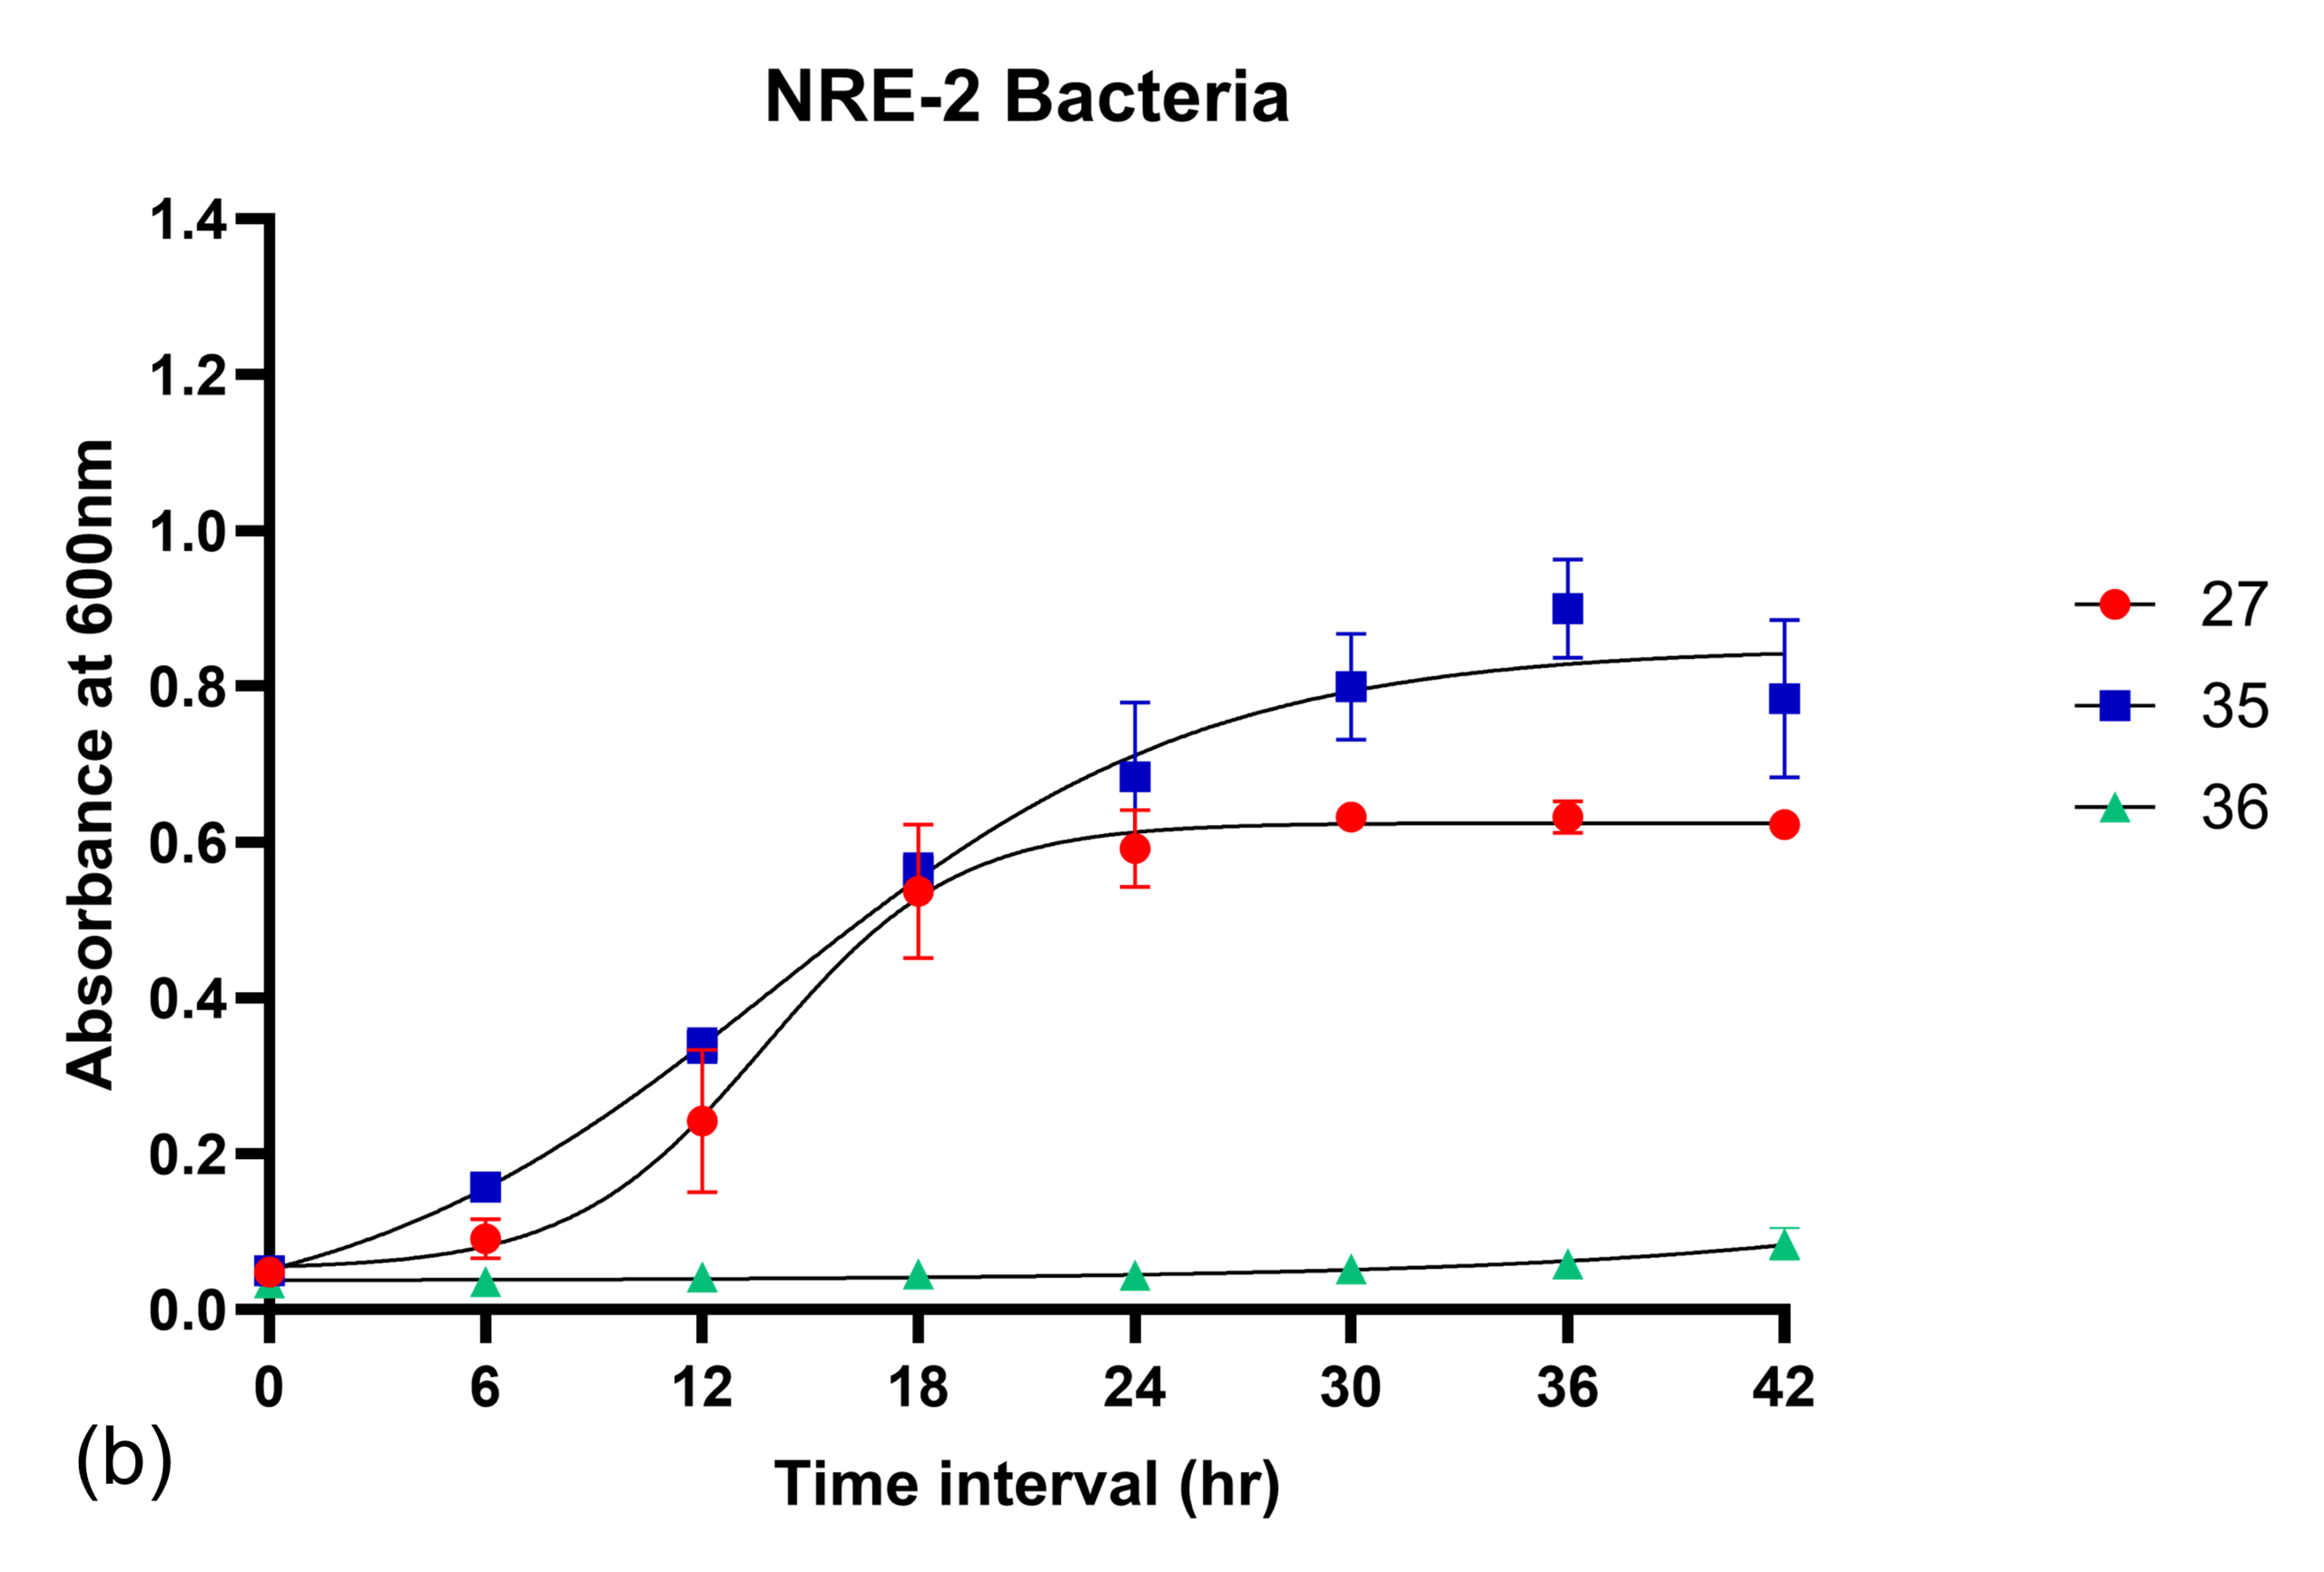
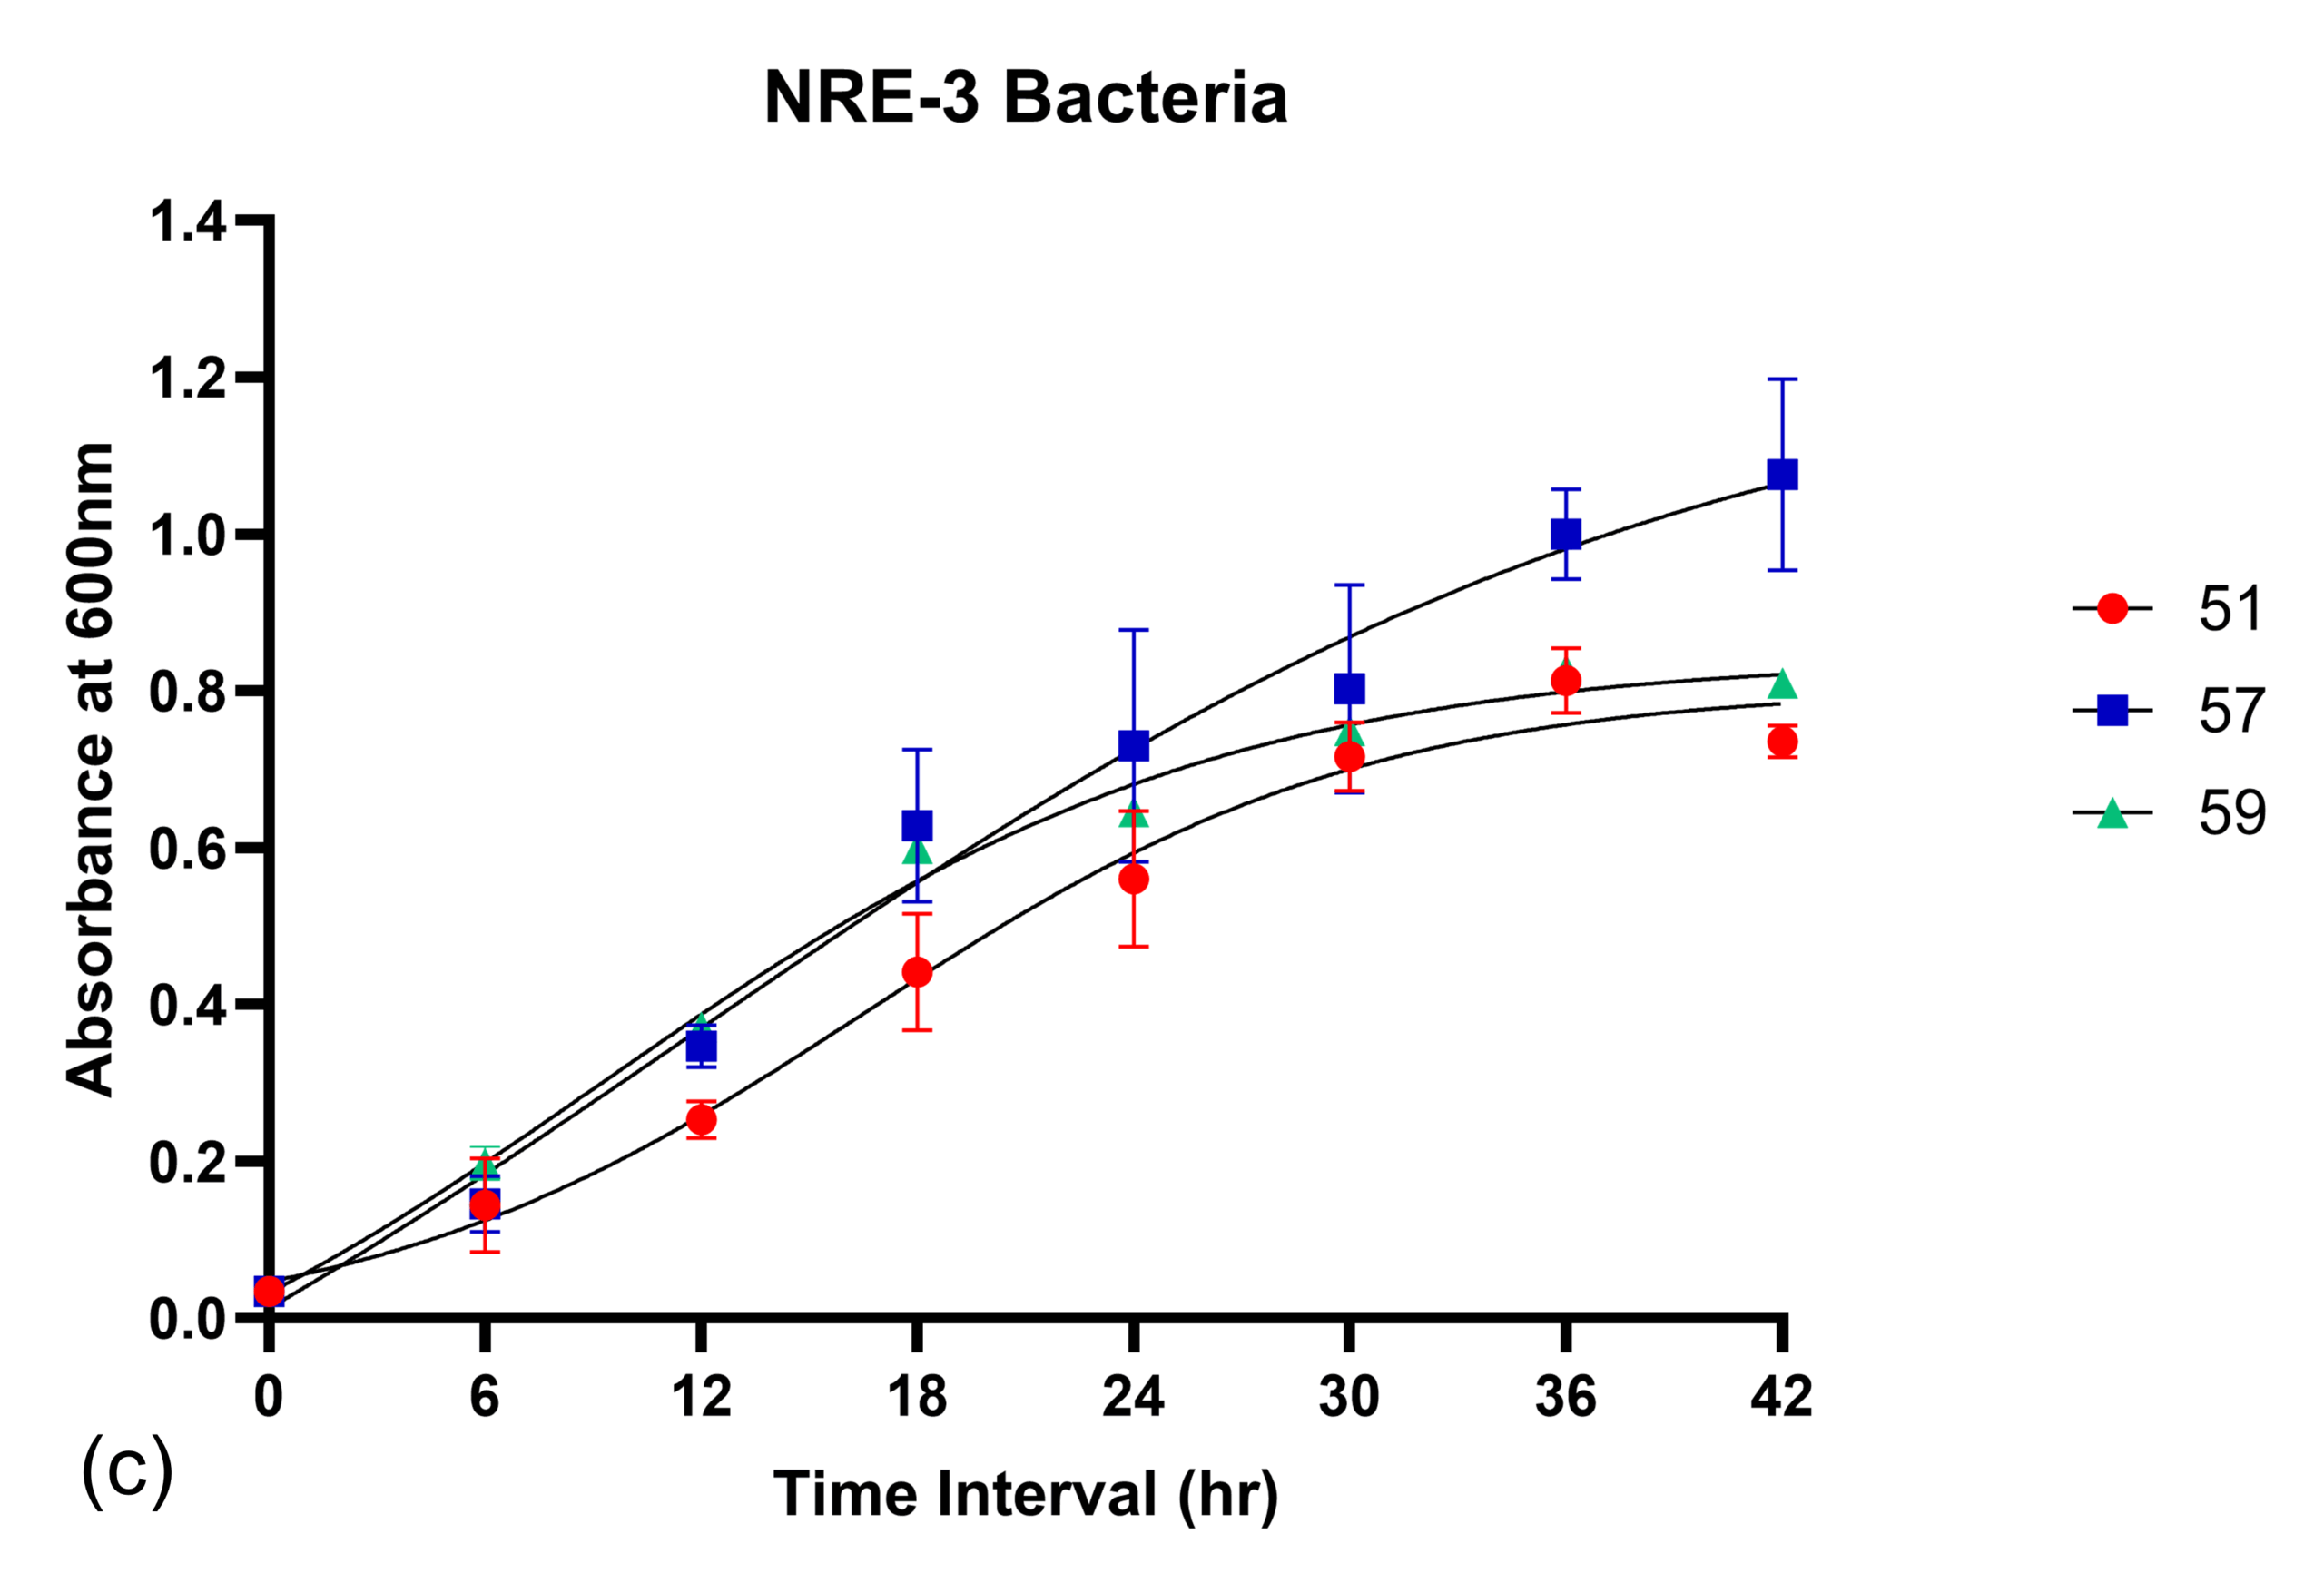
Figure 5. The growth curve is based on the absorbance and time interval of the bacteria isolated from three locations. The growth curve is based on the Gompertz model, which considers the absorbance and time interval of bacteria isolated from three locations. (a) G. terrerae RANMB1 (BI), A. voraii RANMB0 (B0) and Erythrobacter sp. RANMB8 (B8) chosen from NRE-1; (b) F. cheonanensis RANM27 (27), Qipengyuania sp. RANM35 (35), Falsiroseomonas sp. RANM36 (36) chosen from NRE-2; (c) Z. ganghwensis RANM51 (51), Zooshikella sp. RANM57 (57), H. chejuensis RANM59 (59) chosen from NRE-3
The Gompertz model provided a robust fit (R² > 0.87) for eight of the nine strains, validating its suitability for describing the sigmoidal growth dynamics of estuarine pigmented bacteria.20 The anomalously low R² value of RANM36 (0.2737) could be considered as the strain growing slowly, displaying non-sigmoidal growth or by asynchronous cell cycling, or belonging to the category of a viable but non-culturable state under the imposed culture conditions.47
Strain selection for downstream pigment characterization was based primarily on the YM values, with RANMB8 (R² = 0.9692), RANM35 (R² = 0.9787), and RANM57 (R² = 0.8710) identified as the most productive candidates. Although RANM57 exhibited the lowest K among NRE-3 strains (K ≈ 0.08151 hr-1), its superior final cell density (YM ≈ 1.162) and confirmed pigment production justified its selection over the higher-fitting but pigment-deficient RANM59.26
UV absorption
The UV absorption spectra of E. tepidarius RANMB8, Qipengyuania sp. RANM35, and Zooshikella sp. RANM57 were calculated by dissolving them in methanol and analyzing the λmax value through the absorption spectrum in the range of 300-800 nm. The absorption spectra of Zooshikella sp. RANM57 displayed two peaks (λmax: 303 nm, 542 nm) (Figure 6), indicative of the presence of prodigiosin. The absorption spectra of Qipengyuania sp. RANM35 exhibited four peaks (λmax: 224 nm, 271 nm, 457 nm, and 485 nm) (Figure 6), corresponding to pyocyanin. Erythrobacter sp. RANMB8 and Qipengyuania sp. RANM35 showed peaks between 430-490 nm, indicating they belong to the family of carotenoids, such as Zeaxanthin, and β-carotene peaks at 450-480 nm48-50 and the Zooshikella sp. RANM57 peaks with those of prodigiosin.
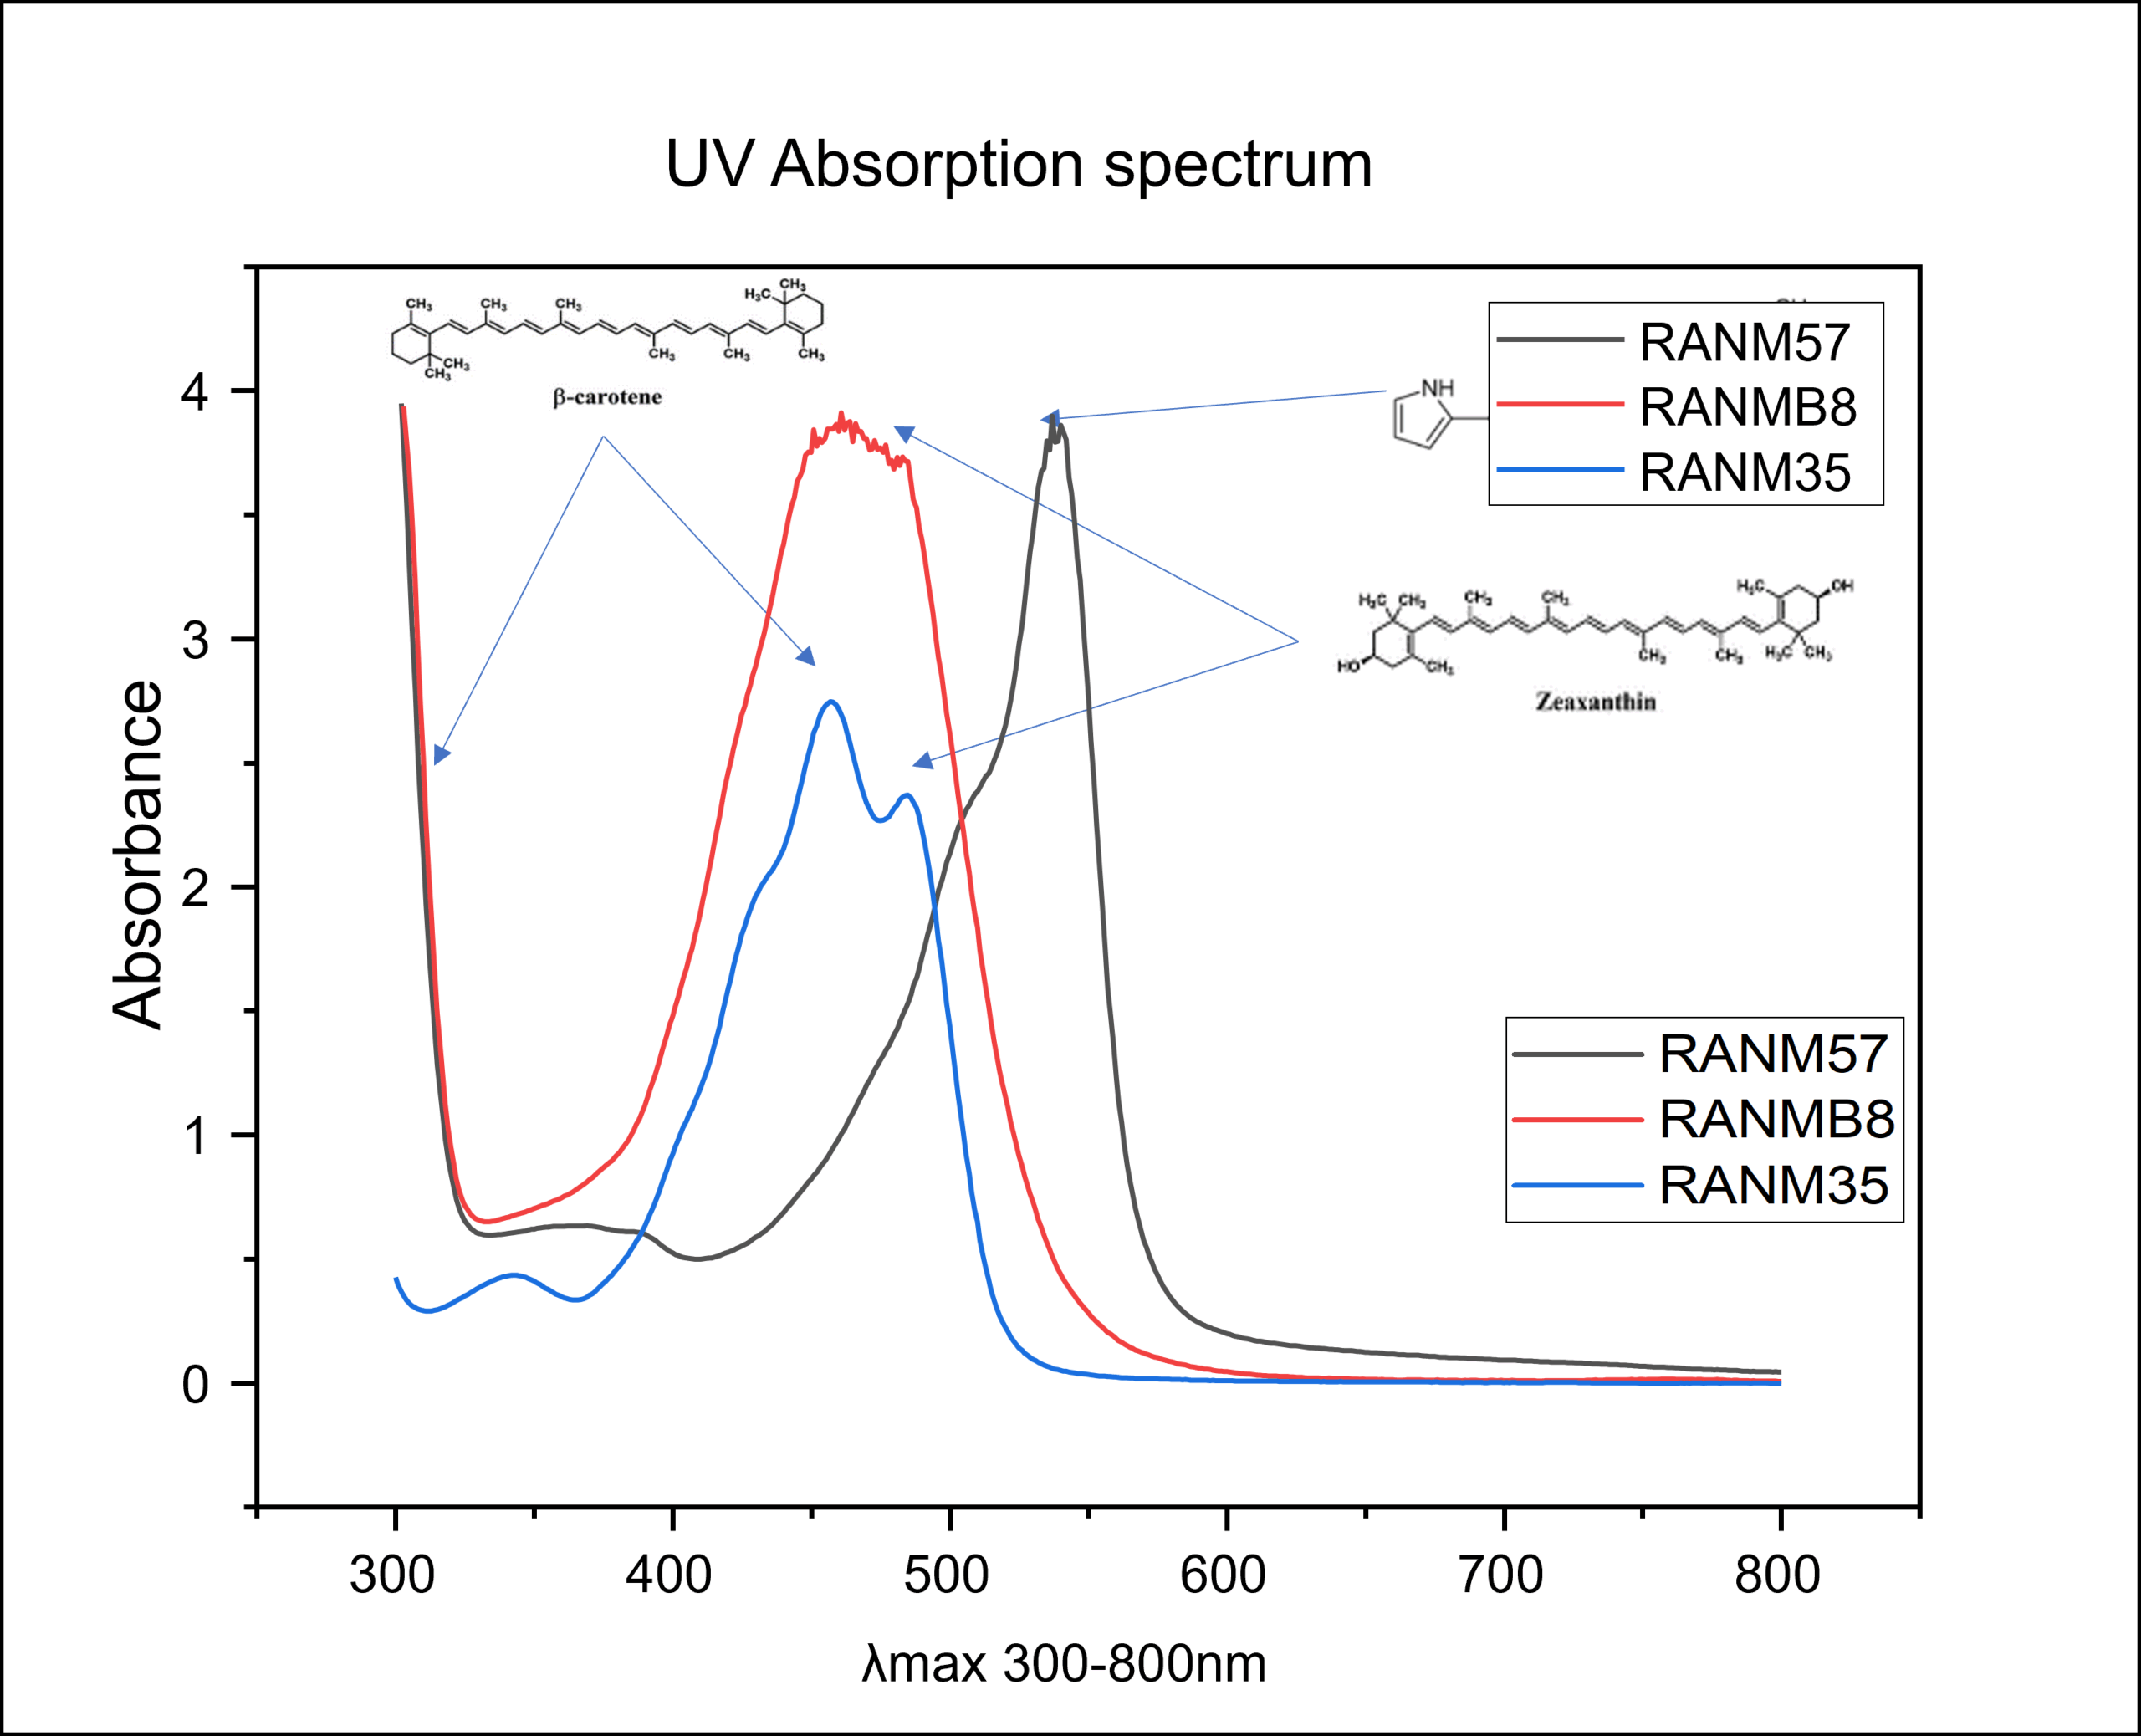
Figure 6. UV absorption spectrum of the dry pigment extract, λmax 300-800
FTIR spectrum analysis
Extracted and dried pigments of Qipengyuania sp. RANM35, Erythrobacter sp. RANMB8, and Zooshikella sp. RANM57 were analyzed using FTIR to identify a distinct signature in the fingerprint region (Figure 7). The spectra of Zooshikella sp. RANM57 showed 3339.41 cm-1 (stretching vibration of OH; suggesting the presence of water), 2945.62 cm-1 (asymmetric stretching vibration of CH3), 2834.05 cm-1 (symmetry stretching vibration of CH), 1650.49 cm-1 (1500-1660, C=C stretching), 1449.24-1411.52 cm-1 (1450-1480; asymmetric bending vibration of CH3), 1112.96, 1019.35 cm-1 (1000-1140; C-O stretching, C-O-C) 587.33 cm-1.51 The FTIR spectra of RANM57 matched that of the prodigiosin standard (Figure 7d).
The FTIR spectra of the carotenoid detected at different wavelengths, with β-carotene as a standard and astaxanthin and zeaxanthin, show a very sharp band at 1067 cm-1 and a peak at 966 cm-1, corresponding to the C=C stretching and vibration, respectively. The FTIR spectra of Erythrobacter sp. RANMB8 showed IR absorption at 3423.97 cm-1 (stretching vibration of OH; suggesting the presence of water), 2927.80-2867 cm-1 (asymmetric stretching vibration of CH2), 1718.25-1670.5 cm-1 (C=O stretching), 1451.04-1288.5 cm-1 (asymmetric bending vibration of CH3), 1000 cm-1 and 800 cm-1 (symmetry stretching vibration of CH), 1169.3-966.8 cm-1 (C-O stretching, C-O-C), and 756.50 cm-1 and 611.32 cm-1 fingerprint region.52-55 The structural confirmation by IR, in conjunction with the β-carotene standard and UV-visible analysis, suggests the presence of a pigment closely related to β-carotene in all aspects (Figure 7c).
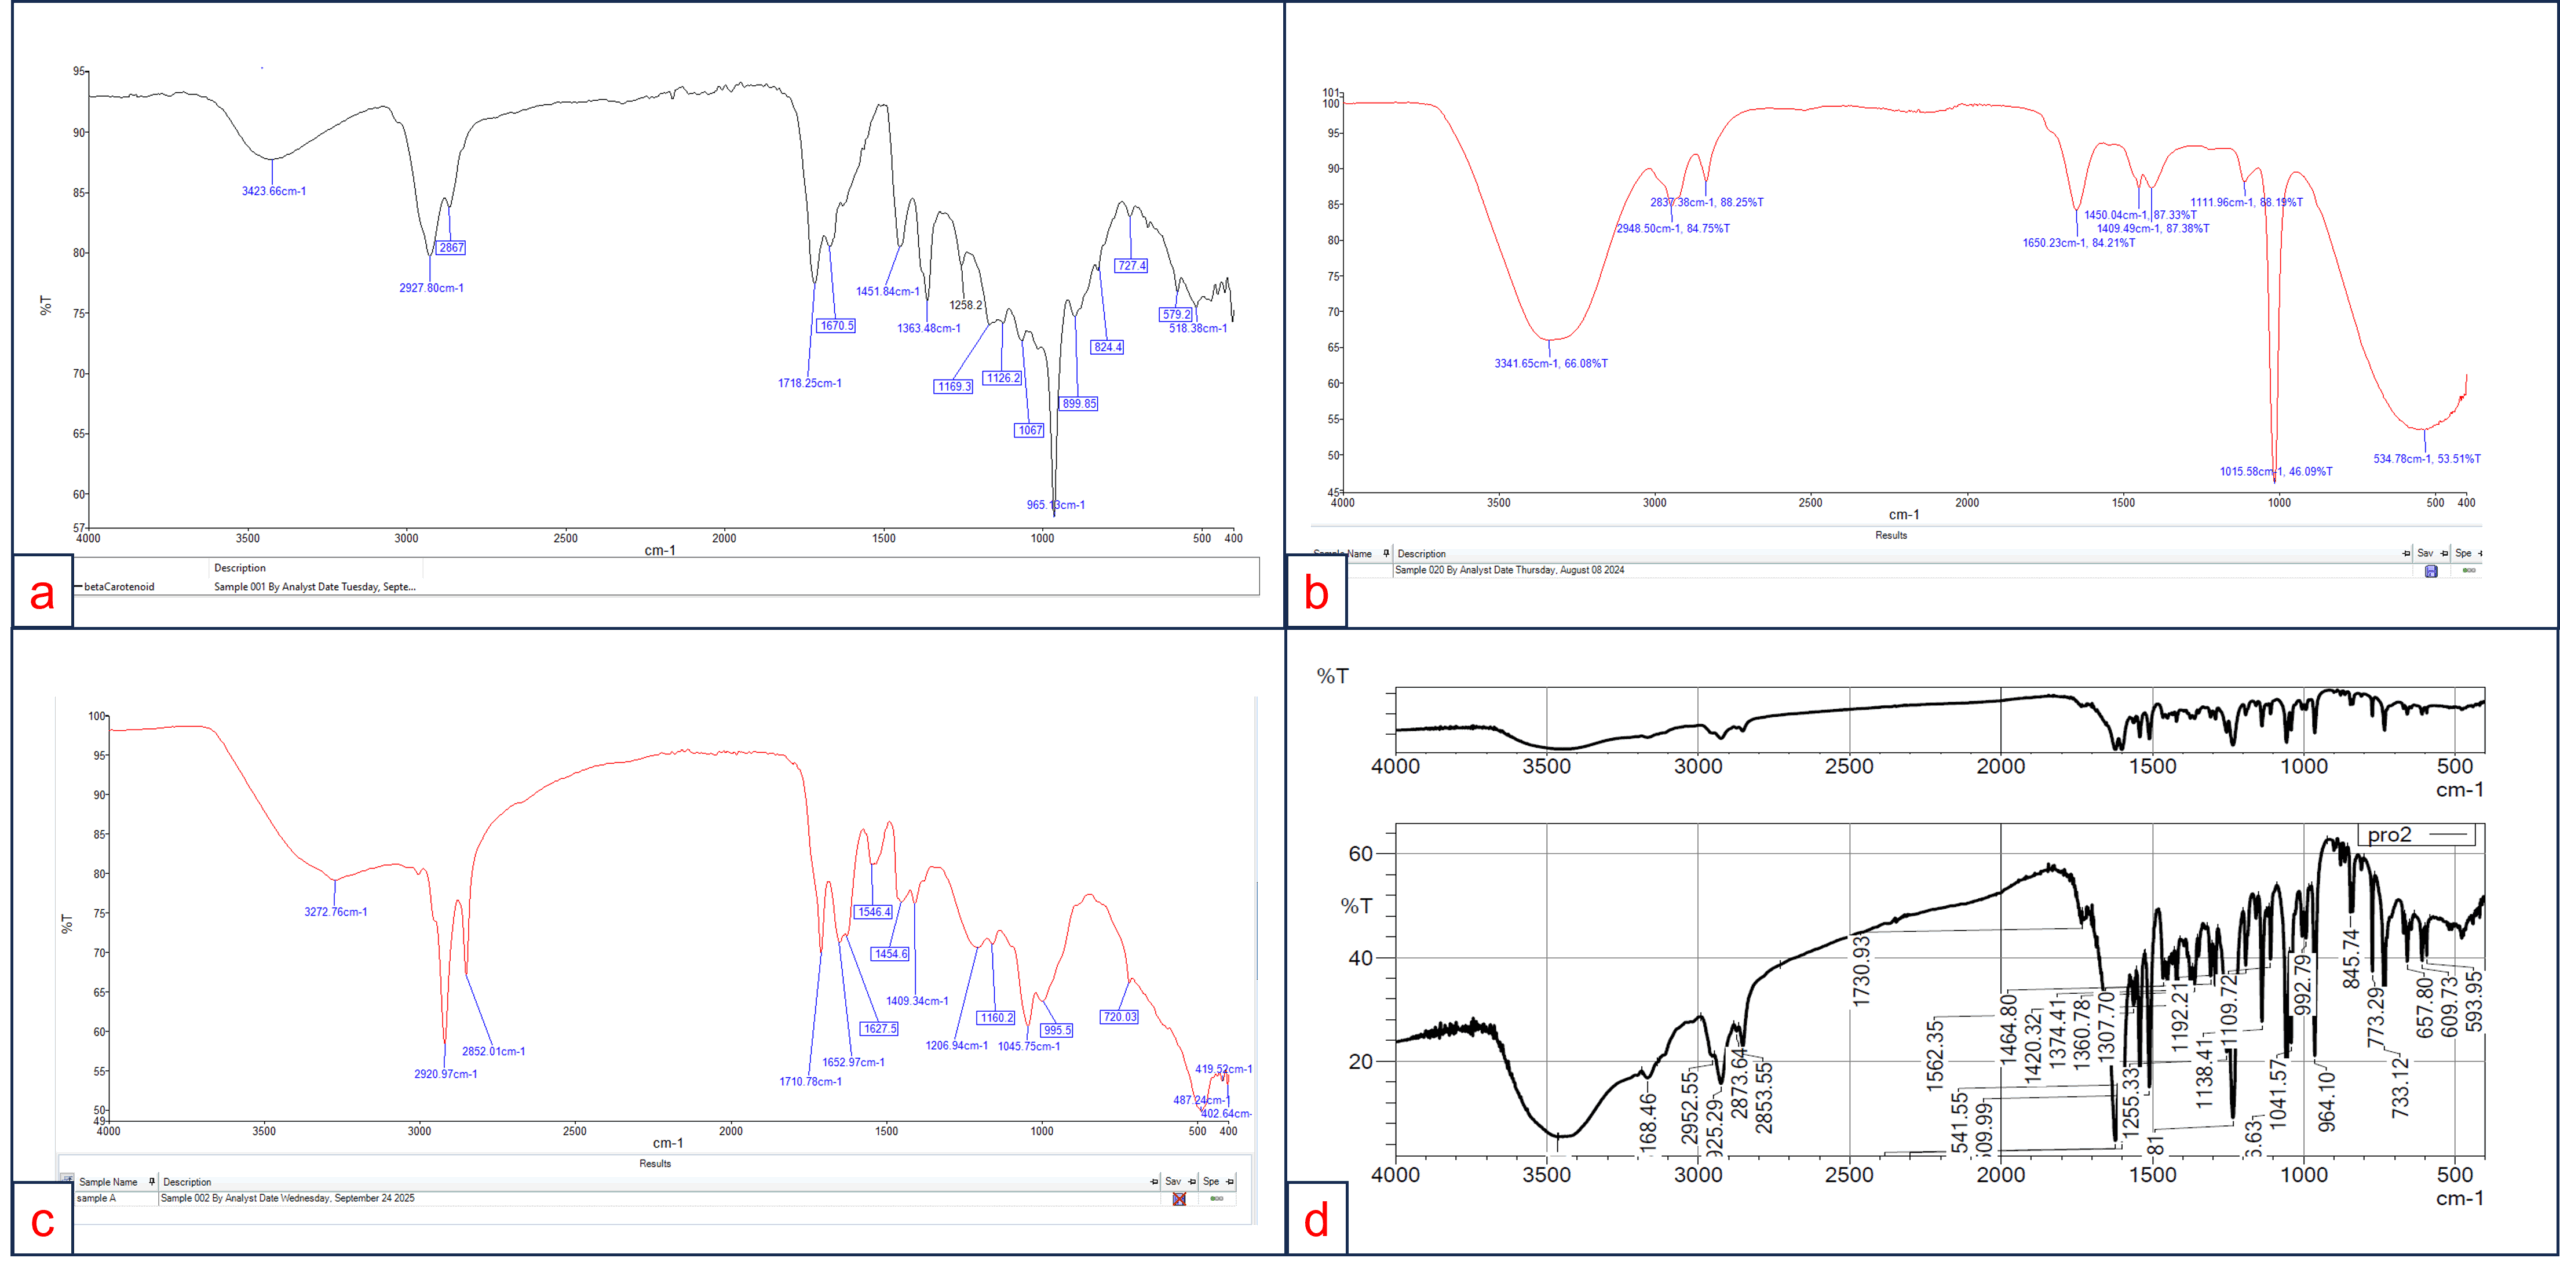
Figure 7. FTIR spectrum of the standard β-carotene and prodigiosin, and pigment extract.
(a) FTIR spectrum of standard β-carotene carotenoid standard. (b) FTIR spectrum of the dry pigment extract of Qipengyania sp. RANM35. (c) FTIR spectrum of the dry pigment extract of Erythrobacter sp. RANMB8. (d) FTIR spectrum of prodigiosin standard and dry pigment extract of Zooshikella sp. RANM57
The FTIR spectra of the extracted Qipengyuania sp. RANM35 showed IR absorption at 3341.65 cm-1, (stretching vibration of OH; suggesting the presence of water), 2948.50 cm-1 (asymmetric stretching vibration of CH3), 2837.28 cm-1 (symmetry stretching vibration of CH), 1650.23 cm-1 (1500-1660, C=C stretching), 1450.04-1409.49 cm-1 (1450-1480; asymmetric bending vibration of CH3), 1111.96 cm-1, 1015.58 cm-1 (1000-1140; C-O stretching, C-O-C), 534.78 cm-1,56 and 2893-2834 cm-1 (Figure 7b).57
The isolation and maintenance of pigmented bacteria from NRE have shown promising results; however, several challenges still exist. This is the first comprehensive report on the occurrence and diversity of pigmented bacteria in the NRE. The representative imgae of the isolated pigmented bacteria are displayed in Figure 8. This report highlights significant findings, along with opportunities and challenges.
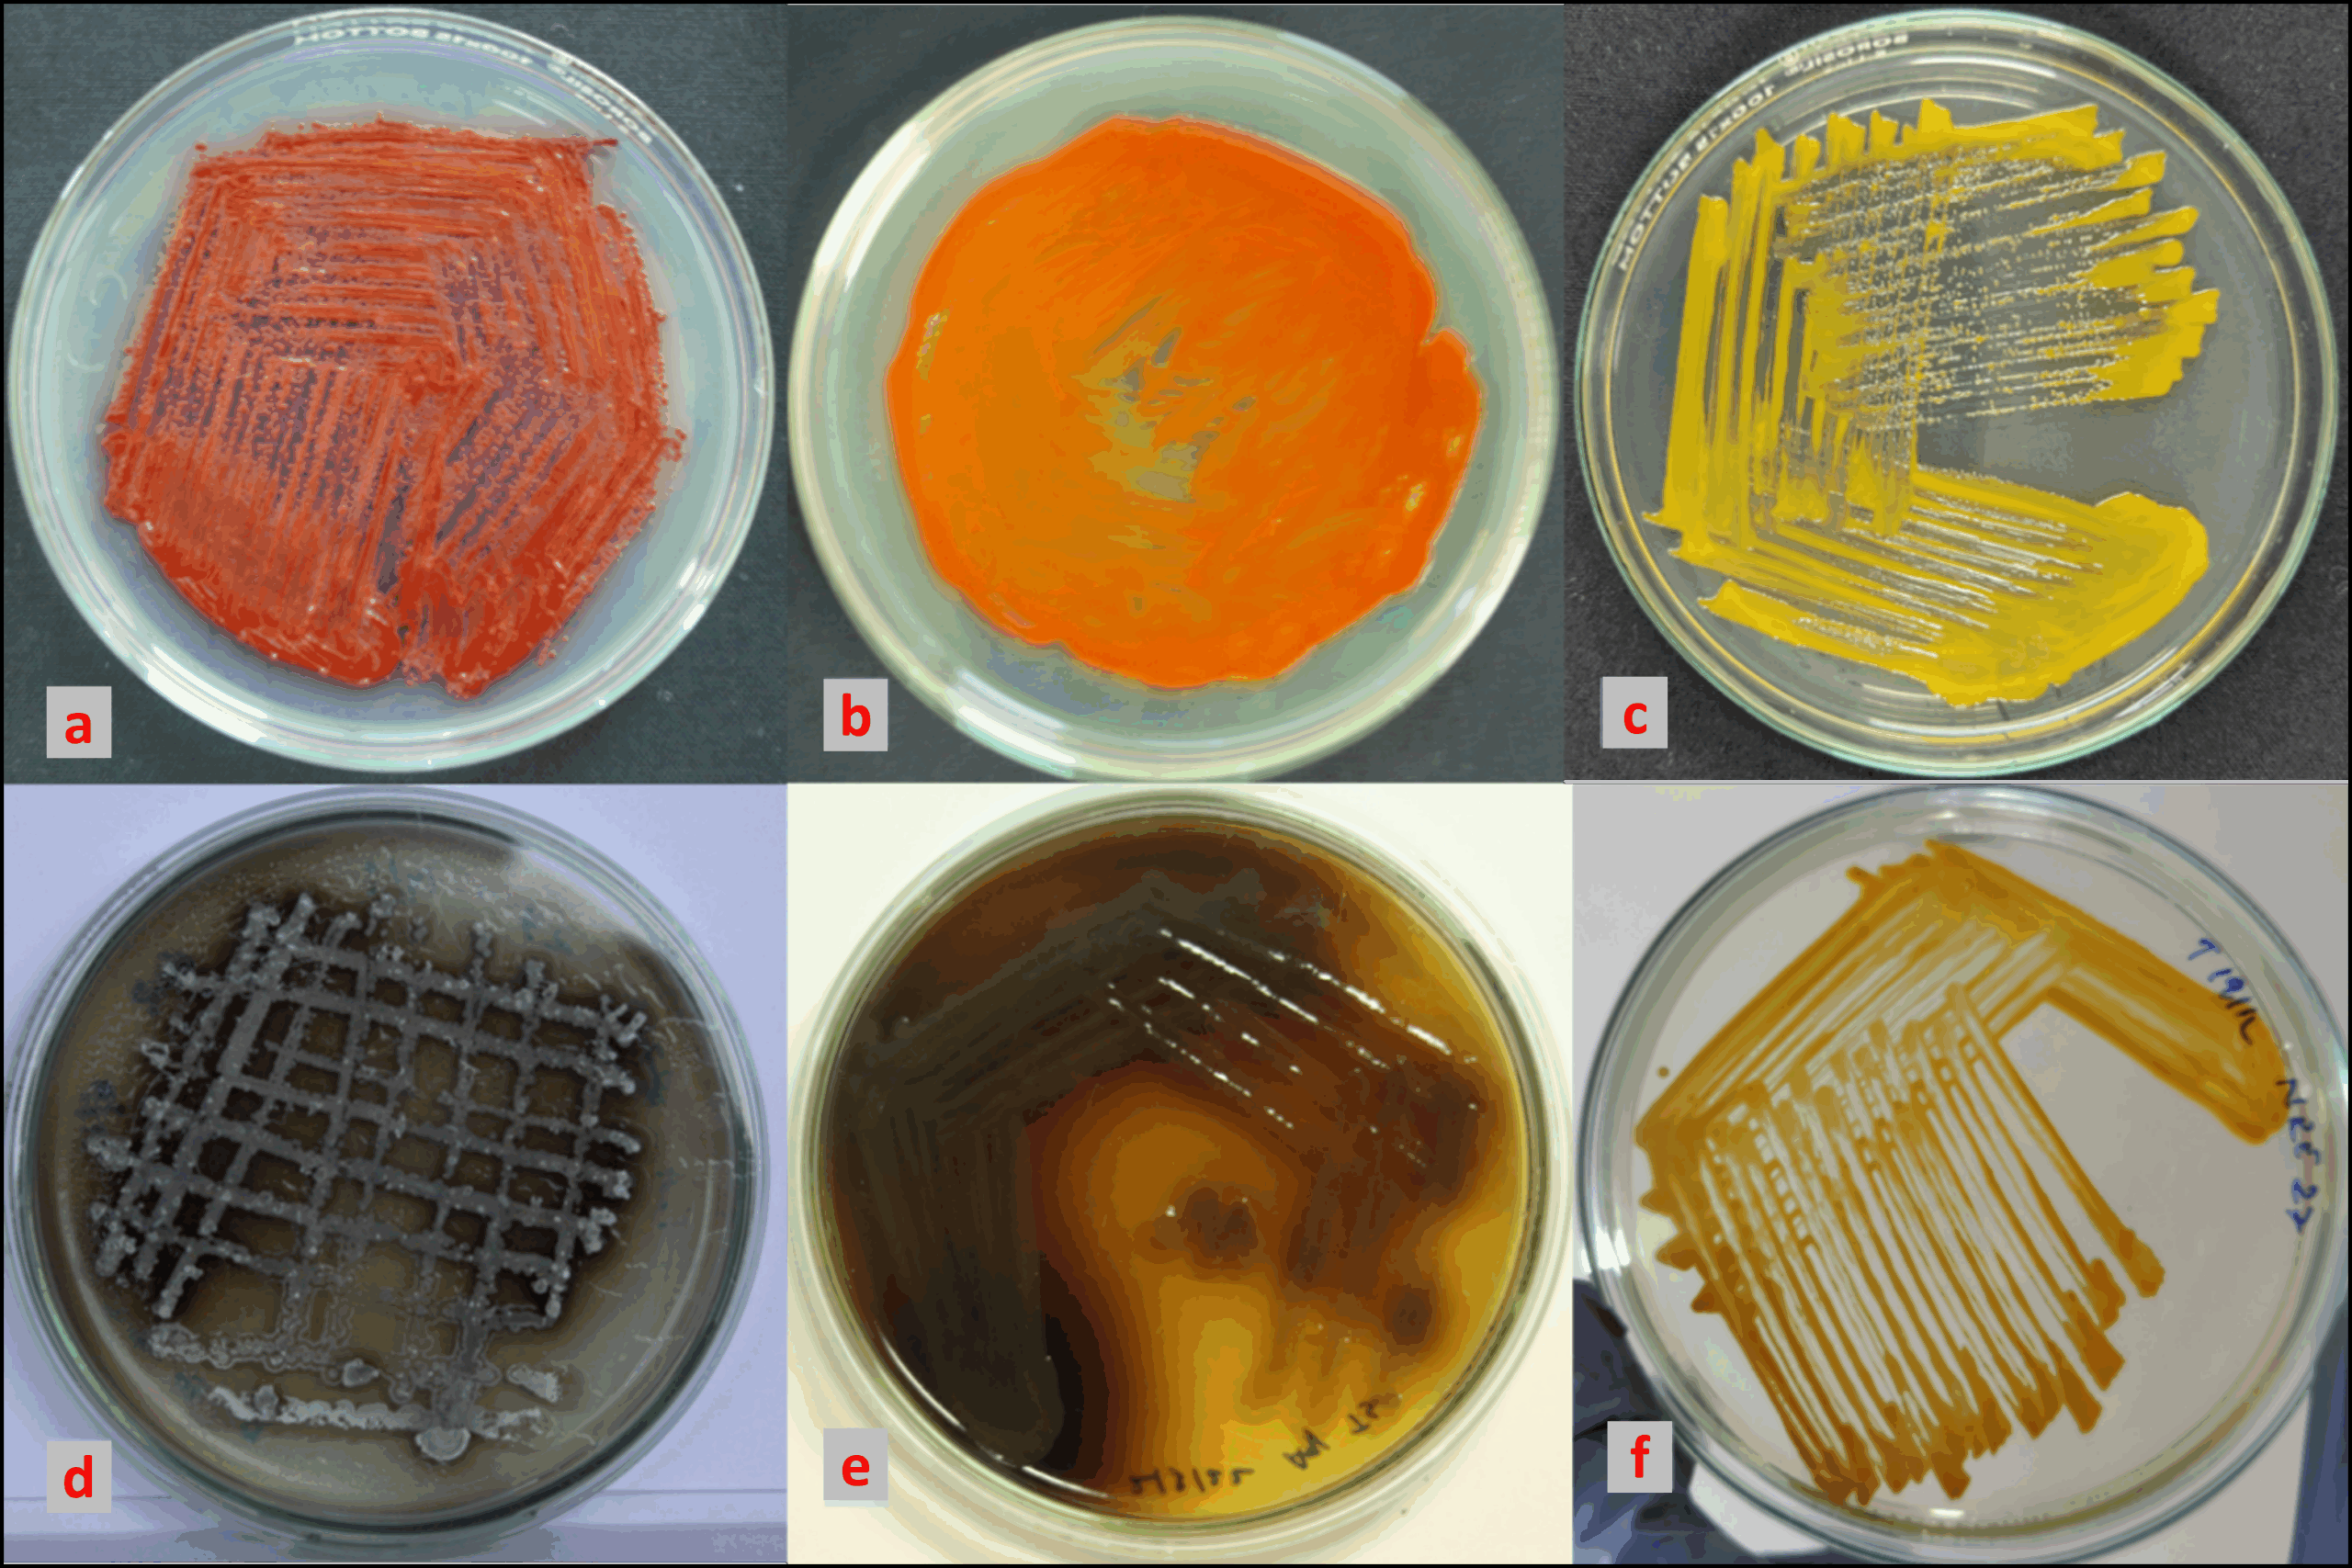
Figure 8. Representative images of pure culture of PHB: (a) RANM57, (b) RANMB8, (c) RANM35, (d) RANM61, (e) RANMB1 and (f) RANM27
Among the isolated THB, 61.92% were NPHB and 38.10% were PHB. The ratio of isolated NPHB to PHB, when compared to the individual media, showed TSA at 16.07:11.08%, ZA at 13.62:6.99%, R2-A at 16.13:9.74%, and NA at 16.11:10.29%. (Figure 3b). The percentage frequency of CFU of PHB showed that NRE-1 was 8.08%, NRE-2 was 38.42%, and NRE-3 was 20.26% (Table 2).
The percentage of CFU (log10/mL) of PHB in the individual media was the highest with TSA at 29%, R2A at 26%, NA at 27%, and ZA at 18% (Figure 3a). The isolated pigmented bacteria belonged to seven different colors, with the most prevalent being brown (28%), followed by yellow (21%), red (16%), pink (16%), orange (15%), black (2%), and blue (2%) (Figure 3c).
Gram staining of the bacterial colonies revealed that 45% were Gram-negative, 31% were Gram-positive, and 16% were Gram-positive rods in chains. The remaining 1%-2% of the remaining 8% have varied characteristics and Gram reactions.
The dominance of Alphaproteobacteria, particularly of the family Erythrobacteraceae, reflects the ecological success of this group in oligotrophic and fluctuating environments.33 Erythrobacteraceae are characterized by aerobic anoxygenic phototrophy (AAP) mediated by bacteriochlorophyll a, which provides a competitive advantage in light-exposed, nutrient-limited estuarine waters.44 The carotenoid pigments produced by Erythrobacter, Qipengyuania, and related genera serve dual functions: photoprotection against UV and reactive oxygen species, and light-harvesting accessory pigments for AAP.58 Phylogenetic clustering of these genera within Erythrobacteraceae, supported by high bootstrap values (>85%), underscored their shared evolutionary origins and conserved metabolic strategies.59
The strong bootstrap support (>85%) for the Hahella and Zooshikella clade within Gammaproteobacteria indicates a recent common ancestor and rapid diversification within estuarine habitats.37 Both genera are known for prodigiosin production, a red tripyrrole pigment with antimicrobial, immunosuppressive, and anticancer properties.60 The site-specific clustering of Hahella and Zooshikella strains at NRE-3, with bootstrap values >90%, is indicative of the rich ecological diversity that supports microbial communities for prodigiosin-producing phenotypes.
Isolation of pigmented bacteria from NRE presents several challenges. These difficulties can be grouped into physiological and biological challenges. Physiological challenges include changes in environmental conditions resulting from the constant influx of fresh water due to the unseasonal monsoon, difficulties in sample collection due to weather conditions, and biological factors such as competition between pigmented and non-pigmented bacterial species.
One significant difficulty in working with pigmented bacteria is their tendency to lose viability upon repeated sub-culturing. One of the reasons for this behavior could be their translocation from their natural habitat to an artificial habitat, which causes environmental stress due to changes in pH, salinity, oxygen availability, lack of micronutrients, and various other macro- and micro-factors, leading to loss of growth and viability. These issues necessitate careful optimization of the isolation techniques, growth media, and environmental conditions to ensure stable and high-yield pigment production.
The study, however, has revealed that these isolated strains could be potential producers of pigments, and these bacteria, after further molecular screening and growth maintenance patterns, could be harnessed by the pigment industry for various uses.
Acknowledgments
The authors gratefully acknowledge the funding support for this study from Late Rev. Dr. Leo Dsouza SJ, Director, Laboratory of Applied Biology, St Aloysius College (Autonomous), Mangaluru, Mangalore Jesuit Educational Society (MJES), and St Aloysius (Deemed to be University), Mangaluru.
Conflict of interest
The authors declare that there is no conflict of interest.
Authors’ contribution
All authors listed have made a substantial, direct and intellectual contribution to the work and approved it for publication.
Funding
This study was funded by Mangalore Jesuit Educational Society (MJES) through an intramural research grant (SAC/MRP/2023-24/03).
Data availability
All datasets generated and analysed during this study are included in the manuscript.
Ethics statement
Not applicable.
- Chen X, Ye Q, Sanders CJ, Du J, Zhang J. Bacterial-derived nutrient and carbon source-sink behaviors in a sandy beach subterranean estuary. Mar Pollut Bull. 2020;160:111570.
Crossref - Mathew J, Singh A, Gopinath A. Nutrient concentrations and distribution of phytoplankton pigments in recently deposited sediments of a positive tropical estuary. Mar Pollut Bull. 2021;168:112454.
Crossref - Nawaz A, Chaudhary R, Shah Z, et al. An Overview on Industrial and Medical Applications of Bio-Pigments Synthesized by Marine Bacteria. Microorganisms. 2021;9(1):11.
Crossref - Bernhard AE, Donn T, Giblin AE, Stahl DA. Loss of diversity of ammonia-oxidizing bacteria correlates with increasing salinity in an estuary system. Environ Microbiol. 2005;7(9):1289-1297.
Crossref - Dorador C, Busekow A, Vila I, Imhoff JF, Witzel KP. Molecular analysis of enrichment cultures of ammonia oxidizers from the Salar de Huasco, a high altitude saline wetland in northern Chile. Extremophiles. 2008;12(3):405-414.
Crossref - Stehr G, Bottcher B, Dittberner P, Rath G, Koops H. The ammonia-oxidizing nitrifying population of the River Elbe estuary. FEMS Microbiology Ecology. 1995;17(3):177-186.
Crossref - Groboillot A, Portet-Koltalo F, Derf FL, Feuilloley MJG, Orange N, Poc CD. Novel Application of Cyclolipopeptide amphisin: Feasibility Study as additive to remediate Polycyclic Aromatic Hydrocarbon (PAH) contaminated sediments. Int J Mol Sci. 2011;12(3):1787-1806.
Crossref - Jung D, Liu B, He X, et al. Accessing previously uncultured marine microbial resources by a combination of alternative cultivation methods. Microb Biotechnol. 2021;14(3):1148-1158.
Crossref - Duran C, Zhang S, Yang C, et al. Low-cost gel-filled microwell array device for screening marine microbial consortium. Front Microbiol. 2022;13:1031439.
Crossref - Vincent J, Sabot R, Lanneluc I, et al. Biomineralization of calcium carbonate by marine bacterial strains isolated from calcareous deposits. Mater Tech. 2020;108(3).
Crossref - Decleyre H, Heylen K, Colen CV, Willems A. Dissimilatory nitrogen reduction in intertidal sediments of a temperate estuary: small scale heterogeneity and novel nitrate-to-ammonium reducers. Front Microbiol. 2015;6:1124.
Crossref - Stirrup R, Mausz MA, Silvano E, et al. Aminolipids elicit functional trade-offs between competitiveness and bacteriophage attachment in Ruegeria pomeroyi. ISME J. 2022;17(3):315-325.
Crossref - Yi J, Lo LSH, Cheng J. Dynamics of Microbial Community Structure and Ecological Functions in Estuarine Intertidal Sediments. Front Mar Sci. 2020;7.
Crossref - Reasoner DJ, Geldreich EE. A new medium for the enumeration and subculture of bacteria from potable water. Appl Environ Microbiol. 1985;49(1):1-7.
Crossref - Edulamudi P, Antony Masilamani AJ, Divi VRSG, Konada VM. Novel root nodule bacteria belonging to the genus Caulobacter. Lett Appl Microbiol. 2011;53(6):587-591.
Crossref - Tamura K, Stecher G, Kumar S. MEGA11: Molecular Evolutionary Genetics Analysis Version 11. Mol Biol Evol. 2021;38(7):3022-3027.
Crossref - Huang L. Growth Kinetics of Clostridium Perfringens in Cooked Beef. J Food Saf. 2003;23(2):91-105.
Crossref - Yakdhane E, Tozser D, Haykir O, et al. Recognition of environmental contaminant and pathogenic bacteria by means of redox potential methodology. MethodsX. 2024;13:102811.
Crossref - Ramona Y, Dharmawan K. Predicting Single Cell Lag Time and Maximum Specific Growth Rate of Proteus mirabilis using Curve Fitting Machine Learning Algorithm (MLA). J Pure Appl Microbiol. 2023;17(2):811-818.
Crossref - Tarlak F. Machine Learning-Based Software for Predicting Pseudomonas spp. Growth Dynamics in Culture Media. Life. 2024;14(11):1490.
Crossref - Dawoud TM, Alharbi NS, Theruvinthalakal AM, et al. Characterization and antifungal activity of the yellow pigment produced by a Bacillus sp. DBS4 isolated from the lichen Dirinaria agealita. Saudi J Biol Sci. 2020;27(5):1403-1411.
Crossref - Kazi Z, Hungund BS, Yaradoddi JS, et al. Production, Characterization, and Antimicrobial Activity of Pigment from Streptomyces Species. J Nanomater. 2022;2022(1):3962301.
Crossref - Simsek Geyik M, Efe D, Gormez A. Identification of Bacteria Producing Red Pigments and Their Application in the Textile Industry. Arab J Sci Eng. 2024;50:6221-6230.
Crossref - Uncles RJ, Stephens JA. Salt Intrusion in the Tweed Estuary. Estuar Coast Shelf Sci. 1996;43(3):271-293.
Crossref - Oren A. Characterization of Pigments of Prokaryotes and Their Use in Taxonomy and Classification. Methods Microbiol. 2011; 38:261-282.
Crossref - Soliev AB, Hosokawa K, Enomoto K. Bioactive Pigments from Marine Bacteria: Applications and Physiological Roles. Evid Based Complement Alternat Med. 2011;2011(1):670349.
Crossref - Rappe MS, Giovannoni SJ. The Uncultured Microbial Majority. Annu Rev Microbiol. 2003;57(1):369-394.
Crossref - Eilers H, Pernthaler J, Glockner FO, Amann R. Culturability and In Situ Abundance of Pelagic Bacteria from the North Sea. Appl Environ Microbiol. 2000;66(7):3044-3051.
Crossref - Du H, Jiao N, Hu Y, Zeng Y. Diversity and distribution of pigmented heterotrophic bacteria in marine environments. FEMS Microbiol Ecol. 2006;57(1):92-105.
Crossref - Jiao N, Zhang Y, Zeng Y, et al. Distinct distribution pattern of abundance and diversity of aerobic anoxygenic phototrophic bacteria in the global ocean. Environ Microbiol. 2007;9(12):3091-3099.
Crossref - Sarmiento-Tovar AA, Silva L, Sanchez-Suarez J, Diaz L. Streptomyces-Derived Bioactive Pigments: Ecofriendly Source of Bioactive Compounds. Coatings. 2022;12(12):1858.
Crossref - Lami R, Cottrell MT, Ras J, et al. High Abundances of Aerobic Anoxygenic Photosynthetic Bacteria in the South Pacific Ocean. Appl Environ Microbiol. 2007;73(13):4198-4205.
Crossref - Lee KB, Liu CT, Anzai Y, Kim H, Aono T, Oyaizu H. The hierarchical system of the ‘Alphaproteobacteria’: description of Hyphomonadaceae fam. nov., Xanthobacteraceae fam. nov. and Erythrobacteraceae fam. nov. Int J Syst Evol Microbiol. 2005;55(5):1907-1919.
Crossref - Spring S, Scheuner C, Goker M, Klenk HP. A taxonomic framework for emerging groups of ecologically important marine gammaproteobacteria based on the reconstruction of evolutionary relationships using genome-scale data. Front Microbiol. 2015;6:281.
Crossref - Xu X, Fu G, Wang M. Qipengyuania. In: Whitman WB, ed. Bergey’s Manual of Systematics of Archaea and Bacteria. 1st ed. Wiley; 2024:1-28.
Crossref - Koblížek M, Béjà O, Bidigare RR, et al. Isolation and characterization of Erythrobacter sp. strains from the upper ocean. Arch Microbiol. 2003;180(5):327-338.
Crossref - Liao H, Lin X, Li Y, Qu M, Tian Y. Reclassification of the Taxonomic Framework of Orders Cellvibrionales, Oceanospirillales, Pseudomonadales, and Alteromonadales in Class Gammaproteobacteria through Phylogenomic Tree Analysis. Arumugam M, ed. mSystems. 2020;5(5):e00543-20.
Crossref - Barka EA, Vatsa P, Sanchez L, et al. Taxonomy, Physiology, and Natural Products of Actinobacteria. Microbiol Mol Biol Rev. 2016;80(1):1-43.
Crossref - Kaewkla O, Kiakhunthod K, Chookhampaeng S, Klinjantasorm B, Klankeo P, Dungkaew W. Phylogenetic affiliation of endophytic actinobacteria associated with red gum tree grown in salinity area and their plant growth promoting properties and suppression of phytopathogens, and genome data mining of selected strains. Front Plant Sci. 2025;16:1610327.
Crossref - Gao B, Gupta RS. Phylogenetic Framework and Molecular Signatures for the Main Clades of the Phylum Actinobacteria. Microbiol Mol Biol Rev. 2012;76(1):66-112.
Crossref - Ko SH, Lee HS, Park SH, Lee HK. Optimal conditions for the production of exopolysaccharide by marine microorganism Hahella chejuensis. Biotechnol Bioprocess Eng. 2000;5(3):181-185.
Crossref - Guo J, Rao Z, Yang T, Man Z, Xu M, Zhang X. High-level production of melanin by a novel isolate of Streptomyces kathirae. FEMS Microbiol Lett. 2014;357(1):85-91.
Crossref - Sanchez-Suarez J, Diaz L, Coy-Barrera E, Villamil L. Specialized Metabolism of Gordonia Genus: An Integrated Survey on Chemodiversity Combined with a Comparative Genomics-Based Analysis. BioTech. 2022;11(4):53.
Crossref - Cho SH, Jeong Y, Lee E, et al. Assessment of Erythrobacter Species Diversity through Pan-Genome Analysis with Newly Isolated Erythrobacter sp. 3-20A1M. J Microbiol Biotechnol. 2021;31(4):601-609.
Crossref - Cho GY, Whang KS. Sandarakinorhabdus rubra sp. nov., and Sandarakinorhabdus oryzae sp. nov., isolated from oxidized rice paddy soil. Int J Syst Evol Microbiol. 2019;71(3).
Crossref - Zhao CH, Luo JJ, Gong T, Huang XL, Ye DZ, Luo ZH. Pseudoalteromonas xiamenensis sp. nov., a marine bacterium isolated from coastal surface seawater. Int J Syst Evol Microbiol. 2014;64(Pt 2):444-448.
Crossref - Buerger S, Spoering A, Gavrish E, Leslin C, Ling L, Epstein SS. Microbial Scout Hypothesis, Stochastic Exit from Dormancy, and the Nature of Slow Growers. Appl Environ Microbiol. 2012;78(9):3221-3228.
Crossref - Ashenafi EL, Nyman MC, Shelley JT, Mattson NS. Spectral properties and stability of selected carotenoid and chlorophyll compounds in different solvent systems. Food Chem Adv. 2023;2:100178.
Crossref - Echavarri-Erasun C, Johnson EA. Fungal carotenoids. Appl Mycol Biotechnol. 2002;2:45-85.
Crossref - Seo S, Han D, Choi E, Seo M, Song I, Yoon I. Factors determining the oral absorption and systemic disposition of zeaxanthin in rats: in vitro, in situ, and in vivo evaluations. Pharm Biol. 2022;60(1):2266-2275.
Crossref - Ahmad WA, Ahmad WYW, Zakaria ZA, Yusof NZ. Isolation of Pigment-Producing Bacteria and Characterization of the Extracted Pigments. In: Application of Bacterial Pigments as Colorant. SpringerBriefs in Molecular Science. Springer, Berlin, Heidelberg. 2012:25-44.
Crossref 642-24520-6_2 - Zhang W, Yu S, Liu W, et al. “Pulling” p-conjugated polyene biomolecules into water: enhancement of light-thermal stability and bioactivity by a facile graphene oxide-based phase-transfer approach. RSC Adv. 2014;4(90):48765-48769.
Crossref - Suica-Bunghez IR, Sorescu AA, Doncea SM, Constantin M, Raut I, Ion RM. Phytochemical, Antioxidant and Antimicrobial Characterisation of Hedera Helix L. Extract. J Plant Dev. 2020;27:47-53.
Crossref - Li S, Feng D, Li E, Gilbert RG. Formation, Structural Characterization, and Functional Properties of Corn Starch/Zeaxanthin Composites. Foods. 2023;12(10):2076.
Crossref - Hamada MA, Mohamed ET. Characterization of Serratia marcescens (OK482790)’ prodigiosin along with in vitro and in silico validation for its medicinal bioactivities. BMC Microbiol. 2024;24(1):495.
Crossref - Cojoc LR, Enache MI, Neagu SE, et al. Carotenoids produced by halophilic bacterial strains on mural paintings and laboratory conditions. FEMS Microbiol Lett. 2019;366(21):fnz243.
Crossref - Parmar RS, Singh C. A comprehensive study of eco-friendly natural pigment and its applications. Biochem Biophys Rep. 2018;13:22-26.
Crossref - Yoon J, Lee EY, Nam SJ. Erythrobacter rubeus sp. nov., a carotenoid-producing alphaproteobacterium isolated from coastal seawater. Arch Microbiol. 2022;204(2):125.
Crossref - Tareen S, Risdian C, Musken M, Wink J. Qipengyuania pacifica sp. nov., a Novel Carotenoid-Producing Marine Bacterium of the Family Erythrobacteraceae, Isolated from Sponge (Demospongiae), and Antimicrobial Potential of Its Crude Extract. Diversity. 2022;14(4):295.
Crossref - Kim Y, Choi J. Dyeing properties of microbial prodiginine from Zooshikella rubidus for silk fabrics. Fibers Polym. 2015;16(9):1981-1987.
Crossref
© The Author(s) 2026. Open Access. This article is distributed under the terms of the Creative Commons Attribution 4.0 International License which permits unrestricted use, sharing, distribution, and reproduction in any medium, provided you give appropriate credit to the original author(s) and the source, provide a link to the Creative Commons license, and indicate if changes were made.