

ISSN: 0973-7510
E-ISSN: 2581-690X
Pectinases are important enzymes with significant applications in the industrial processing of juice clarification, oil and tea extraction, and paper manufacturing. The present study focused on obtaining bacteria capable of producing pectinase from agro-waste and optimising its production using statistical methods. Fifty-two bacterial isolates were initially obtained from rotting fruits and vegetable waste, of which 16 isolates showed pectin degradation on Yeast Extract Pectin (YEP) agar. Among these, isolate AW43 had the maximum zone of hydrolysis (23.3 mm) and enzymatic activity (150.019 U/mL), which was identified as Bacillus velezensis using 16S rRNA gene sequencing (PCR-based identification). Optimization of pectinase production was initially carried out using a Plackett-Burman design, where out of eleven parameters, pectin, yeast extract, glucose, pH, and temperature were identified as those that positively modulated pectinase production. Utilizing the Box-Behnken design, the research identified that the optimal conditions for pectinase production were achieved with a pectin concentration of 5.5 g/L, yeast extract at 10 g/L, glucose at 1.0 g/L, a pH level of 7.0, and an incubation temperature of 30 °C. These results indicate that B. velezensis is a promising microbe for the production and purification of commercially viable pectinase.
Pectinases, B. velezensis, Plackett-Burman Design, Box-Behnken Design
The increasing demand for clarified juices and fermented beverages has led to a heightened application of pectinases. These enzymes specifically target polysaccharide pectin, which is abundant in fruits, vegetables, and oil-rich seeds. The complexity of pectin is determined by the diverse range of monosaccharides and disaccharides that comprise it.1 At the cellular level, pectin is localised in the cell wall and middle lamella, where it crosslinks with other polysaccharides, such as cellulose and hemicellulose, thereby providing structural integrity to the cell wall.2 Although this robust polysaccharide polymer serves to protect cells, it poses challenges in industrial extraction processes. Consequently, the use of pectinases is increasing. In addition to improving the ease of the juice extraction process, pectinase has been shown to enhance the production while maintaining the dietary quality of the juices.3,4 Moreover, pectinase is utilized in the textile industry, where, in conjunction with cellulases, it contributes to enhancing the texture of cotton fabric.5 Additionally, it is employed in the production of tea powder, where it improves the colour and taste of the tea by reducing foam formation during the production process. Similarly, oil extraction processes are also known to utilize pectinase to improve the oil extraction process.6 Though pectinases have been purified from various animal and plant sources, the widely used pectinases are derived from microbial sources. Bacillus,7-9 Pseudomonas,10,11 Erwinia spp.12 have been reported to be a good source for pectinase production.
Enzyme production can be efficiently optimized using statistical techniques like Response Surface Methodology (RSM). These methods overcome the time delays and extensive experimentation required by the conventional method of enzyme production, which involves modulating parameters one at a time.13 It also fails to take into consideration the effect of the combination of variables.14 Plackett-Burman design (PBD) aids in analyzing the effect of many variables on a particular process and thus identifies variables that can be beneficial.15,16 On the other hand, Response surface methodology, which contains a multitude of statistical tools like the Box-Behnken design, aids in determining the optimal conditions within a multivariable system to achieve significant responses, especially in fermentation processes utilizing microorganisms.14 Though various microbes are known to produce pectinases, the increased demand for pectinases has made it important to identify newer sources of pectinases. This research aimed to isolate bacteria capable of producing pectinase from agricultural waste and to optimize their production through the use of Response Surface methodology.
Screening of pectinase-producing bacteria
Bacteria capable of producing pectinase were extracted from agricultural waste that included peels of fruits and vegetables, pulp, and seeds. The sample underwent a series of dilutions before being spread onto pectin agar plates. Colonies with a clear zone were then further analysed for their capacity to degrade pectin on Yeast Extract Pectin (YEP) agar (1% yeast extract, 1% pectin, 1.5% sodium chloride, pH 6.6) and incubated for 48 hours. Post incubation, the plates are flooded with Lugol’s iodine and analysed for a yellow zone against the background.9
Pectinase activity
The positive isolates were then subjected to a quantitative assay. Briefly, the isolates were placed in YEP broth and kept at 37 °C for 48 hours. Centrifugation of the culture was performed at 10,000 rpm for 15 minutes at 4 °C to separate the cell-free supernatant. The supernatant was then analysed for its pectinase activity. A volume of 500 µL of the supernatant, which contains the crude enzyme, was mixed with 500 µL of 0.5% pectin dissolved in a 50 mM glycine-NaOH buffer at pH 11, and the mixture was incubated for 10 minutes at 60 °C. The reaction is then stopped by the addition of 3,5-dinitrosalicylic acid (DNSA), and absorbance is measured at 540 nm.17 The amount of D-galacturonic acid is estimated from a standard graph. A pectinase unit is characterized as the quantity of enzyme needed to release 1 µmol of D-galacturonic acid per minute under specified assay conditions. The df denotes the dilution factor.
U/ml = (µmoles of galacturonic acid released) x (df) / (incubation time) x (volume of enzyme used)
Molecular identification of bacteria employing 16S rRNA gene sequences
Bacterial DNA was isolated using the Phenol/chloroform method.18 Following overnight growth, the culture was centrifuged at 13,000 rpm for 10 minutes in an Eppendorf tube. The pellet was resuspended in 200 µL of cell lysis buffer, and 20 µL of 50 µg/ml of proteinase K was added and incubated at 55 °C for 1 hour. Following incubation, 220 µL of a 25:24:1 phenol, chloroform, and isoamyl alcohol solution was introduced and thoroughly mixed. Afterwards, the solution is subjected to centrifugation at 13,000 rpm for 15 minutes. Subsequently, the aqueous phase is carefully moved to a fresh tube, and 220 µL of a saturated mixture of phenol, chloroform, and isoamyl alcohol is added and thoroughly mixed. The solution is then centrifuged at 13,000 rpm for 15 min. The top aqueous layer is moved to a fresh tube, where an equal amount of chloroform is added, followed by centrifugation at 13,000 rpm for 15 minutes. The resulting supernatant is then placed in a new tube, and twice its volume of ice-cold ethanol is added, with the mixture being left to incubate at 4 °C for 2 hours. After incubation, the tubes are spun at 13,000 rpm for 20 minutes. The resulting pellet is rinsed with 300 µL of ice-cold 70% ethanol and then undergoes another centrifugation at 13,000 rpm for 10 minutes. The supernatant was removed, and the tubes were subsequently air-dried for 10 minutes. The pellet is then resuspended in 50 µL of MilliQ (deionized) water. The presence of DNA is confirmed on 1% agarose gel electrophoresis stained with ethidium bromide.
The isolated DNA was then used for the amplification of the 16S rRNA gene of the isolate using 5′-AGAGTTTGATCMTGG-3′ as forward primer and 5′-ACCTTGTTACGACTT-3′ as reverse primer. The PCR reaction (25 µL) contained 12.5 µL of 2× PCR Master Mix (Thermofisher Scientific K0171), 0.5 µL of the primers, 2 µL of DNA, and 9 µL of sterile deionized water. The PCR process began with an initial denaturation step at 95 °C for 5 minutes, followed by 30 cycles consisting of 45 seconds at 94 °C, 45 seconds of annealing at 52 °C, and 45 seconds of extension at 72 °C, concluding with a final elongation phase at 72 °C for 8 minutes. The amplified DNA was separated on a 1% agarose gel prepared using 1× TAE buffer and stained with ethidium bromide at a concentration of 1 µg/mL.
The PCR product was purified and subsequently subjected to Sanger sequencing at Eurofins Pvt. Ltd., Bangalore, India. The derived sequence was then used to identify the bacteria using BLAST analysis within the GenBank database. The sequence was submitted to Genebank, and the accession no. OQ674436 was obtained. A phylogenetic tree analysis was created using the neighbour-joining method in MEGA-X software to determine the evolutionary relationship of the isolate with closely related Bacillus species.19
Optimization of production using Plackett-Burman design
Design Expert software was used to perform Plackett-Burman Design (PBD), which facilitated the determination of the outcome of variables (pectin, yeast extract, ammonium nitrate, sodium nitrate, peptone, inoculum volume, pH, temperature, agitation rate, potassium dihydrogen phosphate, and glucose) on pectinase production.20 A 2-level factorial was performed (Table 1). All experiments were performed in triplicate, and the effect of the 11 variables on pectinase production was analysed using ANOVA.
Table (1):
The variables along with their two-factorials used in Plackett-Burman Design
Factors |
Name |
Units |
Type |
Low |
High |
|---|---|---|---|---|---|
A |
Pectin |
g/l |
Numeric |
1 |
10 |
B |
Yeast extract |
g/l |
Numeric |
1 |
10 |
C |
NH4NO3 |
g/l |
Numeric |
0.5 |
1 |
D |
Na2NO3 |
g/l |
Numeric |
0.5 |
1 |
E |
Peptone |
g/l |
Numeric |
1 |
3 |
F |
Inoculum size |
mL |
Numeric |
1 |
10 |
G |
pH |
Numeric |
5 |
9 |
|
H |
Temperature |
°C |
Numeric |
25 |
35 |
J |
Agitation rate |
rpm |
Numeric |
100 |
200 |
K |
KH2PO4 |
g/l |
Numeric |
0.5 |
1 |
L |
Glucose |
g/l |
Numeric |
1 |
10 |
Optimization of production using Box-Behnken
The factors identified by the PBD were further examined using the Box-Behnken design in Design Expert software. The variables and their ranges used in the study are outlined in Table 2. A total of 46 experimental runs were carried out. The validity of the generated model is verified using ANOVA.
Table (2):
The variables along with their range used in Box-Behnken Design
Factors |
Name |
Units |
Low |
High |
|---|---|---|---|---|
A |
Pectin |
g/l |
1 |
10 |
B |
Yeast extract |
g/l |
1 |
10 |
C |
Glucose |
g/l |
1 |
10 |
D |
pH |
5 |
9 |
|
E |
Temperature |
°C |
25 |
35 |
Screening of Pectinase-producing bacteria
From an agro-waste sample, 52 bacterial isolates were obtained. Screening of these isolates on YEP agar containing 1% pectin showed that only 16 isolates were capable of producing pectinase. The isolate AW43 exhibited the largest zone of hydrolysis, measuring 23.3 mm, followed by isolates AW41 and AW26, each with a zone measuring 20 mm (Figure 1a, S1). The 16 isolates were then subjected to pectinase production using submerged fermentation. The highest activity of 150.019 U/ml was observed in the case of AW43 (Figure 1b). Since AW43 showed the highest activity, the isolate was then identified to be Bacillus velezensis using 16S rRNA sequencing (Figure 1c). The sequence was submitted to GenBank NCBI (OQ674436). Partially purified pectinase isolated from Bacillus velezensis W17-6 was shown to improve both the yield and clarity of Xuxiang kiwifruit wine and was more efficient in degrading pectin when compared to commercially available pectinase.21 In a related area, BvPelB, a new pectin lyase derived from Bacillus velezensis 16B, has been demonstrated to enhance the overall quality of juice production while producing minimal amounts of methanol.22 Bacillus species are widely recognized for their ability to produce pectinase.23 They are recognized for their ability to produce pectinase. Other species within the Bacillus genus, like B. siamensis,24 B. subtilis,25 B. amyloliquefaciens,8 and B. pumilus26 have also been identified as pectinase producers. This highlights the potential of Bacillus spp. as reliable sources for pectinase production.
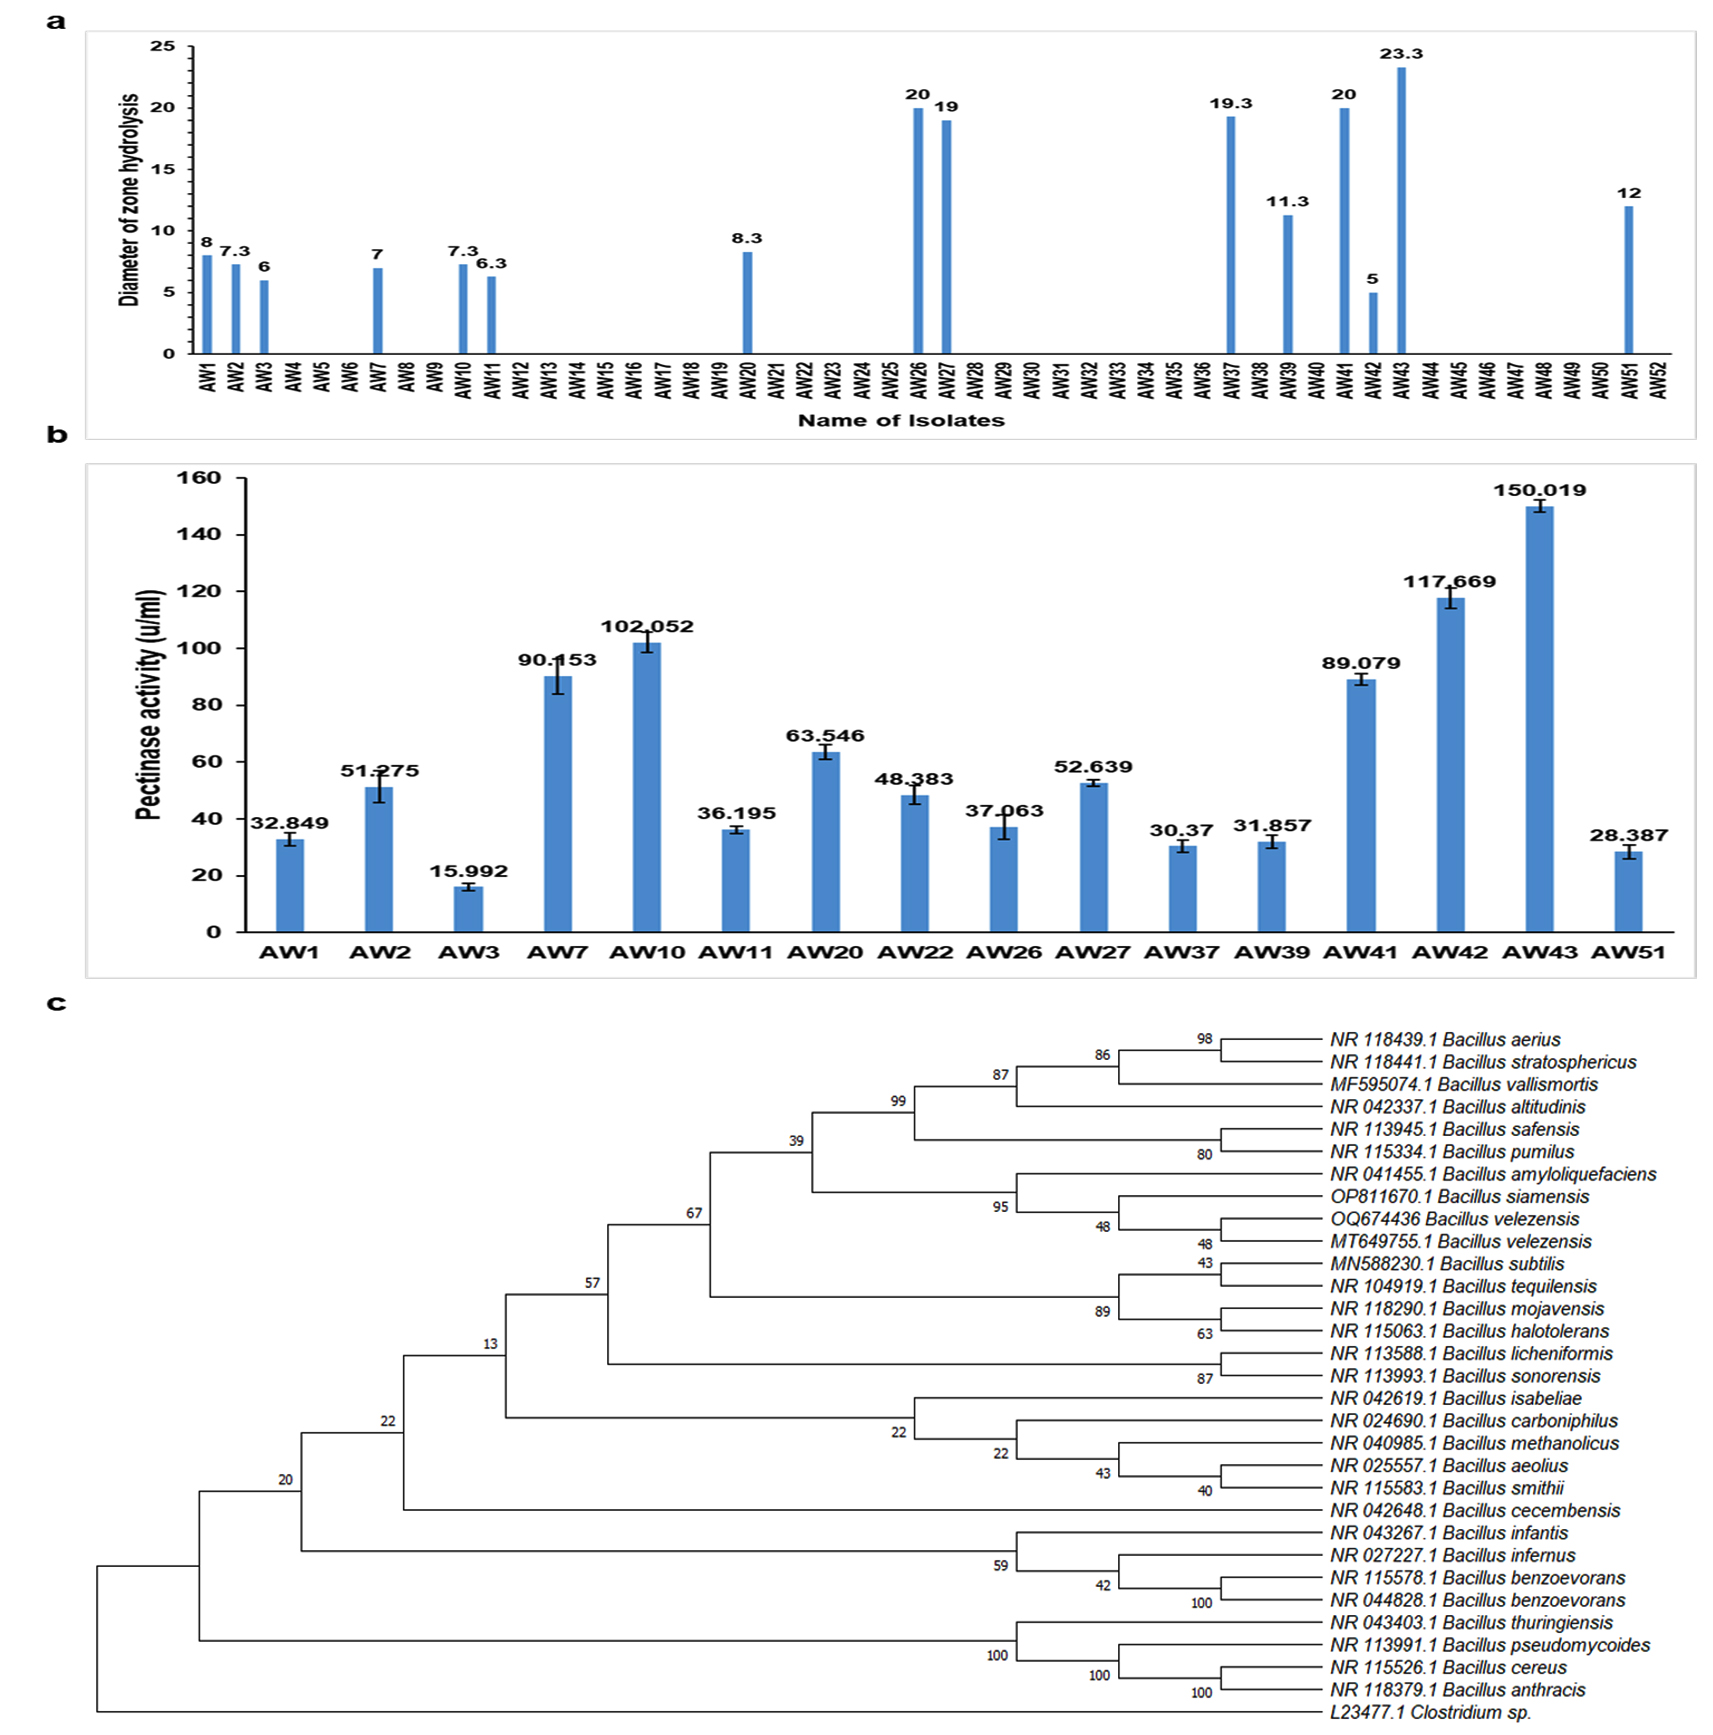
Figure 1. Production of pectinase by A43 and its identification. (a) Graph showing the zone of hydrolysis of different isolates on 1% YEP agar. (b) Graph showing the pectinase activity of the 16 isolates after submerged fermentation in YEP broth. (c) Phylogenetic analysis of Bacillus velezensis (bacterial isolate AW43)
Optimization of pectinase production using Plackett-Burman design
Factors that exerted a positive influence on pectinase production were initially determined using PDB. Eleven variables were analyzed on a two-factorial level (high or low). The ANOVA performed on the response data yielded a model F-value of 25.13, indicating a high level of statistical significance. The R² and adjusted R² values were determined to be 0.9325 and 0.8954, respectively, highlighting the model’s statistical robustness and validity (Table 3). Pectin, Yeast extract, pH, temperature, and glucose were shown to positively modulate pectinase production (Figure 2). Figure 2a shows that the normal probability plot of the residuals indicated that most of the data points were close to the reference line, implying that the factors were approximately normally distributed, with only a few minor deviation at the tails. Figure 2b shows that the Pareto chart shows the standardized effects of each factor on the response variable, arranged from largest to smallest. From the graph its visible that pH, temperature and pectin have the largest effect followed by glucose and yeast extract. Based on the PB design, the formula for the pectinase production is:
Pectinase = 151.12 + 17.85A + 5.50B – 3.27C + 3.43D – 3.37E – 1.20F – 19.30G + 18.30H + 2.65J + 2.43K – 8.00L
Where pectin (A), Yeast extract (B), Ammonium nitrate (C), Sodium nitrate (D), Peptone (E), inoculum size (F), pH (G), Temperature (H), agitation rate (J), Potassium dihydrogen phosphate (K), glucose (L).
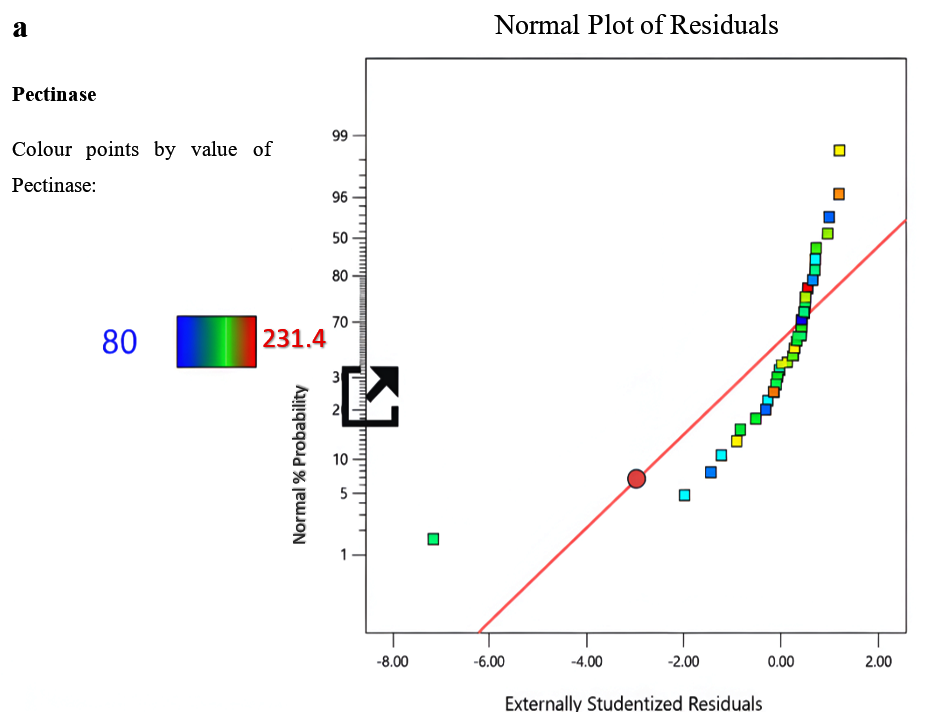
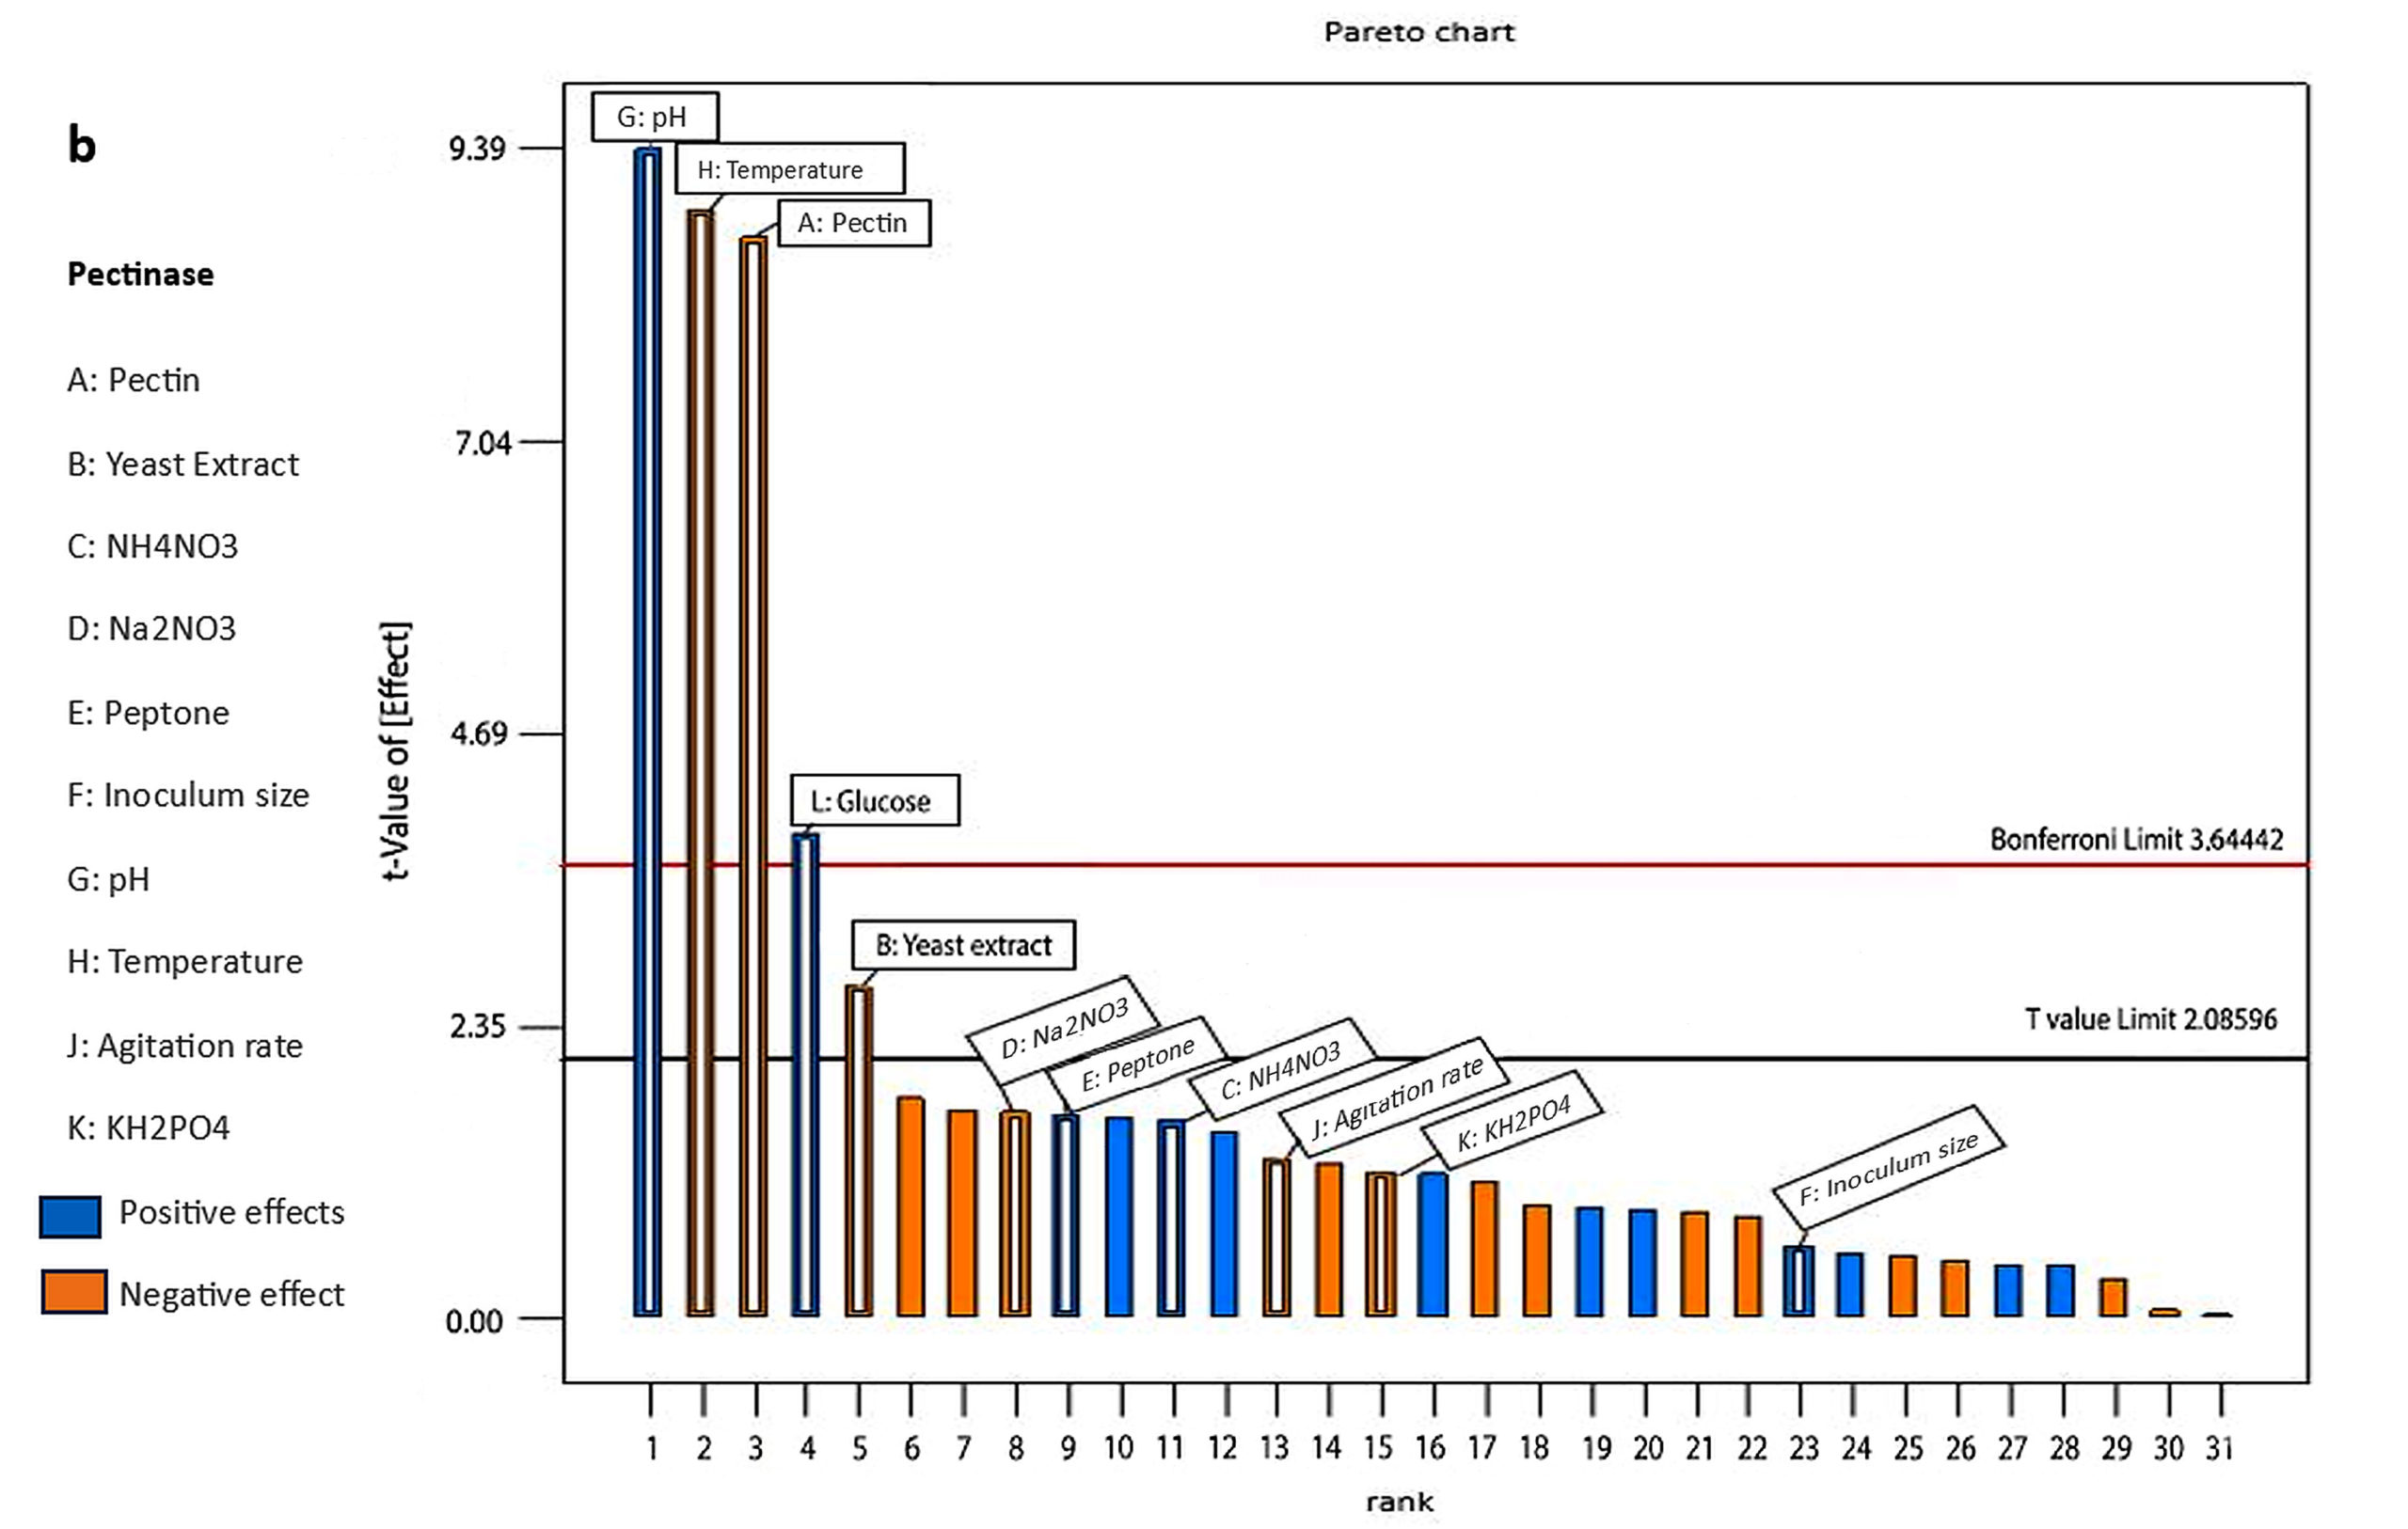 Figure 2. Role of factors on pectinase production as determined using Plackett-Burman design, (a) Normal plot and (b) Pareto chart
Table (3):
Plackett-Burman design of various factors for pectinase production
| Experimental response to selected factors | |||||||||||||
|---|---|---|---|---|---|---|---|---|---|---|---|---|---|
| Std |
Run |
Factor 1 | Factor 2 | Factor 3 | Factor 4 | Factor 5 | Factor 6 | Factor 7 | Factor 8 | Factor 9 | Factor 10 | Factor 11 | Response 1 |
| A: Pectin | B: Yeast extract | C: NH4NO3 | D: Na2NO3 | E: Peptone | F: Inoculum size | G: pH | H: Temp. | J: Agitation rate | K: KH2PO4 | L: Glucose | Pectinase | ||
| g/l | g/l | g/l | g/l | g/l | mL | °C | Rpm | g/l | g/l | u/ml | |||
| 11 | 1 | 1 | 10 | 0.5 | 1 | 1 | 10 | 5 | 35 | 200 | 1 | 1 | 190 |
| 17 | 2 | 1 | 1 | 0.5 | 0.5 | 3 | 1 | 5 | 35 | 100 | 1 | 10 | 150 |
| 25 | 3 | 1 | 1 | 0.5 | 1 | 3 | 1 | 9 | 25 | 200 | 0.5 | 1 | 100 |
| 19 | 4 | 1 | 10 | 0.5 | 0.5 | 3 | 10 | 9 | 35 | 100 | 1 | 1 | 140 |
| 4 | 5 | 10 | 10 | 0.5 | 0.5 | 1 | 1 | 9 | 25 | 200 | 1 | 10 | 121.4 |
| 21 | 6 | 1 | 1 | 1 | 0.5 | 3 | 10 | 9 | 25 | 200 | 1 | 10 | 80 |
| 15 | 7 | 1 | 10 | 1 | 1 | 1 | 1 | 9 | 25 | 100 | 1 | 1 | 120.2 |
| 8 | 8 | 10 | 10 | 1 | 0.5 | 1 | 10 | 5 | 35 | 100 | 1 | 10 | 210.2 |
| 28 | 9 | 10 | 10 | 0.5 | 1 | 3 | 1 | 5 | 25 | 100 | 1 | 10 | 180.6 |
| 13 | 10 | 1 | 1 | 1 | 1 | 1 | 10 | 5 | 25 | 100 | 1 | 10 | 120.4 |
| 27 | 11 | 1 | 10 | 0.5 | 1 | 3 | 10 | 5 | 25 | 200 | 0.5 | 10 | 140.6 |
| 12 | 12 | 10 | 10 | 0.5 | 1 | 1 | 1 | 5 | 35 | 100 | 0.5 | 1 | 231.4 |
| 30 | 13 | 10 | 1 | 1 | 1 | 3 | 1 | 5 | 35 | 200 | 1 | 1 | 210.8 |
| 29 | 14 | 1 | 1 | 1 | 1 | 3 | 10 | 5 | 35 | 100 | 0.5 | 1 | 170.6 |
| 7 | 15 | 1 | 10 | 1 | 0.5 | 1 | 1 | 5 | 35 | 200 | 0.5 | 10 | 170.4 |
| 18 | 16 | 10 | 1 | 0.5 | 0.5 | 3 | 10 | 5 | 35 | 200 | 0.5 | 10 | 191.2 |
| 23 | 17 | 1 | 10 | 1 | 0.5 | 3 | 1 | 5 | 25 | 200 | 1 | 1 | 147 |
| 20 | 18 | 10 | 10 | 0.5 | 0.5 | 3 | 1 | 9 | 35 | 200 | 0.5 | 1 | 190.4 |
| 32 | 19 | 10 | 10 | 1 | 1 | 3 | 10 | 9 | 35 | 200 | 1 | 10 | 170.8 |
| 10 | 20 | 10 | 1 | 0.5 | 1 | 1 | 10 | 9 | 35 | 100 | 0.5 | 10 | 150.6 |
| 3 | 21 | 1 | 10 | 0.5 | 0.5 | 1 | 10 | 9 | 25 | 100 | 0.5 | 10 | 99.2 |
| 26 | 22 | 10 | 1 | 0.5 | 1 | 3 | 10 | 9 | 25 | 100 | 1 | 1 | 140.2 |
| 5 | 23 | 1 | 1 | 1 | 0.5 | 1 | 10 | 9 | 35 | 200 | 0.5 | 1 | 130.2 |
| 6 | 24 | 10 | 1 | 1 | 0.5 | 1 | 1 | 9 | 35 | 100 | 1 | 1 | 170.4 |
| 9 | 25 | 1 | 1 | 0.5 | 1 | 1 | 1 | 9 | 35 | 200 | 1 | 10 | 124 |
| 31 | 26 | 1 | 10 | 1 | 1 | 3 | 1 | 9 | 35 | 100 | 0.5 | 10 | 109.8 |
| 22 | 27 | 10 | 1 | 1 | 0.5 | 3 | 1 | 9 | 25 | 100 | 0.5 | 10 | 110 |
| 14 | 28 | 10 | 1 | 1 | 1 | 1 | 1 | 5 | 25 | 200 | 0.5 | 10 | 160.8 |
| 16 | 29 | 10 | 10 | 1 | 1 | 1 | 10 | 9 | 25 | 200 | 0.5 | 1 | 152 |
| 24 | 30 | 10 | 10 | 1 | 0.5 | 3 | 10 | 5 | 25 | 100 | 0.5 | 1 | 132 |
| 1 | 31 | 1 | 1 | 0.5 | 0.5 | 1 | 1 | 5 | 25 | 100 | 0.5 | 1 | 140 |
| 2 | 32 | 10 | 1 | 0.5 | 0.5 | 1 | 10 | 5 | 25 | 200 | 1 | 1 | 180.8 |
Box-Behnken-based optimization
Since Plackett-Burman design revealed 5 out of the 11 variables to positively modulate the pectinase production, subsequent process optimization employed the Box-Behnken design.27 Pectin, Yeast extract, Glucose, pH, and temperature were the variables tested. The quadratic model was statistically significant (F = 98.82, p < 0.0001), indicating its suitability in explaining the variability in pectinase yield. The following quadratic equation represents the relationship between the experimental variables and pectinase production.
Pectinase = -1661.57877 + 31.20031 (Pectin) + 32.03560 (Yeast extract) – 26.24249 (Glucose) + 172.38472 (pH) + 84.20417 (Temperature) + higher-order terms.
The ANOVA analysis, as detailed in Table 4, reports an F-value of 98.82, which was found to be statistically significant as the p-value was determined to be less than 0.0001. Moreover, the Adequate Precision value of 37.0545 signifies a robust signal-to-noise ratio, thereby validating the precision of the factor relationships as delineated in the equation. All five factors, in both linear and quadratic terms, were found to be significant, whereas interaction terms were predominantly non-significant, suggesting limited synergistic activity among the factors. The negative coefficient for glucose in the equation suggests that higher glucose concentrations result in reduced pectinase production. The R² value of 0.9875 indicates a high correlation between the predicted and experimental values.
Table (4):
ANOVA analysis for the quadratic model of pectinase production
| Source | Sum of Squares | df | Mean Square | F-value | p-value | |
|---|---|---|---|---|---|---|
| Model | 1.427E+05 | 20 | 7136.11 | 98.82 | <0.0001 | Significant |
| A-Pectin | 14508.20 | 1 | 14508.20 | 200.90 | <0.0001 | |
| B-Yeast extract | 15475.36 | 1 | 15475.36 | 214.29 | <0.0001 | |
| C-Glucose | 29189.72 | 1 | 29189.72 | 404.20 | <0.0001 | |
| D-pH | 14677.32 | 1 | 14677.32 | 203.24 | <0.0001 | |
| E-Temperature | 6076.20 | 1 | 6076.20 | 84.14 | <0.0001 | |
| AB | 1.96 | 1 | 1.96 | 0.0271 | 0.8705 | |
| AC | 0.0100 | 1 | 0.0100 | 0.0001 | 0.9907 | |
| AD | 1.21 | 1 | 1.21 | 0.0168 | 0.8980 | |
| AE | 0.0900 | 1 | 0.0900 | 0.0012 | 0.9721 | |
| BC | 108.16 | 1 | 108.16 | 1.50 | 0.2324 | |
| BD | 2.56 | 1 | 2.56 | 0.0354 | 0.8522 | |
| BE | 1.44 | 1 | 1.44 | 0.0199 | 0.8888 | |
| CD | 0.6400 | 1 | 0.6400 | 0.0089 | 0.9257 | |
| CE | 36.00 | 1 | 36.00 | 0.4985 | 0.4867 | |
| DE | 0.0000 | 1 | 0.0000 | 0.0000 | 1.0000 | |
| A² | 17840.03 | 1 | 17840.03 | 247.04 | <0.0001 | |
| B² | 16612.40 | 1 | 16612.40 | 230.04 | <0.0001 | |
| C² | 6184.75 | 1 | 6184.75 | 85.64 | <0.0001 | |
| D² | 17525.76 | 1 | 17525.76 | 242.69 | <0.0001 | |
| E² | 9977.76 | 1 | 9977.76 | 138.17 | <0.0001 | |
| Residual | 1805.39 | 25 | 72.22 | |||
| Lack of Fit | 128.21 | 20 | 6.41 | 0.0191 | 1.0000 | not significant |
| Pure Error | 1677.17 | 5 | 335.43 | |||
| Cor Total | 1.445E+05 | 45 |
The Box-Behnken design-derived regression coefficient analysis (Table 5) provides valuable insight into pectinase production in relation to changes in a single independent variable. Pectin, yeast extract, pH, and temperature showed positive values, indicating a positive effect on pectinase production. In contrast, glucose showed a negative value, indicating an inversely proportional relationship with pectinase production.
Table (5):
Regression coefficient estimates for the pectinase production as determined by the Box-Behnken design
Factor |
Coefficient Estimate |
df |
Standard Error |
95% CI Low |
95% CI High |
VIF |
|---|---|---|---|---|---|---|
Intercept |
429.33 |
1 |
3.47 |
422.19 |
436.48 |
|
A-Pectin |
30.11 |
1 |
2.12 |
25.74 |
34.49 |
1.0000 |
B-Yeast extract |
31.10 |
1 |
2.12 |
26.72 |
35.48 |
1.0000 |
C-Glucose |
-42.71 |
1 |
2.12 |
-47.09 |
-38.34 |
1.0000 |
D-pH |
30.29 |
1 |
2.12 |
25.91 |
34.66 |
1.0000 |
E-Temperature |
19.49 |
1 |
2.12 |
15.11 |
23.86 |
1.0000 |
AB |
-0.7000 |
1 |
4.25 |
-9.45 |
8.05 |
1.0000 |
AC |
0.0500 |
1 |
4.25 |
-8.70 |
8.80 |
1.0000 |
AD |
0.5500 |
1 |
4.25 |
-8.20 |
9.30 |
1.0000 |
AE |
-0.1500 |
1 |
4.25 |
-8.90 |
8.60 |
1.0000 |
BC |
-5.20 |
1 |
4.25 |
-13.95 |
3.55 |
1.0000 |
BD |
-0.8000 |
1 |
4.25 |
-9.55 |
7.95 |
1.0000 |
BE |
0.6000 |
1 |
4.25 |
-8.15 |
9.35 |
1.0000 |
CD |
-0.4000 |
1 |
4.25 |
-9.15 |
8.35 |
1.0000 |
CE |
3.00 |
1 |
4.25 |
-5.75 |
11.75 |
1.0000 |
DE |
0.0000 |
1 |
4.25 |
-8.75 |
8.75 |
1.0000 |
A² |
-45.21 |
1 |
2.88 |
-51.14 |
-39.29 |
1.20 |
B² |
-43.63 |
1 |
2.88 |
-49.55 |
-37.70 |
1.20 |
C² |
26.62 |
1 |
2.88 |
20.70 |
32.55 |
1.20 |
D² |
-44.81 |
1 |
2.88 |
-50.74 |
-38.89 |
1.20 |
E² |
-33.81 |
1 |
2.88 |
-39.74 |
-27.89 |
1.20 |
Further analysis of the factors’ impact on pectinase production is shown through contour plots (Figure 3). The ellipticity of the curves signifies the relationship between the factors and the pectinase production. Figure 3a shows pectin and yeast concentration on pectinase, keeping other factors constant. Figure 3b reveals the impact of pectin and glucose on pectinase yield. Interestingly, the contour slopes down as the glucose concentration increases, indicating that a high concentration of glucose negatively modulates the pectinase production. Figure 3c highlights pectin and pH on pectinase yield, where the highest production is observed around pH 7. The impact of pectin and temperature on pectinase yield is shown in Figure 3d, where the slope shows that maximum production is around 30 °C.
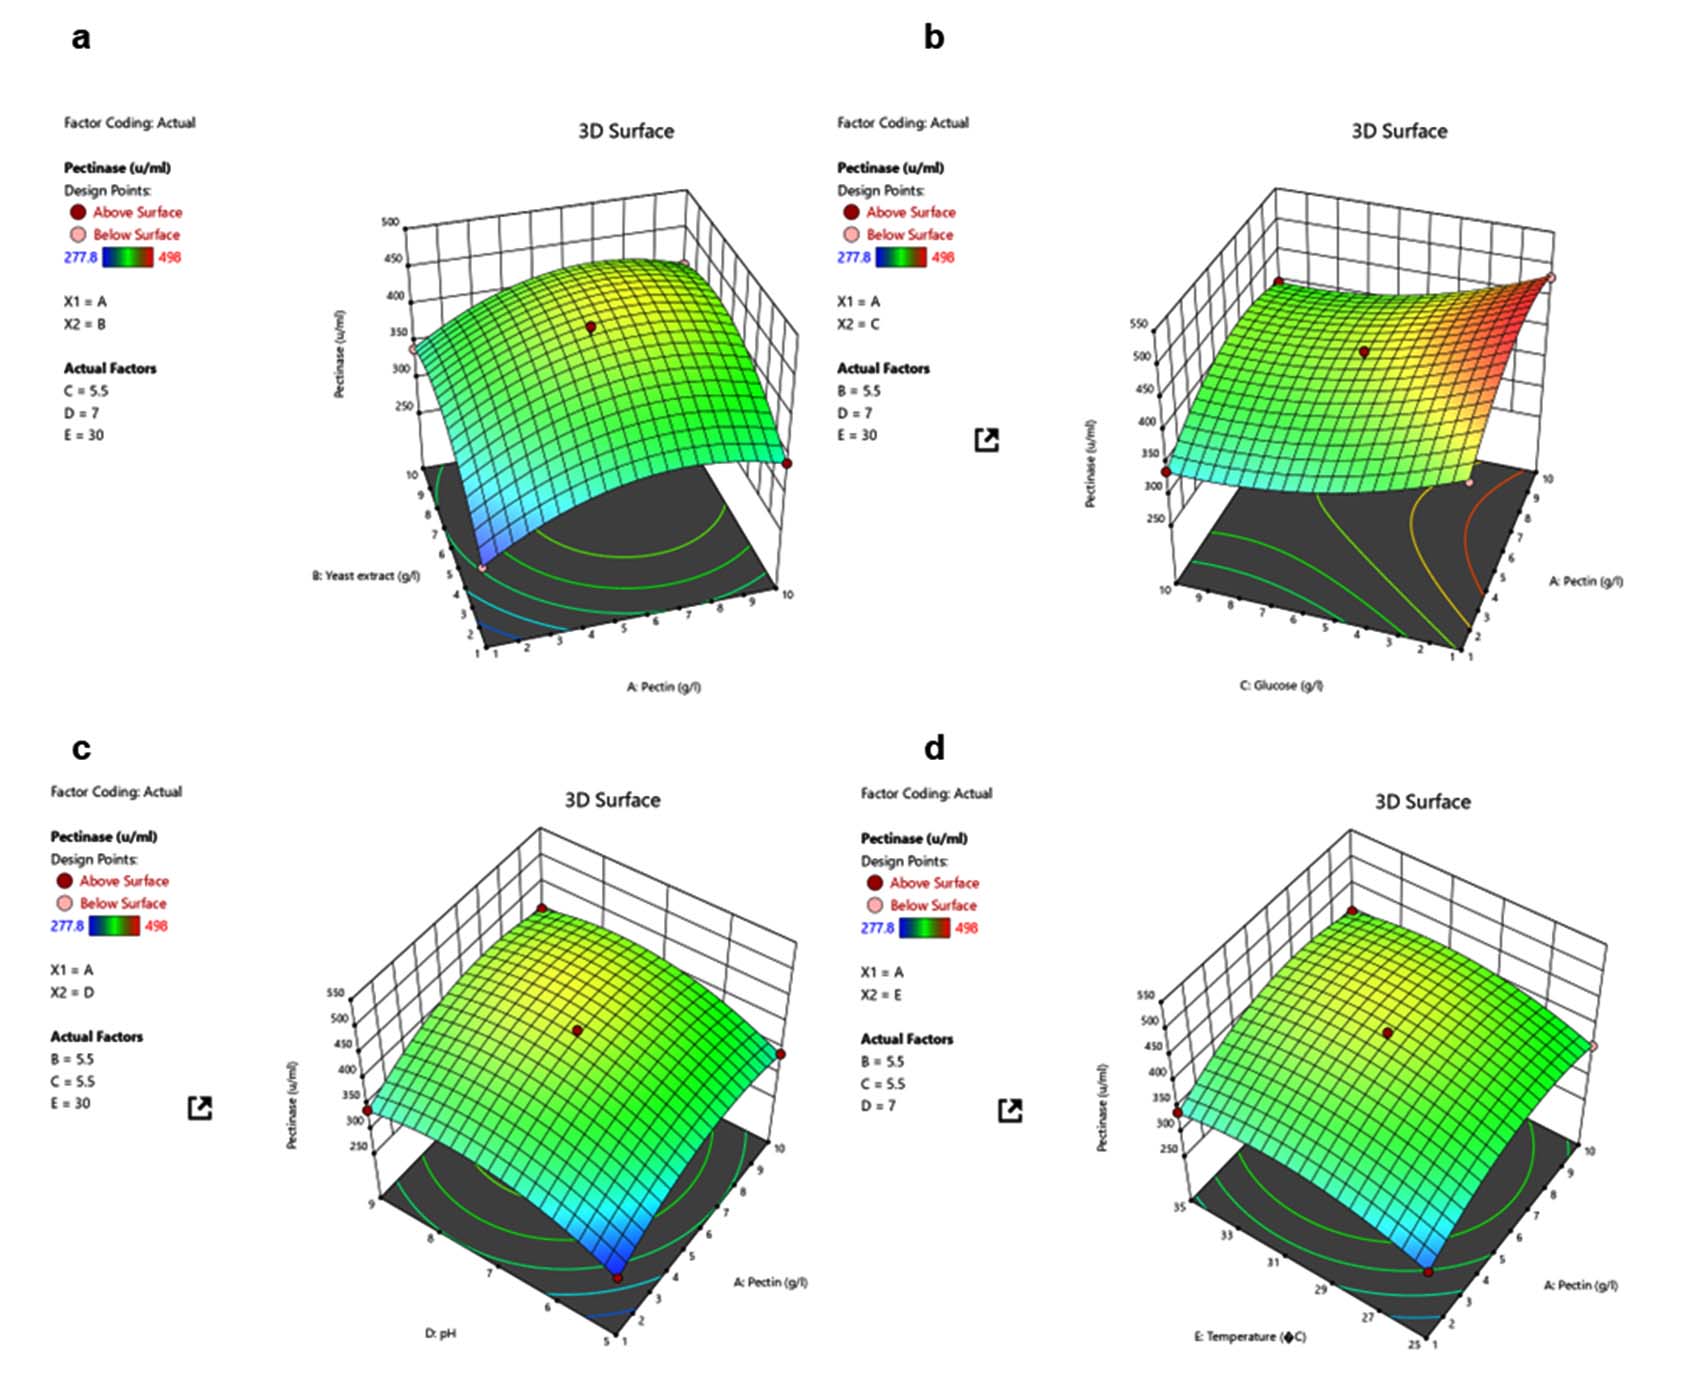
Figure 3. 3D response surface plot with contour projection showing the effect of factors on pectinase production; a) Effect of pectin and yeast concentration; b) Effect of pectin and glucose concentration; c) Effect of pectin concentration and pH; d) Effect of pectin concentration and temperature
Media composition and factor optimization have extensively used statistical methods like Plackett-Burman and RSM. Bacillus sonorensis-derived pectinase production was optimized using a combination of Plackett-Burman and Box-Behnken design, which revealed that pectin, magnesium sulphate, and pH positively modulated the production, while yeast extract, incubation time, and dihydrogen phosphate had no significant effect. On the other hand, potassium chloride significantly reduced the production of pectinase.9 Utilising Plackett-Burman and Box-Behnken design, pectinase production by Bacillus sp. was maximum in the presence of 1% orange peel, 2% inoculum volume, incubated at 40 °C for 24 hrs.23 The application of the Box-Behnken design in comparing pectinase production across different fungal species showed that when orange peels were used at a concentration of 0.06 inch, Aspergillus niger yielded the highest amount of pectinase after a 6 days incubation period at 21 °C28 An earlier study revealed that application of the Box-Behnken design resulted in identifying 3.71% of tapioca starch, 5.94 carbon to nitrogen ratio, and 0.256% salt concentration as the optimum conditions for pectinase production using the Aspergillus niger NCIM 548 strain.29
Based on the Box-Behnken design, the highest enzyme activity of 491.337 U was observed when the media contained pectin 5.5 g/L, yeast extract 10 g/L, glucose 1.0 g/L, pH 7.0, and incubated at 30 °C. On the other hand, the lowest activity of 474.747 was determined to be when pectin 9.318 g/L, yeast extract 8.895 g/L, glucose 1.798 g/L, pH 7.608, and incubated at 28.637 °C. The design analysis identified the optimal parameter for pectinase production as pectin 5.5 g/L, yeast extraction 10 g/L, glucose 1.0 g/L, pH 7 with incubation at 30 °C.
The study successfully isolated a high-yielding pectinase-producing bacterium, Bacillus velezensis, from agro-waste and optimized its production using Plackett-Burman and Box-Behnken designs. Statistical modelling proved effective in identifying key variables and enhancing enzyme yield significantly. This research reinforces the potential of agro-waste as a valuable microbial reservoir and B. velezensis as an industrially viable source of pectinase, laying the groundwork for eco-friendly and cost-effective enzyme production for food, textile, and fermentation industries.
Additional file: Figure S1.
ACKNOWLEDGMENTS
The authors gratefully acknowledge the Department of Microbiology, Annamalai University, Tamil Nadu, India, for providing the necessary facilities and support to carry out this research work.
CONFLICT OF INTEREST
The authors declare that there is no conflict of interest.
AUTHORS’ CONTRIBUTION
All authors listed have made a substantial, direct and intellectual contribution to the work, and approved it for publication.
FUNDING
None.
DATA AVAILABILITY
The data generated and analyzed during this study are included in the manuscript, and the data supporting the findings of this study are available from the corresponding author upon reasonable request.
ETHICS STATEMENT
This article does not contain any studies on human participants or animals performed by any of the authors.
- Jayani RS, Saxena S, Gupta R. Microbial Pectinolytic Enzymes: A Review. Process Biochem. 2005;40(9):2931-2944.
Crossref - Bhardwaj V, Degrassi G, Bhardwaj RK. Microbial Pectinases and Their Applications in Industries: A Review. Polymer. 2017;4(8).
Crossref - Garcia NM, Cely NM, Mendez PA. Study of the Pectinase Production from Soursop and Cherimoya Pulp for Agro-Industrial Waste Reduction in Colombia. Waste Biomass Valor. 2024;15(11):6357–6365.
Crossref - Mahto RB, Yadav M, Muthuraj M, Sharma AK, Bhunia B. Biochemical Properties and Application of a Novel Pectinase from a Mutant Strain of Bacillus subtilis. Biomass Conv Bioref. 2023;13(12):10463–10474.
Crossref - Hoondal G, Tiwari R, Tewari R, Dahiya N, Beg QK. Microbial Alkaline Pectinases and Their Industrial Applications: A Review. Appl Microbiol Biotechnol. 2002;59(4-5):409-418.
Crossref - Haile S, Ayele A. Pectinase from Microorganisms and Its Industrial Applications. Scientific World Journal. 2022;2022:1881305.
Crossref - Alqahtani YS, More SS, Keerthana R, et al. Production and Purification of Pectinase from Bacillus subtilis 15A-B92 and Its Biotechnological Applications. Molecules. 2022;27(13):4195.
Crossref - Doan CT, Chen C-L, Nguyen VB, Tran TN, Nguyen AD, Wang S-L. Conversion of Pectin-Containing By-Products to Pectinases by Bacillus amyloliquefaciens and Its Applications on Hydrolyzing Banana Peels for Prebiotics Production. Polymers. 2021;13(9):1483.
Crossref - Mohandas A, Raveendran S, Parameswaran B, et al. Production of Pectinase from Bacillus sonorensis MPTD1. Food Technol Biotechnol. 2018;56(1):110–116.
Crossref - Arpana M, Rathore SS, Rao AS, Nair A, More SS, Fasim A. Statistical Bioprocess Optimization for Enhanced Production of a Thermo Alkalophilic Polygalacturonase (PGase) from Pseudomonas sp. 13156349 Using Solid Substrate Fermentation (SSF). Heliyon. 2023;9(6):e16493.
Crossref - Tasgin E, Nadaroglu H, Babagil A, Demir N. Immobilization of Purified Pectin Lyase from Pseudomonas putida onto Magnetic Lily Flowers (Lilium candidum L.) Nanoparticles and Applicability in Industrial Processes. Molecules. 2020;25(11):2671.
Crossref - Maisuria VB, Patel VA, Nerurkar AS. Biochemical and Thermal Stabilization Parameters of Polygalacturonase from Erwinia carotovora subsp. Carotovora BR1. J Microbiol Biotechnol. 2010;20(7):1077-1085.
Crossref - Nadaf RD, Nadaf P, Toragall M, Shivasharana CT. Response Surface Methodology for Optimization of Media Components for Production of Lipase from Bacillus subtilis KUBT4. Archives of Razi Institute. 2024;79(3):659-668.
Crossref - Latha S, Sivaranjani G, Dhanasekaran D. Response Surface Methodology: A Non-Conventional Statistical Tool to Maximize the Throughput of Streptomyces Species Biomass and Their Bioactive Metabolites. Crit Rev Microbiol. 2017;43(5):567-582.
Crossref - Haaland PD. Experimental Design in Biotechnology. 1st ed. Boca Raton: CRC Press. 2020.
Crossref - Jain SP, Singh PP, Javeer S, Amin PD. Use of Placket–Burman Statistical Design to Study Effect of Formulation Variables on the Release of Drug from Hot Melt Sustained Release Extrudates. AAPS PharmSciTech. 2020;11(2):936-944.
Crossref - Miller G. L. Use of Dinitrosalicylic Acid Reagent for Determination of Reducing Sugar. Anal Chem 1959;31(3):426-428.
Crossref - Wright MH, Adelskov J, Greene AC. Bacterial DNA Extraction Using Individual Enzymes and Phenol/Chloroform Separation. J Microbiol Biol Educ. 2017;18(2):60.
Crossref - Kumar S, Stecher G, Li M, Knyaz C, Tamura K. MEGA X: Molecular Evolutionary Genetics Analysis across Computing Platforms. Mol Biol Evol. 2018;35(6):1547-1549.
Crossref - Plackett RL, Burman JP. The Design of Optimum Multifactorial Experiments. Biometrika. 1946;33(4):305-325.
Crossref - Wei X, Hao J, Xiong K, et al. Effect of Pectinase Produced by Bacillus velezensis W17-6 on Methanol Content and Overall Quality of Kiwifruit Wine. Food Biosci. 2024;59:104180.
Crossref - Pavlovic M, Slavic MS, Kojic M, et al. Unveiling Novel Insights into Bacillus velezensis 16B Pectin Lyase for Improved Fruit Juice Processing. Food Chem. 2024;456:140030.
Crossref - Shrestha LB, Bhattarai NR, Khanal B. Comparative Evaluation of Methods for the Detection of Biofilm Formation in Coagulase-Negative Staphylococci and Correlation with Antibiogram. Infect Drug Resist. 2018;11:607-613.
Crossref - Satpathy A, Mukherjee K, Nigam VK. Improved Production of Thermostable Pectinase from Novel Bacillus siamensis (BIOSMNF45) Using Computational-Conventional Approach. Sci Rep. 2025;15(1):11489.
Crossref - Gul E, Dursun AY, Tepe O, Akaslan G, Pampal FG. Optimizing Pectin Lyase Production Using the One Factor at a Time Method and Response Surface Methodology. Biotechnol Applied Biochem. 2024;72(3):638-651.
Crossref - Tepe O, Dursun AY. Exo-Pectinase Production by Bacillus pumilus Using Different Agricultural Wastes and Optimization of Medium Components Using Response Surface Methodology. Environ Sci Poll Res Int. 2014;21(16):9911-9920.
Crossref - Box GEP, Behnken DW. Some New Three-Level Designs for the Study of Quantitative Variables. Technometrics. 1960;2(4):455-475.
Crossref - Ametefe GD, Lemo AO, Orji FA, Kolawole LA, Iweala EEJ, Chinedu SN. Comparison of Optimal Fungal Pectinase Activities Using the Box-Behnken Design. Trop J Nat Prod Res. 2021;5(9):1656-1664.
Crossref - Yugandhar NM, Kumar DVRR, Prasanthi V, Kumar NK, Reddy DSR. Optimization of Pectinase Production from Manihot utilissima by Aspergillus niger NCIM 548 Using Statistical Experimental Design. Res J Microbiol. 2008;3(1):9-16. https://scialert.net/abstract/?doi=jm.2008.9.16
© The Author(s) 2026. Open Access. This article is distributed under the terms of the Creative Commons Attribution 4.0 International License which permits unrestricted use, sharing, distribution, and reproduction in any medium, provided you give appropriate credit to the original author(s) and the source, provide a link to the Creative Commons license, and indicate if changes were made.