


ISSN: 0973-7510
E-ISSN: 2581-690X
Drug resistance in pathogens represents an escalating global health challenge, particularly in Plasmodium falciparum, the causative agent of malaria. The emergence of drug-resistant strains complicates treatment and highlights the need for rapid and accurate detection methods. In P. falciparum, resistance has been largely attributed to single nucleotide polymorphisms (SNPs) in key genes such as PfMDR1, PfKelch13, and PfCRT, which are associated with resistance to artemisinin-based combination therapies and chloroquine—two mainstays of antimalarial treatment. This study aimed to develop a bioinformatics pipeline capable of analyzing P. falciparum genomic sequences to detect and annotate SNPs that may confer drug resistance. The pipeline was implemented on the Galaxy online analysis platform using its workflow function. It processes both reference and sample sequences through alignment, mutation detection, SNP selection, and annotation based on a reference general feature format. Although no SNPs were identified directly within known drug resistance genes in the analyzed samples, the developed pipeline successfully detected and annotated SNPs across the chromosomes containing these genes. This approach provides a practical framework for future applications in point-of-care detection and surveillance of drug-resistant P. falciparum strains.
Drug Resistance, Plasmodium falciparum, Single Nucleotide Polymorphisms (SNPs), Bioinformatics Pipeline, Artemisinin-based Combination Therapies
Drug resistance is rapidly emerging in many pathogens, including multidrug-resistant Mycobacterium tuberculosis, methicillin-resistant Staphylococcus aureus, and Neisseria gonorrhoeae.1,2 This rise in resistance has been linked to the extensive use of antimicrobials in medicine and agriculture, which enables surviving microbes to transmit their resistance traits to subsequent generations.3,4 Drug resistance is typically assessed in laboratories by exposing pathogens to various antimicrobial agents and monitoring their proliferation rates.5 These tests, however, are time-consuming, and early administration of effective treatment is crucial for improving patient outcomes.6 Rapid, on-site detection of antimicrobial resistance would therefore help reduce the severity and lethality associated with drug-resistant infections.7,8
Drug resistance arises in microbes when a subset of the population exposed to antimicrobials survives, eventually leading to the evolution of resistance-associated genes.9,10 Because these are genetic changes, alterations in the microbial genome can be detected and used to develop point-of-care diagnostic tests.11 Drug resistance genes acquire various types of mutations, including insertions, deletions, and single nucleotide polymorphisms (SNPs).12 Accordingly, several studies have sought to identify these genetic mutations to determine the drug resistance potential of pathogens.13 For example, computational simulations using clustered regularly interspaced short palindromic repeats (CRISPR) and loop-mediated isothermal amplification protocols have been employed to detect treatment-resistant Plasmodium falciparum by targeting SNP loci through in silico methods.14,15 Targeting suspected drug resistance genes with nucleases can further confirm their role in conferring resistance. CRISPR, in particular, is widely used for genetic modification because a single guide RNA directs the nuclease to create precise double-stranded breaks at the desired genomic site.16
P. falciparum is the parasite responsible for malaria in humans, with an estimated 263 million cases and 597,000 malaria-related deaths reported in 2023.17,18 The disease is commonly transmitted through mosquito vectors.19 However, P. falciparum has shown a steady rise in various forms of drug resistance, leading to increased treatment complexity and poorer patient outcomes.20 Previous studies have demonstrated that drug resistance genes can be rapidly isolated and detected to enable point-of-care testing and guide more effective therapy.14,15 To contribute to these efforts, the present study aims to develop a detection pipeline capable of identifying SNPs within chromosomes 5, 7, and 13 of P. falciparum.
Study design
This study was designed in three main stages to develop a SNP detection pipeline: (1) data acquisition of both the reference genome and sample sequences, (2) SNP identification through sequence alignment, and (3) annotation of the detected SNPs, if present. The analysis and pipeline development were performed using existing tools available on Galaxy, a web-based data analysis platform from which the workflow was extracted.21 The Galaxy genome annotation pipeline provides an accessible, automated, and scalable framework for genome analysis. It includes all the necessary tools to help with both functional and structural gene annotation, enabling researchers with minimal bioinformatics experience to perform accurate functional and structural gene annotation. An illustration of the workflow is presented in Figure, and the complete pipeline can be accessed through the Galaxy Server.22 Because real laboratory samples were not available, dummy samples were generated by combining known mutation sites of P. falciparum with the full genomic sequences of chromosomes 5, 7, and 13.
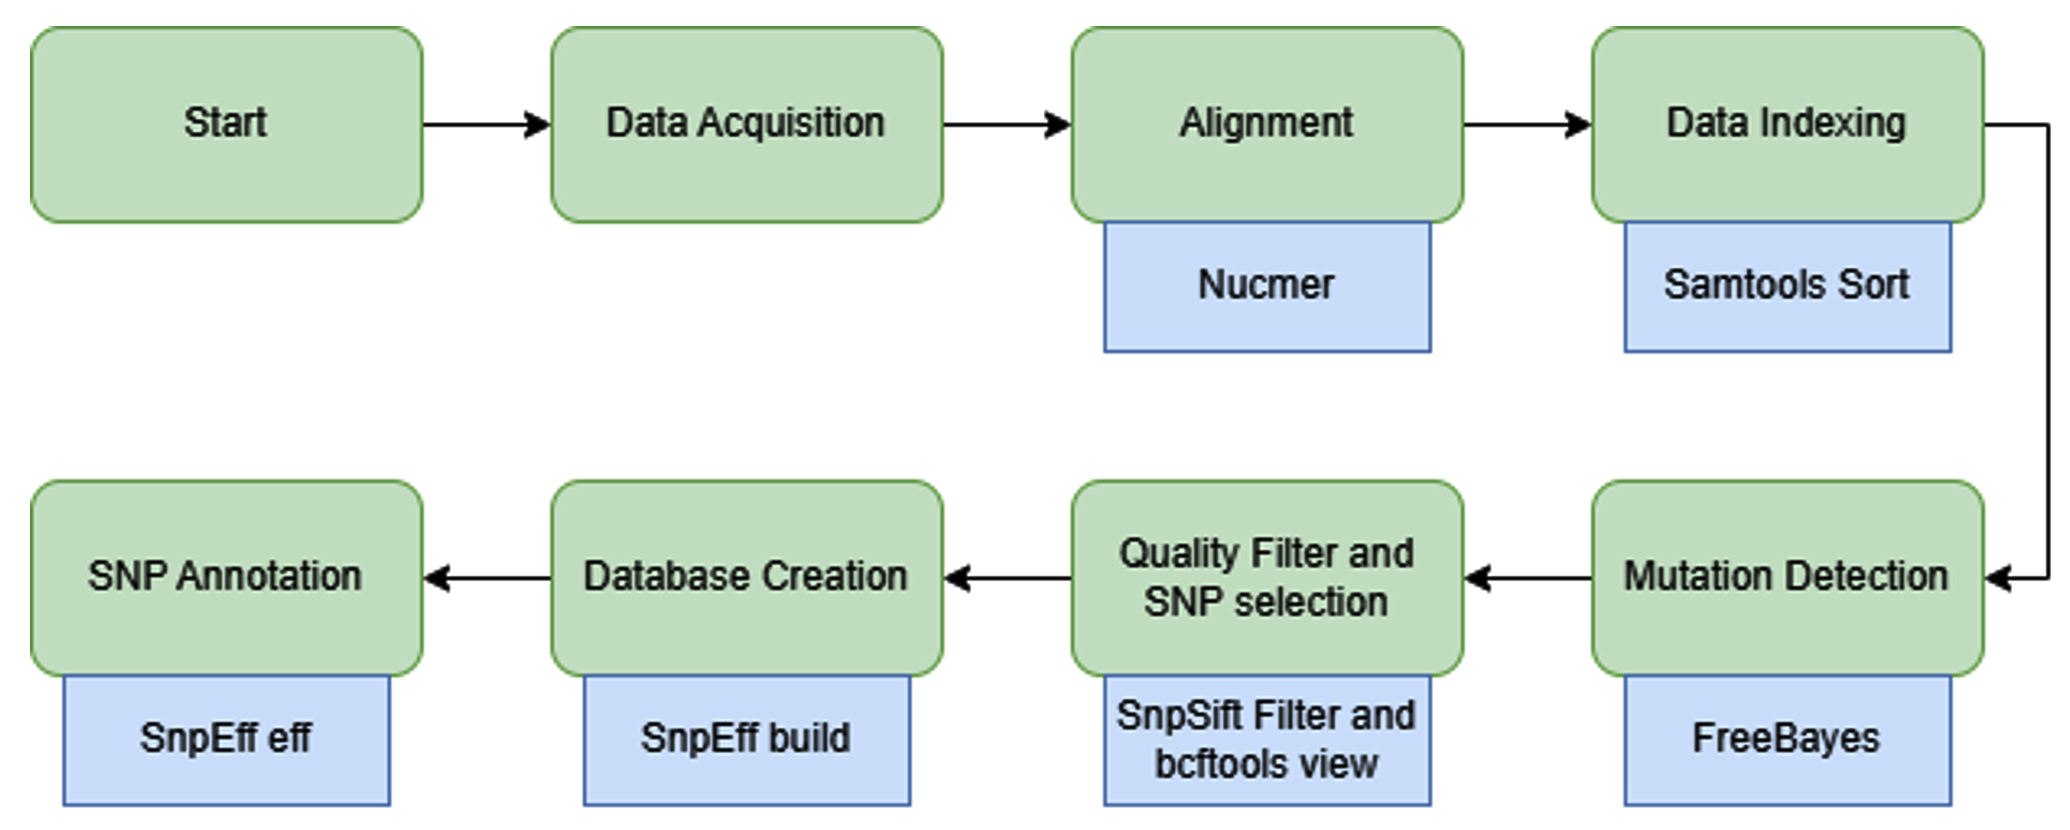
Figure. Schematic representation of the analysis pipeline. Green shapes indicate the main workflow steps, whereas blue shapes denote the specific tools used within the Galaxy platform
Genomic sequence sample acquisition
Genomic sample data were obtained from previously published research with publicly available datasets accessible at http://www.malariagen.net/resource/29. The samples originated from regions in Africa, South Asia, and Southeast Asia.23 Data from outside these regions were excluded through filtering. The dataset was provided in spreadsheet format and processed using the Python package pandas. Given the large dataset size, a subset of 100 samples was randomly selected while ensuring representation from different geographic locations.
Reference sequence sample acquisition
The complete reference genome sequence of P. falciparum was obtained from the National Center for Biotechnology Information under accession number GCF_000002765.3.24 The reference genome was provided in FASTA format. Genomic information from chromosomes 5, 7, and 13 was specifically used, as these regions contain the loci of the PfMDR1, PfCRT, and PfKelch13 genes, respectively.
Sequence alignment
The acquired sample sequences were aligned against the reference genome to identify variations indicative of genomic mutations. The reference genome sizes for chromosomes 5, 7, and 13 were 1.3 Mbp, 1.4 Mbp, and 2.9 Mbp, respectively. Sequence alignment was performed using the nucmer tool from the MUMmer alignment suite, which is specifically designed to align nucleotide sequences between two genomes.25 The resulting alignments were then sorted and indexed using Samtools sort, which organizes the detected differences according to their genomic coordinates. The final output of this step was stored in Binary Alignment Map (BAM) format to enhance storage efficiency and facilitate subsequent analyses.
BAM and Variant Call Format (VCF) processing
The sorted BAM output from Samtools sort was processed using FreeBayes to identify mutations and generate a VCF file for downstream analysis. The detected variants included insertions and deletions (indels), SNPs, multiple nucleotide polymorphisms, and other complex combinations of mutations. Because not all detected variants are of high quality, additional filtering criteria were applied based on Phred quality scores and read depth to ensure accuracy. Variant quality control was performed using SnpSift, which filters variants according to these parameters.26 To isolate SNPs specifically, bcftools view was employed. The final output of this step was a curated VCF file containing only high-confidence SNPs.
SNP annotation
SnpEff was used to annotate the identified SNPs. SnpEff is a prediction tool that annotates detected mutations based on the general feature list of a reference genome.26 To perform the annotation, a local database was first created by acquiring complete annotation files for P. falciparum chromosomes 5, 7, and 13 from PlasmoDB (plasmodb.org). These files, based on the latest Pf3D7 genome release, were compiled using the SnpEff database build utility. Annotation was then performed separately for each of the three chromosomes.
SNP annotation
A random sample of 100 genomic sequences was acquired and verified to ensure representation from diverse geographic regions and countries. These sequences were aligned with the reference sequences for chromosomes 5, 7, and 13, which correspond to P. falciparum drug resistance genes. A total of 313, 3,321, and 4,188 variants were initially identified on chromosomes 5, 7, and 13, respectively. Because these variants included low-quality mutations and non-SNP variations, filtering was performed. After applying the quality threshold of a Phred score greater than 30, only 12, 103, and 79 high-confidence SNPs were retained for chromosomes 5, 7, and 13, respectively. These SNPs were subsequently annotated against the P. falciparum Pf3D7 version 3 reference genome to determine their genomic locations and potential functional impacts. The SnpEff tool generated annotation results that included information such as the number of effects categorized by impact, functional class, mutation type, and genomic region, as well as details on specific base substitutions. The complete annotation dataset, including positional and functional details for each mutation, is available in the appendix and has been archived as a data repository on Zenodo (https://zenodo.org).27
Chromosome 5 SNP annotations
The annotation results for chromosome 5 are presented in Tables 1-3. Table 1 summarizes the functional impact of the identified mutations and their frequency of occurrence. Table 2 details the genomic regions where the SNPs were detected and their variant types, whereas Table 3 lists the observed base substitutions and their frequencies.
Table (1):
Number of variants by impact of the annotated mutations in chromosome 5
Type |
Count |
|---|---|
Moderate |
1 |
Modifier |
11 |
Table (2):
Number of variants by type of variance and where they occur in chromosome 5
| Type | Region | ||
|---|---|---|---|
| Type | Count | Type | Count |
| 5’ UTR variant | 1 | Exon | 1 |
| Intergenic Region | 7 | Intergenic | 7 |
| Intron Variant | 3 | Intron | 3 |
| Missense Variant | 1 | 5’ UTR | 1 |
Table (3):
Base changes count for each SNPs with the row being the original reference bases, meanwhile the column representing what base they changed into for each SNP in chromosome 5
A |
C |
G |
T |
|
|---|---|---|---|---|
A |
0 |
0 |
2 |
3 |
C |
0 |
0 |
0 |
1 |
G |
1 |
0 |
0 |
0 |
T |
3 |
2 |
0 |
0 |
According to Table 1, a total of 12 SNPs were identified and annotated on chromosome 5, the majority of which were classified as modifiers. Only one SNP exhibited a moderate impact, whereas the remaining 11 were predicted to have modifier effects on gene translation within this chromosome.
As shown in Table 2, the single SNP with a moderate effect was identified as a missense mutation. Most of the remaining SNPs were located in intergenic regions, with only one occurring within an exon.
The base substitutions for these SNPs are summarized in Table 3. The most frequent nucleotide changes were adenine to thymine (A®T) and thymine to adenine (T®A), together accounting for six of the 12 SNPs. Other substitutions included adenine to guanine (A®G), thymine to cytosine (T®C), guanine to adenine (G®A), and cytosine to thymine (C®T). A single missense mutation occurred, resulting in a codon change from GAA to AAA. This substitution led to an amino acid change from glutamic acid to lysine.
Chromosome 7 SNP annotations
The annotation results for chromosome 7 are presented in Tables 4-6. Table 4 summarizes the functional impact of the identified mutations and their frequency of occurrence. Table 5 details the genomic regions where the SNPs were detected and their variant types, whereas Table 6 lists the observed base substitutions and their frequencies.
Table (4):
Number of variants by impact of the annotated mutations in chromosome 7
Type |
Count |
|---|---|
Low |
12 |
Moderate |
19 |
Modifier |
74 |
Table (5):
Number of variants by type of variants and where they occur in chromosome 7
| Type | Region | ||
|---|---|---|---|
| Type | Count | Type | Count |
| Intergenic Region | 59 | Exon | 33 |
| Intron Variant | 11 | Intergenic | 59 |
| Missense Variant | 19 | Intron | 11 |
| Non-coding transcript exon variant | 2 | Transcript | 2 |
| Non-coding transcript variant | 2 | ||
| Synonymous Variant | 12 | ||
Table (6):
Base changes count for each SNPs with the row being the original reference bases, meanwhile the column representing what base they changed into for each SNP in chromosome 7
A |
C |
G |
T |
|
|---|---|---|---|---|
A |
0 |
10 |
15 |
9 |
C |
2 |
0 |
2 |
10 |
G |
15 |
2 |
0 |
6 |
T |
13 |
17 |
2 |
0 |
According to Table 4, a total of 105 SNPs were identified and annotated on chromosome 7, the majority of which were classified as modifiers. Nineteen SNPs exhibited a moderate impact, whereas 74 were predicted to have modifier effects on gene translation within this chromosome. Moreover, 12 SNPs were categorized as having a low impact.
As show in Table 5, most SNPs were located in intergenic regions. Nineteen of the identified SNPs resulted in missense mutations, whereas 12 were synonymous. The remaining variants were distributed across intronic and transcript regions of the chromosome.
The base substitutions for these SNPs are summarized in Table 6. The most frequent nucleotide change was thymine to cytosine (T→C), observed 17 times. Both transition and transversion mutations were detected across all nucleotide bases. Codon changes (Appendix 1) associated with these SNPs resulted in multiple amino acid substitutions, most commonly asparagine to aspartic acid (three occurrences), and lysine to asparagine and glutamine substitutions, each occurring twice (Appendix 2). In total, 19 amino acid residues were altered owing to missense SNPs, while 12 synonymous mutations were also identified (Appendix 3).
Chromosome 13 SNP annotations
The annotation results for chromosome 13 are presented in Tables 7-9. Table 7 summarizes the functional impact of the identified mutations and their frequency of occurrence. Table 8 details the genomic regions where the SNPs were detected and their variant types, whereas Table 9 lists the observed base substitutions and their frequencies.
Table (7):
Number of variants by impact of the annotated mutations in chromosome 13
Type |
Count |
|---|---|
Low |
4 |
Moderate |
10 |
Modifier |
65 |
Table (8):
Number of variants by type of variance and where they occur in chromosome 13
| Type | Region | ||
|---|---|---|---|
| Type | Count | Type | Count |
| Intergenic Region | 61 | Exon | 14 |
| Intron Variant | 4 | Intergenic | 61 |
| Missense Variant | 10 | Intron | 4 |
| Splice region variant | 1 | ||
| Synonymous Variant | 4 | ||
Table (9):
Base changes count for each SNPs with the row being the original reference bases, meanwhile the column representing what base they changed into for each SNP in chromosome 13
A |
C |
G |
T |
|
|---|---|---|---|---|
A |
0 |
4 |
19 |
11 |
C |
2 |
0 |
2 |
13 |
G |
7 |
1 |
0 |
6 |
T |
8 |
12 |
0 |
0 |
According to Table 7, a total of 79 SNPs were identified and annotated on chromosome 13, the majority of which were classified as modifiers. Ten SNPs exhibited a moderate impact, whereas 65 were predicted to have modifier effects on gene translation within this chromosome. Moreover, four SNPs were categorized as having a low impact.
As shown in Table 8, most SNPs were located in intergenic regions. Ten of the identified SNPs resulted in missense mutations, whereas four were synonymous. Additional variants were observed within intronic regions of the chromosome.
The base substitutions for these SNPs are summarized in Table 9. The most frequent nucleotide change was adenine to guanine (A®G), followed by cytosine to thymine (C®T) (Appendix 2). In terms of amino acid substitutions, nine residues were altered owing to missense SNPs, while four synonymous mutations were also identified (Appendix 4).
In total, 100 sequence samples were analyzed for existing SNPs, with variant quality determined using the Phred quality score (Q value). A Q value of 10 corresponds to a 1-in-10 probability of an incorrect base call, whereas a Q value of 20 indicates a 1-in-100 probability.28 Under the parameters used in this study, the expected error rate was approximately 1 in 1,000. SNPs were annotated to assess their potential impact on amino acid translation, transcription, and gene expression.29 Nucleotide substitutions can be categorized as either transversions or transitions.30 Transversions involve the exchange of a purine (adenine or guanine) for a pyrimidine (cytosine or thymine) or vice versa, whereas transitions occur where a purine replaces another purine, or a pyrimidine replaces another pyrimidine.31 Depending on their genomic context, these mutations may alter gene expression when occurring in regulatory regions or modify protein structure and function by changing the encoded amino acids.32
SNPs in chromosome 5 and their implications for P. falciparum
Analysis of the sample revealed 12 SNPs on chromosome 5, with only one located within an exon and affecting translation and transcription. The remaining 11 SNPs showed modifier effects, as expected since they occur in intergenic regions.33 Modifier mutations can influence transcriptional regulation, potentially leading to overexpression or underexpression of specific genes.34 Known mutations within the PfMDR1 gene include N86Y, Y184F, and D1246Y;20 these changes are known to alter the absorption and activity of artemisinin-based combination therapies in P. falciparum.35 The PfMDR1 gene is located between positions 957,890 and 962,149 on chromosome 5.36 The single annotated exon SNP, found at position 172,801 (Appendix 5), lies outside this region, within an ATP-dependent helicase gene (PF3D7_1202000), suggesting a potential regulatory effect on transcription.37 The absence of SNPs directly within the PfMDR1 locus indicates that, within this dataset of 100 samples, no high-confidence mutations met the stringent filtering criteria. However, several modifier SNPs were detected adjacent to the PfMDR1 gene (Appendix 5), demonstrating the capacity of the pipeline to accurately detect SNPs from genomic sequence input.38
SNPs in chromosome 7 and their Implications for P. falciparum
A total of 103 SNPs were identified and annotated on chromosome 7. Most were classified as modifiers, although several low- and moderate-impact SNPs were also detected. Low-impact SNPs are typically synonymous mutations, where base substitutions do not alter the amino acid sequence,39 yet they may still affect gene regulation or downstream expression.40 In contrast, moderate-impact SNPs cause amino acid substitutions that can alter protein structure or function.41 Most SNPs were located in intergenic regions, suggesting possible regulatory effects on transcription and translation.33 In total, 33 SNPs were detected within exons, 19 of which led to amino acid substitutions. The drug resistance gene located on chromosome 7 is PfCRT, which encodes the protein responsible for exporting chloroquine from the digestive vacuole of the parasite.42 Canonical PfCRT mutations—K76T, C101F, and L272F—occur within positions 403,222 to 406,317.20 The annotated SNPs in this study did not correspond to those specific sites (Appendix 6), suggesting that no known chloroquine resistance mutations were present. Nevertheless, other detected SNPs may still influence parasite survival. For instance, several were located in genes involved in erythrocyte adhesion and immune evasion, which can reduce parasite clearance rates.43 Furthermore, the abundance of intergenic SNPs could potentially increase PfCRT expression, enhancing chloroquine efflux and promoting resistance under drug pressure.44
SNPs in chromosome 13 and their implications for P. falciparum
Seventy-nine SNPs were detected and annotated on chromosome 13, the majority of which were located in intergenic regions. These variants are likely to exert modifier effects on gene translation and expression.33 Synonymous mutations were also identified, alongside 10 SNPs that resulted in amino acid substitutions. Drug resistance associated with chromosome 13 is primarily linked to mutations in the PfKelch13 gene, with common variants including N458Y, Y493H, and R539T.20 The PfKelch13 gene is located between positions 172,4817 and 172,6997, whereas the annotated SNPs in this study were found near—but not directly within—this region (Appendix 7).45 Although none of the detected SNPs corresponded precisely to known resistance sites, their proximity suggests potential roles in regulatory modification or emerging variants that warrant further investigation.
P. falciparum remains a persistent challenge in malaria treatment owing to the emergence and spread of drug resistance. These resistances arise from genetic mutations driven by multiple factors, highlighting the importance of detecting and understanding their effects. Most resistance in P. falciparum has been linked to SNPs, which formed the focus of this study. The developed pipeline successfully detected and annotated SNPs within chromosomes 5, 7, and 13, which harbor the PfMDR1, PfCRT, and PfKelch13 genes—key determinants of chloroquine and artemisinin-based combination therapy resistance. Although no SNPs directly within these genes were identified in the sample dataset, the results demonstrate that the pipeline can reliably identify and annotate SNPs when provided with genomic sequence data. Further refinement and validation of the pipeline could be achieved by incorporating a larger dataset and using targeted amplification of resistance-associated genes through polymerase chain reaction to enhance accuracy and detection sensitivity. Overall, this research establishes a practical framework for the detection and analysis of SNPs in P. falciparum, contributing to ongoing efforts to monitor and address antimalarial drug resistance.
ACKNOWLEDGMENTS
The authors would like to thank the Department of Research and Community Service (LPPM) of i3L University for their heartfelt support. The authors are also thankful to the Galaxy server for providing the cloud service.
CONFLICT OF INTEREST
The authors declare that there is no conflict of interest.
AUTHORS’ CONTRIBUTION
All authors listed have made a substantial, direct and intellectual contribution to the work, and approved it for publication.
FUNDING
This study was funded by the Direktorat Penelitian dan Pengabdian Masyarakat, Kementrian Pendidikan Tinggi, Sains, dan Teknologi Republik Indonesia (DPPM Kemendiktisainstek RI) Surat Keputusan Nomor 0419/C3/DT.05.00/2025 dan Perjanjian/Kontrak Nomor 124/C3/pT.05.00PU2025.
DATA AVAILABILITY
The datasets generated and/or analysed during the current study are available from the corresponding author on reasonable request. The pipeline can be accessed through the galaxy server: https://usegalaxy.org/published/workflow?id=8b4b62a55a93a258
ETHICS STATEMENT
Not applicable.
- Chaidir L, Sengstake S, de Beer J, et al. Mycobacterium tuberculosis genotypic drug resistance patterns and clustering in Jayapura, Papua, Indonesia. Int J Tuberc Lung Dis. 2015;19(4):478-484.
Crossref - Vieira G, Leal N, Rodrigues A, Chaves C, Rodrigues F, Osorio N. MRSA MSSA causing infections: prevalence of mecA gene. Eur J Public Health. 2020;30(Suppl_2):ckaa040.052.
Crossref - Lai Y, Wei W, Du Y, Gao J, Li Z. Biomaterials for Helicobacter pylori therapy: therapeutic potential and future perspectives. Gut Microbes. 2022;14(1):2120747.
Crossref - Saha K, Sarkar D, Khan U, et al. Capsaicin inhibits inflammation and gastric damage during H. pylori infection by targeting NF-kB–miRNA axis. Pathogens. 2022;11(6):641.
Crossref - Salam MA, Yusuf AAM, Pawar JS, Akhter N, Lucy IB. Conventional methods and future trends in antimicrobial susceptibility testing. Saudi J Biol Sci. 2023;30(3):103582.
Crossref - Chaisirin W, Wongkrajang P, Praphruetkit N, et al. Role of point of care testing in reducing time to treatment decision making in urgency patients: a randomized controlled trial. West J Emerg Med. 2020;21(2):386-393.
Crossref - Harikumar G, Krishanan K. The growing menace of drug resistant pathogens and recent strategies to overcome drug resistance: a review. J King Saud Univ Sci. 2022;34(4):101979.
Crossref - Timms VJ, Hassan KA, Mitchell HM, Neilan BA. Comparative genomics between human and animal associated subspecies of the Mycobacterium avium complex: a basis for pathogenicity. BMC Genomics. 2015;16(1):695.
Crossref - Hill AW, Guralnick RP, Wilson MJC, Habib F, Janies D. Evolution of drug resistance in multiple distinct lineages of H5N1 avian influenza. Infect Genet Evol. 2009;9(2):169-178.
Crossref - Tang L, Zhu SL, Fang X, et al. Distinct evolutionary origins of common multi drug resistance phenotypes in Salmonella typhimurium DT104: a convergent process for adaptation under stress. Mol Genet Genomics. 2019;294(3):785-796.
Crossref - Emerson JJ, Li WH. The genetic basis of evolutionary change in gene expression levels. Philos Trans R Soc B Biol Sci. 2010;365(1552):2581 2590.
Crossref - Fojo T. Multiple paths to a drug resistance phenotype: mutations, translocations, deletions and amplification of coding genes or promoter regions, epigenetic changes and microRNAs. Drug Resist Updat. 2007;10(1 2):59 67.
Crossref - Anderson MW, Schrijver I. Next generation DNA sequencing and the future of genomic medicine. Genes. 2010;1(1):38-69.
Crossref - Parikesit AA, Hermantara R, Kevin G, Sidhartha E. Designing hybrid CRISPR Cas12 and LAMP detection systems for treatment resistant Plasmodium falciparum with in silico method. Narra J. 2023;3(3):e301.
Crossref - Parikesit AA, Hermantara R, Sidhartha E, et al. Optimizing CRISPR Cas12 based detection methods for drug resistant Plasmodium falciparum with an advanced gene visualization pipeline. J Res Pharm. 2025;29(3).
Crossref - Ansori ANM, Antonius Y, Susilo RJ, et al. Application of CRISPR Cas9 genome editing technology in various fields: a review. Narra J. 2023;3(2):e184.
Crossref - World Health Organization. Antimicrobial Resistance: Global Report on Surveillance. Geneva, Switzerland: World Health Organization; 2014. https://www.who.int/publications/i/item/9789241564748
- World Health Organization. World Malaria Report 2024. Geneva, Switzerland: World Health Organization; 2024. https://www.who.int/teams/global-malaria-programme/reports/world-malaria-report-2024
- Weiss DJ, Dzianach PA, Saddler A, et al. Mapping the global prevalence, incidence, and mortality of Plasmodium falciparum and Plasmodium vivax malaria, 2000–22: a spatial and temporal modelling study. Lancet. 2025;405(10483):1180-1196.
Crossref - She D, Wang Z, Liang Q, et al. Polymorphisms of pfcrt, pfmdr1, and K13 propeller genes in imported falciparum malaria isolates from Africa in Guizhou province, China. BMC Infect Dis. 2020;20(1):741.
Crossref - Abueg AL, Afgan E, Allart O, et al. The Galaxy platform for accessible, reproducible, and collaborative data analyses: 2024 update. Nucleic Acids Res. 2024;52(W1):w83-w94.
Crossref - Fugaha DR. SNP Analysis. Galaxy; 2025. Accessed 2025. https: usegalaxy.org/ published workflow?id=8b4b62a55a93a258
- Jacob CG, Thuy Nhien N, Mayxay M, et al. Genetic surveillance in the Greater Mekong subregion and South Asia to support malaria control and elimination. eLife. 2021;10:e62997.
Crossref - Hernandez SI, Berezin CT, Miller KM, Peccoud SJ, Peccoud J. Sequencing strategy to ensure accurate plasmid assembly. ACS Synth Biol. 2024;13(12):4099-4109.
Crossref - Marcais G, Delcher AL, Phillippy AM, Coston R, Salzberg SL, Zimin A. MUMmer4: A fast and versatile genome alignment system. PLoS Comput Biol. 2018;14(1):e1005944.
Crossref - Cingolani P, Platts A, Wang LL, et al. A program for annotating and predicting the effects of single nucleotide polymorphisms, SnpEff. Fly (Austin). 2012;6(2):80-92.
Crossref - Fugaha DR. Appendix of Plasmodium falciparum drug resistance single nucleotide polymorphism analysis pipeline development based on Southeast Asian genetic barcode samples. 2025.
Crossref - Luo J, Meng Z, Xu X, et al. Systematic benchmarking of nanopore Q20+ kit in SARS CoV 2 whole genome sequencing. Front Microbiol. 2022;13:973367.
Crossref - Robert F, Pelletier J. Exploring the impact of single nucleotide polymorphisms on translation. Front Genet. 2018;9:507.
Crossref - Stoltzfus A, Norris RW. On the causes of evolutionary transition: transversion bias. Mol Biol Evol. 2016;33(3):595-602.
Crossref - Guo C, McDowell IC, Nodzenski M, et al. Transversions have larger regulatory effects than transitions. BMC Genomics. 2017;18(1):394.
Crossref - Rojano E, Seoane P, Juan AGR, Perkins JR. Regulatory variants: from detection to predicting impact. Brief Bioinform. 2019;20(5):1639-1654.
Crossref - Chen J, Tian W. Explaining the disease phenotype of intergenic SNP through predicted long range regulation. Nucleic Acids Res. 2016;44(18):8641-8654.
Crossref - Campino S, Marin Menendez A, Kemp A, et al. A forward genetic screen reveals a primary role for Plasmodium falciparum reticulocyte binding protein homologue 2a and 2b in determining alternative erythrocyte invasion pathways. PLoS Pathog. 2018;14(11):e1007436.
Crossref - Okell LC, Reiter LM, Ebbe LS, et al. Emerging implications of policies on malaria treatment: genetic changes in the Pfmdr-1 gene affecting susceptibility to artemether lumefantrine and artesunate amodiaquine in Africa. BMJ Glob Health. 2018;3(5):e000999.
Crossref - Pulcini S, Staines HM, Lee AH, et al. Mutations in the Plasmodium falciparum chloroquine resistance transporter, PfCRT, enlarge the parasite’s food vacuole and alter drug sensitivities. Sci Rep. 2015;5:14552.
Crossref - Chauhan M, Tuteja R. Plasmodium falciparum specific helicase 2 is a dual, bipolar helicase and is crucial for parasite growth. Sci Rep. 2019;9(1):1048.
Crossref - Pandit K, Surolia N, Bhattacharjee S, Karmodiya K. The many paths to artemisinin resistance in Plasmodium falciparum. Trends Parasitol. 2023;39(12):1117 1130.
Crossref - Zhao Z, Fu YX, Hewett Emmett D, Boerwinkle E. Investigating single nucleotide polymorphism (SNP) density in the human genome and its implications for molecular evolution. Gene. 2003;312:207-213.
Crossref - Crawford ED, Quan J, Horst JA, Ebert D, Wu W, DeRisi JL. Plasmid free CRISPR Cas9 genome editing in Plasmodium falciparum confirms mutations conferring resistance to the dihydroisoquinolone clinical candidate SJ733. PLoS One. 2017;12(5):e0178163.
Crossref - Petrosino M, Novak L, Pasquo A, et al. Analysis and interpretation of the impact of missense variants in cancer. Int J Mol Sci. 2021;22(11):5416.
Crossref - Ocan M, Ashaba FK, Mwesigwa S, Edgar K, Kamya MR, Nsobya SL. Prevalence of arps10, fd, pfmdr 2, pfcrt and pfkelch13 gene mutations in Plasmodium falciparum parasite population in Uganda. PLoS One. 2022;17(5):e0268095.
Crossref - Goel S, Palmkvist M, Moll K, et al. RIFINs are adhesins implicated in severe Plasmodium falciparum malaria. Nat Med. 2015;21(4):314-317.
Crossref - Njokah MJ, Kang’ethe JN, Kinyua J, Kariuki D, Kimani FT. In vitro selection of Plasmodium falciparum Pfcrt and Pfmdr1 variants by artemisinin. Malar J. 2016;15(1):381.
Crossref - Matrevi SA, Tandoh KZ, Bruku S, et al. Novel pfk13 polymorphisms in Plasmodium falciparum population in Ghana. Sci Rep. 2022;12(1):8312.
Crossref
© The Author(s) 2025. Open Access. This article is distributed under the terms of the Creative Commons Attribution 4.0 International License which permits unrestricted use, sharing, distribution, and reproduction in any medium, provided you give appropriate credit to the original author(s) and the source, provide a link to the Creative Commons license, and indicate if changes were made.