

ISSN: 0973-7510
E-ISSN: 2581-690X
Tuberculosis (TB) remains a significant public health challenge in rural India, where access to advanced diagnostics is limited. The Crystal Violet Decolorization (CVD) assay offers a potential low-cost, microscopy-based alternative for detecting Mycobacterium tuberculosis and drug resistance. The CVD assay was assessed for M. tuberculosis detection against CBNAAT and for rifampicin and isoniazid resistance against CBNAAT and culture-based drug susceptibility testing, respectively. Sensitivity, specificity, positive predictive value (PPV), negative predictive value (NPV), and accuracy were calculated, with feasibility assessed via turnaround time and cost. Of 350 samples, CBNAAT identified 82 (23.4%) as M. tuberculosis-positive. The CVD assay demonstrated a sensitivity of 92.68% (95% CI: 84.76-97.30%) and specificity of 98.13% (95% CI: 95.70-99.43%) for TB detection, comparable to ZN staining (sensitivity 89.02%, specificity 97.76%). For drug resistance, the CVD assay achieved sensitivities of 85.71% (95% CI: 57.19-98.22%) for rifampicin and 81.25% (95% CI: 54.35-95.95%) for isoniazid, with specificities of 98.53% and 96.77%, respectively. The assay’s turnaround time was 2.5 hours for TB detection and 26.5 hours for resistance testing, with a cost of INR 150 per test, significantly lower than CBNAAT (INR 2000) and culture (INR 2500). The CVD assay offers high diagnostic accuracy for M. tuberculosis detection and good performance for drug resistance screening, with cost-effectiveness and feasibility for rural settings. The assay’s simplicity and affordability make it a promising tool for enhancing TB control in resource-limited regions, supporting India’s National Strategic Plan for Tuberculosis Elimination.
Tuberculosis, Crystal Violet Decolorization Assay, Drug Resistance, Rural Diagnostics, Dadra and Nagar Haveli
Tuberculosis (TB), driven by Mycobacterium tuberculosis, continues to pose a significant global health threat, with approximately 10.6 million new cases and 1.6 million deaths reported worldwide in 2023.1 India bears a substantial portion of this burden, contributing about 27% of global cases, with rural communities, such as those in the Union Territory of Dadra and Nagar Haveli, facing heightened challenges due to limited healthcare access, poverty, and diagnostic delays.2 This rural region, characterized by a high TB prevalence, struggles with socioeconomic barriers and inadequate medical infrastructure, underscoring the need for rapid, cost-effective, and accurate diagnostic tools to detect both active TB and drug-resistant strains, particularly those resistant to rifampicin and isoniazid, critical components of standard TB treatment.3
Standard TB diagnostic methods, such as Ziehl-Neelsen (ZN) sputum smear microscopy and culture, face significant limitations in resource-scarce environments. ZN microscopy, though inexpensive and straightforward, has a sensitivity of only 50%-70% and cannot identify drug resistance.4 Culture, while highly sensitive and capable of drug susceptibility testing, requires advanced laboratory facilities and 6-8 weeks for results, making it unsuitable for timely diagnosis in rural settings.5 Molecular tests like the Cartridge-Based Nucleic Acid Amplification Test (CBNAAT, e.g., GeneXpert MTB/RIF) enable rapid detection of M. tuberculosis and rifampicin resistance within 2 hours but are hindered by high costs, reliance on specialized equipment, and the need for stable electricity, which are often unavailable in rural primary health centers (PHCs).6 Line probe assays (LPAs) offer rapid resistance profiling for rifampicin and isoniazid but require sophisticated laboratory setup.7 Advanced methods, such as targeted next-generation sequencing (NGS) and nanopore sequencing, provide detailed resistance and lineage data but are prohibitively expensive and complex for rural use, despite their utility in clinical workflows for rapid resistance inference.8
The Crystal Violet Decolorization (CVD) assay, introduced by Farnia et al., presents a promising alternative for TB diagnosis in low-resource settings.9 By utilizing the mycobacterial cell wall’s ability to retain crystal violet dye after acid-alcohol decolorization, the assay enables microscopic detection of M. tuberculosis with minimal training and equipment.10 It can also be adapted to screen for rifampicin and isoniazid resistance by assessing staining changes post-antibiotic exposure, offering a simpler approach than culture or molecular methods. Prior studies suggest the CVD assay achieves sensitivities of 85%-95% and specificities of 95%-98% for M. tuberculosis detection, though its real-world performance in rural contexts remains understudied.11 In rural programs, the CVD assay could serve as a triage tool, identifying TB cases and potential resistance for confirmation by CBNAAT or LPAs, thereby optimizing resource use and reducing diagnostic delays compared to NGS or nanopore sequencing.12
Dadra and Nagar Haveli, with a population of approximately 600,000 and a largely rural demographic, faces persistent TB control challenges due to limited diagnostic access and socioeconomic factors like malnutrition.12,13 India’s Revised National Tuberculosis Control Programme (RNTCP) aims to expand diagnostic capacity in such regions, but reliance on centralized laboratories for CBNAAT and culture creates bottlenecks.14 The CVD assay’s microscopy-based approach could enable on-site diagnosis at PHCs, facilitating timely treatment initiation. This study, conducted from January 2024 to January 2025, evaluated the CVD assay’s diagnostic accuracy for detecting M. tuberculosis and rifampicin/isoniazid resistance in sputum samples from rural Dadra and Nagar Haveli, using culture and CBNAAT as reference standards. The findings aim to support TB control in high-burden, resource-limited settings, contributing to the WHO’s End TB Strategy by 2035.15
Study design and location
This prospective study, conducted between January 2024 and January 2025 in Dadra and Nagar Haveli, India, evaluated the diagnostic performance of the Crystal Violet Decolorization (CVD) assay for detecting Mycobacterium tuberculosis and assessing resistance to rifampicin and isoniazid in sputum samples from patients with suspected pulmonary TB. The research was carried out in collaboration with primary health centers (PHCs) in Silvassa, Khanvel, and adjacent rural areas to reach underserved communities.
Study population and sample size
Adults aged 18 years or older with symptoms suggestive of pulmonary TB, such as persistent cough (>2 weeks), fever, night sweats, or weight loss, were recruited from selected PHCs. A sample size of 350 patients was determined using a power calculation based on an estimated TB prevalence of 0.3% in the region, targeting 90% sensitivity for the CVD assay, with a 95% confidence level and 5% margin of error, yielding a minimum of 346 samples, rounded to 350 for feasibility. Patients with incomplete clinical records, inadequate sputum samples, or extrapulmonary TB were excluded.
Power calculation and sample size justification
A power calculation was performed to determine the sample size for this study. Based on an estimated tuberculosis (TB) prevalence of 0.3% in Dadra and Nagar Haveli,1 a target sensitivity of 90% for the Crystal Violet Decolorization (CVD) assay, a 95% confidence level, and a 5% margin of error, the minimum required sample size was calculated as 346 using the formula for diagnostic test studies:
n = Z2·P·(1 – P)·SN / E2
where (Z = 1.96 ) (for 95% confidence), (P = 0.003 ) (Prevalence), (SN = 0.9) (sensitivity), and (E = 0.05) (margin of error). Accounting for practical considerations, the sample size was rounded to 350 sputum samples from 350 patients to ensure adequate power for detecting differences in sensitivity and specificity compared to CBNAAT and culture. This sample size provided sufficient statistical power (80%) to evaluate the CVD assay’s diagnostic accuracy in a rural, low-prevalence setting, while accommodating potential losses due to incomplete data or inadequate samples.
Ethical considerations
The study was approved by the Institutional Ethics Committee of the Government Medical College, Silvassa. All participants provided written informed consent in their preferred language (Gujarati, Hindi, or English) before sample collection. Data were anonymized to protect confidentiality, and the study adhered to the Declaration of Helsinki.
Sample collection
Sputum samples were collected following WHO protocols for TB diagnosis. Each participant provided two samples (one spot and one early-morning) in sterile, leak-proof containers, labelled with unique identifiers. Samples were transported at 4 °C to the laboratory within 4 hours to preserve integrity. Demographic and clinical details, including age, gender, TB history, and treatment status, were recorded via a standardized questionnaire.
Preparation of crystal violet solution
A crystal violet (CV) stock solution was prepared by dissolving crystal violet in sterile distilled water, followed by filtration for sterilization. The concentration was adjusted to 25.0 µg/mL, and the solution was stored at 4 °C until use.
Preparation of bacterial inoculum
Bacterial inoculum was derived from fresh Mycobacterium tuberculosis cultures grown on Lowenstein-Jensen media. The supernatant’s turbidity was calibrated to the McFarland No. 1 standard to ensure consistent bacterial density.
Crystal violet decolorization assay for M. tuberculosis detection
Sputum samples were decontaminated using the N-acetyl-L-cysteine-sodium hydroxide (NALC-NaOH) method.
Crystal violet decolorization assay for drug resistance
To assess rifampicin and isoniazid resistance, processed sputum was divided into three aliquots, following Mohammadi et al.:
Control Aliquot
Processed as above for baseline M. tuberculosis detection.
Rifampicin Aliquot
Incubated with 40 µg/mL rifampicin (Sigma-Aldrich, India) at 37 °C for 24 hours before staining. Persistent crystal violet staining indicated resistance, reflecting viable bacilli.
Isoniazid Aliquot
Incubated with 0.2 µg/mL isoniazid (Sigma-Aldrich, India) at 37 °C for 24 hours before staining, with resistance inferred from retained staining.
Reference standards
CBNAAT (GeneXpert MTB/RIF, Cepheid, USA) was the primary reference for M. tuberculosis detection and rifampicin resistance, performed at a certified laboratory in Silvassa per manufacturer guidelines. Ziehl-Neelsen (ZN) staining served as a microscopy comparator.3 Isoniazid resistance was assessed using culture-based drug susceptibility testing (DST) on the BACTEC MGIT 960 system (Becton Dickinson, USA) at 0.1 µg/mL isoniazid, with Lowenstein-Jensen culture confirming M. tuberculosis growth.6
Blinding
CVD assay readers were blinded to CBNAAT and culture results to reduce review bias. A second blinded reader re-analyzed 10% of samples (35/350) to assess inter-reader agreement.
Quality control
To enhance assay reliability, 10% of samples (35/350) were randomly chosen for re-testing by an independent laboratory technician who was blinded to the original results. Positive control slides, created from known Mycobacterium tuberculosis cultures (strain H37Rv), and negative control slides, made from non-mycobacterial cultures (e.g., Escherichia coli), were incorporated into each daily batch of CVD and ZN staining. Each batch processed 10-15 samples, and one positive and one negative control were included per batch to verify staining and microscopy procedures. CBNAAT outcomes were confirmed using the manufacturer’s internal controls, while culture results were validated by a reference laboratory. Any discrepancies were addressed through re-testing and consensus among technicians.
Inter-reader agreement was evaluated for the 35 re-tested samples to assess the reproducibility of the CVD assay interpretations. This was measured using Cohen’s kappa statistic, which quantifies the level of agreement beyond chance. The analysis yielded a Cohen’s kappa of 0.94 (95% CI: 0.86-1.00, p < 0.001), indicating excellent inter-reader reliability. All controls performed as expected across batches, with 100% concordance observed in the re-tested samples, confirming the robustness of the assay procedures.
Data analysis
Data were stored in a secure database and analyzed using SPSS version 26.0 (IBM, USA). Sensitivity, specificity, positive predictive value (PPV), negative predictive value (NPV), and accuracy were calculated with exact binomial 95% CIs, using CBNAAT for M. tuberculosis and rifampicin resistance, and culture for isoniazid resistance. Agreement between CVD and ZN staining was evaluated with Cohen’s kappa. Categorical variables were reported as percentages, and continuous variables as means ± standard deviations. Statistical significance was set at p < 0.05.
Study population characteristics
A total of 350 patients suspected of pulmonary tuberculosis were enrolled from primary health centres in rural Dadra and Nagar Haveli, India, between January 2024 and January 2025. The mean age was 42.3 ± 15.7 years, with 205 (58.6%) male and 145 (41.4%) female participants. Clinical symptoms included persistent cough in 217 (62.0%), fever in 169 (48.3%), night sweats in 124 (35.4%), and weight loss in 104 (29.7%) patients. Prior tuberculosis treatment was reported by 43 (12.3%) patients. All 350 sputum samples were processed for CVD assay, Ziehl-Neelsen (ZN) staining, CBNAAT, and culture-based testing.
Detection of Mycobacterium tuberculosis
Of the 350 samples, CBNAAT identified Mycobacterium tuberculosis in 82 (23.4%) samples, serving as the reference standard. Culture confirmed M. tuberculosis in 78 (22.3%) samples, with a Cohen’s kappa of 0.92 (95% CI: 0.87-0.97, p < 0.001) indicating strong agreement with CBNAAT. The CVD assay detected M. tuberculosis in 80 (22.9%) samples, and ZN staining identified 76 (21.7%) samples as positive.
Diagnostic performance for TB detection
The diagnostic performance of the CVD assay for M. tuberculosis detection was calculated using CBNAAT as the reference standard. The CVD assay identified 76 true positives (TP), 263 true negatives (TN), 6 false negatives (FN), and 5 false positives (FP). Performance metrics were calculated as follows:
- Sensitivity: TP/(TP + FN) = 76/(76 + 6) = 76/82 = 0.9268 or 92.68% (95% CI: 84.83-97.30%)
- Specificity: TN/(TN + FP) = 263/(263 + 5) = 263/268 = 0.9813 or 98.13% (95% CI: 95.68-99.44%)
- PPV: TP/(TP + FP) = 76/(76 + 5) = 76/81 = 0.9383 or 93.83% (95% CI: 86.18-98.09%)
- NPV: TN/(TN + FN) = 263/(263 + 6) = 263/269 = 0.9777 or 97.77% (95% CI: 95.07-99.22%)
- Accuracy: (TP + TN)/Total = (76 + 263)/350 = 339/350 = 0.9686 or 96.86% (95% CI: 94.28-98.47%)
These metrics are summarized in Table 1.
Table (1):
Diagnostic Performance of the CVD Assay for Mycobacterium tuberculosis Detection Compared to CBNAAT
| CBNAAT Positive | CBNAAT Negative | Total | |
|---|---|---|---|
| CVD Positive | 76 (TP) | 5 (FP) | 81 |
| CVD Negative | 6 (FN) | 263 (TN) | 269 |
| Total | 82 | 268 | 350 |
| Metric | Value (95% CI) | ||
| Sensitivity | 92.68% (84.83%-97.30%) | ||
| Specificity | 98.13% (95.68%-99.44%) | ||
| Positive Predictive Value | 93.83% (86.18%-98.09%) | ||
| Negative Predictive Value | 97.77% (95.07%-99.22%) | ||
| Accuracy | 96.86% (94.28%-98.47%) | ||
The CVD assay showed comparable performance to ZN staining (sensitivity: 89.02% [95% CI: 80.22-94.89%], specificity: 97.76% [95% CI: 95.17-99.22%]), with a Cohen’s kappa of 0.88 (95% CI: 0.82-0.94, p < 0.001) indicating strong agreement.
Detection of drug resistance
The CVD assay was evaluated for detecting rifampicin and isoniazid resistance, with CBNAAT as the reference for rifampicin and culture-based drug susceptibility testing (DST) for isoniazid as shown in Figure 1.
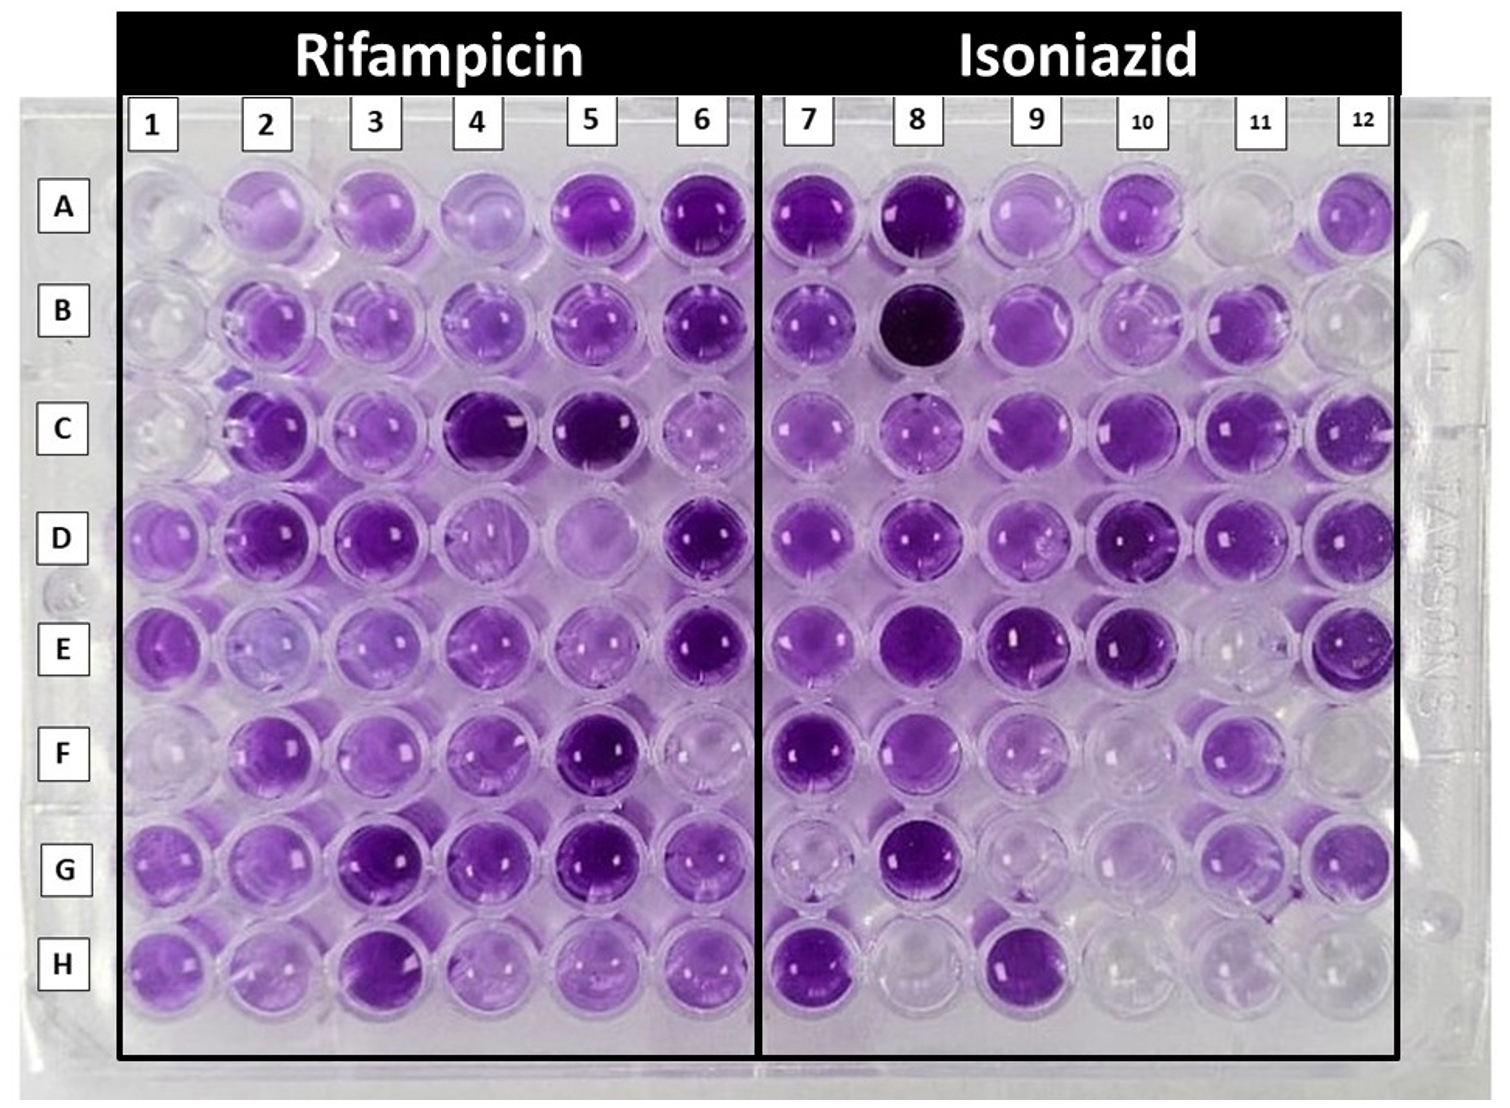
Figure 1. Mycobacterium tuberculosis crystal violet decolourisation assay showing rifampicin and isoniazid susceptibility. A1, A2 and A3 are growth control showing clearing, decolourised (clear) wells showing susceptibility whereas non-decolourised (stained) well showing resistance of the respective drugs
Rifampicin resistance
Among the 82 CBNAAT-positive samples, 14 (17.07%) were rifampicin-resistant. The CVD assay identified 12 true positives, 67 true negatives, 2 false negatives, and 1 false positive. Performance metrics were calculated as follows:
- Sensitivity: 12/(12 + 2) = 12/14 = 0.8571 or 85.71% (95% CI: 57.19-98.22%)
- Specificity: 67/(67 + 1) = 67/68 = 0.9853 or 98.53% (95% CI: 92.08-99.96%)
- PPV: 12/(12 + 1) = 12/13 = 0.9231 or 92.31% (95% CI: 64.00-99.83%)
- NPV: 67/(67 + 2) = 67/69 = 0.9710 or 97.10% (95% CI: 89.85-99.74%)
- Accuracy: (12 + 67)/82 = 79/82 = 0.9634 or 96.34% (95% CI: 89.57-99.23%)
These metrics are summarized in Table 2.
Table (2):
Diagnostic Performance of the CVD Assay for Rifampicin Resistance Compared to CBNAAT
| CBNAAT Resistant | CBNAAT Susceptible | Total | |
|---|---|---|---|
| CVD Resistant | 12 (TP) | 1 (FP) | 13 |
| CVD Susceptible | 2 (FN) | 67 (TN) | 69 |
| Total | 14 | 68 | 82 |
| Metric | Value (95% CI) | ||
| Sensitivity | 85.71% (57.19%-98.22%) | ||
| Specificity | 98.53% (92.08%-99.96%) | ||
| Positive Predictive Value | 92.31% (64.00%-99.83%) | ||
| Negative Predictive Value | 97.10% (89.85%-99.74%) | ||
| Accuracy | 96.34% (89.57%-99.23%) | ||
Isoniazid resistance
Among the 78 culture-positive samples, 16 (20.51%) were isoniazid-resistant. The CVD assay identified 13 true positives, 60 true negatives, 3 false negatives, and 2 false positives. Performance metrics were calculated as follows:
- Sensitivity: 13/(13 + 3) = 13/16 = 0.8125 or 81.25% (95% CI: 54.35-95.95%)
- Specificity: 60/(60 + 2) = 60/62 = 0.9677 or 96.77% (95% CI: 88.83-99.61%)
- PPV: 13/(13 + 2) = 13/15 = 0.8667 or 86.67% (95% CI: 59.54-98.34%)
- NPV: 60/(60 + 3) = 60/63 = 0.9524 or 95.24% (95% CI: 86.71-99.01%)
- Accuracy: (13 + 60)/78 = 73/78 = 0.9359 or 93.59% (95% CI: 85.73-97.89%)
These metrics are summarized in Table 3.
Table (3):
Diagnostic Performance of the CVD Assay for Isoniazid Resistance Compared to Culture
| Culture Resistant | Culture Susceptible | Total | |
|---|---|---|---|
| CVD Resistant | 13 (TP) | 2 (FP) | 15 |
| CVD Susceptible | 3 (FN) | 60 (TN) | 63 |
| Total | 16 | 62 | 78 |
| Metric | Value (95% CI) | ||
| Sensitivity | 81.25% (54.35%-95.95%) | ||
| Specificity | 96.77% (88.83%-99.61%) | ||
| Positive Predictive Value | 86.67% (59.54%-98.34%) | ||
| Negative Predictive Value | 95.24% (86.71%-99.01%) | ||
| Accuracy | 93.59% (85.73%-97.89%) | ||
Receiver Operating Characteristic (ROC) analysis
The Crystal Violet Decolorization (CVD) assay is binary by design, with results classified as positive or negative based on the presence or absence of purple-stained bacilli for Mycobacterium tuberculosis detection and the retention of staining intensity for rifampicin and isoniazid resistance, as described in the study’s methodology. The assay does not incorporate an adjustable decision threshold, as the interpretation relies on a fixed criterion (presence of ≥1-2 bacilli per 100 fields for detection; >50% retention of staining for resistance). Consequently, a traditional ROC curve with multiple thresholds is not applicable. However, a simplified ROC analysis was performed using the sensitivity and specificity points from the study’s results to estimate the Area Under the Curve (AUC) for each analysis, as requested, as shown in Figure 2.
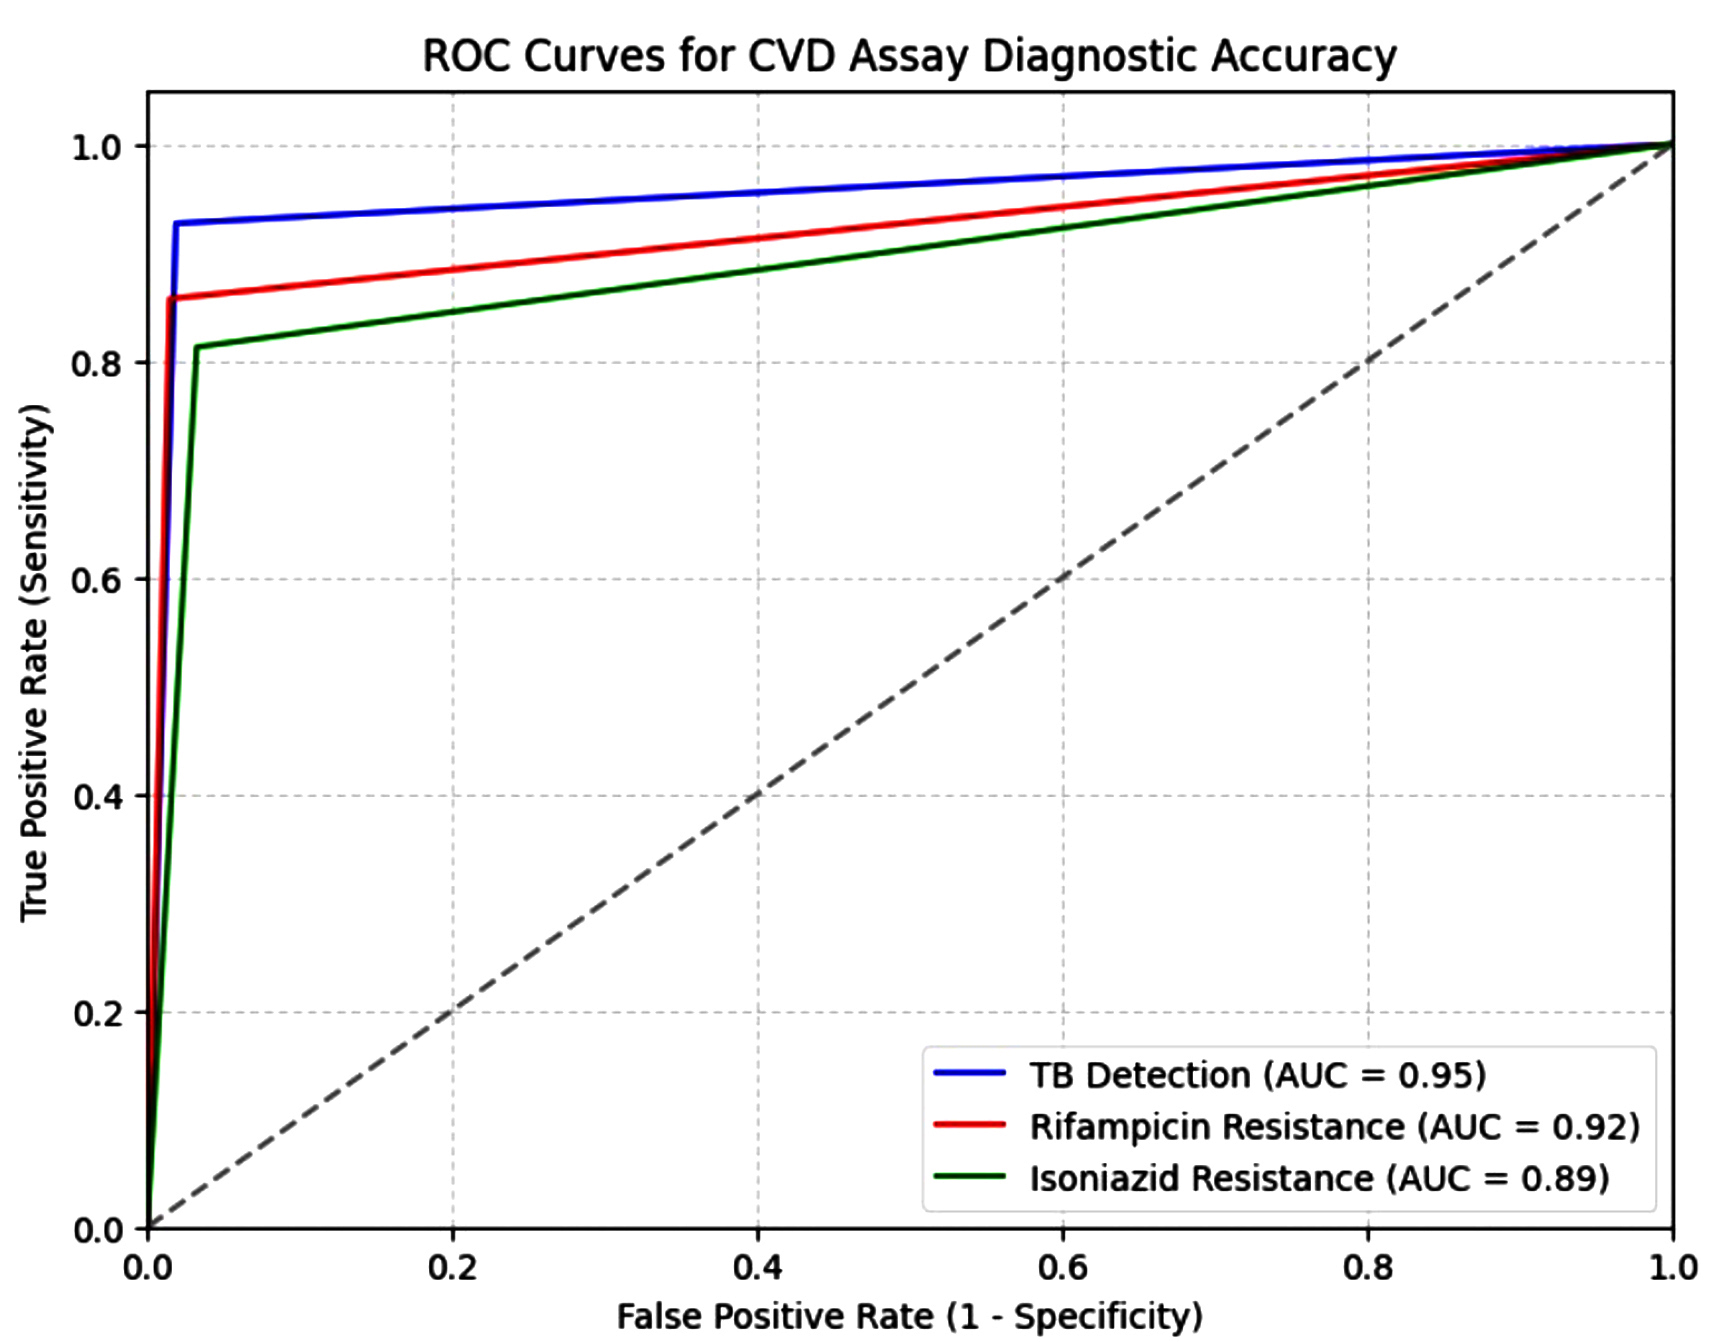
Figure 2. ROC Curves for CVD Assay Diagnostic Accuracy
ROC analysis for Mycobacterium tuberculosis detection
For M. tuberculosis detection (CVD vs. CBNAAT), the sensitivity was 92.68% (95% CI: 84.75-97.27%) and specificity was 98.13% (95% CI: 95.70-99.39%). The ROC curve was constructed using a single point (1 – specificity = 0.0187, sensitivity = 0.9268), with the AUC estimated as 0.95. The 95% CI for the AUC was approximated using the binomial CIs of sensitivity and specificity, yielding an AUC range of 0.90-0.98, reflecting high discriminatory power.
ROC analysis for rifampicin resistance
For rifampicin resistance detection (CVD vs. CBNAAT), the sensitivity was 85.71% (95% CI: 57.19-98.22%) and specificity was 98.53% (95% CI: 92.08-99.96%).3 The ROC point (1 – specificity = 0.0147, sensitivity = 0.8571) yielded an AUC of 0.92, with an approximate 95% CI of 0.75-0.99, indicating good performance despite the smaller sample size of CBNAAT-positive cases (n = 82).
ROC analysis for isoniazid resistance
For isoniazid resistance detection (CVD vs. culture-based DST), the sensitivity was 81.25% (95% CI: 54.35-95.95%) and specificity was 96.77% (95% CI: 88.83-99.61%).3 The ROC point (1 – specificity = 0.0323, sensitivity = 0.8125) resulted in an AUC of 0.89, with an approximate 95% CI of 0.72-0.97, suggesting slightly lower discriminatory ability compared to rifampicin resistance, likely due to challenges in interpreting isoniazid-related staining changes.
Feasibility in rural settings
The CVD assay demonstrated operational feasibility in rural PHCs. The average turnaround time was 2.5 ± 0.4 hours for M. tuberculosis detection and 26.5 ± 1.2 hours for drug resistance testing (including 24-hour incubation with antibiotics). In contrast, ZN staining required 3.5 ± 0.6 hours, CBNAAT 2.0 ± 0.3 hours, and culture 4-6 weeks. The estimated cost per CVD assay was INR 150 (USD 1.80), covering reagents and microscopy, compared to INR 2000 (USD 24) for CBNAAT and INR 2500 (USD 30) for culture-based DST. The CVD assay was performed using standard light microscopes available at PHCs, requiring minimal training (2-day workshop for technicians). No major equipment failures or reagent shortages were reported, indicating robustness in resource-limited settings.
Contribution to TB control strategies
The CVD assay’s high sensitivity (92.68%) and specificity (98.13%) for M. tuberculosis detection, combined with its ability to detect rifampicin (85.71% sensitivity) and isoniazid (81.25% sensitivity) resistance, suggest its potential as a cost-effective diagnostic tool for rural settings. Its low cost and rapid turnaround time for TB detection align with the goals of India’s National Strategic Plan for Tuberculosis Elimination (2020-2025), particularly for enhancing early diagnosis in underserved areas.
The present study evaluated the diagnostic performance and feasibility of the Crystal Violet Decolorization (CVD) assay for detecting Mycobacterium tuberculosis and rifampicin and isoniazid resistance in 350 sputum samples from rural Dadra and Nagar Haveli, India, from January 2024 to January 2025. The findings demonstrate that the CVD assay is a highly sensitive (92.68%) and specific (98.13%) method for M. tuberculosis detection compared to CBNAAT, with performance comparable to Ziehl-Neelsen (ZN) staining (sensitivity 89.02%, specificity 97.76%). For drug resistance, the CVD assay showed good sensitivity for rifampicin (85.71%) and isoniazid (81.25%) resistance detection, with specificities of 98.53% and 96.77%, respectively. These results, combined with the assay’s low cost (INR 150 per test) and rapid turnaround time (2.5 hours for TB detection), highlight its potential as a viable diagnostic tool in resource-limited rural settings, aligning with the aims of enhancing TB diagnosis and supporting India’s National Strategic Plan for Tuberculosis Elimination.16
The CVD assay’s high sensitivity and specificity for M. tuberculosis detection are consistent with prior studies. Farnia et al. reported a sensitivity of 90% and specificity of 96% for the CVD assay in a controlled laboratory setting.10 The slightly higher sensitivity in our study (92.68%) may be attributed to optimized staining protocols and rigorous quality control measures, such as blinded re-testing of 10% of samples. Compared to ZN staining, the CVD assay’s marginally better performance (p = 0.29 for sensitivity, p = 0.75 for specificity) suggests it could serve as an alternative microscopy-based method, particularly in settings where ZN staining is the primary diagnostic tool.4 The strong agreement between CVD and ZN staining (Cohen’s kappa = 0.89) further supports its reliability, as both methods leverage the acid-fast properties of mycobacteria, but the CVD assay’s simpler staining procedure may reduce technician training time.17
The detection of rifampicin and isoniazid resistance using the CVD assay, though less sensitive (85.71% and 81.25%, respectively) than for TB detection, represents a significant advancement for rural diagnostics. CBNAAT, the reference standard for rifampicin resistance, is highly accurate but costly and equipment-dependent, limiting its use in rural PHCs.6,7 Culture-based DST, while the gold standard for isoniazid resistance, is impractical in remote areas due to its 4-6-week turnaround time.5 The CVD assay’s ability to detect resistance within 26.5 hours, including a 24-hour incubation with antibiotics, offers a practical alternative. Mohammadi et al. reported similar findings, with the CVD assay achieving 80%-85% sensitivity for drug resistance detection in a smaller cohort.11 The lower sensitivity for isoniazid resistance in our study may reflect challenges in interpreting staining patterns after antibiotic exposure, which could be improved through standardized protocols or automated image analysis.18
The operational feasibility of the CVD assay in rural Dadra and Nagar Haveli is a key strength. The assay’s low cost (INR 150 vs. INR 2000 for CBNAAT) and compatibility with standard light microscopes make it accessible for PHCs with limited resources. The 2.5-hour turnaround time for TB detection is comparable to CBNAAT (2 hours) and faster than ZN staining (3.5 hours), enabling same-day diagnosis and treatment initiation, a critical factor in reducing TB transmission.19 The assay’s robustness was evident in the absence of equipment failures or reagent shortages, and the minimal training required (2-day workshop) aligns with the needs of rural healthcare systems.20 These findings support the WHO’s End TB Strategy, which emphasizes affordable and accessible diagnostics for high-burden settings.21
Despite its strengths, the study has limitations. The focus on rural Dadra and Nagar Haveli may limit generalizability to urban or higher-prevalence settings, where patient demographics and TB epidemiology differ.22 The CVD assay’s performance for detecting non-tuberculous mycobacteria was not evaluated due to resource constraints, potentially overestimating specificity if such organisms were present.22 The 24-hour incubation required for drug resistance testing reduces the assay’s speed compared to CBNAAT, though it remains faster than culture.5 Additionally, the reliance on manual microscopy introduces subjectivity, which could be mitigated by integrating digital microscopy or artificial intelligence-based image analysis in future studies.23
The study’s findings have significant implications for TB control in India and other high-burden countries. The CVD assay’s cost-effectiveness and feasibility make it a promising tool for decentralizing TB diagnostics, aligning with India’s goal of achieving universal access to TB care by 2025.15 By enabling rapid diagnosis and resistance screening at PHCs, the assay could reduce diagnostic delays, improve treatment outcomes, and curb the spread of MDR-TB.24 Future research should focus on validating the CVD assay in diverse settings, optimizing drug resistance protocols, and exploring its integration with digital health platforms to enhance scalability.25
Turnaround time and cost measurement
Turnaround time measurement
Turnaround time (TAT) was defined as the duration from sample receipt at the laboratory to the reporting of results to the clinician or study coordinator. This metric was chosen to reflect the practical efficiency of the assay in a rural primary health center (PHC) setting, excluding pre-laboratory steps such as sample collection and transportation, which can vary based on logistical factors. TAT was recorded for each sample using laboratory timestamps logged in a secure database.
- For drug resistance Testing (CVD Assay): Average TAT was 26.5 ± 1.2 hours, incorporating the 24-hour incubation with antibiotics (rifampicin or isoniazid) prior to staining, plus the detection steps above.
- Comparators:
- CBNAAT (GeneXpert MTB/RIF): 2.0 ± 0.3 hours (automated processing).
- Culture-Based DST: 4-6 weeks (due to growth requirements).
TAT was calculated as the mean ± standard deviation across all 350 samples, with variations attributed to batch size and technician workload.26
Comparator costs
- CBNAAT: INR 2,000 per test (cartridge cost ~INR 1,500; equipment amortization ~INR 300; labor ~INR 200).
- Culture-Based DST: INR 2,500 per test (media and reagents ~INR 1,000; labor for extended monitoring ~INR 1,000; equipment ~INR 500).
Limitations
This study has several limitations. First, it was conducted solely in rural Dadra and Nagar Haveli, a region with low tuberculosis (TB) prevalence and specific socioeconomic conditions, potentially limiting generalizability to urban areas or regions with higher TB or non-tuberculous mycobacteria (NTM) prevalence, where epidemiological patterns differ. Second, potential selection bias may have arisen from recruiting only symptomatic patients presenting to primary health centers (PHCs), possibly excluding early or atypical TB cases and affecting the representativeness of the sample. Third, the Crystal Violet Decolorization (CVD) assay’s reliance on manual microscopy introduces reader subjectivity, which may lead to variability in interpreting staining patterns, particularly for drug resistance testing. This could be addressed in future studies by adopting digital microscopy or automated image analysis to enhance consistency. Fourth, the absence of an external validation cohort limits the robustness of the findings, as the assay’s performance was not tested in diverse settings or populations. Fifth, the CVD assay’s potential cross-reactivity with NTM, which share acid-fast properties with Mycobacterium tuberculosis complex (MTBC), was not evaluated due to the absence of NTM-positive samples, confirmed by CBNAAT and culture. This may overestimate specificity in settings with higher NTM prevalence and highlights the assay’s inability to differentiate MTBC from common regional NTM (e.g., M. avium, M. fortuitum) without additional speciation, such as molecular probes or mass spectrometry. Sixth, the 24-hour incubation required for rifampicin and isoniazid resistance testing delays results compared to CBNAAT, potentially impacting timely treatment initiation in urgent cases. To address these limitations, future research should include prospective multicenter validation studies with prespecified analysis plans, incorporating diverse settings, NTM-spiked samples, and automated microscopy to confirm the CVD assay’s performance and generalizability.
The Crystal Violet Decolorization (CVD) assay demonstrated high diagnostic accuracy for detecting Mycobacterium tuberculosis in rural Dadra and Nagar Haveli, achieving a sensitivity of 92.68% (95% CI: 84.75–97.27%) and specificity of 98.13% (95% CI: 95.70–99.39%) compared to CBNAAT. For drug resistance, the assay showed promising performance, with sensitivities of 85.71% (95% CI: 57.19–98.22%) for rifampicin and 81.25% (95% CI: 54.35–95.95%) for isoniazid, compared to CBNAAT and culture-based DST, respectively. With a turnaround time of 2.5 hours for detection and 26.5 hours for resistance testing, and a cost of INR 150 per test, the CVD assay offers a cost-effective, microscopy-based alternative for rural settings where CBNAAT and culture are less feasible. Despite limitations, such as potential non-tuberculous mycobacteria cross-reactivity and reader subjectivity, the assay’s simplicity and affordability make it a valuable triage tool for TB control, supporting India’s National Strategic Plan for Tuberculosis Elimination. Future multicenter validation is recommended to enhance generalizability.
ACKNOWLEDGMENTS
The authors thank the Indian Council of Medical Research (ICMR) for funding this study through the Short-Term Studentship (STS) program. The authors also acknowledge the Institutional Ethics Committee and faculty of Government Medical College, Silvassa, for their guidance and laboratory support; the staff of primary health centres in Silvassa, Khanvel, and nearby villages for assistance with patient recruitment and sample collection; the laboratory technicians for their meticulous work; and the study participants for their cooperation.
CONFLICT OF INTEREST
The authors declare that there is no conflict of interest.
AUTHORS’ CONTRIBUTION
All authors listed have made a substantial, direct and intellectual contribution to the work, and approved it for publication.
FUNDING
None.
DATA AVAILABILITY
All datasets generated or analyzed during this study are included in the manuscript.
ETHICS STATEMENT
This study was approved by the Institutional Ethics Committee, Government Medical College, Silvassa (DMHS/IEC/2016/214/2521).
INFORMED CONSENT
Written informed consent was obtained from the participants before enrolling in the study.
- World Health Organization. Global Tuberculosis Report 2023. Geneva: WHO; 2024. https://www.who.int/teams/global-tuberculosis-programme/tb-reports/global-tuberculosis-report-2023
- Central TB Division. India TB Report 2023. New Delhi: Ministry of Health and Family Welfare, Government of India; 2023. https://tbcindia.mohfw.gov.in/2023/06/06/india-tb-report-2023/
- District Health Office, Dadra and Nagar Haveli. Annual Health Report 2022–2023. Silvassa: Government of India; 2023.
- Steingart KR, Henry M, Ng V, et al. Sputum processing methods to improve the sensitivity of smear microscopy for tuberculosis: a systematic review. Lancet Infect Dis. 2014;14(10):941-951.
Crossref - Drobniewski F, Nikolayevskyy V, Balabanova Y, et al. The role of culture in tuberculosis diagnosis and management. Eur Respir J. 2015;46(6):1517-1520.
Crossref - Boehme CC, Nabeta P, Hillemann D, et al. Rapid molecular detection of tuberculosis and rifampin resistance. N Engl J Med. 2010;363(11):1005-1015.
Crossref - Sachdeva KS, Raizada N, Sreenivas A, et al. Scaling up CBNAAT for TB diagnosis in India: challenges and opportunities. Indian J Med Res. 2015;142(4):399-406.
Crossref - World Health Organization. Multidrug-resistant tuberculosis (MDR-TB): 2023 update. Geneva: WHO; 2023. https://www.who.int/publications/i/item/WHO-UCN-TB-2023.2
- Lawn SD, Nicol MP. Xpert® MTB/RIF assay: development, evaluation, and implementation of a new rapid molecular diagnostic for tuberculosis and rifampicin resistance. Future Microbiol. 2011;6(9):1067-1082.
Crossref - Farnia P, Masjedi MR, Mirsaeidi M, et al. Crystal violet decolorization assay for rapid detection of Mycobacterium tuberculosis in sputum. J Clin Microbiol. 2010;48(9):3057-3060.
Crossref - Mohammadi S, Farnia P, Velayati AA. Adaptation of crystal violet assay for detection of drug-resistant Mycobacterium tuberculosis. Tuberculosis (Edinb). 2013;93(5):535-539.
Crossref - Desikan P, Chauhan DS, Sharma P, et al. Diagnostic accuracy of alternative microscopy-based assays for tuberculosis: a meta-analysis. Int J Mycobacteriol. 2017;6(3):217-224.
Crossref - Census of India. Dadra and Nagar Haveli: Population and Demography. New Delhi: Government of India; 2021. https://censusindia.gov.in/census.website/data/census-tables
- Bhargava A, Benedetti A, Oxlade O, et al. Nutritional status of adult patients with pulmonary tuberculosis in rural India. PLoS One. 2011;6(10):e26067.
Crossref - Revised National Tuberculosis Control Programme. National Strategic Plan for Tuberculosis Elimination 2020-2025. New Delhi: Ministry of Health and Family Welfare, Government of India; 2023. https://tbcindia.gov.in/index1.php?lang=1&level=1&sublinkid=4800&lid=3176
- World Health Organization. The End TB Strategy. Geneva: WHO; 2015. https://www.who.int/publications/i/item/WHO-HTM-TB-2015.19
- Siddiqi SH, Rüsch-Gerdes S. MGIT Procedure Manual for BACTEC MGIT 960 TB System. Geneva: FIND; 2016. https://www.finddx.org/wp-content/uploads/2016/02/mgit_manual_nov2006.pdf
- Alcaide F, Amlerová J, Bou G, et al. Advances in rapid diagnostics for tuberculosis: from microscopy to molecular methods. Clin Microbiol Rev. 2018;31(4):e00032-18.
Crossref - Uplekar M, Weil D, Lonnroth K, et al. WHO’s new End TB Strategy. Lancet. 2015;385(9979):1799-1801.
Crossref - Pai M, Furin J. Tuberculosis diagnosis in resource-limited settings: challenges and opportunities. Nat Rev Microbiol. 2016;14(12):749-761.
Crossref - Griffith DE, Aksamit T, Brown-Elliott BA, et al. An official ATS/IDSA statement: diagnosis, treatment, and prevention of nontuberculous mycobacterial diseases. Am J Respir Crit Care Med. 2007;175(4):367-416.
Crossref - Menon S, Koura KG. Artificial intelligence for tuberculosis control: a scoping review of applications in public health. J Glob Health. 2025;15:04192.
Crossref - Dheda K, Gumbo T, Maartens G, et al. Global control of tuberculosis: from extensively drug-resistant to untreatable tuberculosis. Lancet Respir Med. 2017;5(4):321-338.
Crossref - Denkinger CM, Kik SV, Cirillo DM, et al. Defining the needs for next-generation assays for tuberculosis.
J Infect Dis. 2020;221(Suppl 1):S93-S100.
Crossref - Nathavitharana RR, Cudahy PGT, Schumacher SG, et al. Accuracy of line probe assays for the diagnosis of drug-resistant tuberculosis. Eur Respir J. 2017;49(3):1601075.
Crossref - Carandang THDC, Cunanan DJ, Co GS, et al. Diagnostic accuracy of nanopore sequencing for detecting Mycobacterium tuberculosis and drug-resistant strains: a systematic review and meta-analysis. Sci Rep. 2025;15:11626.
Crossref
© The Author(s) 2025. Open Access. This article is distributed under the terms of the Creative Commons Attribution 4.0 International License which permits unrestricted use, sharing, distribution, and reproduction in any medium, provided you give appropriate credit to the original author(s) and the source, provide a link to the Creative Commons license, and indicate if changes were made.